Article

Pricing and Carbon-Emission-Reduction Decisions under the BOPS Mode with Low-Carbon Preference from Customers

School of Business, Macau University of Science and Technology, Macau 999078, China
*
Author to whom correspondence should be addressed.
Mathematics 2023, 11(12), 2736; https://doi.org/10.3390/math11122736
Submission received: 28 May 2023 / Revised: 10 June 2023 / Accepted: 15 June 2023 / Published: 16 June 2023
(This article belongs to the Special Issue Modeling, Simulation and Optimization of Supply Chains)

Abstract

:
The need to mitigate the impacts of climate change has been a worldwide consensus. Cap and trade regulations have been introduced to make the world achieve carbon peaks and neutrality. There are also growing concerns regarding low carbon management. Considering both cap and trade regulations and low-carbon preferences from customers, this study focuses on reducing carbon emissions and pricing decisions in the dual-channel supply chain based on game theory. Furthermore, it analyzes the effects of low-carbon preference (LCP) on emission-reduction efforts and the profits of supply chain members. Finally, it investigates the impact of promoting low-carbon products on optimal decisions and profits. The results conclude that (1) the growth of customers’ LCP level motivates the manufacturer to have more investment in emission reduction with the BOPS unit compensation or full-sales transfer mode; (2) the increase in customers’ LCP level would benefit the supply chain members; (3) the joint emission-reduction strategy can strengthen the positive impact of LCP level on the manufacturer’s emission-reduction effort and the profits supply chain members; and (4) the joint emission-reduction strategy is preferable for the supply chain members compared to the single emission-reduction strategy. However, the joint emission strategy is not always better than the single emission strategy with respect to the selling price. Finally, it provides managerial implications for decision-makers and potential issues for future research.

1. Introduction

Mitigating the impacts of climate change has been a worldwide consensus [1]. Over the past 200 years, the global temperature has risen 1.1 °C, and the emission levels keep rising. Net zero commitment has been backed by the United Nations, rallying all members (companies, cities, regions, institutions) to take transparent and immediate actions to reduce global emissions by 45% and achieve a fairer zero world by 2050, which is in line with the Paris Agreement [2]. To reach this ambitious goal, multiple government regulations have been proposed to reduce carbon emissions, such as carbon tax and carbon labeling [3,4]. The Cap and Trade (CAT) policy, used mainly across countries, is designed to reduce greenhouse gas emissions. The government sets the cap to limit companies emitting carbon dioxide within a given allowance. Trade allows firms to exchange their credits in a market when short or in surplus [5].
In addition to government regulations, green customers are the key to mitigating environmental degradation and nonrenewable depletion. End-customer demand is the tipping point that motivates the supply chain to take responsibility for environmental protection [6]. According to [7], a green consumption attitude affects purchasing intention, positively influencing purchasing behavior. More corporations take environmental protection as their social responsibility, stimulating green consumption [8]. The growing green consciousness increases market competition for green products. It is reported that 30% of customers would like to pay a higher price for green products and energy. In addition, Law, Hills and Hau stated that people with environmental consciousness could more easily present the character of loyalty and commitment. Firms that adopt green promotions strengthen customers’ trust and loyalty by portraying their image of sustainable development [9].
Rising competition in retailing forces retailers to seek an enriched shopping experience to gain and retain customers. Omnichannel fulfillment services such as Buy Online Pick-up in-Store (BOPS) blend online and offline experiences to provide more accessibility and flexibility for shoppers [10,11]. Customers can complete purchases at home and collect them at the selected pickup location [12,13]. They experience the convenience of shopping online without lengthy wait times and the sting of shipping. Returns or exchanges can also be processed on the same visit if the item does not fit customers’ expectations. This can also reduce carbon emissions from the transportation procedure [14,15]. Moreover, BOPS increases foot traffic to physical stores, giving retailers opportunities for cross-selling and upselling [16]. A survey by the International Council of Shopping Centers (2019) showed that over half of the online shoppers use BOPS services, and 67% make additional in-store purchases. Hence, it is worthy of further study.
To our best knowledge, this study is the first attempt to investigate how customers’ environmental awareness and retailers’ low-carbon promotion affect the manufacturer’s emission-reduction decision and the profits of supply chain members by adopting the BOPS strategy under the single or the joint emission-reduction strategy.
To deal with the above issues, this study establishes a game model to study a two-echelon supply chain including a leading manufacturer and a following retailer, in which the optimal manufacturer’s emission-reduction effort, the optimal wholesale price, the optimal retailer’s selling price, the optimal low-carbon promotion level and the optimal profits of supply chain members will be derived from the game model.
The contributions of this work are new and interesting. Firstly, there is still little work using BOPS modes and the joint emission-reduction strategy to analyze the manufacturer’s emission-reduction effort and pricing decisions. Secondly, it concludes that the customers’ low-carbon preference (LCP) level positively affects the manufacturer’s emission-reduction effort and the profits of supply chain members, which enriches the research of LCP in the field of BOPS. Furthermore, the joint emission strategy can enlarge the positive impacts of LCP level, and it is preferable for the supply chain members compared to the single emission-reduction strategy, which extends the related conclusion in the field of a dual-channel low-carbon supply chain (LCSC). In addition, it is surprising that the joint emission strategy is not always better than the single emission strategy with respect to the selling price.
The rest of the paper is structured as follows: Section 2 reviews and analyzes some key related literature. Problem descriptions, assumptions, and notations are presented in Section 3. Section 4 provides model formulations and analysis, which is followed by numerical analysis in Section 5. Concluding remarks and future issues are demonstrated in Section 6. An appendix about proofs of all the technical results is provided in the final pages (Appendix A).

2. Literature Review

The literature concerning this topic can be sorted out into two categories. The first category focuses on primary streams of BOPS. The other deals with various aspects of the LCSC with the CAT regulations.

2.1. BOPS Research

Due to the growing popularity of BOPS, its economic significance has drawn continuous attention. Ref. [17] researched the BOPS’s cross-channel selling and channel-shift effects. They found that additional offline sales happen when customers buy online and pick up in-store. Furthermore, BOPS shifts customers from online platforms to brick-and-mortar channels. Ref. [18] studied the impact of cross-selling benefits, fixed cost of BOPS, heterogeneous customer behavior, BOPS convenience, operation cost and competitive intensity on the optimal profit. The impacts on quality, prices, and profits of a supply chain have been studied by Ref. [19].
Channel strategy is discussed in a competitive environment to explore whether introducing BOPS into dual-channel retailing is always profitable. Ref. [20] studied the price competition between leaders and followers in various scenarios from the perspective of channel integration to examine the implementation conditions for BOPS and the effects of market factors (product return) on two retailers’ profitability. Ref. [21] found that adopting BOPS and its price and service strategies depend on the experience sensitivity and the proportion of BOPS customers. Ref. [22] derived the optimal channel strategy (in which retailers can benefit from BOPS adoption) for single brick-and-mortar and double online and offline channels. Overserving the performance of service and profit, Ref. [23] found that a contract wherein a lump fee is paid from retailers to manufacturers coordinates the supply chain better than a revenue-sharing contract.
After adopting BOPS, the operation strategies are analyzed in many papers. Ref. [24] built an analytical model to investigate the relationship between store visiting costs and BOPS’ profit. Ref. [25] investigated the effects of the power structures (between retailers and manufacturers) on the optimal price and service decisions. With the information on customer behavior, hassle, and delivery costs, optimal store inventory is analyzed for retailers [26]. Other optimal decisions, including sales price, ordering quantity, service decisions, delivery schedule, cooperative advertising, and base-stock level in different inventory policy scenarios, are also discussed by various researchers [27,28,29,30,31,32].
Additionally, environmental protection performance has drawn some attention from a few scholars. Ref. [33] pointed out that BOPS reduces energy consumption by integrating online and store inventory and decreasing transshipment costs (i.e., lighting, packing, shipping). Ref. [34] studied sustainable retailing concerning the overpackaging problem, finding that BOPS has decreased environmental impacts. As BOPS increases the LCSC’s profit and reduces energy consumption, Ref. [35] designed a contract to incorporate BOPS into a low-carbon dual-channel supply chain, considering customers’ low-carbon preference (LCP). Hence, based on a low-carbon dual-channel supply chain adopting BOPS, this work derives optimal carbon-emission-reduction strategies from CAT regulations, considering customers’ green consciousness.
The above four streams of BOPS literature center primarily around its economic performance and operations. The existing literature rarely considers BOPS’s environmental benefits, with no mention of the channel integration and optimal strategies of LCSC with the BOPS channel in different scenarios. Based on an LCSC wherein customers can buy online and pick up in-store, this research analyzes the carbon-emission-reduction strategies with customers’ preference for low carbon under the CAT policy.

2.2. Low-Carbon Supply Chain under CAT Regulations

Several scholars focused on the channel strategy (single channel or dual channel) in an LCSC under CAT regulations. Ref. [36] took carbon trading into account. They conducted corresponding game models to compare manufacturers’ decision behaviors in dual channels, respectively. The impact of channel selections on carbon emission has also been explored. Ref. [37] derived the optimal channel strategy under the CAT regulation and stochastic demand pattern, considering customers’ low-carbon preferences. They also proved that buyback and task-sharing-reduction contracts could coordinate supply chain members in decentralized dual channels.
The prevalent issues of coordination mechanisms between retailers and manufacturers are also analyzed under the CAT policy. Ref. [38] studied dual-channel coordination and decision behaviors with the aspects of LCP and channel substitution. They found that low-carbon choice positively impacts the supply chain profit, and an improved revenue-sharing contract leads to Pareto improvement. Ref. [39] combined optimal emission abatement and production decisions and investigated a make-to-order supply chain coordinated by wholesale and cost-sharing contracts. A lump-sum-subsidy contract has been designed that achieves Pareto’s improvement of the efficiency between the two firms.
Various operation strategies of the LCSC are derived from CAT regulations. Ref. [40] studied the effects of carbon footprint and customers’ LCP on production strategy and profits under a CAT system. Decision behaviors in a two-echelon supply chain, including sustainability investment and selling price, are investigated in Ref. [39]. Additionally, it also revealed that trading prices affected optimal decisions. The impacts on a dual-channel supply chain’s profit were explored by Ref. [41] from emission abatement cost coefficient variables and low-carbon advertising effort strategies.
Optimal emission-reduction decision making is a primary focus among researchers considering different impact factors. Ref. [42] explored the influence of social preferences, customers, and low-carbon awareness on emission reduction, promotion, pricing decisions, supply chain profits, utilities, and system efficiency. They developed a contract to make the supply chain Pareto-optimal based on side payments, considering the social preferences’ effect. Ref. [43] conducted a game model in the cases of retailer dominance and power balance, respectively, to study the impacts of two joint carbon reduction contracts (wholesale price premium contract and the cost-sharing contract) on the firms’ profits and carbon reduction rate. Ref. [44] investigated remanufacturing’s impact on carbon-emission reduction and supply chain profits and identified an optimal collecting mode for the producer. Ref. [45] compared the optimal equilibrium strategies, including emission-reduction level, advertising effort, and selling price between retail and dual channel. They discussed the impacts of cooperative advertising and cost-sharing contracts on optimal decisions and dual-channel supply chain coordination. Ref. [5] examined the impact of CAT policy intensity and LCP on carbon-emission-reduction decisions and firms’ profits. Ref. [46] focused on the emission-reduction decisions under the retail and dual channels, respectively, considering low-carbon awareness. Furthermore, they studied the effects of CAT regulation on the firms’ profit and joint emission-reduction strategy on both carbon-emission-reduction behaviors and supply chain performance.
After discussing the related literature, the low-carbon customer preference and joint emission-reduction strategy are significant in the field of LCSCs. LCP is discussed by Refs. [5,42,46] to explore its impacts on emission reduction and supply chain profits. A joint emission-reduction strategy includes the carbon-emission-reduction behaviors of the manufacturer and low-carbon product advertising efforts of the retailer, which are widely used by Ref. [45]. Refs. [41,45] analyzed the effect of a retailer’s advertising campaign on emission reduction and profits. Ref. [46] compared joint and single emission-reduction strategies’ performance. Taking advantage of previous studies, this study focuses on carbon-emission-reduction decisions with the impact of LCP under CAT regulations. It investigates the benefits of a low-carbon product advertising strategy.
Although various issues in the LCSC with retail/dual channels under CAT regulations are developed soundly and widely, more environment-related discussion in BOPS has not been made. Above all, channel integration and operations are the heated topics in the BOPS and LCSC literature, respectively. Ref. [35] designed a supply contract to improve the performance of an LCSC with the BOPS channel.
This study contributes to the existing research by introducing the one form of omni-retailing channel, BOPS, into the LCSC. It also enriches BOPS literature gaps on the decisions for reducing carbon emissions and pricing under the single or the joint emission-reduction strategy in the field of an LCSC.
Table 1 compares the existing key related literature with this study and highlights its innovation and contribution.

3. Problem Description and Assumption

3.1. Problem Description

The manufacturer is located in an area conducting the CAT regulations, where the manufacturer has some specific carbon quotas and limits the carbon emission during production. If it improves the technology and emits less carbon than the given cap, the emission quotas can be sold in the carbon trading market to gain profit and vice versa. Furthermore, it will attract more customers with higher environmental consciousness.
The manufacturer can determine the reduction level of carbon emission, weighing technology investment cost, low-carbon regulations, and market preference. The manufacturer sells its product from the direct online and offline retail channel. Therefore, a two-echelon supply chain composed of the leading manufacturer and the following retailer is established. The retailers can choose whether to promote their products and the effort level of promotion. With promotion efforts, single and joint strategies for emission reduction are discussed separately.
Customers can visit e-commerce platforms, buy online and pick up in brick-and-mortar stores (see Figure 1). Considering the extra cost of offering service for BOPS-channel customers by retailers, two common strategies of BOPS including unit compensation and BOPS full-sales transfer are adopted to compensate retailers.
Therefore, the following decision issues are involved: (1) the manufacturer’s optimal wholesale prices and reducing emission effort, (2) the retailer’s optimal selling price and promotion level according to the wholesale price and emission-reduction level offered by the manufacturer, (3) the influence of low-carbon preference (LCP) on manufacture’s emission-reduction level, (4) the effect of LCP on supply chain members’ profits, (5) whether retailer’s low-carbon product promotion can stimulate manufacturer’s reducing emission level, and (6) whether a retailer’s low-carbon product promotion can improve the supply chain profit. The technical route can be seen in Figure 2.

3.2. Notation

Before the formulation of the model, some notation is defined in Table 2. Parameters are dimensionless, and all coefficients range between 0 and 1 except for the cost coefficients k and ϕ , which are both no less than 1. To simplify calculations, the potential market demand a for the offline and the online channels is equal [47,48].

3.3. Assumptions

Assumption 1. Offline retailers offer customers the same promotion service level as BOPS channels and brick-and-mortar stores [35].
Assumption 2. The promotion service effort has the same impact on BOPS and offline customers [35].
Assumption 3. Direct sale channels and retail channels adopt the same selling price to avoid free-riding and channel crossing [35,49,50,51].
Assumption 4. Customers have environmental consciousness and can notice the carbon-emission-reduction level of products when purchasing [42].
Assumption 5. The extra cost of employing low-carbon technologies is a quadratic function of the emission-reduction level. Parameter k can be regarded as the cost coefficient of emission reduction, which is significantly large as the cost of emission reduction is assumed to be a lumpsum investment [52,53].
C ( e ) = k e 2 / 2
Assumption 6. The cost for low-carbon promotion is a quadratic function of promotion effort level 1 k [46]:
C ( s ) = ϕ s 2 / 2

4. Model Formulation and Analysis

Equilibrium solutions are derived in four scenarios: single and joint emission-reduction strategies under either BOPS unit compensation or full-scale transfer modes. The impacts of customers’ low-carbon preference level on reducing emission effort and profits are also analyzed. Finally, the emission-reduction level and profits between single and joint emission-reduction strategies are compared to investigate whether adopting a retailer’s low-carbon promotion effort is effective.

4.1. Demand Function

According to [21,35,46], the joint emission-reduction model (retailers promote low-carbon products) is formulated as follows.
D r s = a λ 0 p + η e + m s
D o s = x a λ 0 p + η e
D p s = 1 x a λ 0 p + η e + m s
(1 − x) of online customers pick up products in brick-and-mortar stores, which is a behavior that is influenced by offline retailer’s promotion efforts. According to Assumptions 1 and 2, promotion impacts offline and BOPS channel customers equally, whereas the direct e-commerce channel avoids the influence of the store’s promotion.
The demand function of the single emission-reduction strategy (manufacturer’s emission abatement effort only) follows:
D r d = a λ 0 p + η e
D o d = x a λ 0 p + η e
D p d = 1 x a λ 0 p + η e
Retailers do not conduct promotion services, which does not impact demand enlargement. According to Assumption 4, the more effort there is in emission reduction, the more sales happen by green consciousness customers.

4.2. Model Analysis under BOPS Unit Compensation

BOPS unit compensation offers retailers a unit price for a single customer [48]. In practice, manufacturers will compensate retailers adopting BOPS to pay for their BOPS service cost and improve the serving performance. Solutions under single and joint emission-reduction strategies are derived separately.

4.2.1. BOPS Unit Compensation with Single Emission Reduction

Based on [46,47], the profit functions are established.
π m 0 l d = w D r + p D o + D p b D p e 0 e D r + D o + D p E p e k e 2 / 2
π r 0 l d = ( p w ) D r + b D p
π s c 0 l d = p D r + D o + D p e 0 e D r + D o + D p E p e k e 2 / 2
Lemma 1. 
The manufacturer firstly determines  e l d and  w l d ; then, the retailer decides  p l d . When k > 9 η + λ 0 p e 2 / 8 λ 0 , the equilibrium solutions ( e l d , w l d , p l d ) are below.
e l d = 4 a 9 e 0 λ 0 p e ( η + λ 0 p e ) 8 λ 0 k 9 η + λ 0 p e 2 w l d = a ( η λ 0 p e ) 2 9 η e 0 λ 0 p e η + λ 0 p e 4 a λ 0 2 p e 2 + 6 a k λ 0 2 p e 8 k λ 0 2 9 λ 0 η + λ 0 p e 2 + b p l d = 2 a η 2 8 η a λ 0 p e + 4 a k λ 0 6 a λ 0 p e 2 9 e 0 η 2 λ 0 p e 9 e 0 η λ 0 p e 2 + 3 e 0 k λ 0 p e λ 0 ( 8 λ 0 k 9 η + λ 0 p e 2 )
By substituting equilibrium solutions into (1) and (2), the optimal profits are
π m l d = E p e + a b x + 2 a 2 η + λ 0 p e 2 8 a e 0 λ 0 2 k p e + 9 k e 0 2 λ 0 3 p e 2 2 λ 0 8 λ 0 k 9 η + λ 0 p e 2
π r l d = 4 a λ 0 k 3 a η + λ 0 p e 2 3 e 0 k λ 0 2 p e 2 λ 0 8 λ 0 k 9 η + λ 0 p e 2 2 a b x
Lemma 1 implies that an enterprise has a relatively high investment cost in technology for reducing carbon emission, and it can execute the above equilibrium solutions when the investment cost in technology achieves some threshold.
Next, we analyze the effects of customers’ LCP level on the manufacturer’s emission-reduction effort and optimal profits in Proposition 1.
Proposition 1. 
When  4 a 9 e 0 λ 0 p e > 0   a n d   k > m a x 9 η + λ 0 p e 2 8 λ 0 , 3 a 4 a λ 0 3 e 0 λ 0 2 p e η + λ 0 p e 2 , we have  e l d η > 0 ,   π m l d η > 0 ,   π r l d η > 0 , and  π s c l d η > 0 .
Proposition 1 indicates that the manufacturer’s emission-reduction level and profits of supply chain members are all positively related to the customers’ LCP level when the manufacturer’s investment in emission reduction arrives a given point. Furthermore, it implies that raising customers’ LCP can benefit all the LCSC members.

4.2.2. BOPS Unit Compensation with Joint Emission Reduction

Apart from the manufacturer’s effort on carbon-emission reduction, retailers promote low-carbon products simultaneously. The profit functions are:
π m 0 l s = w D r + p D o + D p b D p e 0 e D r + D o + D p E p e k e 2 / 2
π r 0 l s = ( p w ) D r + b D p ϕ s 2 / 2
π s c 0 l s = p D r + D o + D p e 0 e D r + D o + D p E p e k e 2 / 2 ϕ s 2 / 2
Lemma 2. 
When  2 λ 0 ϕ m 2 > 0  and
k > 3 m 2 λ 0 ϕ 2 η + λ 0 p e 2 / [ 2 λ 0 2 m 2 λ 0 ϕ 0 2 ]
then the equilibrium solutions  ( e l s , w l s , p l s , s l s )  are as follows.
e l s = C 0 λ 0 ( η + λ 0 p e ) C k k λ 3 2 η + λ 0 p e 2
w l s = C w ( λ 3 + λ 0 ϕ ) λ 0 k η + λ 0 p e η ( b + e 0 p e λ 3 2 + a ϕ m 2 λ 0 ϕ ) λ 0 λ 3 p e ( a ϕ b λ 3 ) C k k λ 3 2 η + λ 0 p e 2 p l s = C p λ 0 k ( 2 a λ 0 η ϕ 2 2 a λ 3 λ 0 ϕ p e + e 0 p e η λ 3 2 ) η + λ 0 p e C k k λ 3 2 η + λ 0 p e 2 s l s = m ( a λ 3 η + λ 0 p e 2 λ 0 k ( 2 a ( λ 0 + λ 3 ) λ 3 λ 0 e 0 p e ) ) C k k λ 3 2 η + λ 0 p e 2
where  λ 3 = m 2 3 λ 0 ϕ
C k = 2 λ 0 m 2 2 λ 0 ϕ 2
C 0 = ( λ 3 2 e 0 p e + 2 m 2 a ϕ 4 a λ 0 ϕ 2 )
C p = λ 3 m 2 + λ 0 ϕ e 0 p e 2 m 2 a ϕ + 4 a λ 0 ϕ 2
C w = λ 3 2 b + e 0 p e + 2 b λ 0 ϕ
By substituting optimal solutions into (6) and (7), the optimal profits are
π m l s = E p e + a b x + λ 0 m 2 e 0 λ 0 p e e 0 p e + 4 a ϕ 6 e 0 λ 0 ϕ p e k + 2 ϕ 2 a 2 η + λ 0 p e 2 8 a ϕ 2 e 0 λ 0 2 k p e 2 C k k λ 3 2 η + λ 0 p e 2 + λ 0 ( 9 k ϕ 2 e 0 2 λ 0 3 p e 2 ) 2 C k k λ 3 2 η + λ 0 p e 2
π r l s = a b x + ϕ m 2 + 2 λ 0 ϕ ( 2 m 2 a λ 0 m 2 e 0 λ 0 2 p e 4 a λ 0 2 ϕ + 3 e 0 λ 0 3 p e ϕ ) k a λ 3 η + λ 0 p e 2 2 2 C k k λ 3 2 η + λ 0 p e 2 2
Lemma 2 indicates that the manufacturer and the retailer can find the equilibrium solutions when the investment of the manufacturer reaches a threshold under the joint emission reduction.
Proposition 2. 
When  C 0 > 0 ,   2 λ 0 ϕ m 2 > 0  and  C k k λ 3 2 η + λ 0 p e 2 > 0 , then we have  e l s η > 0  and  π m l s η > 0 .
Proposition 2 states that the manufacturer’s emission-reduction level and profit increase as customers’ green consciousness grows when retailers promote low-carbon products, which encourages the manufacturer to make more effort toward emission reduction.

4.2.3. Joint Emission Reduction’s Impacts on Firms’ Decisions and Profit

This subsection mainly investigates whether the retailer’s low-carbon promotion can improve a manufacturer’s performance on emission-reduction levels and supply chain profits.
Proposition 3. 
C k k λ 3 2 η + λ 0 p e 2 > 0 ,   C 0 λ 0 λ 3 2 > 4 a 9 e 0 λ 0 p e > 0 ,   m 2 < 3 λ 0 ϕ 2 ,   k > η + λ 0 p e 2 ,  (1)  e l s > e l d ; (2)  e l s η > e l d η .
According to Proposition 3, the reducing emission effort level under a joint emission-reduction strategy is higher than that under a single emission-reduction strategy, which implies that the retailer’s promotion of low-carbon products can encourage the manufacturer to put more efforts on emission reduction. Furthermore, the growth of the emission-reduction effort of the manufacturer with the retailer’s low-carbon promotion is higher than that under a single emission-reduction strategy as the LCP increases. The LCSC informs more customers, and the LCP significantly affects emission reduction.
Proposition 4. 
When  C k k λ 3 2 η + λ 0 p e 2 > 0 ,  (1)  m 2 < 3 λ 0 ϕ / 2 , 4 a > 6 e 0 λ 0 p e ,  π m l s > π m l d ;  (2)  k < 4 η + λ 0 p e 2 3 a λ 0 ,  m 2 < 3 λ 0 ϕ / 2 ,  π r l s > π r l d ;  and (3)  π m l s η > π m l d η , π r l s η > π r l d η .
Proposition 4 suggests that the profits of the manufacturer, the retailer and the whole supply chain are better under a joint emission-reduction strategy when the investment from the manufacturer achieves a threshold, and the difference between the two strategies is noticeable as customers’ LCP level increases.
Hence, in the BOPS unit compensation mode, the joint emission reduction is a preferable strategy. Promoting low-carbon products improves customers’ trust in the brand and willingness to pay, bringing more benefits to the LCSC.

4.3. Model Analysis under BOPS Full-Sales Transfer

BOPS’s full-sales transfer strategy transfers all BOPS orders to offline retailers. Hence, the retailer’s profit involves the BOPS channel’s demand.

4.3.1. BOPS Full-Sales Transfer with Single Emission Reduction

Supply chain members’ profit functions are as follows.
π m 0 a d = w ( D r + D p ) + p D o e 0 e D r + D o + D p E p e k e 2 / 2
π r 0 a d = ( p w ) ( D r + D p )
π s c 0 a d = p D r + D o + D p e 0 e D r + D o + D p E p e k e 2 2
Lemma 3. 
Equilibrium solutions  e a d , w a d , p a d  are obtained if  k > 9 η + λ 0 p e 2 / 10 λ 0  holds.
e a d = 2 a + 6 a x 9 e 0 λ 0 p e ( η + λ 0 p e ) 10 λ 0 k 9 η + λ 0 p e 2
w a d = a ( 2 3 x ) ( η λ 0 p e ) 2 + ( 12 a + 18 η e 0 ) λ 0 p e η + λ 0 p e 4 a λ 0 2 p e 2 + 12 e 0 k λ 0 2 p e 20 k λ 0 2 18 λ 0 η + λ 0 p e 2 + k λ 0 2 a x + 4 a + ( 8 a 12 a x ) λ 0 2 p e 2 + 12 e 0 k λ 0 2 p e 20 k λ 0 2 18 λ 0 η + λ 0 p e 2 p a d = 6 a x η 9 η e 0 λ 0 p e η + λ 0 p e 2 k λ 0 a x + 3 k e 0 λ 0 2 p e λ 0 10 λ 0 k 9 η + λ 0 p e 2 + a η 4 η + 10 λ 0 p e + 2 k λ 0 a 6 k a λ 0 2 p e 2 λ 0 10 λ 0 k 9 η + λ 0 p e 2
By substituting optimal solutions into (11) and (12), the optimal profits are
π m a d = E p e + a 2 x 2 / 2 λ 0 ( 12 x 4 ) λ 0 k + a 2 η + λ 0 p e 2 + λ 0 k 4 a e 0 λ 0 p e + 4 a 2 x 2 a x 3 e 0 λ 0 p e 2 2 λ 0 10 λ 0 k 9 η + λ 0 p e 2
π r a d = 6 a x 8 a λ 0 k + 6 a 9 a x η + λ 0 p e 2 + 6 e 0 k λ 0 2 p e 2 2 λ 0 10 λ 0 k 9 η + λ 0 p e 2 2
Lemma 3 suggests that an enterprise has a relatively lower investment cost in technology under BOPS full-sales transfer with respect to BOPS unit compensation so as to reduce carbon emission and execute the above equilibrium solutions.
Proposition 5. 
When  6 a x + 2 a 9 e 0 λ 0 p e > 0 ,   k > m a x 9 ( η + λ 0 p e ) 2 10 λ 0 , 9 a x 6 a ( η + λ 0 p e ) 2 6 a x 8 a λ 0 + 6 e 0 λ 0 2 p e , then  e a d η > 0 ;  π m a d η > 0 ,  π r a d η > 0 ,  π s c a d η > 0 .
Similarly, under the BOPS full-sales transfer strategy, the emission-reduction effort, the profits of the manufacturer, the retailer and the supply chain increase as customers’ LCP level grows. The rising environmental consciousness enhances the advantages of the LCSC, and the supply chain members can achieve a win–win status.

4.3.2. BOPS Full-Sales Transfer with Joint Emission Reduction

With the retailer’s promotion, the profit functions of supply chain members are
π m 0 a s = w ( D r + D p ) + p D o e 0 e D r + D o + D p E p e k e 2 / 2
π r 0 a s = ( p w ) ( D r + D p ) ϕ s 2 / 2
π s c 0 a s = p D r + D o + D p e 0 e D r + D o + D p E p e k e 2 / 2 ϕ s 2 / 2
Lemma 4. 
When  k > ( η + λ 0 p e ) 2 / λ 0 , and  4 λ 0 ϕ m 2 > 0 , then  e a s , w a s , p a s , s a s  are 
e a s = C 3 ( η + λ 0 p e ) m 2 3 λ 0 ϕ 2 2 ( η + λ 0 p e ) 2 + 2 k λ 0 m 2 λ 0 ϕ 2 + k λ 0 3 ϕ 2 / 2
w a s = η + λ 0 p e ( C b η + C d ) k C a m 2 3 λ 0 ϕ 2 2 ( η + λ 0 p e ) 2 + 2 k λ 0 m 2 λ 0 ϕ 2 + k λ 0 3 ϕ 2 / 2
p a s = 2 a ϕ + a ϕ x 4 m 2 4 λ 0 ϕ
+ η + λ 0 p e 4 m 2 2 λ 0 ϕ C b η + C d k C a 2 C 3 η ϕ m 2 3 λ 0 ϕ 2 2 ( η + λ 0 p e ) 2 + 2 k λ 0 m 2 λ 0 ϕ 2 + k λ 0 3 ϕ 2 2 4 m 2 4 λ 0 ϕ
s a s = m a x 2 m a 2 m 2 2 λ 0 ϕ +
η + λ 0 p e ( ( λ 0 C b C 3 ) m η + m C d λ 0 m λ 0 k C a ) ( m 2 3 λ 0 ϕ 2 2 ( η + λ 0 p e ) 2 + 2 k λ 0 m 2 λ 0 ϕ 2 + k λ 0 3 ϕ 2 / 2 ) ( m 2 λ 0 ϕ )
where
C 3 = m 4 a x m 4 e 0 λ 0 p e 1.5 m 2 a λ 0 x ϕ m 2 a λ 0 ϕ + 3 m 2 e 0 λ 0 2 p e ϕ + 1.5 a λ 0 2 x ϕ 2 + 0.5 a λ 0 2 ϕ 2 2.25 e 0 λ 0 2 p e ϕ 2
C a = m 4 a x + m 4 e 0 λ 0 p e 3 m 2 a λ 0 ϕ x 2 5 m 2 e 0 λ 0 2 p e ϕ 2 + a λ 0 2 ϕ 2 x 4 + a λ 0 2 ϕ 2 2 + 3 e 0 λ 0 3 p e ϕ 2 / 2
C d = m 4 a p e x + 9 m 2 a λ 0 p e ϕ x 4 + m 2 a λ 0 ϕ p e 2 9 a λ 0 2 p e ϕ 2 x 8 3 a λ 0 2 p e ϕ 2 / 4
C b = m 4 e 0 p e + 3 m 2 a ϕ x 4 m 2 a ϕ 2 + 3 m 2 e 0 λ 0 p e ϕ + 3 m 2 a λ 0 ϕ 2 x 8 a λ 0 ϕ 2 4 9 e 0 λ 0 2 p e ϕ 2 / 4
By substituting optimal solutions into (16) and (17), optimal profits are
π m a s = E p e + C m s k + a 2 λ 0 ϕ 2 3 x 2 2 η + λ 0 p e 2 4 m 2 3 λ 0 ϕ 2 2 ( η + λ 0 p e ) 2 + 2 k λ 0 m 2 λ 0 ϕ 2 + k λ 0 3 ϕ 2 / 2
π r a s = ϕ λ 0 ϕ m 2 2 C r s λ 0 k a 2 m 2 3 λ 0 ϕ 3 x 2 η + λ 0 p e 2 2 . 32 m 2 3 λ 0 ϕ 2 2 ( η + λ 0 p e ) 2 + 2 k λ 0 m 2 λ 0 ϕ 2 + k λ 0 3 ϕ 2 / 2 2
where
C m s = 4 m 4 a x e 0 λ 0 p e 2 + m 2 λ 0 ϕ 8 a x + 12 e 0 λ 0 p e a x e 0 λ 0 p e + a 2 λ 0 2 ϕ 2 ( 6 x 2 + 16 x 4 ) 12 a λ 0 3 p e x ϕ 2 4 a e 0 λ 0 3 p e ϕ 2 + 9 λ 0 4 e 0 2 p e 2 ϕ 2 C r s = 4 m 2 a x 4 m 2 a + 2 m 2 e 0 λ 0 p e 3 a λ 0 ϕ x + 4 a ϕ λ 0 3 e 0 λ 0 2 p e ϕ
Lemma 4 claims that supply chain members under joint emission reduction have a similar investment cost in technology and can achieve an optimal status with BOPS full-sales transfer.
Proposition 6. 
(1) When  m 2 < λ 0 ϕ 2 , C 3 > 0 , k > ( η + λ 0 p e ) 2 λ 0 ,  e a s η > 0 ; π m a s η > 0 ;
(2) When  m 2 < λ 0 ϕ / 2 , C p s > 0 ,  k / ( η + λ 0 p e ) 2 > m a x 2 λ 0 , a 2 m 2 3 λ 0 ϕ 3 x 2 2 C r s λ 0 ,  C r s > 0 ,  then  π r a s η > 0 .
Where  C p s = 4 m 4 a x 4 m 4 e 0 λ 0 p e 6 m 2 a λ 0 x ϕ 4 m 2 a λ ϕ 0 + 12 m 2 e 0 λ 0 2 p e ϕ + 6 a λ 0 2 x ϕ 2 + 2 a λ 0 2 ϕ 2 9 e 0 λ 0 2 p e ϕ 2 .
Proposition 6 states that under BOPS full-sales transfer with a joint emission-reduction strategy, the increasing LCP can stimulate the growth of emission-reduction levels and lead to the profit increase enjoyed by the manufacturer and the retailer.

4.3.3. Impacts of Joint Emission Reduction on Firms’ Decisions and Profits

Proposition 7. 
When  k > ( η + λ 0 p e ) 2 / λ 0 , 9 C 3 m 2 3 λ 0 ϕ 2 2 > 2 a + 6 a x 9 e 0 λ 0 p e m 2 < λ 0 ϕ 2 , the we have (1)  e a s > e a d ; (2)  e a s η > e a d η .
Similar to BOPS unit compensation, the retailer’s promotion can lead to the growth of emission-reduction efforts by the manufacturer during production process. The increase rate of emission-reduction levels with LCP under a joint emission-reduction strategy is higher than that under a single emission-reduction strategy.
Proposition 8. 
When  m 2 < λ 0 ϕ 2 , k >   ( η + λ 0 p e ) 2 λ 0 , we have 
(1) 
π m a s > π m a d  if  a 2 λ 0 ϕ 2 3 x 2 2 4 m 2 3 λ 0 ϕ 2 2 > ( 12 x 4 ) λ 0 k + a 2 2 + 9 a 2 x 2 18 λ 0 > 0 , and  C m s a 2 λ 0 ϕ 2 3 x 2 2 > 4 a e 0 λ 0 p e + 4 a 2 x 2 a x 3 e 0 λ 0 p e 2 + 10 a 2 x 2 ( 12 x 4 ) λ 0 k + a 2 2 + 9 a 2 x 2 > 0;
(2) 
π r a s > π r a d  with  ϕ λ 0 ϕ m 2 32 m 2 3 λ 0 ϕ 2 2 a 2 m 2 3 λ 0 ϕ 3 x 2 2 > 6 a x 8 a λ 0 k + 6 a 9 a x η + λ 0 p e 2 + 6 e 0 k λ 0 2 p e 2 162 λ 0   6 C r s 2 m 2 + 3 λ 0 ϕ > 6 a x 8 a + 6 e 0 λ 0 p e > 0 ;
(3) 
π m a s η > π m a d η ,  π r a s η > π r l d η .
Similarly, the joint emission-reduction strategy in BOPS full-sales transfer increases the profits of retailers and manufacturers. With the growth of the customers’ LCP level, the profit difference between the two strategies becomes significant.
It indicates again that the environmental performance of supply chains improves, and economic benefit grows when the retailer and manufacturer make emission-reduction efforts simultaneously. Hence, the joint emission-reduction strategy is a better strategy under either of the two BOPS modes.

4.4. Result and Discussion

The theoretical results can be derived based on Propositions 1–8, and some of them are obtained through the comparative analysis among the eight propositions as follows.

4.4.1. Impacts of Low-Carbon Preference on Carbon-Emission Reduction and Firms’ Profits

According to Propositions 1, 2, 5 and 6, the emission-reduction level of the manufacturer increases with the growth of customers’ LCP under either BOPS unit compensation or full-sales transfer modes. Hence, it is critical to raise the customers’ low-carbon sense so as to encourage the manufacturer’s effort on carbon-emission reduction.
Propositions 1 and 5 show that the profits of the manufacturer and the retailer positively relate to customers’ LCP with a single emission-reduction strategy under BOPS unit compensation or full-sales transfer modes, respectively. Hence, it is fundamental to raise the customers’ environmental consciousness so as to benefit the whole supply chain.
Similarly, Propositions 2 and 6 indicate that the results from Propositions 1 and 5 also hold under the joint carbon-emission reduction.
In summary, the growth of customers’ environmental consciousness stimulates manufacturers to invest more in carbon-emission reduction, thus bringing more benefits to the manufacturer, the retailer and the whole supply chain. Hence, it is important to strengthen the awareness of low-carbon environmental protection in order to keep the LSC sustainable.

4.4.2. Impacts of Joint Emission Reduction on Carbon-Emission Reduction and Firms’ Profits

Propositions 3, 4, 7, and 8 show that the joint emission-reduction strategy is superior to the single emission-reduction strategy under either BOPS unit compensation or full-sales transfer modes. So, it is vital for the retailer to involve the joint emission-reduction strategy.
Propositions 3 and 7 state that the emission-reduction effort level of the manufacturer under the joint emission-reduction strategy is higher than that under the single emission reduction. Moreover, the positive impact of customers’ LCP on the manufacturer’s reduction effort under the joint emission-reduction strategy is more significant.
Propositions 4 and 8 suggest that the profits of the manufacturer and the retailer are positively related to customers’ LCP with the joint emission-reduction strategy under BOPS unit compensation or full-sales transfer modes, respectively. Furthermore, the positive impact of customers’ LCP on the supply chain member’s profit under the joint emission-reduction strategy is higher than that under the single emission-reduction strategy.
Therefore, a joint emission-reduction strategy performs better than the single emission-reduction strategy with BOPS unit compensation or full-sales transfer modes, which can be proposed as a better way to achieve net zero commitment and motivate economic improvement. In practice, the manufacturer should cooperate with the retailer and set up a joint emission-reduction strategy so as to keep the low-carbon supply chain sustainable.

5. Numerical Examples

In the following, some numerical examples are conducted to investigate more insights from the models (Win 11/CPU 3.2G/RAM 16.0G). The following parameter assignments are based on [21,35,46] (Table 3).

5.1. The Impact of Low-Carbon Preference Level on Firms’ Decisions

Figure 3a,b show that the emission-reduction level increases as customers’ LCP grows in all scenarios. When the retailer promotes low-carbon products, manufacturers would like to reduce carbon emissions. The difference between joint and single emission-reduction strategies grows with the increase in the LCP level.
The emission-reduction level increases as LCP increases in all scenarios. When retailers promote low-carbon products, manufacturers are more willing to reduce carbon emissions. The difference between joint and single emission-reduction strategies with BOPS unit compensation or full-sales transfer modes grows with the increasing LCP. Hence, it illustrates that the joint emission-reduction strategy is a better strategy with either of the two BOPS modes.
Figure 4a,b depict that the selling price under a joint emission-reduction strategy is always higher than that under a single emission-reduction strategy with BOPS unit compensation or full-sales transfer modes. The difference is more significant when customers’ LCP grows. It indicates that customers prefer to pay for environmentally friendly products with the growing green consciousness.
At the same time, the increased price may compensate retailer’s promotion cost. Hence, in the market where customers have a high low-carbon preference level, the retailer has some advantage for the pricing.

5.2. The Impact of Low-Carbon Preference Level on Firms’ Profits

Figure 5a,b describe the increasing trend of retailer’s profits with the growth of customers’ LCP level. A joint emission-reduction strategy improves the retailer’s profit. Thus, the retailer prefers the joint emission-reduction strategy, in which the retailer would like to promote low-carbon products. The increase in customers’ LCP level can significantly improve the retailer’s profit. Hence, it is also vital for the retailer to promote customer’s environmental awareness.
Figure 6b shows that promotion can significantly improve the profit of the manufacturer under the BOPS full-sales transfer strategy, and the difference becomes prominent as it increases. The manufacturer’s profit with the joint emission-reduction strategy under BOPS unit compensation is lower than that of the single emission-reduction strategy when customers’ LCP level is low. As the LCP grows, the profit of a joint emission-reduction strategy surpasses the profit of single emission reduction when the LCP level is more than 0.74. This case implies that the joint emission strategy is not always better than the single emission strategy.
In summary, the low-carbon promotion can improve the entire supply chain profit. In all scenarios, the impact of the LCP level is positive on the profits of the manufacturer, the retailer and the whole supply chain.

6. Conclusions and Future Research

6.1. Conclusions

Omnichannel retailing has mainly been neglected in the discussion of enterprises’ low-carbon decisions. This study discusses the BOPS strategy in the LCSC, considering customers’ LCPs under the CAT regulations. Assuming that carbon is emitted during the manufacturing process and market demand is influenced by customers’ low-carbon preferences and retailers’ low-carbon promotions, a two-echelon supply chain is established to investigate the pricing and emission-reduction decisions. The relationship between emission-reduction level and LCP level is analyzed as well as the comparison with the single or the joint emission-reduction strategy. The conclusions and the corresponding managerial implications are summarized as follows.
(1)
Customers’ LCP stimulates manufacturers to raise their emission-reduction investment with either of two BOPS modes under the single or the joint emission-reduction strategy, which implies that the public green consciousness is the key to creating a low-carbon manufacturing environment. Enhancing the purchasing behavior on eco-friendly products provides intense motivation for the supply chain to cut down carbon emissions during the producing procedure.
(2)
The growth of customers’ LCP improves the profits of the manufacturer, the retailer and the whole supply chain. The increasing demand for green products can reduce the firm’s carbon emissions and benefit the LCSC. More specifically, with the growth of customers’ low-carbon preference, more technology and capital are invested for carbon-emission reduction. In turn, the effort made on low-carbon performance will benefit the supply chain. LCSC is suggested to take advantage of market low-carbon preference. On the one hand, brick-and-mortar stores may be located in areas with higher environmental consciousness. On the other hand, advertising on awareness and cultures of environmental protection is beneficial for an LCSC.
(3)
With retailers’ promotion of low-carbon information of products, less carbon is emitted during the production stages. Meanwhile, the higher the LCP, the more reduction is made compared to the single emission-reduction strategy. Based on the first finding, the retailer’s promotion on low-carbon products strengthens the positive impact of LCP on emission-reduction behaviors. It illustrates that the more low-carbon information about products is exposed, the more customers with green awareness are attracted.
(4)
The profits of the manufacturer, the retailer and the whole supply chain are also improved due to the promotion behavior of retailers on low-carbon products. Furthermore, with the growing LCP, the gap in emission reduction between the two cases with the promotion of the retailer or not is more significant. According to promotion benefits, stepping up advertising, such as more promotion channels, and inputting more capital and human resources is an effective way to gain more profits. For the government, increasing the exposure of eco-friendly firms can motivate them to improve the level of emission reduction and encourage more supply chain members to involve low-carbon management.
(5)
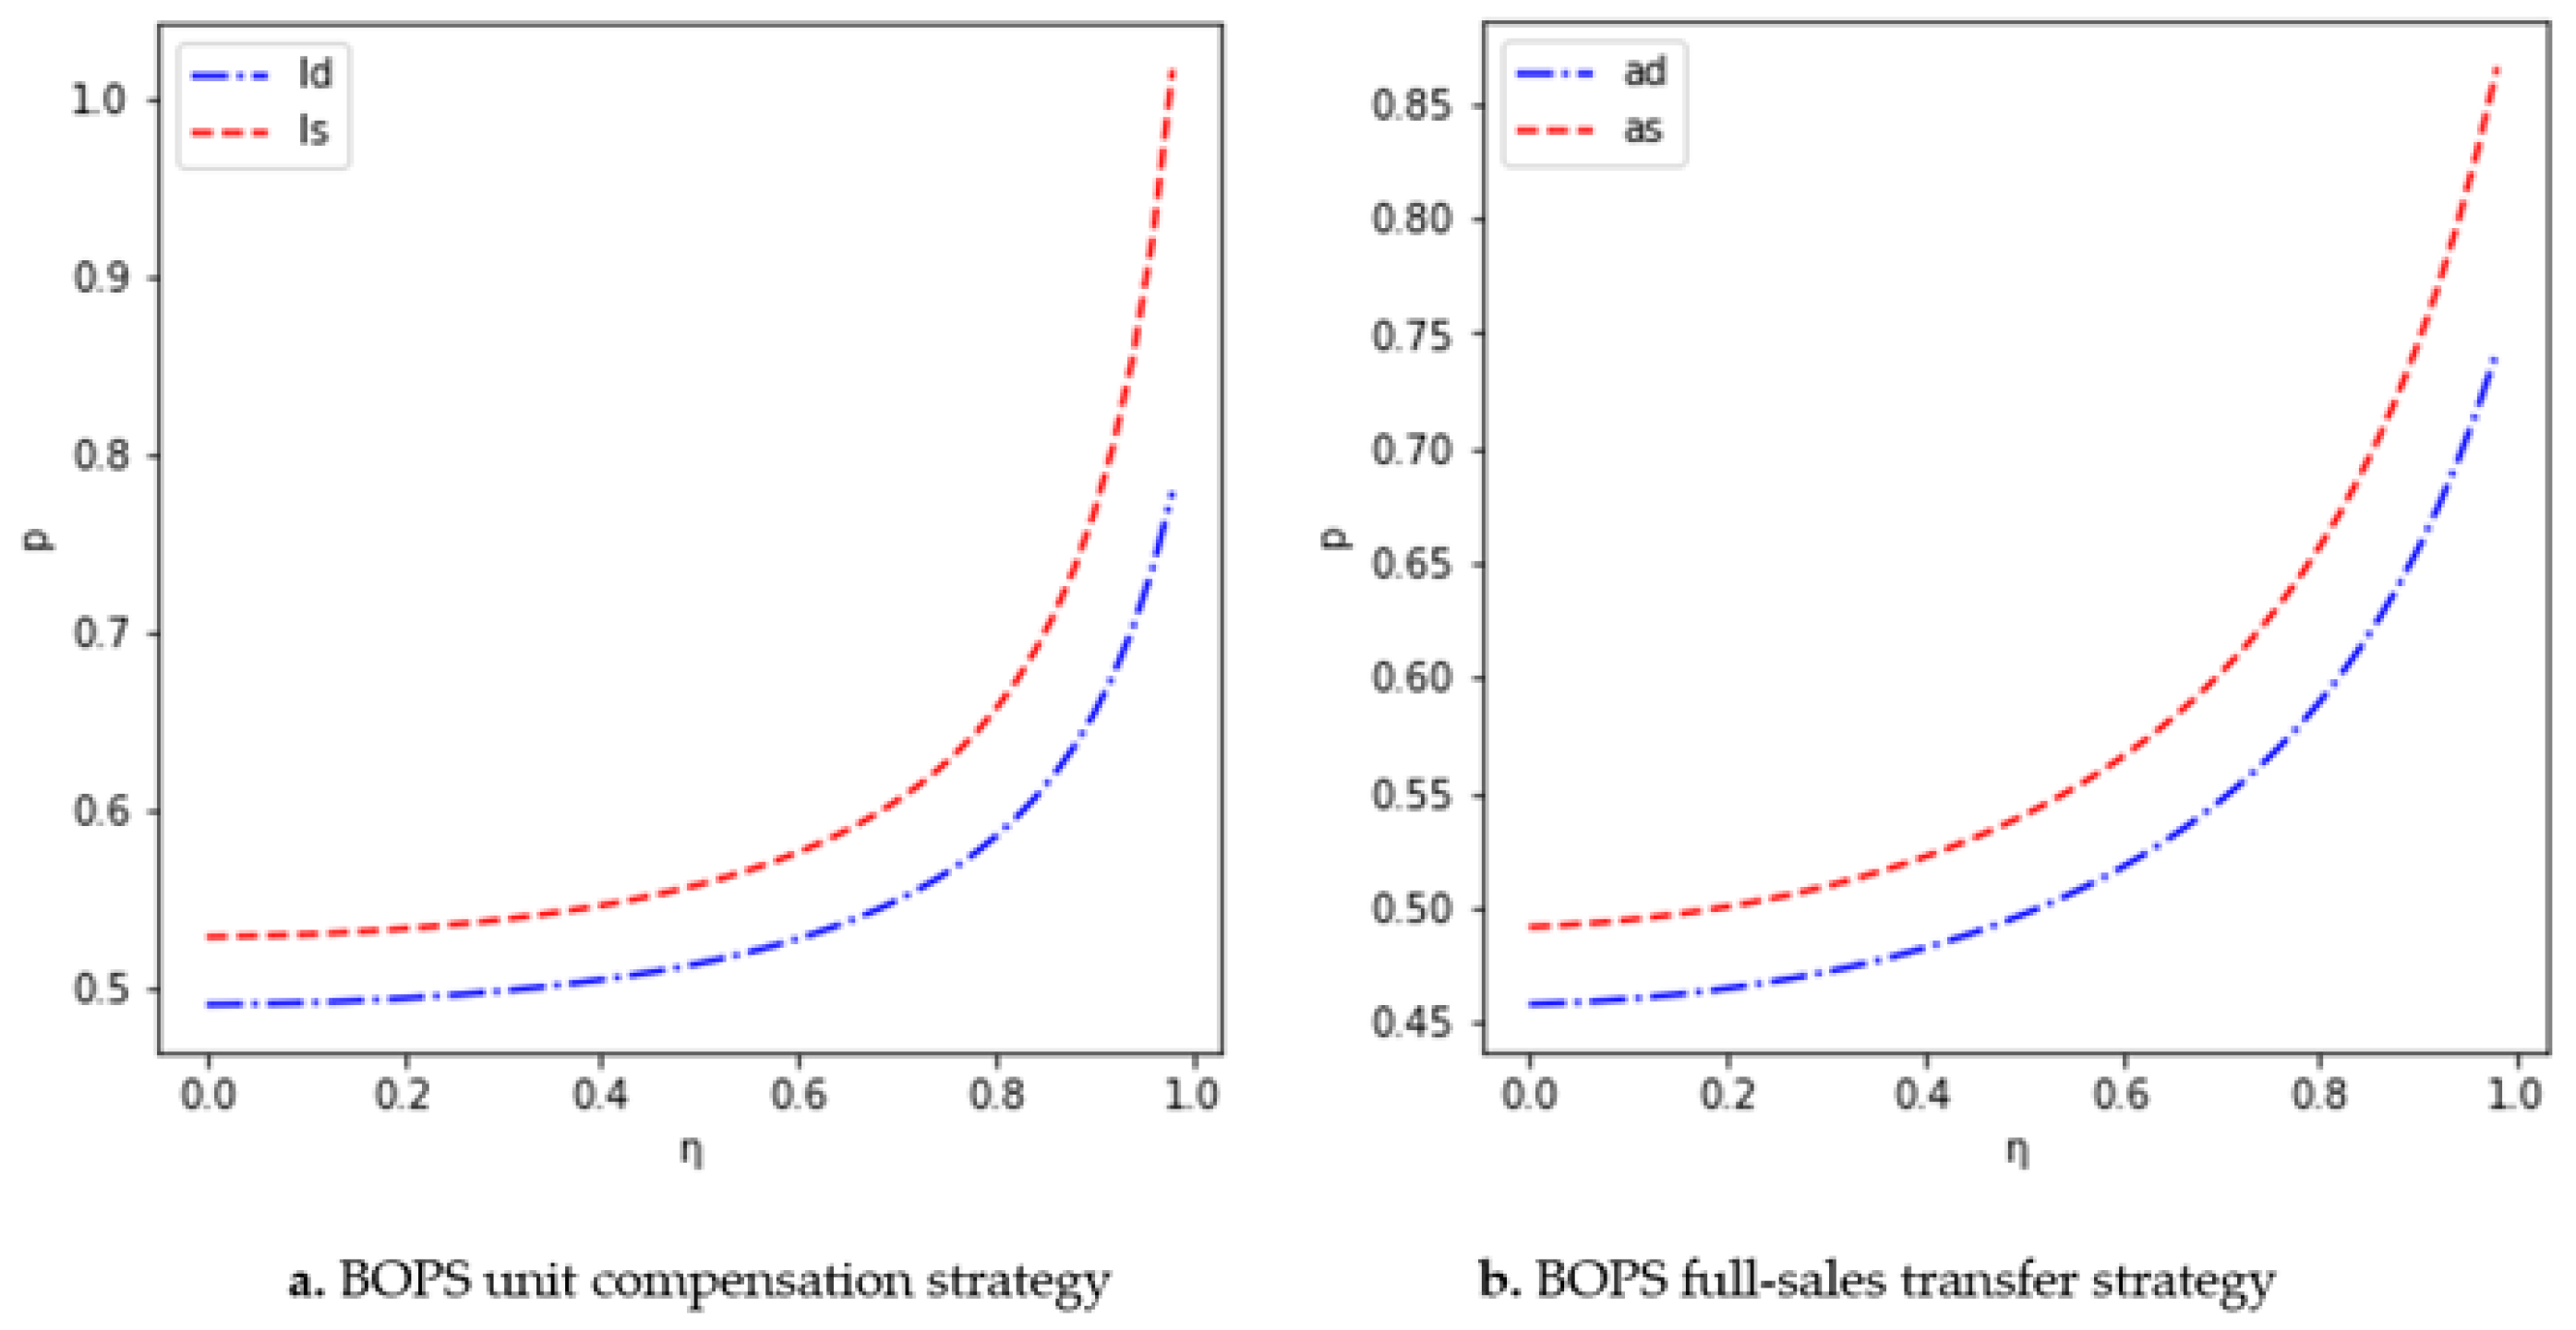
The price observed in numerical examples is positively affected by LCP, which implies that customers with more green consciousness are willing to pay a higher price for low-carbon products, bringing more profits to the supply chain. In addition, the joint emission strategy is not always better than the single emission strategy with respect to the selling price.

6.2. Future Research

Although this study contributes to the LCSC literature, there are some interesting extensions available for future work.
(1)
A supply chain usually has more than two echelon members in practice. It may include suppliers, manufacturers, retailers, and so on. Multi-echelon members will involve more complex decisions. Future research can study more complex supply chains to find more insights.
(2)
This work focuses on the BOPS channel, which is one form of omnichannel retailing. Other forms of omnichannel retailing are also exciting issues in the LCSC.
(3)
In the real world, enterprises may be weak on carbon disclosure, and the information on the carbon market may be asymmetric. More research can be conducted under more practical scenarios of incomplete and asymmetric information.
(4)
Offline retailers and e-commerce platforms can make joint low-carbon promotions. Further research can take online and offline promotion efforts together into consideration.

Author Contributions

Conceptualization, H.W. and H.T.; methodology, H.W. and H.T.; formal analysis, H.W.; writing—original draft preparation, H.W.; writing—review and editing, C.P. and H.T.; supervision, C.P. and H.T.; project administration, C.P.; funding acquisition, H.T. All authors have read and agreed to the published version of the manuscript.

Funding

This research was funded by the Higher Education Fund of the Macao SAR Government, grant number HSS-MUST-2021-04.

Data Availability Statement

The data used to support the findings of this study are included within the article.

Acknowledgments

The authors extend their appreciation to the Higher Education Fund of the Macao SAR Government, grant number HSS-MUST-2021-04.

Conflicts of Interest

The authors declare no conflict of interest.

Appendix A

Proof of Lemma 1. 
Firstly, find the optimal  p  for  π r 0 . It is easy to obtain that  2 π r 0 l d p 2 = 2 λ 0 < 0 , which implies that there exists an optimal  p  for π r 0 . Let the first derivative of  π r 0  with respect to p  be equal to 0. That is,
π r 0 l d p = a b λ 0 + e η 2 λ 0 p + λ 0 w = 0
Hence, we have  p = e η + a ) / ( 2 λ 0 + ( w b ) / 2 .
Secondly, we find the optimal e  and  w  for  π m 0 l d .  In this case, the Hessian matrix is 
Hessian ( π m 0 l d ) = 2 π m w 2 2 π m w e 2 π m e w 2 π m e 2 = 2 λ 0 η 3 λ 0 p e 2 η 3 λ 0 p e 2 η 2 / λ 0 + 3 η p e k
Thus, the determinant of the Hessian matrix is
Det(Hessian( π m 0 l d )) =  = 1 4 ( 8 λ 0 k 9 η + λ 0 p e 2 ) .
Then, the matrix is negatively definite when  8 λ 0 k 9 η + λ 0 p e 2 > 0  holds. Hence, we can find the optimal solutions for  e  and  w . □
Proof of Proposition 1. 
Based on Lemma 1, the first derivative of e l d  with respect to  η
e l d η = 4 a 9 e 0 λ 0 p e 8 λ 0 k 9 η + λ 0 p e 2 + 18 4 a 9 e 0 λ 0 p e η + λ 0 p e 2 8 λ 0 k 9 η + λ 0 p e 2 2 = 4 a 9 e 0 λ 0 p e ( 1 8 λ 0 k 9 η + λ 0 p e 2 + 18 η + λ 0 p e 2 8 λ 0 k 9 η + λ 0 p e 2 2 ) > 0
Furthermore, when it holds for
k > m a x 9 η + λ 0 p e 2 8 λ 0 , 3 a 4 a λ 0 3 e 0 λ 0 2 p e η + λ 0 p e 2 , the first derivatives of  π m l d  and  π r l d  with respect to  η  are both positive. That is,  π m l d η = 12 k η + λ 0 p e 4 a 9 λ 0 e 0 p e 2 8 λ 0 k 9 η + λ 0 p e 2 2 > 0 , and 
π r l d η = 12 k η + λ 0 p e 4 a 9 λ 0 e 0 p e 4 a λ 0 k 3 a η + λ 0 p e 2 3 e 0 k λ 0 2 p e 8 λ 0 k 9 η + λ 0 p e 2 3 > 0
Hence, we have that  π s c l d η = π r l d η + π m l d η > 0 . □
Proof of Lemma 2. 
Find the first derivatives of  π r 0 l s  with respect to  p  and  s  as
π r 0 l s p = m s + a b λ 0 + e η 2 λ 0 p + λ 0 w = 0 π r 0 l s s = m b + m ( p w ) ϕ s = 0
Then, we obtain the Hessian matrix
Hessian ( π r 0 l s ) = 2 π r 0 l s p 2 2 π r 0 l s s p 2 π r 0 l s p s 2 π r 0 l s s 2 = 2 λ 0 m m ϕ
When  2 λ 0 ϕ m 2 > 0  and  C k k λ 3 2 η + λ 0 p e 2 > 0 ,  the Hessian matrix is negatively definite. Thus, the optimal solutions of  ( p , s )  can be derived from Equation Group (A1) as follows.
p = ( m 2 b a ϕ + b λ 0 ϕ ) / ( m 2 2 λ 0 ϕ ) + w ( m 2 λ 0 ϕ ) / ( m 2 2 λ 0 ) + e η ϕ / ( m 2 2 λ 0 ϕ ) s = m a m b λ 0 m 2 2 ϕ λ 0 + w ( m λ 0 ) / ( m 2 2 λ 0 ) e ( m η ) / ( m 2 2 λ 0 ϕ ) .
Proof of Proposition 2. 
Based on Lemma 2 and  C k k λ 3 2 η + λ 0 p e 2 > 0 , it is easy to check that
e l s η = C 0 λ 0 1 C k k λ 3 2 η + λ 0 p e 2 + 2 λ 0 λ 3 2 η + λ 0 p e 2 C k k λ 3 2 η + λ 0 p e 2 2 > 0 π m l s η = k λ 0 2 η + λ 0 p e 2 m 2 a ϕ 4 a λ 0 ϕ 2 + λ 3 2 e 0 p e 2 C k k λ 3 2 η + λ 0 p e 2 2 > 0 .
Proof of Proposition 3.
(1)
Since  C 0 λ 0 λ 3 2 > 4 a 9 e 0 λ 0 p e > 0 ,  then  C 0 λ 0 λ 3 2 ( η + λ 0 p e ) > 4 a 9 e 0 λ 0 p e ( η + λ 0 p e ) .
m 2 < 3 λ 0 ϕ 2 , t h e n   0 < 6 λ 0 ϕ 3 m 2 < 6 λ 0 ϕ 2 m 2 , leading to  9 2 λ 0 ϕ m 2 2 < 4 3 λ 0 ϕ m 2 2  and  C k / λ 3 2 < 8 λ 0 / 9 . When  k > η + λ 0 p e 2 ,
e l s = C 0 λ 0 ( η + λ 0 p e ) C k k λ 3 2 η + λ 0 p e 2 = C 0 λ 0 ( η + λ 0 p e ) / λ 3 2 C k k λ 3 2 η + λ 0 p e 2 > 4 a / 9 e 0 λ 0 p e ( η + λ 0 p e ) 8 / 9 λ 0 k η + λ 0 p e 2 = 4 a 9 e 0 λ 0 p e ( η + λ 0 p e ) 8 λ 0 k 9 η + λ 0 p e 2 = e l d
(2)
Based on (1), we have
C 0 λ 0 / λ 3 2 C k k λ 3 2 η + λ 0 p e 2 > 4 a / 9 e 0 λ 0 p e 8 / 9 λ 0 k η + λ 0 p e 2
2 C 0 λ 0 / λ 3 2 η + λ 0 p e 2 C k k λ 3 2 η + λ 0 p e 2 2 > 2 4 a / 9 e 0 λ 0 p e η + λ 0 p e 2 8 / 9 λ 0 k η + λ 0 p e 2 2
According to (A2) and (A3), we have that
C 0 λ 0 / λ 3 2 C k k λ 3 2 η + λ 0 p e 2 + 2 C 0 λ 0 / λ 3 2 η + λ 0 p e 2 C k k λ 3 2 η + λ 0 p e 2 2 > 4 a / 9 e 0 λ 0 p e 8 / 9 λ 0 k η + λ 0 p e 2 + 2 4 a / 9 e 0 λ 0 p e η + λ 0 p e 2 8 / 9 λ 0 k η + λ 0 p e 2 2
That is,  e l s η > e l d η .  
Proof of Proposition 4.
(1)
According to Proposition 3,  k > η + λ 0 p e 2 , m 2 < 3 λ 0 ϕ 2 ;  then,  C k k λ 3 2 η + λ 0 p e 2 < 8 λ 0 / 9 k λ 3 2 η + λ 0 p e 2 .
Since  9 λ 0 2 ϕ 2 / λ 3 2  =  9 λ 0 2 ϕ 2 m 2 3 λ 0 ϕ 2 > 9 λ 0 2 ϕ 2 3 λ 0 ϕ 2 = 1 t h e n   λ 0 ϕ 2 / λ 3 2 > 1 9 λ 0 ,
λ 0 ϕ 2 2 C k k λ 3 2 η + λ 0 p e 2 > 1 2 λ 0 8 λ 0 k 9 η + λ 0 p e 2 > 0
For another,  4 a > 6 e 0 λ 0 p e , thus we have  e 0 p e + 4 a ϕ 6 e 0 λ 0 p e ϕ > 0 ,
m 2 e 0 λ 0 p e e 0 p e + 4 a ϕ 6 e 0 λ 0 p e ϕ k / ϕ 2 + 2 a 2 η + λ 0 p e 2 8 a e 0 λ 0 2 k p e + 9 k ϕ 2 e 0 2 λ 0 3 p e 2 > 2 a 2 η + λ 0 p e 2 8 a e 0 λ 0 2 k p e + 9 k e 0 2 λ 0 3 p e 2
Based on (A4) and (A5), we obtain that
λ 0 m 2 e 0 λ 0 p e e 0 p e + 4 a ϕ 6 e 0 λ 0 ϕ p e k + 2 a 2 ϕ 2 η + λ 0 p e 2 8 a ϕ 2 e 0 λ 0 2 k p e + 9 k ϕ 2 e 0 2 λ 0 3 p e 2 2 C k k λ 3 2 η + λ 0 p e 2 > 2 a 2 η + λ 0 p e 2 8 a e 0 λ 0 2 k p e + 9 k e 0 2 λ 0 3 p e 2 2 λ 0 8 λ 0 k 9 η + λ 0 p e 2
That is, π m l s > π m l d .
(2)
According to (1) of Proposition 4, 0  < C k k λ 3 2 η + λ 0 p e 2 < 8 λ 0 / 9 k η + λ 0 p e 2 , and  C k k λ 3 2 η + λ 0 p e 2 2 < 8 λ 0 / 9 k η + λ 0 p e 2 2 , then we have
9 λ 0 ϕ λ 3 2 2 λ 0 ϕ m 2 2 λ 3 4 = 9 λ 0 ϕ 2 λ 0 ϕ m 2 2 3 λ 0 ϕ m 2 2 = 2 3 λ 0 ϕ m 2 2 + m 2 ( 3 λ 0 ϕ 2 m 2 ) 2 3 λ 0 ϕ m 2 2 > 1 .
That is,
ϕ λ 3 2 m 2 + 2 λ 0 ϕ 2 C k k λ 3 2 η + λ 0 p e 2 2 > 9 λ 0 8 λ 0 k 9 η + λ 0 p e 2 2
For another,
4 a λ 0 2 ϕ 2 m 2 a λ 0 + m 2 e 0 λ 0 2 p e 3 e 0 λ 0 3 p e ϕ 3 λ 0 ϕ m 2 = 4 a λ 0 ϕ m 2 2 3 λ 0 ϕ m 2 3 e 0 λ 0 2 p e < 4 a λ 0 3 e 0 λ 0 2 p e
In this case, we have that
( 4 a λ 0 2 ϕ 2 m 2 a λ 0 + m 2 e 0 λ 0 2 p e 3 e 0 λ 0 3 p e ϕ ) 3 λ 0 ϕ m 2 k < 4 a λ 0 3 e 0 λ 0 2 p e k
Thus, it holds that
4 a λ 0 3 ( 1 λ 0 ϕ m 2 2 λ 0 ϕ m 2 3 ) k < 4 a λ 0 3 ( m 2 6 λ 0 ϕ m 2 3 ) k < 8 a λ 0 3 k < 2 η + λ 0 p e 2
Hence, we obtain that
λ 0 ϕ m 2 / 2 λ 0 ϕ m 2 / 3 4 a ϕ λ 0 3 k a η + λ 0 p e 2 e 0 k λ 0 2 p e ϕ > 4 a λ 0 3 k a η + λ 0 p e 2 e 0 k λ 0 2 p e
Based on (A6) and (A7), it is not difficult to check that
4 a λ 0 k 3 a η + λ 0 p e 2 3 e 0 k λ 0 2 p e 2 λ 0 8 λ 0 k 9 η + λ 0 p e 2 2 < ϕ m 2 + 2 λ 0 ϕ ( 2 m 2 a λ 0 m 2 e 0 λ 0 2 p e 4 a λ 0 2 ϕ ) k a λ 3 η + λ 0 p e 2 + 3 e 0 k λ 0 3 p e ϕ 2 2 C k k λ 3 2 η + λ 0 p e 2 2
That is,  π r l s > π r l d .
(3)
The proof is similar to that under (2) of Proposition 4.
Proof of Lemma 3. 
The proof is similar to that of Lemma 2. 
Proof of Proposition 5.
 
If  6 a x + 2 a 9 e 0 λ 0 p e > 0 , then we have that
e a d η = 6 a x + 2 a 9 e 0 λ 0 p e 10 λ 0 k 9 η + λ 0 p e 2 + 18 2 a + 6 a x 9 e 0 λ 0 p e η + λ 0 p e 2 10 λ 0 k 9 η + λ 0 p e 2 2 = 6 a x + 2 a 9 e 0 λ 0 p e ( 1 10 λ 0 k 9 η + λ 0 p e 2 + 18 η + λ 0 p e 2 10 λ 0 k 9 η + λ 0 p e 2 2 ) > 0
Furthermore, based on Lemma 3, it is easy to check that π m a d η = λ 0 k η + λ 0 p e 6 a x + 2 a 9 λ 0 e 0 p e 2 2 λ 0 10 λ 0 k 9 η + λ 0 p e 2 2 > 0  and 
π r a d η = 12 k η + λ 0 p e 6 a x + 2 a 9 λ 0 e 0 p e 6 a x 8 a λ 0 k + 6 a 9 a x η + λ 0 p e 2 + 6 e 0 k λ 0 2 p e 2 λ 0 10 λ 0 k 9 η + λ 0 p e 2 3 > 0 .
Hence π s c a d η = π m a d η + π r a d η > 0 .  
Proof of Lemma 4. 
The proof is similar to that of Lemma 2.
Proof of Proposition 6. 
(1)
Based on Lemma 4, since  k > 2 ( η + λ 0 p e ) 2 λ 0 , then we have that
2 λ 0 k m 2 λ 0 ϕ 2 > ( η + λ 0 p e ) 2 2 m 2 2 λ 0 ϕ 2 , which leads to the following inequality,
2 m 2 2 λ 0 ϕ 2 > 3 λ 0 ϕ 2 m 2 2
Hence, we conclude that
e a s η = C 3 m 2 3 λ 0 ϕ 2 2 ( η + λ 0 p e ) 2 + 2 k λ 0 m 2 λ 0 ϕ 2 + k λ 0 3 ϕ 2 2
+ 2 C 3 m 2 3 λ 0 ϕ 2 2 ( η + λ 0 p e ) m 2 3 λ 0 ϕ 2 2 ( η + λ 0 p e ) 2 + 2 k λ 0 m 2 λ 0 ϕ 2 + k λ 0 3 ϕ 2 2 2 > 0 , and
π m a s η = k η + λ 0 p e 4 m 4 a x 4 m 4 a 6 m 2 a λ 0 x ϕ 4 m 2 a λ 0 ϕ + 12 m 2 e 0 λ 0 2 p e ϕ + 6 a λ 0 2 x ϕ 2 + 2 a λ 0 2 ϕ 2 9 e 0 λ 0 3 p e ϕ 2 2 16 m 2 3 λ 0 ϕ 2 2 ( η + λ 0 p e ) 2 + 2 k λ 0 m 2 λ 0 ϕ 2 + k λ 0 3 ϕ 2 2 2 > 0 .
(2)
Based on (1), when  m 2 < λ 0 ϕ / 2 , we have that
m 2 3 λ 0 ϕ 2 2 ( η + λ 0 p e ) 2 + 2 k λ 0 m 2 λ 0 ϕ 2 + k λ 0 3 ϕ 2 2 > 0 . That is,
2 C r s λ 0 k a 2 m 2 3 λ 0 ϕ 3 x 2 η + λ 0 p e 2 > 0 .
Thus, we have that
π r a s η = k ϕ λ 0 m 2 λ 0 ϕ 2 m 2 3 λ 0 ϕ ( η + λ 0 p e ) 16 m 2 3 λ 0 ϕ 2 2 ( η + λ 0 p e ) 2 + 2 k λ 0 m 2 λ 0 ϕ 2 + k λ 0 3 ϕ 2 2 3
= C p s 2 C r s λ 0 k a 2 m 2 3 λ 0 ϕ 3 x 2 η + λ 0 p e 2 16 m 2 3 λ 0 ϕ 2 2 ( η + λ 0 p e ) 2 + 2 k λ 0 m 2 λ 0 ϕ 2 + k λ 0 3 ϕ 2 2 3 > 0
Proof of Proposition 7.
(1)
When  m 2 < λ 0 ϕ / 2 , m 2 ( 8 m 2 6 λ 0 ϕ ) < 0  holds, which derives that
10 m 2 3 λ 0 ϕ 2 2 > 9 λ 0 2 ϕ 2 2 + 2 m 2 λ 0 ϕ 2  and 
10 λ 0 9 k η + λ 0 p e 2 > 2 m 2 λ 0 ϕ 2 + λ 0 2 ϕ 2 2 m 2 3 λ 0 ϕ 2 2 λ 0 k η + λ 0 p e 2 > 0 .
For another, since  C 3 m 2 3 λ 0 ϕ 2 2 > 2 a + 6 a x 9 e 0 λ 0 p e 9 > 0 , so we have that
C 3 m 2 3 λ 0 ϕ 2 2 2 m 2 λ 0 ϕ 2 + λ 0 2 ϕ 2 / 2 m 2 3 λ 0 ϕ 2 2 λ 0 k η + λ 0 p e 2 > 2 a + 6 a x 9 e 0 λ 0 p e 9 10 λ 0 9 k η + λ 0 p e 2 > 0
Hence, it is true that
e a s = C 3 ( η + λ 0 p e ) m 2 3 λ 0 ϕ 2 2 ( η + λ 0 p e ) 2 + 2 k λ 0 m 2 λ 0 ϕ 2 + k λ 0 3 ϕ 2 / 2 > 2 a + 6 a x 9 e 0 λ 0 p e ( η + λ 0 p e ) 10 λ 0 k 9 η + λ 0 p e 2 = e a d .
(3)
Similarly, we can obtain tha  e a s η > e a d η
Proof of Proposition 8.
(1)
According to Proposition 7, when  m 2 < λ 0 ϕ / 2 k >   ( η + λ 0 p e ) 2 / λ 0 , we can derive that
10 λ 0 9 k η + λ 0 p e 2 > 2 m 2 λ 0 ϕ 2 + λ 0 2 ϕ 2 2 m 2 3 λ 0 ϕ 2 2 λ 0 k η + λ 0 p e 2 > 0
Since  a 2 λ 0 ϕ 2 3 x 2 2 4 m 2 3 λ 0 ϕ 2 2 > ( 12 x 4 ) λ 0 k + a 2 2 + 9 a 2 x 2 18 λ 0 > 0 , that is,
C m s a 2 λ 0 ϕ 2 3 x 2 2 > 4 a e 0 λ 0 p e + 4 a 2 x 2 a x 3 e 0 λ 0 p e 2 + 10 a 2 x 2 ( 12 x 4 ) λ 0 k + a 2 2 + 9 a 2 x 2 > 0 .
Thus,  π m a s  =  E p e + C m s k + a 2 λ 0 ϕ 2 3 x 2 2 η + λ 0 p e 2 4 m 2 3 λ 0 ϕ 2 2 ( η + λ 0 p e ) 2 + 2 k λ 0 m 2 λ 0 ϕ 2 + k λ 0 3 ϕ 2 / 2
> E p e + 12 x 4 λ 0 k + a 2 2 + 9 a 2 x 2 18 λ 0 4 a e 0 λ 0 p e + 4 a 2 x 2 a x 3 e 0 λ 0 p e 2 + 10 a 2 x 2 ( 12 x 4 ) λ 0 k + a 2 2 + 9 a 2 x 2 k η + λ 0 p e 2 10 λ 0 9 k η + λ 0 p e 2 = π m a d .
(2)
Based on the induction of Proposition 7, it is true that
10 λ 0 9 k η + λ 0 p e 2 > 2 m 2 λ 0 ϕ 2 + λ 0 2 ϕ 2 / 2 m 2 3 λ 0 ϕ 2 2 λ 0 k η + λ 0 p e 2 > 0
Thus, we have that
π r a s = ϕ λ 0 ϕ m 2 2 C r s λ 0 k a 2 m 2 3 λ 0 ϕ 3 x 2 η + λ 0 p e 2 2 . 32 m 2 3 λ 0 ϕ 2 2 ( η + λ 0 p e ) 2 + 2 k λ 0 m 2 λ 0 ϕ 2 + k λ 0 3 ϕ 2 / 2 2 > 6 a x 8 a λ 0 k + 6 a 9 a x η + λ 0 p e 2 + 6 e 0 k λ 0 2 p e 2 2 λ 0 10 λ 0 k 9 η + λ 0 p e 2 2 = π r a d .
(3)
Similarly, we can prove that π m a s η > π m a d η , π r a s η > π r l d η

References

  1. Liao, Z.L.; Zhu, X.L.; Shi, J.R. Case study on initial allocation of Shanghai carbon emission trading based on Shapley value. J. Clean. Prod. 2015, 103, 338–344. [Google Scholar] [CrossRef]
  2. Firoiu, D.; Ionescu, G.H.; Pîrvu, R.; Cismaș, L.M.; Tudor, S.; Patrichi, I.C. Dynamics of Implementation of SDG 7 Targets in EU Member States 5 Years after the Adoption of the Paris Agreement. Sustainability 2021, 13, 8284. [Google Scholar] [CrossRef]
  3. Wang, Z.H.; Wang, C. How carbon offsetting scheme impacts the duopoly output in production and abatement: Analysis in the context of carbon cap-and-trade. J. Clean. Prod. 2015, 103, 715–723. [Google Scholar] [CrossRef]
  4. Wu, P.; Feng, Y.; Pienaar, J.; Xia, B. A review of benchmarking in carbon labelling schemes for building materials. J. Clean. Prod. 2015, 109, 108–117. [Google Scholar] [CrossRef]
  5. Wang, X.; Xue, M.; Xing, L. Analysis of Carbon Emission Reduction in a Dual-Channel Supply Chain with Cap-And-Trade Regulation and Low-Carbon Preference. Sustainability 2018, 10, 580. [Google Scholar] [CrossRef] [Green Version]
  6. Chuang, S.P.; Huang, S.J. The Effect of Environmental Corporate Social Responsibility on Environmental Performance and Business Competitiveness: The Mediation of Green Information Technology Capital. J. Bus. Ethics 2018, 150, 991–1009. [Google Scholar] [CrossRef]
  7. Kiesler, C.A.; Ajzen, I.; Fishbein, M. Understanding attitudes and predicting social-behavior. Contemp. Psychol. 1981, 26, 253–255. [Google Scholar] [CrossRef]
  8. Banerjee, S.B.; Iyer, E.S.; Kashyap, R.K. Corporate environmentalism: Antecedents and influence of industry type. J. Mark. 2003, 67, 106–122. [Google Scholar] [CrossRef]
  9. Law, M.M.S.; Hills, P.; Hau, B.C.H. Engaging Employees in Sustainable Development—A Case Study of Environmental Education and Awareness Training in Hong Kong. Bus. Strategy Environ. 2017, 26, 84–97. [Google Scholar] [CrossRef]
  10. Payne, A.; Frow, P. The role of multichannel integration in customer relationship management. Ind. Mark. Manag. 2004, 33, 527–538. [Google Scholar] [CrossRef]
  11. Zhong, Y.G.; Lai, I.K.W.; Guo, F.; Tang, H. Research on Government Subsidy Strategies for the Development of Agricultural Products E-Commerce. Agriculture 2021, 11, 1152. [Google Scholar] [CrossRef]
  12. Luo, J.F.; Fan, M.; Zhang, H. Information Technology, Cross-Channel Capabilities, and Managerial Actions: Evidence from the Apparel Industry. J. Assoc. Inf. Syst. 2016, 17, 308–327. [Google Scholar] [CrossRef]
  13. Song, P.J.; Wang, Q.; Liu, H.; Li, Q. The Value of Buy-Online-and-Pickup-in-Store in Omni-Channel: Evidence from Customer Usage Data. Prod. Oper. Manag. 2020, 29, 995–1010. [Google Scholar] [CrossRef]
  14. Tang, H.J. Evaluation on Bus Rapid Transit in Macau Based on Congestion and Emission Reduction. In Proceedings of the 2012 International Conference on Low-Carbon Transportation and Logistics, and Green Buildings, Beijing, China, 12–13 October 2012. [Google Scholar]
  15. Tang, H.; Pang, C.; Ng, C.T. Optimization of Vehicle Population and Reduction of CO2 Emission. Int. J. Shipp. Transp. Logist. 2014, 6, 412–421. [Google Scholar] [CrossRef]
  16. Yang, S.J.; Lai, I.K.W.; Tang, H.J. Pricing and Contract Coordination of BOPS Supply Chain Considering Product Return Risk. Sustainability 2022, 14, 5055. [Google Scholar] [CrossRef]
  17. Gallino, S.; Moreno, A. Integration of online and offline channels in retail: The impact of sharing reliable inventory availability information. Manag. Sci. 2014, 60, 1434–1451. [Google Scholar] [CrossRef] [Green Version]
  18. Ge, C.C.; Zhu, J.J. Effects of BOPS Implementation under Market Competition and Decision Timing in Omnichannel Retailing. Comput. Ind. Eng. 2023, 179, 109227. [Google Scholar] [CrossRef]
  19. Lin, X.; Zhou, Y.-W.; Hou, R. Impact of a “Buy-online-and-pickup-in-store” Channel on Price and Quality Decisions in a Supply Chain. Eur. J. Oper. Res. 2021, 294, 922–935. [Google Scholar] [CrossRef]
  20. Wang, R.H.; Nan, G.; Chen, L.; Li, M. Channel Integration Choices and Pricing Strategies for Competing Dual-Channel Retailers. IEEE Trans. Eng. Manag. 2022, 69, 2260–2274. [Google Scholar] [CrossRef]
  21. Zhang, Q.; Cao, W.; Liu, Y.; Zhang, Z. Integration of online and offline channels in retail: Feasibility of BOPS? Kybernetes 2020, 50, 1588–1620. [Google Scholar] [CrossRef]
  22. Yan, S.; Hua, Z.S.; Bian, Y.W. Does Retailer Benefit from Implementing “Online-to-Store” Channel in a Competitive Market? IEEE Trans. Eng. Manag. 2020, 67, 496–512. [Google Scholar] [CrossRef]
  23. Xu, S.Y.; Tang, H.; Lin, Z.; Lu, J. Pricing and sales-effort analysis of dual-channel supply chain with channel preference, cross-channel return and free riding behavior based on revenue-sharing contract. Int. J. Prod. Econ. 2022, 249, 20. [Google Scholar] [CrossRef]
  24. Feng, Y.; Zhang, J.; Feng, L.; Zhu, G. Benefit from a high store visiting cost in an omnichannel with BOPS. Transp. Res. Part E-Logist. Transp. Rev. 2022, 166, 17. [Google Scholar] [CrossRef] [PubMed]
  25. Jiang, Y.Q.; Wu, M.X. Power structure and pricing in an omnichannel with buy-online-and-pick-up-in-store. Electron. Commer. Res. 2022, 25, 1–25. [Google Scholar] [CrossRef]
  26. Kusuda, Y. Information effect of buy-online-and-pick-up-in-store in omnichannel retailing with store replenishment. Electron. Commer. Res. Appl. 2022, 52, 10. [Google Scholar] [CrossRef]
  27. Ouyang, Y.; Wan, Z.M.; Wan, Z. Game Model for Online and Offline Retailers under Buy-Online and Pick-Up-In-Store Mode with Delivery Cost and Random Demand. Anziam J. 2020, 62, 62–88. [Google Scholar] [CrossRef]
  28. Liu, J.; Xu, Q. Joint Decision on Pricing and Ordering for Omnichannel BOPS Retailers: Considering Online Returns. Sustainability 2020, 12, 1539. [Google Scholar] [CrossRef] [Green Version]
  29. Fan, X.J.; Tian, L.; Wang, C.; Wang, S. Optimal service decisions in an omni-channel with buy-online-and-pick-up-in-store. J. Oper. Res. Soc. 2022, 73, 794–810. [Google Scholar] [CrossRef]
  30. Li, M.L.; Zhang, X.M.; Dan, B. Cooperative advertising and pricing in an O2O supply chain with buy-online-and-pick-up-in-store. Int. Trans. Oper. Res. 2021, 28, 2033–2054. [Google Scholar] [CrossRef]
  31. Saha, K.; Bhattacharya, S. ‘Buy online and pick up in-store’: Implications for the store inventory. Eur. J. Oper. Res. 2021, 294, 906–921. [Google Scholar] [CrossRef]
  32. Tang, H.J.; Elalouf, A.; Levner, E.; Cheng, T.C.E. Efficient computation of evacuation routes on a three-dimensional geometric network. Comput. Ind. Eng. 2014, 76, 231–242. [Google Scholar] [CrossRef]
  33. Gao, F.; Su, X.M. Omnichannel Retail Operations with Buy-Online-and-Pick-up-in-Store. Manag. Sci. 2017, 63, 2478–2492. [Google Scholar] [CrossRef] [Green Version]
  34. He, Y.; Xu, Q.Q.; Zhao, D. Impacts of the BOPS Option on Sustainable Retailing. Sustainability 2020, 12, 8600. [Google Scholar] [CrossRef]
  35. Zhang, Y.; Li, J.; Xu, B. Designing Buy-Online-and-Pick-Up-in-Store (BOPS) Contract of Dual-Channel Low-Carbon Supply Chain considering Consumers’ Low-Carbon Preference. Math. Probl. Eng. 2020, 2020, 7476019. [Google Scholar] [CrossRef]
  36. Han, Q.; Yang, Z.; Zhang, Z.; Shen, L. Offline and Online Channel Selection of Low-Carbon Supply Chain under Carbon Trading Market. Math. Probl. Eng. 2021, 2021, 1–17. [Google Scholar] [CrossRef]
  37. Ghosh, S.K.; Seikh, M.R.; Chakrabortty, M. Analyzing a stochastic dual-channel supply chain under consumers’ low carbon preferences and cap-and-trade regulation. Comput. Ind. Eng. 2020, 149, 106765. [Google Scholar] [CrossRef]
  38. Xu, L.; Wang, C.X.; Zhao, J.J. Decision and coordination in the dual-channel supply chain considering cap-and-trade regulation. J. Clean. Prod. 2018, 197, 551–561. [Google Scholar] [CrossRef]
  39. Xu, X.Y.; Xu, X.P.; He, P. Joint production and pricing decisions for multiple products with cap-and-trade and carbon tax regulations. J. Clean. Prod. 2016, 112, 4093–4106. [Google Scholar] [CrossRef]
  40. Du, S.F.; Hu, L.; Song, M.L. Production optimization considering environmental performance and preference in the cap-and-trade system. J. Clean. Prod. 2016, 112, 1600–1607. [Google Scholar] [CrossRef]
  41. Yu, C.; Wang, C.; Zhang, S. Advertising cooperation of dual-channel low-carbon supply chain based on cost-sharing. Kybernetes 2019, 49, 1169–1195. [Google Scholar] [CrossRef]
  42. Xia, L.; Hao, W.; Qin, J.; Ji, F.; Yue, X. Carbon emission reduction and promotion policies considering social preferences and consumers’ low-carbon awareness in the cap-and-trade system. J. Clean. Prod. 2018, 195, 1105–1124. [Google Scholar] [CrossRef]
  43. Wang, Q.; Zhao, D.; He, L. Contracting emission reduction for supply chains considering market low-carbon preference. J. Clean. Prod. 2016, 120, 72–84. [Google Scholar] [CrossRef]
  44. Yang, L.; Hu, Y.J.; Huang, L.J. Collecting mode selection in a remanufacturing supply chain under cap-and-trade regulation. Eur. J. Oper. Res. 2020, 287, 480–496. [Google Scholar] [CrossRef]
  45. Zhou, Y.J.; Ye, X. Differential game model of joint emission reduction strategies and contract design in a dual-channel supply chain. J. Clean. Prod. 2018, 190, 592–607. [Google Scholar] [CrossRef]
  46. Ji, J.N.; Zhang, Z.Y.; Yang, L. Carbon emission reduction decisions in the retail-/dual-channel supply chain with consumers’ preference. J. Clean. Prod. 2017, 141, 852–867. [Google Scholar] [CrossRef]
  47. Liu, L.; Feng, L.; Xu, B.; Deng, W. Operation strategies for an omni-channel supply chain: Who is better off taking on the online channel and offline service? Electron. Commer. Res. Appl. 2020, 39, 100918. [Google Scholar] [CrossRef]
  48. Zhou, Y.W.; Guo, J.S.; Zhou, W.H. Pricing/service strategies for a dual-channel supply chain with free riding and service-cost sharing. Int. J. Prod. Econ. 2018, 196, 198–210. [Google Scholar] [CrossRef]
  49. Jing, B. Showrooming and Webrooming: Information Externalities Between Online and Offline Sellers. Mark. Sci. 2018, 37, 469–483. [Google Scholar] [CrossRef]
  50. Mehra, A.; Kumar, S.; Raju, J.S. Competitive strategies for brick-and-Mortar stores to counter “showrooming”. Manag. Sci. 2018, 64, 3076–3090. [Google Scholar] [CrossRef] [Green Version]
  51. Shin, J. How does free riding on customer service affect competition? Mark. Sci. 2007, 26, 488–503. [Google Scholar] [CrossRef] [Green Version]
  52. Liu, Z.G.; Anderson, T.D.; Cruz, J.M. Consumer environmental awareness and competition in two-stage supply chains. Eur. J. Oper. Res. 2012, 218, 602–613. [Google Scholar] [CrossRef]
  53. Xie, J.P.; Liang, L.; Liu, L.; Ieromonachou, P. Coordination contracts of dual-channel with cooperation advertising in closed-loop supply chains. Int. J. Prod. Econ. 2017, 183, 528–538. [Google Scholar] [CrossRef]
Figure 1. Channel structure.
Mathematics 11 02736 g001
Figure 2. Technical route.
Mathematics 11 02736 g002
Figure 3. The impact of low-carbon preference level on emission-reduction level.
Mathematics 11 02736 g003
Figure 4. The impact of low-carbon preference level on selling price.
Mathematics 11 02736 g004
Figure 5. The impact of low-carbon preference level on the retailer’s profit.
Mathematics 11 02736 g005
Figure 6. The impact of low-carbon preference level on the manufacturer’s profit.
Mathematics 11 02736 g006
Table 1. Key related literature.
Key Related LiteratureBOPSCap and TradeLow-Carbon PreferenceEmission-Reduction DecisionsLow-Carbon Promotion
Du et al. [40] yesyes
Wang et al. [43] yes yes
Yang et al. [44] yes yes
Zhou and Ye [45] yes yesyes
Xia et al. [42]-yesyesyesyes
Ji et al. [46]-yesyesyesyes
Wang et al. [5]-yesyesyes-
He et al. [34]yes----
Zhang et al. [35]yesyesyes--
This studyyesyesyesyesyes
Table 2. Related notation.
Parameters
λ 0 Sensitivity coefficient of market demand to price
a Initial potential market demand in the online (including BOPS)/offline channel
x Customers’ propensity to online channels (exclude BOPS)
m The promotion effort coefficient to the market demand
η Customers’ low-carbon preference level
p e The trading price of carbon emission permits
e 0 Initial carbon emission amount in the production procedure
E Free carbon quotas
k Cost-effectiveness of carbon-emission reduction
ϕ Cost-effectiveness of low-carbon promotion
b Unit compensate price
D r i Demand function of offline channel (single emission reduction if i = d ; joint emission reduction if i = s )
D o i Demand function of e-commerce channel (exclude BOPS)
D p i Demand function of BOPS channel
π m i Profit function of the manufacturer
π r i Profit function of retailer
π s c i Profit function of supply chain
Decision variables
p i Selling price
w i Wholesale price
s i Low-carbon promotion effort of retailers
e i Emission-reduction level of manufacturers
Table 3. Parameter assignment.
ParameterValueParameterValue
a 0.5 m 0.4
x 0.6 p e 0.4
λ 0 0.6 e 0 0.5
k 3.5 E 0.5
ϕ 1.4 b 0.1
Disclaimer/Publisher’s Note: The statements, opinions and data contained in all publications are solely those of the individual author(s) and contributor(s) and not of MDPI and/or the editor(s). MDPI and/or the editor(s) disclaim responsibility for any injury to people or property resulting from any ideas, methods, instructions or products referred to in the content.

