Article

Night Vision Anti-Halation Algorithm of Different-Source Image Fusion Based on Low-Frequency Sequence Generation

School of Electronic and Information Engineering, Xi’an Technological University, Xi’an 710021, China
*
Author to whom correspondence should be addressed.
Mathematics 2023, 11(10), 2237; https://doi.org/10.3390/math11102237
Submission received: 22 March 2023 / Revised: 23 April 2023 / Accepted: 5 May 2023 / Published: 10 May 2023
(This article belongs to the Special Issue Advances of Mathematical Image Processing)

Abstract

:
The abuse of high beam lights dazzles the opposite drivers when the vehicles meet at night, which can easily cause traffic accidents. The existing night vision anti-halation algorithms based on different-source image fusion can eliminate halation and obtain fusion images with rich color and details. However, the algorithms mistakenly eliminate some high-brightness important information. In order to address the problem, a night vision anti-halation algorithm based on low-frequency sequence generation is proposed. The low-frequency sequence generation model is constructed to generate image sequences with different degrees of halation elimination. According to the estimated illuminance for image sequences, the proposed sequence synthesis based on visual information maximization assigns a large weight to the areas with good brightness so as to obtain the fusion image without halation and with rich details. In four typical halation scenes covering most cases of night driving, the proposed algorithm effectively eliminates halation while retaining useful high-brightness information and has better universality than the other seven advanced comparison algorithms. The experimental results show that the fusion image obtained by the proposed algorithm is more suitable for human visual perception and helps to improve night driving safety.

1. Introduction

The abuse of high beams dazzles the oncoming driver during a meeting at night, which causes nearly half of all nighttime traffic accidents [1]. Therefore, the anti-halation technology to improve night driving safety has attracted continuous attention from the research community.
The existing active anti-halation methods include sticking polarizing film on the front windscreen [2], infrared night vision imaging [3,4,5], an array of CCD image sensors with a pixel integration time independently controllable [6], two visible image fusions with different light integration times [7], etc. Among them, multi-exposure image fusion [8] and infrared and visible image fusion [9,10] have lower halation retention and better visual effects.
By fusing multiple images taken in succession with different exposure levels, multi-exposure image fusion can obtain a good visual effect in static night vision scenes [11]. However, in dynamic night vision scenes, the fast-moving objects will produce artifacts in the fusion image. In addition, multiple visible images belong to same-source images, lack information complementarity, and have failure problems in strong halation scenes.
Taking advantage of the information complementarity of different source images, the infrared and visible image fusion method simultaneously takes infrared and visible images of the same scene. The obtained fusion images have rich-in-color details and are without halation. The method is more suitable for dynamic night-vision halation scenes. Reference [12] proposes an improved rolling guidance filter (IRGF) to decompose infrared and visible images. According to the brightness of a visible image, the image to be fused is divided into three regions. By assigning different fusion weights to different regions, the brightness of the fusion image is more consistent with the human vision. Reference [13] proposes an adaptive-parameter simplified pulse-coupled neural network (AP-SPCNN) to fuse the high-frequency components of NSST decomposition. This method takes advantage of the global coupling and pulse synchronization of the network to improve the definition of the fusion image.
Reference [14] decomposes infrared and visible images by the fourth-order partial differential equation (FPDE) and fuses the low-frequency components by expectation maximization strategy, which effectively improves the salient information of the fusion images. In reference [15], the designed fusion rules based on regional energy (RE) and intuitionistic fuzzy sets (IFS) preserve the important target and texture information in the resulting image, respectively. Reference [16] adopts tetrolet transform (TT) to decompose the visible and infrared image and use convolutional sparse representation (CSR) to fuse the high-frequency components, which effectively improves the visual effect of the fused image.
However, the halation information also belongs to the salient information in night vision images; the above methods will enlarge the halation areas while enhancing the detailed information of the fusion image, which is not conducive to the safety of driving at night. In reference [17], the low-frequency components obtained by the Wavelet transform are weighted and fused to weaken halation interference in fusion images. However, Wavelet transform lacks the retention of edge information, so the definition of the fusion image is not good. In addition, due to the weighted strategy adopted, the halation information still participates in the fusion and leads to insufficient halation elimination in strong halation scenes. Reference [18] designs a low-frequency coefficient weight automatic adjustment strategy. The strategy allocates higher weights to the pixels of infrared low-frequency components corresponding to the high-brightness areas of visible images, which can eliminate halation more completely. However, it also causes some high-brightness important information to be mistakenly eliminated.
In the field of image processing linked to artificial intelligence, reference [19] uses a new filter derived from discrete Chebyshev wavelet transformations (DCHWT) convoluted with neural networks to effectively enhance the image quality. Reference [20] proposes a convolution-guided transformer framework (CGTF) for infrared and visible image fusion, which combines the local features of the convolutional network and the long-range dependence features of the transformer to produce a satisfactory fused image. However, the above algorithms require sufficient sample datasets to improve the image processing effect.
The main contributions of this paper are: (1) A novel night vision anti-halation algorithm of different-source image fusion based on low-frequency sequence generation is introduced. (2) The low-frequency sequence generation model is constructed to generate image sequences with different degrees of halation elimination. (3) The sequence synthesis based on visual information maximization is proposed. According to the estimated illuminance for image sequences, the membership function of visual information maximization assigns a large weight to the areas with good brightness to generate a fusion image conforming to human visual perception. (4) An experimental study is conducted in four typical halation scenes. The experimental outcomes illustrate that the proposed algorithm has the advantages of eliminating the halation completely and retaining the high-brightness useful information in different night vision halation scenes.
The remainder of the article is arranged as follows: Section 2 presents the night vision anti-halation principle based on low-frequency sequence generation. Section 3 describes a step-by-step realization of the night vision anti-halation algorithm. Section 4 gives the experiential results and discussion. Lastly, Section 5 represents the conclusion.

2. Night Vision Anti-Halation Principle Based on Different Source Image Fusion

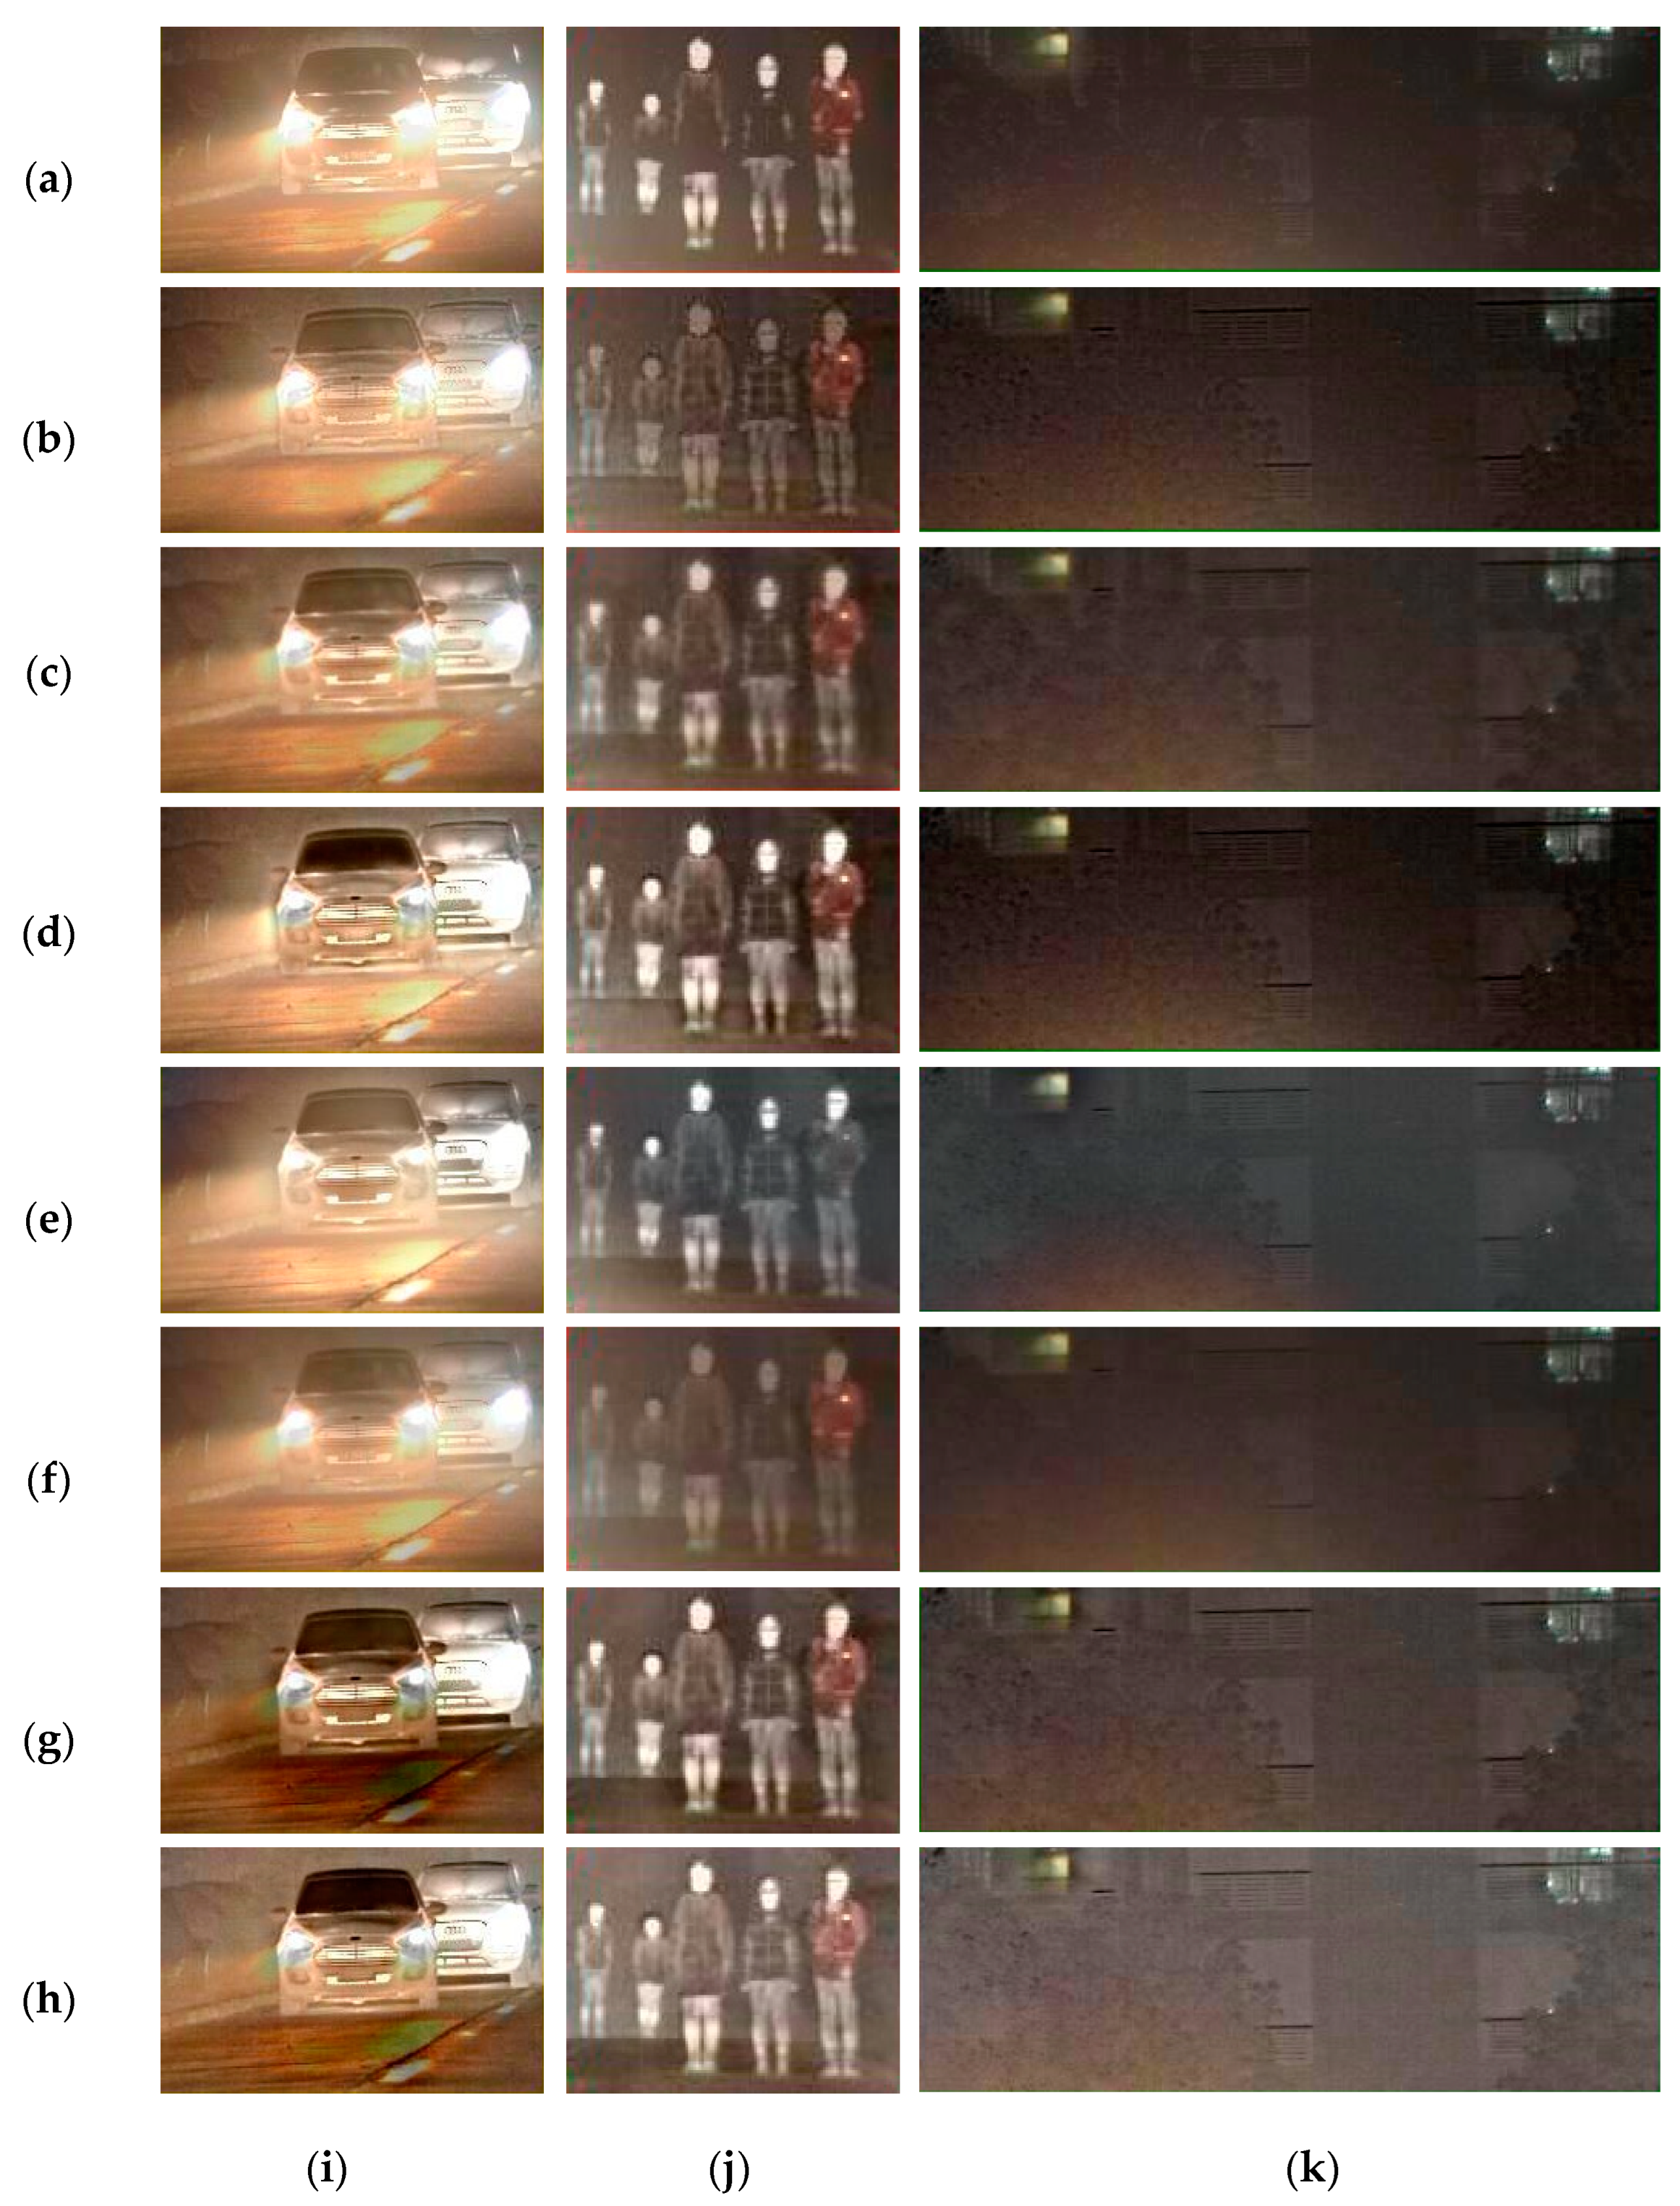
Figure 1 shows the original images, the fusion image, and the clustering map of visible images in the typical night halation scene.
It is evident from Figure 1a that the headlights form high-brightness halation areas. Some important information in the areas closer to the headlights, such as lane lines, license plates, and front-row pedestrians, benefits from the high-brightness halation and becomes more obvious. However, it also makes it more difficult to observe dark areas farther away from the halation, such as back-row pedestrians and background contours.
As can be seen in Figure 1b, the contours of vehicles, pedestrians, and background in the infrared image are clearly visible. However, the infrared image is a gray-level image with low resolution and missing details and exists on some problems, such as disappearing license plate information and indistinct lane lines.
From Figure 1c, in the fusion image of visible and infrared images, the high-brightness halation is completely eliminated, and the color and details are rich, which is suitable for human visual perception and helps to improve night driving safety [18]. However, there is an obvious light–dark splitting phenomenon in the fusion image, and the important information, such as license plate and lane lines, that was originally clear in the visible image is also eliminated or weakened.
Figure 1d is the cluster map of the visible image shown in Figure 1a [21]. By comparing Figure 1a,d, it can be seen that the high-brightness areas contain a large amount of halation information and a small amount of important information, such as license plates and lane lines. In the areas closer to the halation, the brightness increases obviously.
By comparing Figure 1c,d, it is notable that the fusion algorithm takes high-brightness license plates and lane lines as high-brightness halation to eliminate. Moreover, due to the excessive brightness elimination of halation areas, the fusion image appears to be an obvious light–dark splitting phenomenon.
According to the above analysis, the halation must be high-brightness information, but not vice versa. The existing night vision anti-halation algorithms based on visible and infrared image fusion distinguish the halation and the non-halation information by brightness, which will inevitably lead to the mis-elimination of useful high-brightness information. Meanwhile, in different night halation scenes, it is difficult to define the optimal division of the halation area and the best halation elimination effect, as well as whether there is insufficient or excessive halation elimination.
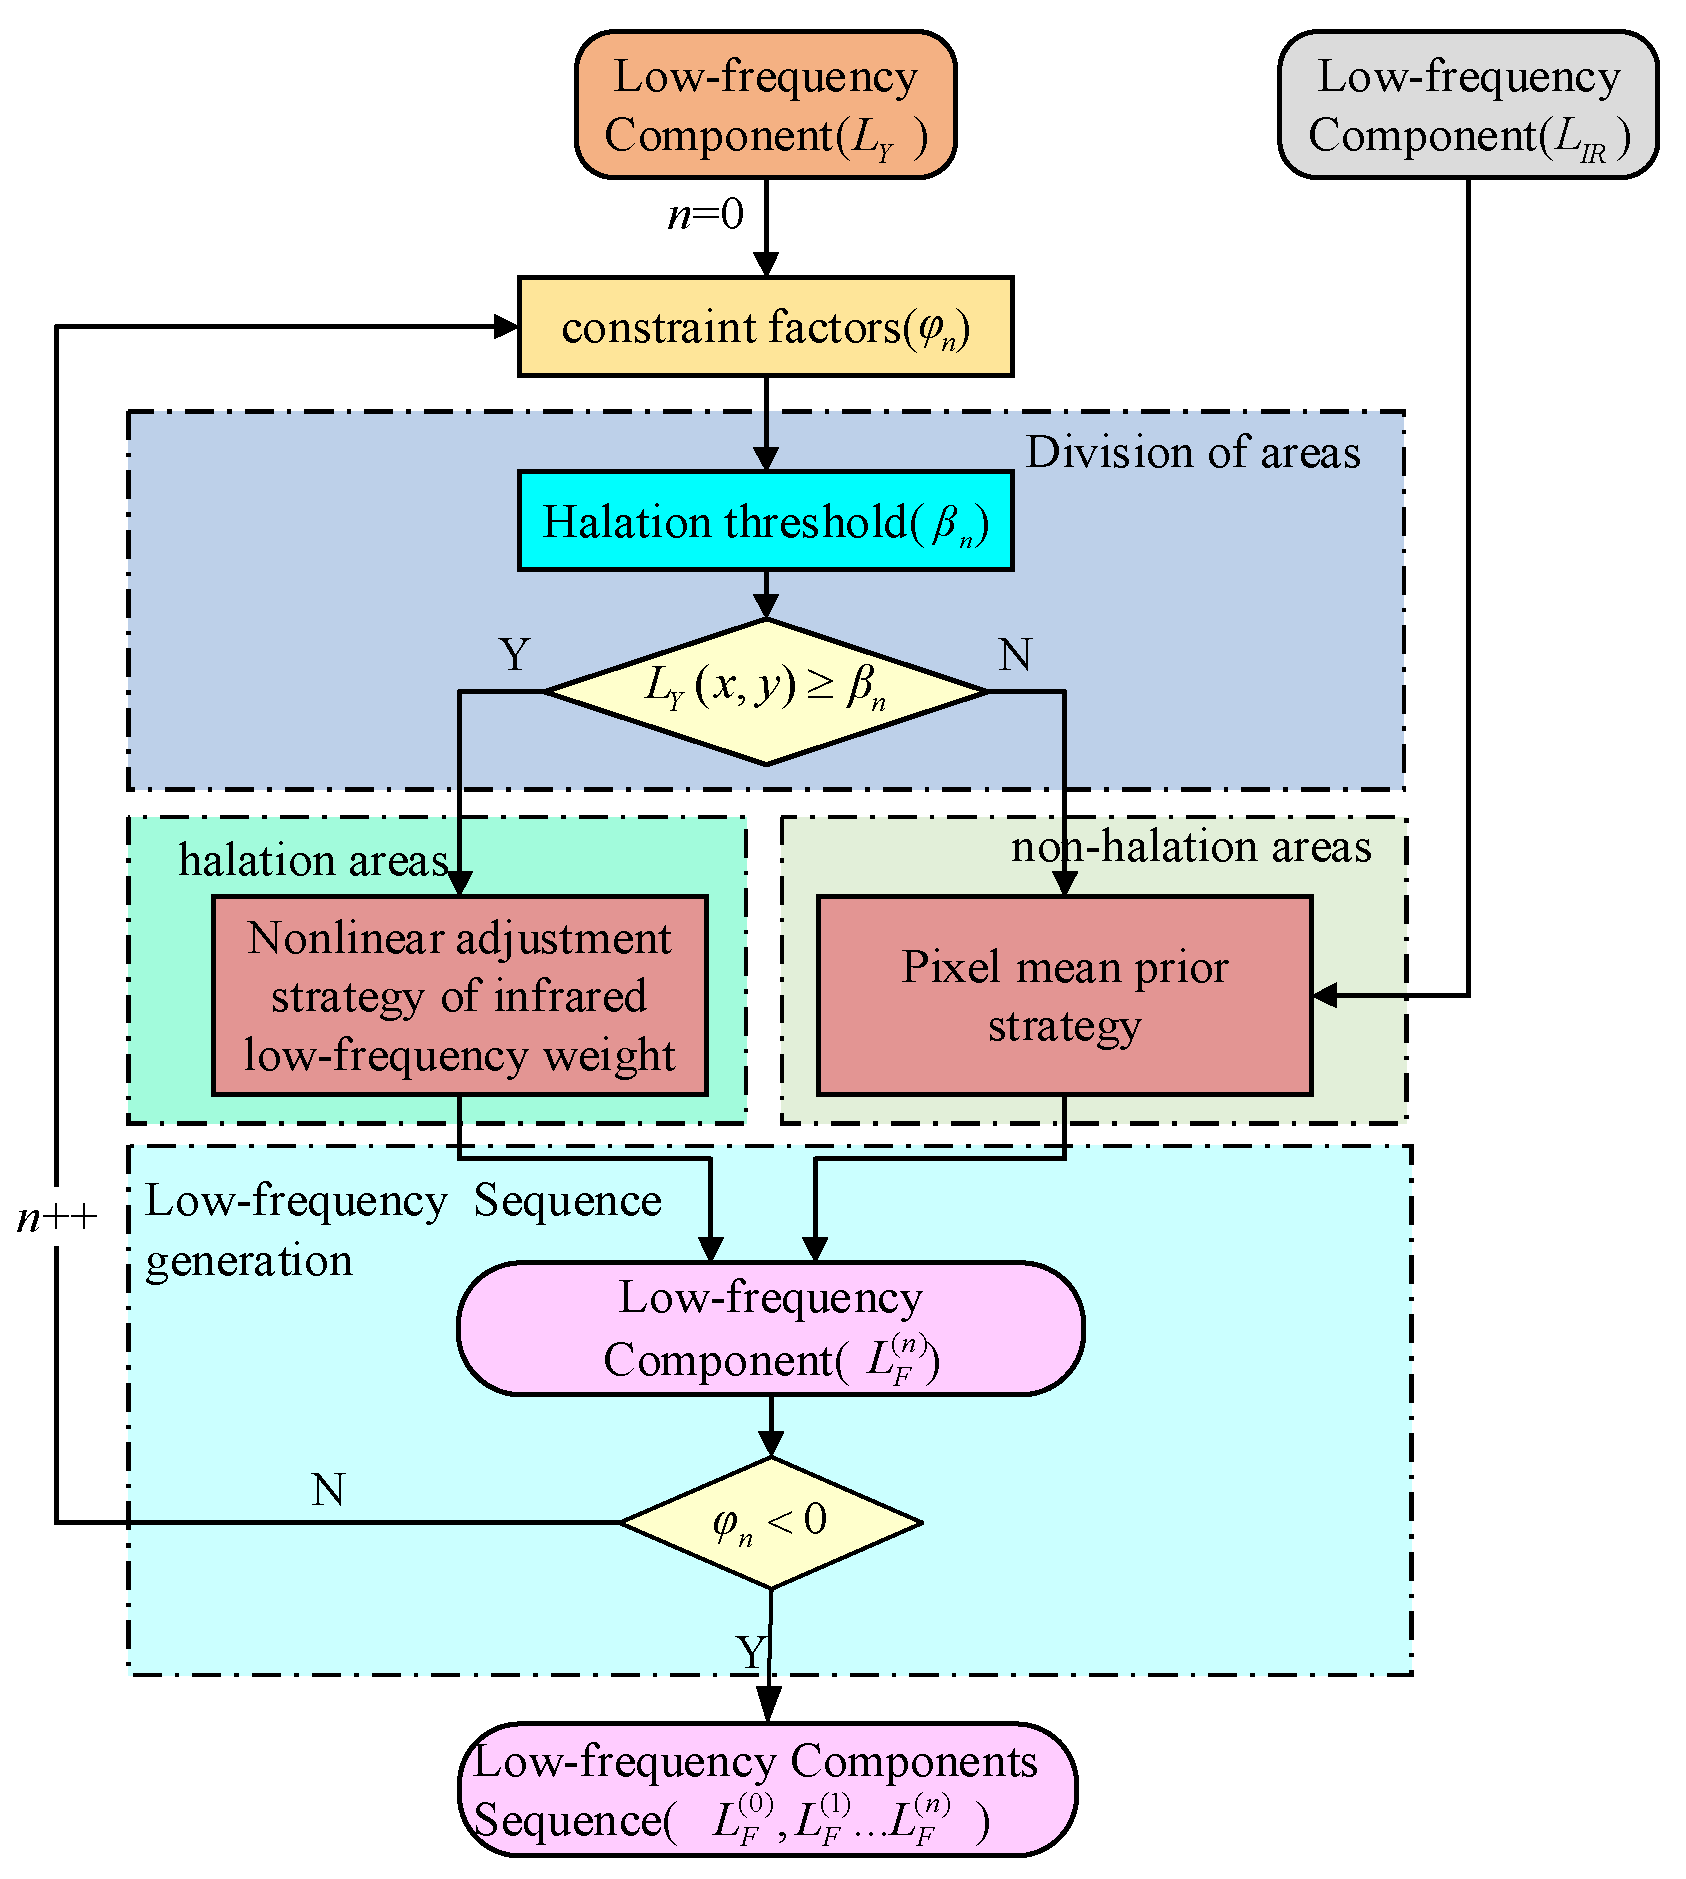
In order to address the above problems, the core idea of the algorithm in this paper is to adjust the brightness of all areas of the fusion image to the range of human visual perception so as to eliminate the high-brightness halation while retaining the high-brightness important information. In this paper, the low-frequency sequence generation model is constructed to output the low-frequency sequences of the brightness component with different halation elimination degrees, and the membership function of visual information maximization is designed to give greater weight to the areas suitable for human vision according to the illumination estimation. In this way, the obtained fusion image is more suitable for human visual perception.
Firstly, the Luminance Y, the Chrominance U, and V of the visible image are obtained by the YUV transform. Then, curvelet decomposition is used to get the low-frequency and high-frequency components of the Luminance Y and the infrared image, respectively. The obtained low-frequency components are input into the low-frequency sequence generation model to get the fused low-frequency sequences with the halation elimination degrees from small to large. The obtained high-frequency components are processed by the maximum modulus strategy to get the fused high-frequency component. The fused low-frequency sequences and the fused high-frequency component were reconstructed by curvelet transform to get the anti-halation brightness sequence YAH. The fusion weight of each component in the sequence YAH is determined according to their illumination estimation results. Then the weighted sum of the sequence YAH gets a new Luminance Y′. Finally, the Luminance Y′ and the original Chrominance U and V are fused by the inverse YUV transformation to obtain the fusion image without halation. The overall block diagram of the proposed night vision anti-halation algorithm is shown in Figure 2.

3. Realization of Night Vision Anti-Halation Algorithm

3.1. Curvelet Decomposition

Firstly, the Luminance Y of the visible image is obtained by the YUV transform [22]. Then the Luminance Y and the infrared image are decomposed by curvelet transform. The two-dimensional discrete curvelet decomposition can be expressed as [23]:
C D ( j , l , k ) = 0 t 1 , t 2 n f [ t 1 , t 2 ] φ j , l , k D [ t 1 , t 2 ] ¯
where f [t1, t2] represents the input image, φ j , l , k D [t1, t2] is the curvelet function with decomposition scale j, orientation l, and position k.
After curvelet decomposition, the low-frequency components LY and LIR, and the high-frequency components H Y j , l and H I R j , l are obtained, respectively. The subscript Y represents the luminance of the visible image, and IR represents the infrared image.

3.2. Low-Frequency Sequence Generation Model

According to Retinex theory [24], the illumination information of real scenes, such as halation, mainly exists in the low-frequency visible images, and the overall changes gently. Hence a low-frequency sequence generation model is constructed according to the low-frequency information in the luminance of the visible image and used to generate low-frequency components with different degrees of halation elimination.
The LY is divided into the halation and the non-halation areas by halation threshold. Then the low-frequency components of the two areas are generated according to the low-frequency weight adjustment strategy of the corresponding area and are weighted with the infrared low-frequency component LIR to generate the low-frequency component LF of the fusion image, then judge whether the constraint conditions are met. If not, continue to iterate to generate new low-frequency components. Stop iteration until satisfied and output the low-frequency sequences with different degrees of halation elimination. The process of the low-frequency sequence generation is shown in Figure 3.
The detailed implementation of low-frequency sequence generation can be summarized as Algorithm 1:
Algorithm 1 The detailed implementation of low-frequency sequence algorithm
Input: visible image (VI), infrared image (IR)
Initialization
[LIR, HIR] = curvelet (IR);
[LY, HY] = curvelet (VI);
n = 0;
φ0 = 255 × (1 − N*/N);
ω 0 N H = 0.3;
r = 75;
Low-frequency sequence generation
S = L ¯ I R N H / L ¯ Y N H ;
i n c r e m e n t 1 = ( 1 ω 0 N H ) / φ 0 ;
i n c r e m e n t 2 = ω 0 N H / φ 0 ;
for n in (0,…, φ0):
φn = 255 × (1 − N*/N) − n; [Equation (2)]
β n = L Y max L Y max L ¯ Y × φ n / φ 0 ; [Equation (3)]
if (LY (x, y) < βn) % pixel mean prior strategy for non-halation area
if (S ≥ 1)
ω I R N H ( n ) = ω 0 N H + n × i n c r e m e n t 1 ; [Equation (4)]
else
ω I R N H ( n ) = ω 0 N H n × i n c r e m e n t 2 ; [Equation (4)]
end
L F ( n ) ( x , y ) = ( 1 ω I R N H ( n ) ) L Y ( x , y ) + ω I R N H ( n ) L I R ( x , y ) ; [Equations (7) and (8)]
else % nonlinear adjustment strategy of infrared low-frequency weight for halation region
P = L′ (x, y);
ω I R H ( n ) = ω I R N H ( n ) + [ 1 ω I R N H ( n ) ] × e p e p e p + r e p × φ n φ 0 ; [Equation (5)]
L Y ( x , y ) = b a / L Y max β n × [ L V I ( x , y ) β n ] + a ; [Equation (6)]
end
L F ( n ) ( x , y ) = ( 1 ω I R H ( n ) ) L Y ( x , y ) + ω I R H ( n ) L I R ( x , y ) ; [Equations (7) and (8)]
end

3.2.1. Constraint Factor

The constraint factor is an important control parameter of the low-frequency sequence generation model, which affects the number of generated sequences, the division of the halation area, and the degree of halation elimination.
The higher the brightness of the visible image and the better the visual effect, the fewer the number of image sequences required to synthesize the high-quality image. That is, the synthesis of high-quality images requires fewer low-frequency components with different halation elimination degrees. On the contrary, when the visible image is dark, and the visual effect is poor, the synthesis of high-quality images often requires more images containing different degrees of information. That is, there are more low-frequency sequences requiring different halation elimination degrees. Constraint factors φn of the nth iteration is defined as:
φ n = 255 × 1 N N n
where the multiplication factor 255 is valid for only 8-bit images, N indicates the number of pixels of the LY, and N* represents the number of pixels in the LY larger than its pixel mean. n represents the number of iterations, with an initial value n = 0. In this paper, the increment of n is 1. As can be seen from Equation (2), φn decrease as n increase. When the visible image is overall brighter, the larger the N*, the smaller the φn, which means fewer low-frequency sequences are generated. On the other hand, the overall image is darker, N* is smaller, φn is bigger, which means that more low-frequency sequences are generated.

3.2.2. Division of Halation Area

It is found through experiments that the coefficient of the low-frequency component LY of luminance is significantly higher in the halation areas than in other areas. Therefore, the halation threshold is designed to divide the LY into the halation and the non-halation areas in this paper.
Since the pixel value at the junction of the two types of areas changes continuously and the boundary is inconspicuous, the idea of the halation threshold design in this paper is as follows: with the increase of iteration, the constraint factor φn decreases to generate different halation thresholds, so that the range of halation area divided is different each time, so as to better reflect (contain) the real halation boundary. The halation threshold βn generated in the nth iteration is:
β n = L Y max L Y max L ¯ Y × φ n φ 0
where L ¯ Y and Lmax Y denote the mean and maximum of pixels in the LY, respectively. φ0 is the initial constraint factor. According to Equation (3), the βn is inversely related to φn. With increasing n, φn is reduced, so βn gets larger, and the halation areas that are divided become smaller gradually.
If LY (x, y) ≥ βn, the pixel (x, y) is located in the halation area in the nth-generated low-frequency component. Otherwise, it is in the non-halation area.

3.2.3. Adjustment Strategy of Low-Frequency Weight in the Non-Halation Areas

In the generated low-frequency sequence, each low-frequency component contains different visible and infrared information in the non-halation region and tends to be the brighter one overall. Generally, the larger the low-frequency fusion weight of an image with a higher pixel mean, the better the visual effect of the fusion image. However, the weight of the fusion image is determined only by the pixel mean, which will cause some local information loss. Therefore, the generated low-frequency sequences need to contain low-frequency components with different weights. In the total number of sequences, the low-frequency component that the information of the brighter image accounts for a higher proportion should be relatively more.
According to the above idea, a pixel mean prior strategy for a non-halation area is designed. By comparing the pixel mean of LY and LIR in the non-halation areas, the brighter image is selected to generate subsequent low-frequency components, which contain progressively more information on the brighter images. The infrared low-frequency weight ω I R N H (n) at the nth iteration in the non-halation area can be expressed as:
ω I R N H ( n ) = ω 0 N H + n × 1 ω 0 N H φ 0 , L ¯ I R N H L ¯ Y N H 1 ω 0 N H n × ω 0 N H φ 0 ,     L ¯ I R L ¯ Y N H < 1
where L ¯ Y N H and L ¯ I R N H represent the pixel mean of LY and LIR in the non-halation area, respectively. ω 0 N H is the initial weight of the low-frequency coefficient in the non-halation area. After optimization, more details can be retained in the fused non-halation area when ω 0 N H is set to 0.3.

3.2.4. Adjustment Strategy of Low-Frequency Weight in the Halation Areas

In order to ensure that each component of the generated low-frequency sequence has a different halation elimination degree in the halation areas, the basic idea of low-frequency weight adjustment is as follows: the weight of LIR increases with the pixel value of LY so as to eliminate the halation better. At the critical edge of the halation, the weight of LIR changes gently so as to establish a buffer between halation and non-halation areas, to avoid light–dark splitting phenomena. When approaching the center of the halation area, LIR is assigned a larger weight to eliminate the halation completely. In addition, with the change of iteration, the curve of infrared low-frequency weight is adjusted timely to generate low-frequency components with different halation elimination degrees. Therefore, a nonlinear adjustment strategy of infrared low-frequency weight is proposed for the halation region. The infrared low-frequency weights ω I R H (n) at the nth iteration in the halation area are expressed as:
ω I R H ( n ) = ω I R N H ( n ) + [ 1 ω I R N H ( n ) ] × e p e p e p + r e p × φ n φ 0
where p is the value of pixel (x, y) in LY. The larger the p is, the larger the infrared low-frequency weight ω I R H (n) assigned to this pixel is. r is a regulating factor and is used to adjust the shape of the infrared low-frequency weight curve. The actual test shows that when r is 75, the curves of infrared low-frequency weight have a more uniform variation range under different constraint factors φn, indicating that the proposed algorithm has a better halation elimination effect and stronger universality for different scenes. When p is constant, ω I R H (n) is proportional to φn, and both of them decrease as n increases.
In order to smooth the infrared low-frequency weight from the non-halation area to the halation area, the critical halation threshold is taken as the benchmark, and the pixels of LY are mapped in the interval [a, b]. The mapped low-frequency component L Y (x, y) of luminance is:
L Y ( x , y ) = b a L Y max β n × [ L V I ( x , y ) β n ] + a
After the actual test, it is found that when a = 0 and b = 5, the infrared low-frequency weight curves have a more uniform variation range under different constraint factors φn. That is, a = 0, corresponding to the halation critical value, and b = 5, the brightest pixel in LY. The curves of ω I R H (n) are shown in Figure 4.
It is evident from Figure 4 that the curves of ω I R H (n) have consistent trends under different φn. The curves change gently near the halation threshold, then increase with the increase of L Y (x, y), and are larger when approaching the halation center. This indicates that in the fused low-frequency component, the higher the brightness of the areas in the visible image, the higher the corresponding infrared low-frequency weight, and the higher the halation elimination degree. For certain L Y (x, y), along with the increasing n, φn decreases, and ω I R H (n) is smaller, indicating that the halation elimination degree of the generated low-frequency fusion sequence is from large to small.
By replacing p in Equation (5) with L Y (x, y) in Equation (6), ω I R H (n) can be calculated.

3.2.5. Generation of Low-Frequency Sequences

From Equations (3)–(5), the infrared low-frequency weight matrix ωIR(n) at the nth iteration is defined as:
ω I R ( n ) = ω I R H ( n ) L Y ( x , y ) β n ω I R N H ( n ) L Y ( x , y ) < β n
The nth-fused low-frequency component L F ( n ) (x, y) is calculated as follows:
L F ( n ) ( x , y ) = ω I R ( n ) × L I R ( x , y ) + [ 1 ω I R ( n ) ] L Y ( x , y )
where LIR(x, y) is the value of pixel (x, y) in the infrared low-frequency component.
Determine whether φn satisfies:
φn ≤ 0
If not, continue iteration to generate a new low-frequency component. If so, the iteration ends, and all fused low-frequency components with different halation elimination degrees, i.e., L F ( 0 ) , L F ( 1 ) ,…, L F ( n ) , are output.

3.3. Generation of Anti-Halation Luminance Sequence YAH

The anti-halation luminance sequence YAH is obtained by curvelet reconstruction of fused low-frequency sequence and fused high-frequency components.
The high-frequency component contains the details and textures of the image, so the simple and effective Maximum Modulus strategy is adopted. The fused high-frequency component H F U j , l (x, y) is:
H F U j , l ( x , y ) = max { H Y j , l ( x , y ) , H I R j , l ( x , y ) }
The discrete curvelet transform in the frequency domain can be expressed as:
C D ( j , l , k ) = f ^ [ ω 1 , ω 2 ] φ ^ j , l , k D [ ω 1 , ω 2 ] ¯ ( 2 π ) 2
where f ^ [ω1, ω2] and φ ^ j,l,k[ω1, ω2] represent the input and the curvelet function in the frequency domain, respectively.
Using Equation (11), the fused high-frequency components H F j , l F are reconstructed with each component of the fused low-frequency sequence { L F ( 0 ) , L F ( 1 ) ,…, L F ( n ) }, respectively, which can obtain luminance sequences with different halation elimination degrees, i.e., { Y A H ( 0 ) , Y A H ( 1 ) ,…, Y A H ( n ) }.
Figure 5 shows the anti-halation luminance sequence YAH obtained from the visible and infrared images, as shown in Figure 1. Among them, the luminance components with high halation elimination degrees have less halation, but their high-brightness useful information is eliminated mistakenly. The luminance components with low halation elimination degrees have more halation but also retain more high-brightness useful information. Moreover, their dark areas that benefit from halation have better visual effects.

3.4. Synthesis of Anti-Halation Luminance Sequence Based on Visual Information Maximization

In order to obtain anti-halation images that are more suitable for human vision, an anti-halation luminance sequence synthesis based on visual information maximization is proposed. The illumination estimation is carried out for each component of the anti-halation luminance sequence YAH. Then, according to the results of illumination estimation, the well-exposed areas in each component are given a larger weight. Finally, the anti-halation luminance sequence is weighted to obtain a new luminance Y′ so as to generate a fusion image conforming to human visual perception.

3.4.1. Illumination Estimation

In order to obtain the illumination distribution of YAH, the multi-scale Gaussian function that has the advantage of effectively compressing dynamic range [25] is used to extract the illumination component of YAH. The multi-scale Gaussian function can be expressed as:
G ( x , y ) = μ exp ( x 2 + y 2 σ 2 )
where μ is the normalization constant, and σ is the scale factor, which determines the scope of the convolution kernel. The larger σ is, the larger the convolution range is, and the better the global characteristics of the estimated illumination component are. Conversely, the smaller the value of σ, the smaller the convolution range, and the better the local characteristics of the estimated illumination component.
In order to take into account both global and local characteristics of the illumination components, this paper uses the Gaussian function with different scales to extract different illumination components of anti-halo luminance and then a weighted sum to get a comprehensive illumination component. The illumination I(n)(x, y) corresponding to the nth anti-halation luminance Y A H ( n ) (x, y) is:
I ( n ) ( x , y ) = 1 K k = 1 K [ Y A H ( n ) ( x , y ) G k ( x , y ) ]
where Gk(x, y) represents the kth scale Gaussian function, k is the scale number, and ‘∗’ represents the convolution operation. Considering the balance between the accuracy and the computation of illumination component extraction, K is taken as 3, and the selected scale factors are 50, 150, and 200, respectively. Figure 6 shows a certain anti-halation luminance and its illumination component.

3.4.2. Membership Function of Visual Information Maximization

The anti-halation luminance sequence YAH shows that the components with low halation elimination degrees can retain the high-brightness useful information well but not enough halation elimination. For the components with a large halation elimination degree, the halation information is less, but the high-brightness useful information is mistakenly eliminated. Therefore, a membership function of visual information maximization is designed by taking advantage of the information complementarity among the components with different halation elimination degrees. The pixels with good visual effects are given a larger weight in the anti-halation luminance component, which makes all areas of the synthesized new luminance Y′ suitable for human vision.
A simple indicator of good exposure of a pixel is that the pixel value is close to the median gray level of the luminance. The closer the approach, the more the exposure is consistent with human visual perception. Hence, a triangle membership function of visual information maximization is proposed. Its domain and range are [0, 255] and [0, 1], respectively. Taking the median of the domain as the axis of symmetry, the pixel closer to 128 is a greater weight. The membership function is shown in Figure 7.

3.4.3. Anti-Halation Luminance Sequence Synthesis

The weight matrix Wn(x, y) of the nth component in the anti-halation sequence YAH is:
W n ( x , y ) = I ( n ) ( x , y ) 128 I ( n ) ( x , y ) < 128 I ( n ) ( x , y ) 128 255 128 I ( n ) ( x , y ) 128
The new anti-halation luminance Y′ is defined as:
Y = n = 1 M W n ( x , y ) × Y AH ( n ) ( x , y ) n = 1 M W n ( x , y )
where M represents the number of components in YAH.
Finally, the YUV inverse transform [26] is performed on the new luminance Y′ and the original chrominance U and V, which can obtain the night vision anti-halation fusion image.

4. Experimental Results and Discussion

To verify the effectiveness of the proposed algorithm, the visible and infrared images are collected on four typical halation scenes covering most cases of night driving, i.e., small halation of residential road, large halation of residential road, large halation of urban trunk road and large halation of rural road. The visible and infrared images are acquired by the visible camera Basler acA1280-60gc and the far infrared camera Gobi-640-GigE. The experiments are performed using an Intel(R) Core (TM) i7-10875H CPU @2.30GHz, NVIDIA GeForce RTX2060, and Windows 10 64-bit operating system. The simulation software is MATLAB2020a. The size of input visible and infrared images is 640 × 480.
The proposed algorithm is compared with IGFF [12], AP-SPCNN [13], FPDE [14], RE-IFS [15], TT-CSR [16], YUVWT [17], IHSDCT [18], and the experimental results are objectively evaluated by the adaptive partition quality evaluation method of night vision anti-halation fusion image [27].
In the halation area, the degree of halation elimination (DHE) is used to evaluate the anti-halation effect. The larger the DHE is, the more complete the halation elimination. In the non-halation area, the average gradient (AG), spatial frequency (SF), edge intensity (EI), gray mean (μ), and edge preservation (QAB/F) are selected for visual effect evaluation.
AG reflects the rate of change of the image detail contrast. The larger the AG, the clearer the non-halation area in the image. SF reflects the change of the image spatial domain, and the larger its value, the more detailed features the image has. EI reflects the amplitude of the image edge gradient, and the larger its value, the more obvious the image edge detail. μ represents the average gray of the image, and the larger its value, the higher the brightness of non-halation areas. QAB/F reflects the degree to which the fusion image maintains the edge of the original image, and the larger its value, the better the edge preservation.

4.1. Experimental Scenes and Parameters

The original visible and infrared images of each scene are shown in Figure 8. There are six parameters, i.e., n, ω 0 N H , r, [a, b], and σ, that affect the algorithm performance. The description and value of experimental parameters are shown in Table 1.

4.2. Scene 1: Small Halation of Residential Road

There is weak light scattered by buildings on residential roads at night. When the opposite cars are far away, the halation area formed by the headlights is smaller. In the visible image, the halation is weak, and other information is difficult to observe except the lane lines and vehicle contours illuminated by headlights. In the infrared image, the contours of pedestrians, cars, and buildings are clear.
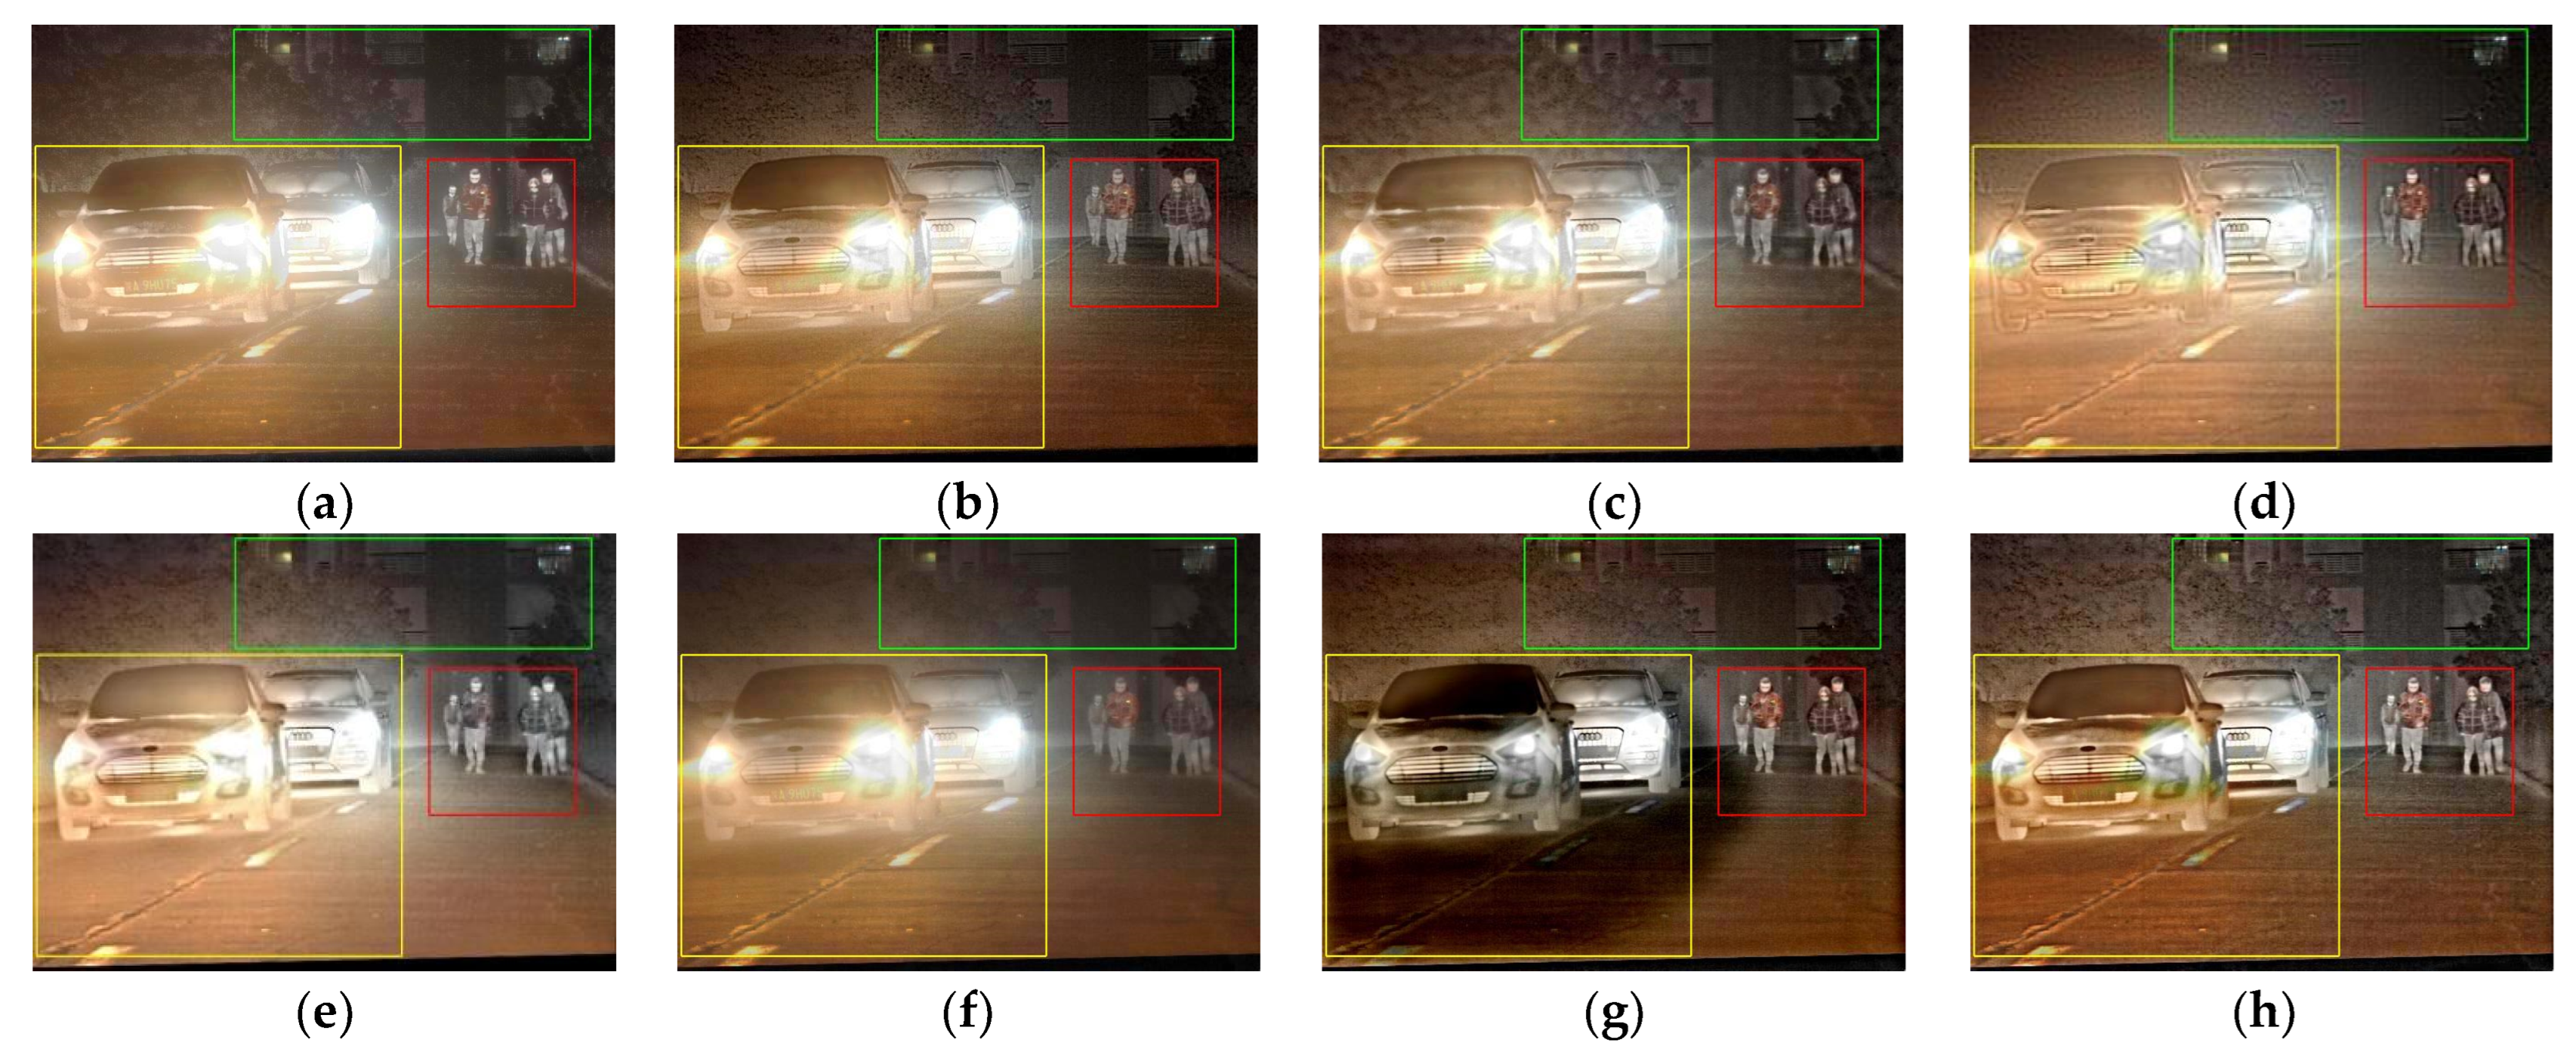
The fusion images of different algorithms in Scene 1 are shown in Figure 9. Where the yellow-framed, red-framed, and green-framed subregions are high-brightness information, pedestrian, and background, respectively. The zoomed-in images of subregions for different fusion images are shown in Figure 10. The objective evaluation indexes of the fusion images are shown in Table 2.
It can be seen from Figure 9 and Figure 10 and Table 2 that the lane lines are highly retained by IGFF, FPDE, TT-CSR, and YUVWT algorithms. However, the halation elimination is incomplete, and the background is relatively dark. The IGFF algorithm effectively improves the saliency of pedestrians, but there is local over-exposure. In FPDE and YUVWT fusion images, the pedestrians are inconspicuous; TT-CSR effectively improves the brightness of the background buildings, but the halation around the vehicles is still obvious.
In contrast, AP-SPCNN, RE-IFS, IIHSDCT, and the proposed algorithm retain the high-brightness lane lines while eliminating the high-brightness halation. Where AP-SPCNN, IIHSDCT, and the proposed algorithm effectively improve the background luminance. However, the contour of pedestrians is blurred by AP-SPCNN, and there are obvious light–dark alternating shadows around the headlights by IIHSDCT, resulting in the loss of local textures and details. RE-IFS enhances the contours of vehicles and pedestrians, but the background brightness is too low.
The overall brightness of the fusion image obtained by the proposed algorithm is good, so μ is the highest. In addition, the pedestrians are remarkable. The reason is that the low-frequency sequence generation model constructed in the paper improves the weight of the brighter image participating in the fusion.
The proposed algorithm can better retain details such as edges, so AG, SF, EI, and QAB/F are higher than that of other algorithms. The reason is that the curvelet transform used in this paper has strong anisotropy, which can better retain detailed features.
Given the above, in Scene 1, compared with the other seven algorithms, the proposed algorithm improves the brightness of pedestrians, roads, and backgrounds effectively and better solves the problem of image acquisition in the low-illumination scene.

4.3. Scene 2: Large Halation of Residential Road

When the oncoming cars are close on the residential road at night, the halation area formed by the headlights is larger. In the visible image, the illumination distribution is uneven, and the halation is dazzling. In addition, some useful information, such as lane lines, that benefit from the halation becomes more obvious. In the infrared image, the contours of vehicles, pedestrians, and buildings are clear, but some important information, such as lane lines, is lost.
The fusion images and the corresponding zoomed-in images of subregions for different algorithms in Scene 2 are shown in Figure 11 and Figure 12, respectively. The objective evaluation indexes of the fusion images are shown in Table 3.
As can be seen from Figure 11 and Figure 12 and Table 3, the lane lines are highly retained by IGFF and YUVWT, but the halation elimination is incomplete. Among them, IGFF improves the brightness of the background and the saliency of pedestrians, but there is an over-exposure phenomenon. The contours of trees and cars are blurred in the YUVWT fusion image, and the background brightness is low.
The halation elimination of the AP-SPCNN, FPDE, and TT-CSR fusion images is insufficient, resulting in the overall brightness being higher. So, μ is high, but DHE is low. The contrast of the image is improved in the AP-SPCNN fusion image, but the contour of the trees is not clear. The texture of cars and pedestrians is clear in the FPDE fusion image, but the background noise is greater, and the smoothness is low. The fused image by TT-CSR has higher background brightness and better visual effect, but the color and textures are missing.
RE-IFS and IIHSDCT completely eliminate the halation. However, after RE-IFS fusion, the background is blurred, and the local details are lost, resulting in poor visual effects. Due to excessive brightness elimination, the parts of lane lines are incorrectly eliminated by IIHSDCT, resulting in a falsely high DHE. At the critical areas of halation and non-halation, the light–dark splitting phenomenon is serious, and the visual effect is poor. In addition, the large-area shadow causes μ to be too low.
In the fusion image obtained by the proposed algorithm, the range of halation elimination is well-controlled, and the overall brightness is moderate. Its DHE is second only to that of IIHSDCT, and other indexes are optimal.
Given the above, in Scene 2, the proposed algorithm reasonably controls the range of halation elimination. The contours of cars and pedestrians are clearer, and the overall visual effect is better. The problem of dazzling halation of low illumination scenes is better solved.

4.4. Scene 3: Large Halation of Urban Trunk Road

There are street lamps and lights from buildings besides headlights on urban trunk roads at night. The driver usually drives with a dipped headlight. When the oncoming car is closer, the halation is more serious in the visible image, but the lane lines and front pedestrians become more significant. In the infrared image, the contours of pedestrians and vehicles are clear, but the information on road conditions is still lacking.
The fusion images and the corresponding zoomed-in images of subregions for different algorithms in Scene 3 are shown in Figure 13 and Figure 14, respectively. The objective evaluation indexes of the fusion images are shown in Table 4.
The effect of halation elimination is poor in IGFF, FPDE, and YUVWT fusion images, resulting in dazzling near the headlights and lower DHE. In the IGFF fusion image, the brightness of the background increases obviously, but the outline of buildings and street lamps is blurred, and the contrast is low. In the YUVWT and FPDE fusion images, the background is dark, and the saliency of pedestrians is low.
Other algorithms have a good effect on halation elimination. However, IIHSDCT eliminates brightness excessively, so DHE is the highest. In addition, the light–dark splitting around the headlights is serious, resulting in local information being obliterated, and the overall brightness is reduced.
In the fusion images of AP-SPCNN, RE-IFS, and TT-CSR, there are still local high-brightness spots around the headlights, and the background of RE-IFS is dark. Compared with RE-IFS, the TT-CSR algorithm can effectively improve the background brightness, but the color of pedestrians and the textures of trees are missing.
Compared with AP-SPCNN, the proposed algorithm can retain the lane lines better, and the fusion image obtained has a higher brightness. μ is moderate and other indexes are optimal.

4.5. Scene 4: Large Halation of Rural Road

The rural roads are narrow and lack lighting equipment. The driver needs to drive with a high beam. In the visible image, it is difficult to observe the dark area. In the infrared images, the contours of pedestrians and vehicles are clear, but the information of road conditions and background are seriously missing.
The fusion images and the corresponding zoomed-in images of subregions for different algorithms in Scene 4 are shown in Figure 15 and Figure 16, respectively. The objective evaluation indexes of the fusion images are shown in Table 5.
AP-PCNN, RE-IFS, TT-CSR, IIHSDCT, and the proposed algorithm have better halation elimination effects. However, the saliency of pedestrians is low, and the edge contour is fuzzy in the AP-PCNN fusion image. The brightness of RE-IFS is low, and the retention of useful information is insufficient. The overall brightness of TT-CSR is higher than that of RE-IFS, but the contours of pedestrians are blurred. IIHSDCT eliminates halation unreasonably, resulting in obvious light–dark splitting and poor visual effects around the headlights. The proposed algorithm retains only a small amount of background information and has optimal indexes, indicating that it can solve the problem of a dark background and missing road details in the halation scene on rural roads effectively.

4.6. Algorithm Complexity Evaluation

The time complexity (T(n)) and space complexity (S(n)) are used to evaluate the complexity of different algorithms. The results are shown in Table 6.
It can be seen from Table 6 that except YUVWT, T(n) and S(n) of other algorithms are the same. However, from the subjective and objective evaluation of the fusion images, the proposed algorithm has higher retention for high-brightness useful information while eliminating the halation. The fusion image obtained by the algorithm in the paper has richer background textures and details and stronger pedestrian saliency. So, the proposed algorithm is more suitable for complex nighttime halation scenes.

5. Discussion

Through the experimental analysis of four typical halation scenes, it can be known that YUVWT, IGFF, and FPDE algorithms cannot reduce halation interference effectively. The AP-SPCNN fusion image has a good overall visual effect but low brightness. RE-IFS eliminates halation completely, but the background is too dark, and the retained details are less. The fusion images of TT-CSR have higher brightness. However, the retention of color and contours is low, and the saliency of key targets is poor. The IIHSDCT algorithm can eliminate halation completely and improve clarity effectively, but there exists mis-elimination of high-brightness useful information and light–dark splitting phenomenon. The proposed algorithm has better applicability for different scenes. It can effectively improve the brightness and clarity of fusion images in low-illumination scenes and reasonably eliminates halation in strong halation scenes.
To evaluate the visual effects of fusion images of different algorithms comprehensively, the objective indexes of six algorithms under four scenes are drawn into the radar chart, as shown in Figure 17.
It can be seen from Figure 17 that indexes of eight algorithms are greatly different, so the shape of the wrap curves drawn in radar charts is quite different. The wrapping areas of the proposed algorithm are the largest in four scenes, indicating that the algorithm in this paper can eliminate halation better and improve image quality more effectively than the other seven algorithms.

6. Conclusions

Aiming at the problems of the existing night vision anti-halation algorithms, such as the mis-eliminate of high-brightness important information and poor universality of different scenes, this paper proposes a night vision anti-halation algorithm based on low-frequency sequence generation.
According to the low-frequency component of luminance, the constructed low-frequency sequence generation model can adjust infrared low-frequency weights in the halation area nonlinearly, which ensures that each component in the generated low-frequency sequence has a different halation elimination degree. The designed mean prior adjustment strategy in the non-halation area ensures that each component has a better visual effect in the generated low-frequency sequence.
The designed membership function of visual information maximization can assign large weights to the areas suitable for human vision in the image sequence, which ensures that the fusion image has a better visual effect.
The experimental results show that the proposed algorithm can effectively eliminate halation under the premise of retaining high-brightness important information, and the fusion image has a good visual effect and high universality for different night halation scenes. The algorithm in this paper can also provide a solution to the halation problem in similar low-illuminance scenes with strong backlight.

Author Contributions

Conceptualization, Q.G.; methodology, Q.G. and J.L.; software, Q.G. and J.L.; validation, J.L. and H.W.; writing—original draft preparation, Q.G.; writing—review and editing, J.L. and H.W. All authors have read and agreed to the published version of the manuscript.

Funding

This work was supported by the National Natural Science Foundation of China under grant 62073256 and the Key Research and Development Project of Shaanxi Province under grant 2019GY-094.

Data Availability Statement

The datasets generated during this study are available from the corresponding author upon reasonable request.

Conflicts of Interest

The authors declare no conflict of interest.

References

  1. Wang, Y.; Chen, Q. Case Study of road rage incidents resulting from the illegal use of high beams. Transp. Res. Interdiscip. Perspect. 2020, 7, 237–244. [Google Scholar] [CrossRef]
  2. Mårsell, E.; Boström, E.; Harth, A.; Losquin, A.; Guo, C.; Cheng, Y.-C.; Lorek, E.; Lehmann, S.; Nylund, G.; Stankovski, M.; et al. Spatial control of multiphoton electron excitations in In As nanowires by varying crystal phase and light polarization. Nano Lett. 2017, 18, 907–915. [Google Scholar] [CrossRef] [PubMed]
  3. Ashiba, H.I. Super-efficient enhancement algorithm for infrared night vision imaging system. Multimed. Tools Appl. 2020, 80, 9721–9747. [Google Scholar] [CrossRef]
  4. Yuan, Y.; Shen, Y.; Peng, J.; Wang, L.; Zhang, H. Defogging Technology Based on Dual-Channel Sensor Information Fusion of Near-Infrared and Visible Light. J. Sens. 2020, 2020, 8818650. [Google Scholar] [CrossRef]
  5. Ashiba, H.I. Dark infrared night vision imaging proposed work for pedestrian detection and tracking. Multimed. Tools Appl. 2021, 80, 25823–25849. [Google Scholar] [CrossRef]
  6. Bosiers, J.; Kleimann, A.; van Kuijk, H.; Le Cam, L.; Peek, H.; Maas, J.; Theuwissen, A. Frame transfer CCDs for digital still cameras: Concept, design and evaluation. IEEE T. Electron. Dev. 2002, 49, 377–386. [Google Scholar] [CrossRef]
  7. Wang, J.; Gao, Y.; LEI, Z. Research of auto anti-blooming method based on double CCD image sensor. Chin. J. Sens. Actuators 2007, 20, 1053–1056. [Google Scholar]
  8. Yang, Z.; Chen, Y.; Le, Z.; Ma, Y. GANFuse: A novel multi-exposure image fusion method based on generative adversarial networks. Neural Comput. Appl. 2020, 33, 6133–6145. [Google Scholar] [CrossRef]
  9. Mo, Y.; Kang, X.; Duan, P.; Sun, B.; Li, S. Attribute filter based infrared and visible image fusion. Inform. Fusion. 2021, 75, 41–54. [Google Scholar] [CrossRef]
  10. Hu, H.-M.; Wu, J.; Li, B.; Guo, Q.; Zheng, J. An adaptive fusion algorithm for visible and infrared videos based on entropy and the cumulative distribution of gray levels. IEEE T. Multimed. 2017, 19, 2706–2719. [Google Scholar] [CrossRef]
  11. Bai, B.; Li, J. Multi-exposure image fusion based on attention mechanism. Acta Photonica Sin. 2022, 51, 344–355. [Google Scholar] [CrossRef]
  12. Tong, Y.; Chen, J. Infrared and Visible Image Fusion Under Different Illumination Conditions Based on Illumination Effective Region Map. IEEE Access 2019, 7, 151661–151668. [Google Scholar] [CrossRef]
  13. Zhang, L.; Zeng, G.; Wei, J.; Xuan, Z. Multi-Modality Image Fusion in Adaptive-Parameters SPCNN Based on Inherent Characteristics of Image. IEEE Sens. J. 2020, 20, 11820–11827. [Google Scholar] [CrossRef]
  14. Gao, X.; Liu, G.; Xiao, G.; Bavirisetti, D.P.; Shi, K. Fusion Algorithm of Infrared and Visible Images Based on FPDE. Acta Autom. Sin. 2020, 46, 796–804. [Google Scholar] [CrossRef]
  15. Xing, X.; Luo, C.; Zhou, J.; Yan, M.; Liu, C.; Xu, T. Combining Regional Energy and Intuitionistic Fuzzy Sets for Infrared and Visible Image Fusion. Sensors 2021, 21, 7813. [Google Scholar] [CrossRef]
  16. Feng, X.; Fang, C.; Lou, X.; Hu, K. Research on Infrared and Visible Image Fusion Based on Tetrolet Transform and Convolution Sparse Representation. IEEE Access 2021, 9, 23498–23510. [Google Scholar] [CrossRef]
  17. Guo, Q.; Dong, L.; Li, D. Vehicles anti-halation system based on infrared and visible images fusion. Infrared Laser Eng. 2017, 46, 171–176. [Google Scholar] [CrossRef]
  18. Guo, Q.; Wang, Y.; Li, H. Anti-halation method of visible and infrared image fusion based on improved IHS-Curvelet transform. Infrared Laser Eng. 2019, 47, 440–448. [Google Scholar] [CrossRef]
  19. Mohammed, S.A.; Abdulrahman, A.A.; Tahir, F.S. Emotions Students’ Faces Recognition using Hybrid Deep Learning and Discrete Chebyshev Wavelet Transformations. Int. J. Math. Comput. Sci. 2022, 17, 1405–1417. [Google Scholar]
  20. Li, J.; Zhu, J.; Li, C.; Chen, X.; Yang, B. CGTF: Convolution-Guided Transformer for Infrared and Visible Image Fusion. IEEE Trans. Instrum. Meas. 2022, 71, 5012314. [Google Scholar] [CrossRef]
  21. Li, M.; Xu, D.; Zhang, D.; Zou, J. The seeding algorithms for spherical k-means clustering. J. Glob. Optim. 2020, 76, 695–708. [Google Scholar] [CrossRef]
  22. Wen, X.; Pan, Z.; Hu, Y.; Liu, J. Generative Adversarial Learning in YUV Color Space for Thin Cloud Removal on Satellite Imagery. Remote Sens. 2021, 13, 1079. [Google Scholar] [CrossRef]
  23. Dash, S.; Verma, S.; Kavita; Jhanjhi, N.Z.; Masud, M.; Baz, M. Curvelet Transform Based on Edge Preserving Filter for Retinal Blood Vessel Segmentation. Comput. Mater. Contin. 2021, 71, 2459–2476. [Google Scholar] [CrossRef]
  24. Chen, F.; Zhu, Y.; Muratova, G.V. Two-step modulus-based matrix splitting iteration methods for retinex problem. Numer. Algorithms 2021, 88, 1989–2005. [Google Scholar] [CrossRef]
  25. Zhang, W.; Sun, C. Corner Detection Using Second-Order Generalized Gaussian Directional Derivative Representations. IEEE Trans. Pattern Anal. 2021, 43, 1213–1224. [Google Scholar] [CrossRef] [PubMed]
  26. Gao, G.; Lai, H.; Liu, Y.; Wang, L.; Jia, Z. Sandstorm image enhancement based on YUV space. Optik 2021, 226, 165659. [Google Scholar] [CrossRef]
  27. Guo, Q.; Chai, G.; Li, H. Quality evaluation of night vision anti-halation fusion image based on adaptive partition. J. Electron. Inf. Technol. 2019, 42, 1750–1757. [Google Scholar]
Figure 1. The original images, fusion image, and the clustering map of visible images in the typical night halation scene. (a) Visible image, (b) infrared image, (c) fusion image, and (d) clustering map.
Mathematics 11 02237 g001
Figure 2. The overall block diagram of the proposed night vision anti-halation algorithm.
Mathematics 11 02237 g002
Figure 3. The process of the low-frequency sequence generation.
Mathematics 11 02237 g003
Figure 4. The relation of ω I R H (n) with n.
Mathematics 11 02237 g004
Figure 5. Anti-halation luminance sequence. (a) The component with the highest halation elimination degree; (b) The partial intermediate components of the sequence; (c) The component with the lowest halation elimination degree.
Mathematics 11 02237 g005
Figure 6. Anti-halation luminance and its illumination component. (a) Luminance component and (b) illumination component.
Mathematics 11 02237 g006
Figure 7. Membership function.
Mathematics 11 02237 g007
Figure 8. The original visible and infrared images. (a) Scene 1: small halation of residential road; (b) Scene 2: large halation of residential road; (c) Scene 3: large halation of urban trunk road; (d) Scene 4: large halation of rural road.
Mathematics 11 02237 g008
Figure 9. The fusion images of different algorithms in Scene 1. (a) IGFF; (b) AP-SPCNN; (c) FPDE; (d) RE-IFS; (e) TT-CSR; (f) YUVWT; (g) IIHSDCT; (h) Ours.
Mathematics 11 02237 g009
Figure 10. The zoomed-in images of subregions for different fusion images in Scene 1. (a) IGFF; (b) AP-SPCNN; (c) FPDE; (d) RE-IFS; (e) TT-CSR; (f) YUVWT; (g) IIHSDCT; (h) Ours; (i) high-brightness region; (j) pedestrians; (k) background.
Mathematics 11 02237 g010
Figure 11. The fusion images of different algorithms in Scene 2. (a) IGFF; (b) AP-SPCNN; (c) FPDE; (d) RE-IFS; (e) TT-CSR; (f) YUVWT; (g) IIHSDCT; (h) Ours.
Mathematics 11 02237 g011
Figure 12. The zoomed-in images of subregions for different fusion images in Scene 2. (a) IGFF; (b) AP-SPCNN; (c) FPDE; (d) RE-IFS; (e) TT-CSR; (f) YUVWT; (g) IIHSDCT; (h) Ours; (i) high-brightness region; (j) pedestrians; (k) background.
Mathematics 11 02237 g012
Figure 13. The fusion images of different algorithms in scene 3. (a) IGFF; (b) AP-SPCNN; (c) FPDE; (d) RE-IFS; (e) TT-CSR; (f) YUVWT; (g) IIHSDCT; (h) Ours.
Mathematics 11 02237 g013
Figure 14. The zoomed-in images of subregions for different fusion images in Scene 3. (a) IGFF; (b) AP-SPCNN; (c) FPDE; (d) RE-IFS; (e) TT-CSR; (f) YUVWT; (g) IIHSDCT; (h) Ours; (i) high-brightness region; (j) pedestrians; (k) background-building; (l) background-tree.
Mathematics 11 02237 g014
Figure 15. The fusion images of different algorithms in Scene 4. (a) IGFF; (b) AP-SPCNN; (c) FPDE; (d) RE-IFS; (e) TT-CSR; (f) YUVWT; (g) IIHSDCT; (h) Ours.
Mathematics 11 02237 g015
Figure 16. The zoomed-in images of subregions for different fusion images in Scene 4. (a) IGFF; (b) AP-SPCNN; (c) FPDE; (d) RE-IFS; (e) TT-CSR; (f) YUVWT; (g) IIHSDCT; (h) Ours; (i) high-brightness region; (j) pedestrians; (k) background.
Mathematics 11 02237 g016
Figure 17. Radar charts of the evaluation indexes of anti-halation fusion images under different halation scenes. (a) Scene 1; (b) Scene 2; (c) Scene 3; (d) Scene 4.
Mathematics 11 02237 g017
Table 1. The description and value of experimental parameters.
ParameterDescriptionValue
nThe number of iterations[0, φ0 + 1]
ω 0 N H The minimum infrared low-frequency weight in the non-halation area0.3
rThe regulating factor of infrared low-frequency weight in the halation area75
[a, b]The mapping interval of luminance low-frequency component LY[0, 5]
σThe scale factor of the Gaussian function50, 150, 200
Table 2. Objective indicators of fusion images of halation in Scene 1.
AlgorithmDHEμAGSFEIQAB/F
IGFF0.45368.4865.00317.32047.1060.343
AP-SPCNN0.46961.5075.74016.30555.5200.411
FPDE0.43948.1676.86319.97664.3620.429
RE-IFS0.50768.3388.43922.69181.7030.497
TT-CSR0.45178.1057.91521.47976.6600.504
YUVWT0.46457.1982.86111.82929.4390.247
IIHSDCT0.51667.4027.39620.77670.4700.502
Ours0.59584.5658.76523.55584.4910.508
Bold represents the maximum value.
Table 3. Objective indicators of fusion images of halation in Scene 2.
AlgorithmDHEμAGSFEIQAB/F
IGFF0.489108.5773.56316.55236.2810.283
AP-SPCNN0.551111.5993.73816.41738.6720.263
FPDE0.561105.8334.31217.40443.0990.318
RE-IFS0.396112.1675.89521.35756.4680.493
TT-SR0.456117.4765.71321.97457.5080.511
YUVWT0.454105.2432.96015.09830.5530.252
IIHSDCT0.78677.0285.69318.84854.2130.528
Ours0.7131109.9446.80322.33367.9720.576
Bold represents the maximum value.
Table 4. Objective indicators of fusion images of halation in Scene 3.
AlgorithmDHEμAGSFEIQAB/F
IGFF0.16872.7855.95224.03460.4900.327
AP-SPCNN0.20969.1425.34721.67055.6370.299
FPDE0.12948.7195.24222.01652.2500.264
RE-IFS0.33761.7977.83126.81669.9830.613
TT-CSR0.34168.7107.65328.42968.2030.593
YUVWT0.20761.7063.60718.62337.8350.105
IIHSDCT0.75457.9208.08326.01082.5000.659
Ours0.66162.4889.52929.96097.6500.661
Bold represents the maximum value.
Table 5. Objective indicators of fusion images of halation in Scene 4.
AlgorithmDHEμAGSFEIQAB/F
IGFF0.55638.1722.94416.12630.7400.311
AP-SPCNN0.59934.6153.07714.11332.7050.331
FPDE0.58933.3912.88814.27630.1310.351
RE-IFS0.50139.2803.68517.07633.7170.493
TT-CSR0.51839.7943.51816.98433.1800.477
YUVWT0.45635.0362.37514.20924.8370.132
IIHSDCT0.68136.2843.55916.61237.4390.510
Ours0.69838.9483.82817.37040.2830.521
Bold represents the maximum value.
Table 6. The complexity of different algorithms.
AlgorithmT(n)S(n)
IGFFO (n2)O (n)
AP-SPCNNO (n2)O (n)
FPDEO (n2)O (n)
RE-IFSO (n2)O (n)
TT-CSRO (n2)O (n)
YUVWTO (n)O (1)
IIHSDCTO (n2)O (n)
OURSO (n2)O (n)
Disclaimer/Publisher’s Note: The statements, opinions and data contained in all publications are solely those of the individual author(s) and contributor(s) and not of MDPI and/or the editor(s). MDPI and/or the editor(s) disclaim responsibility for any injury to people or property resulting from any ideas, methods, instructions or products referred to in the content.

