
Constitutive Modeling of Normally and Over-Consolidated Clay with a High-Order Yield Function

Abstract
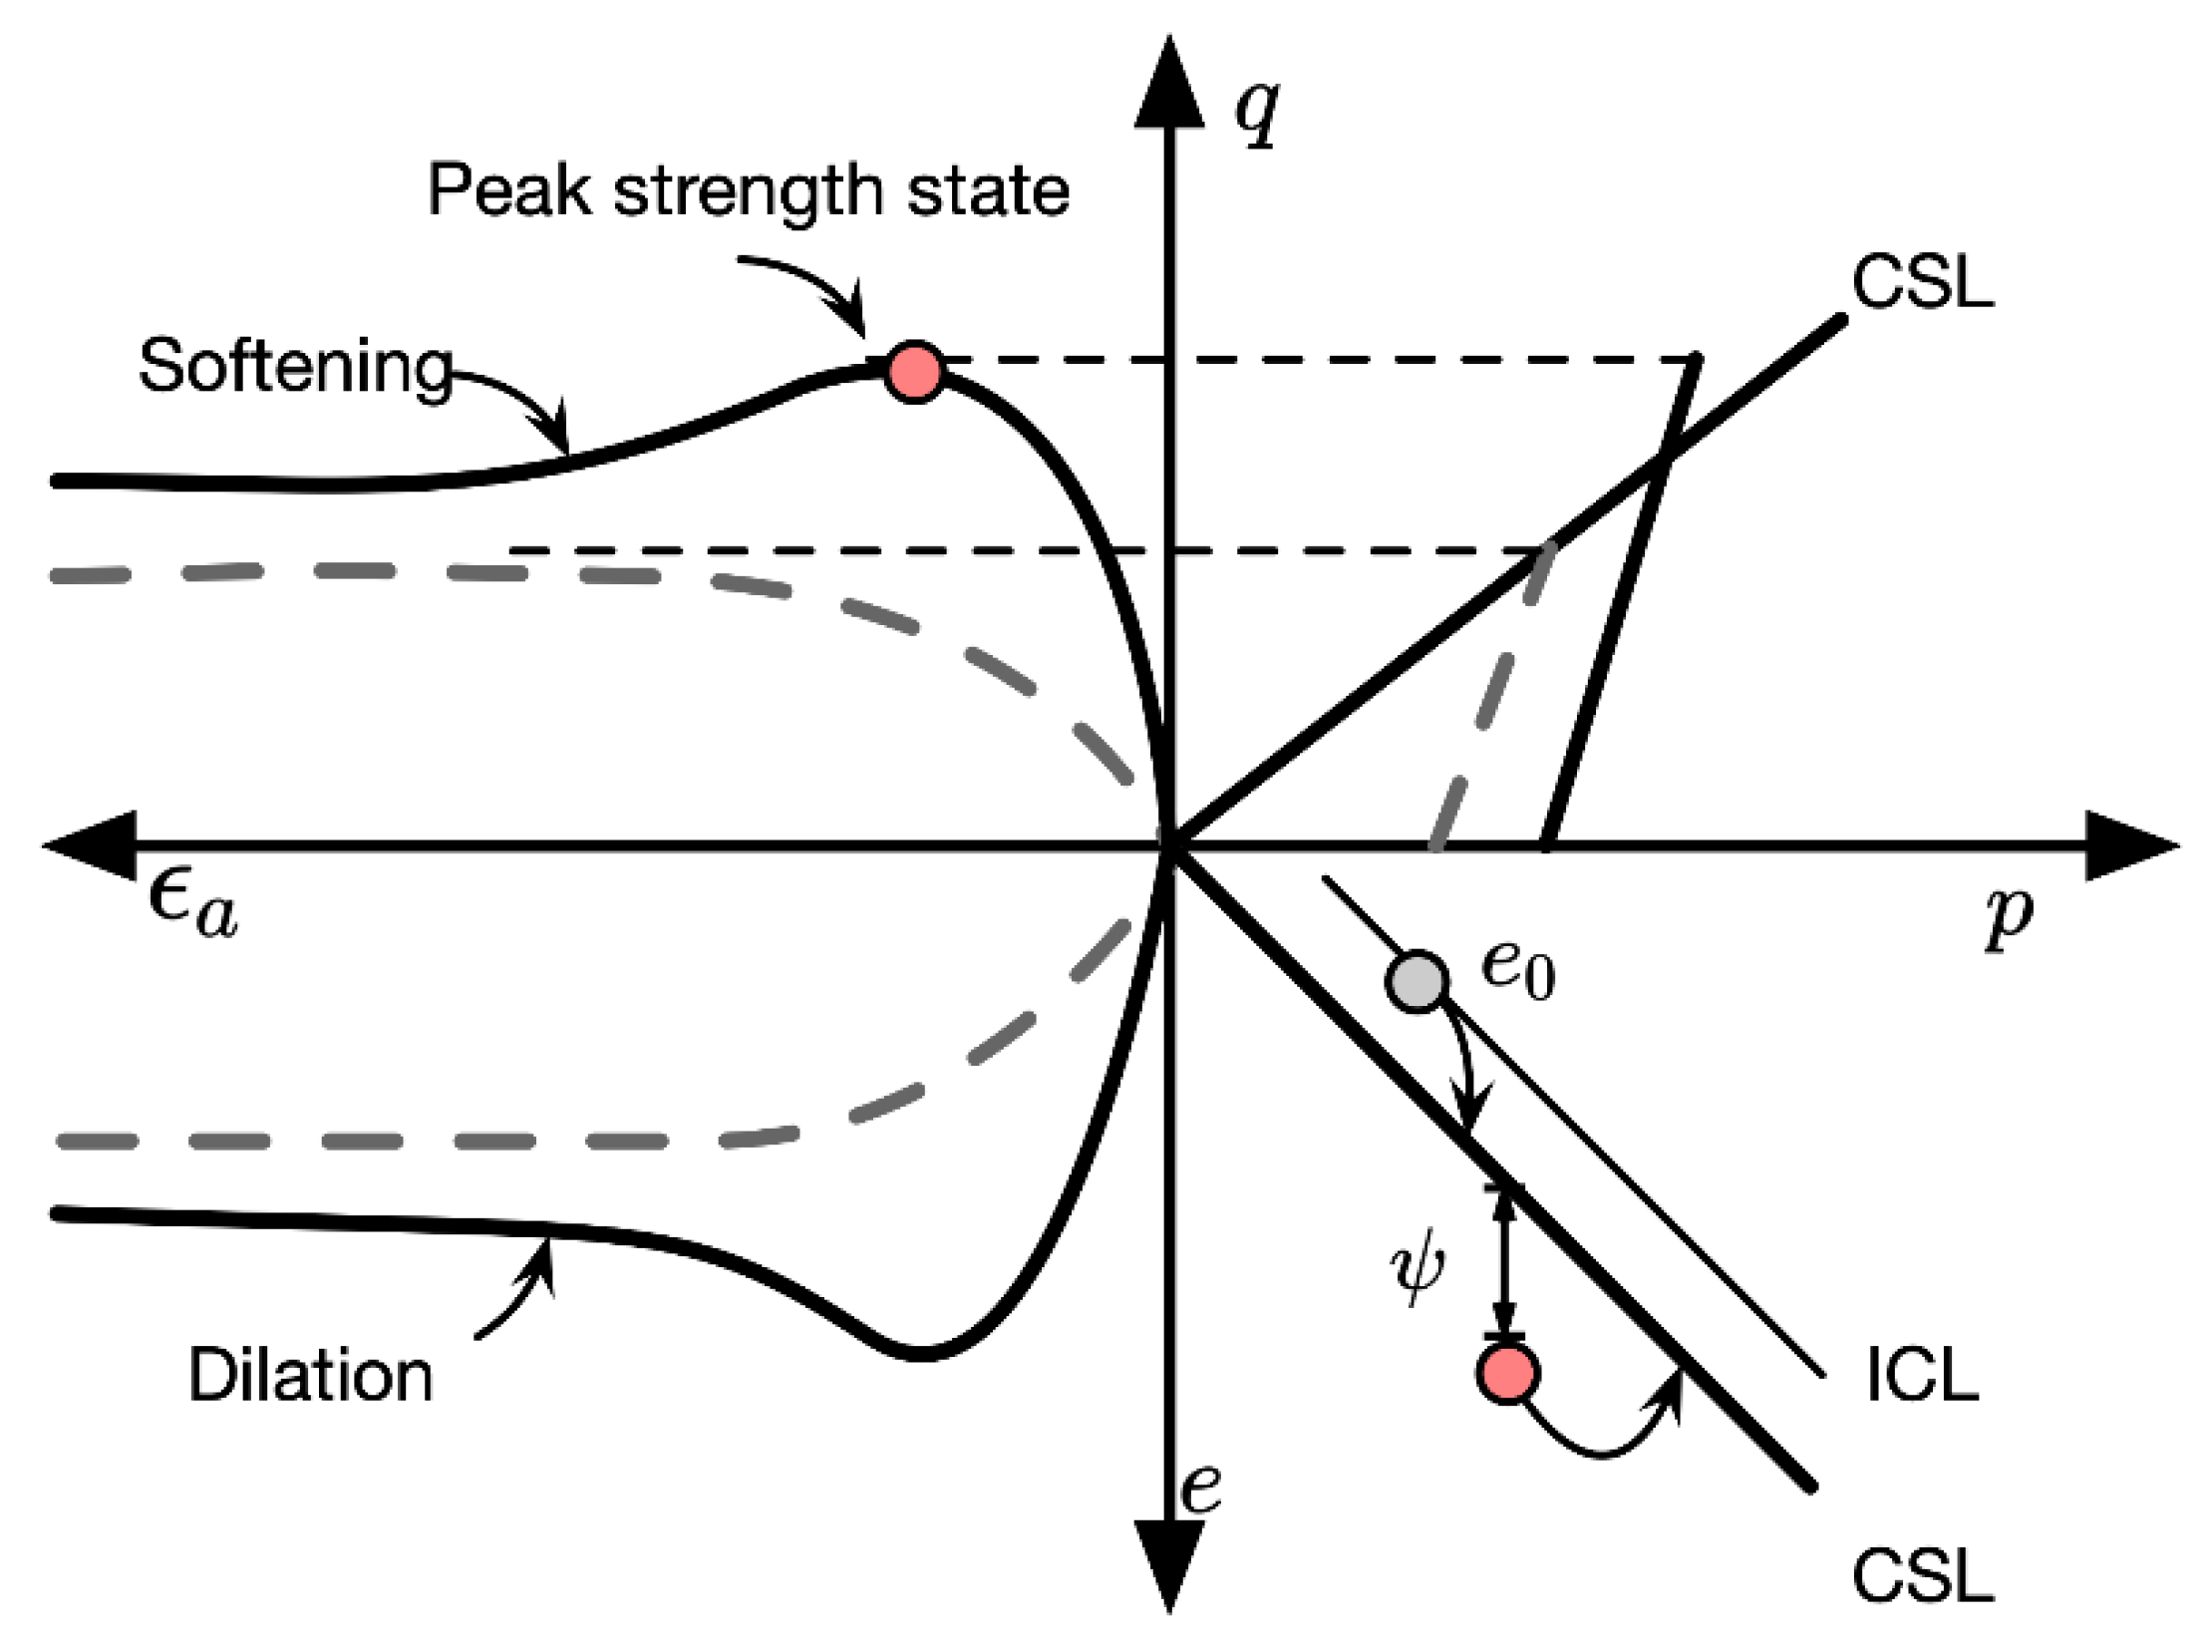
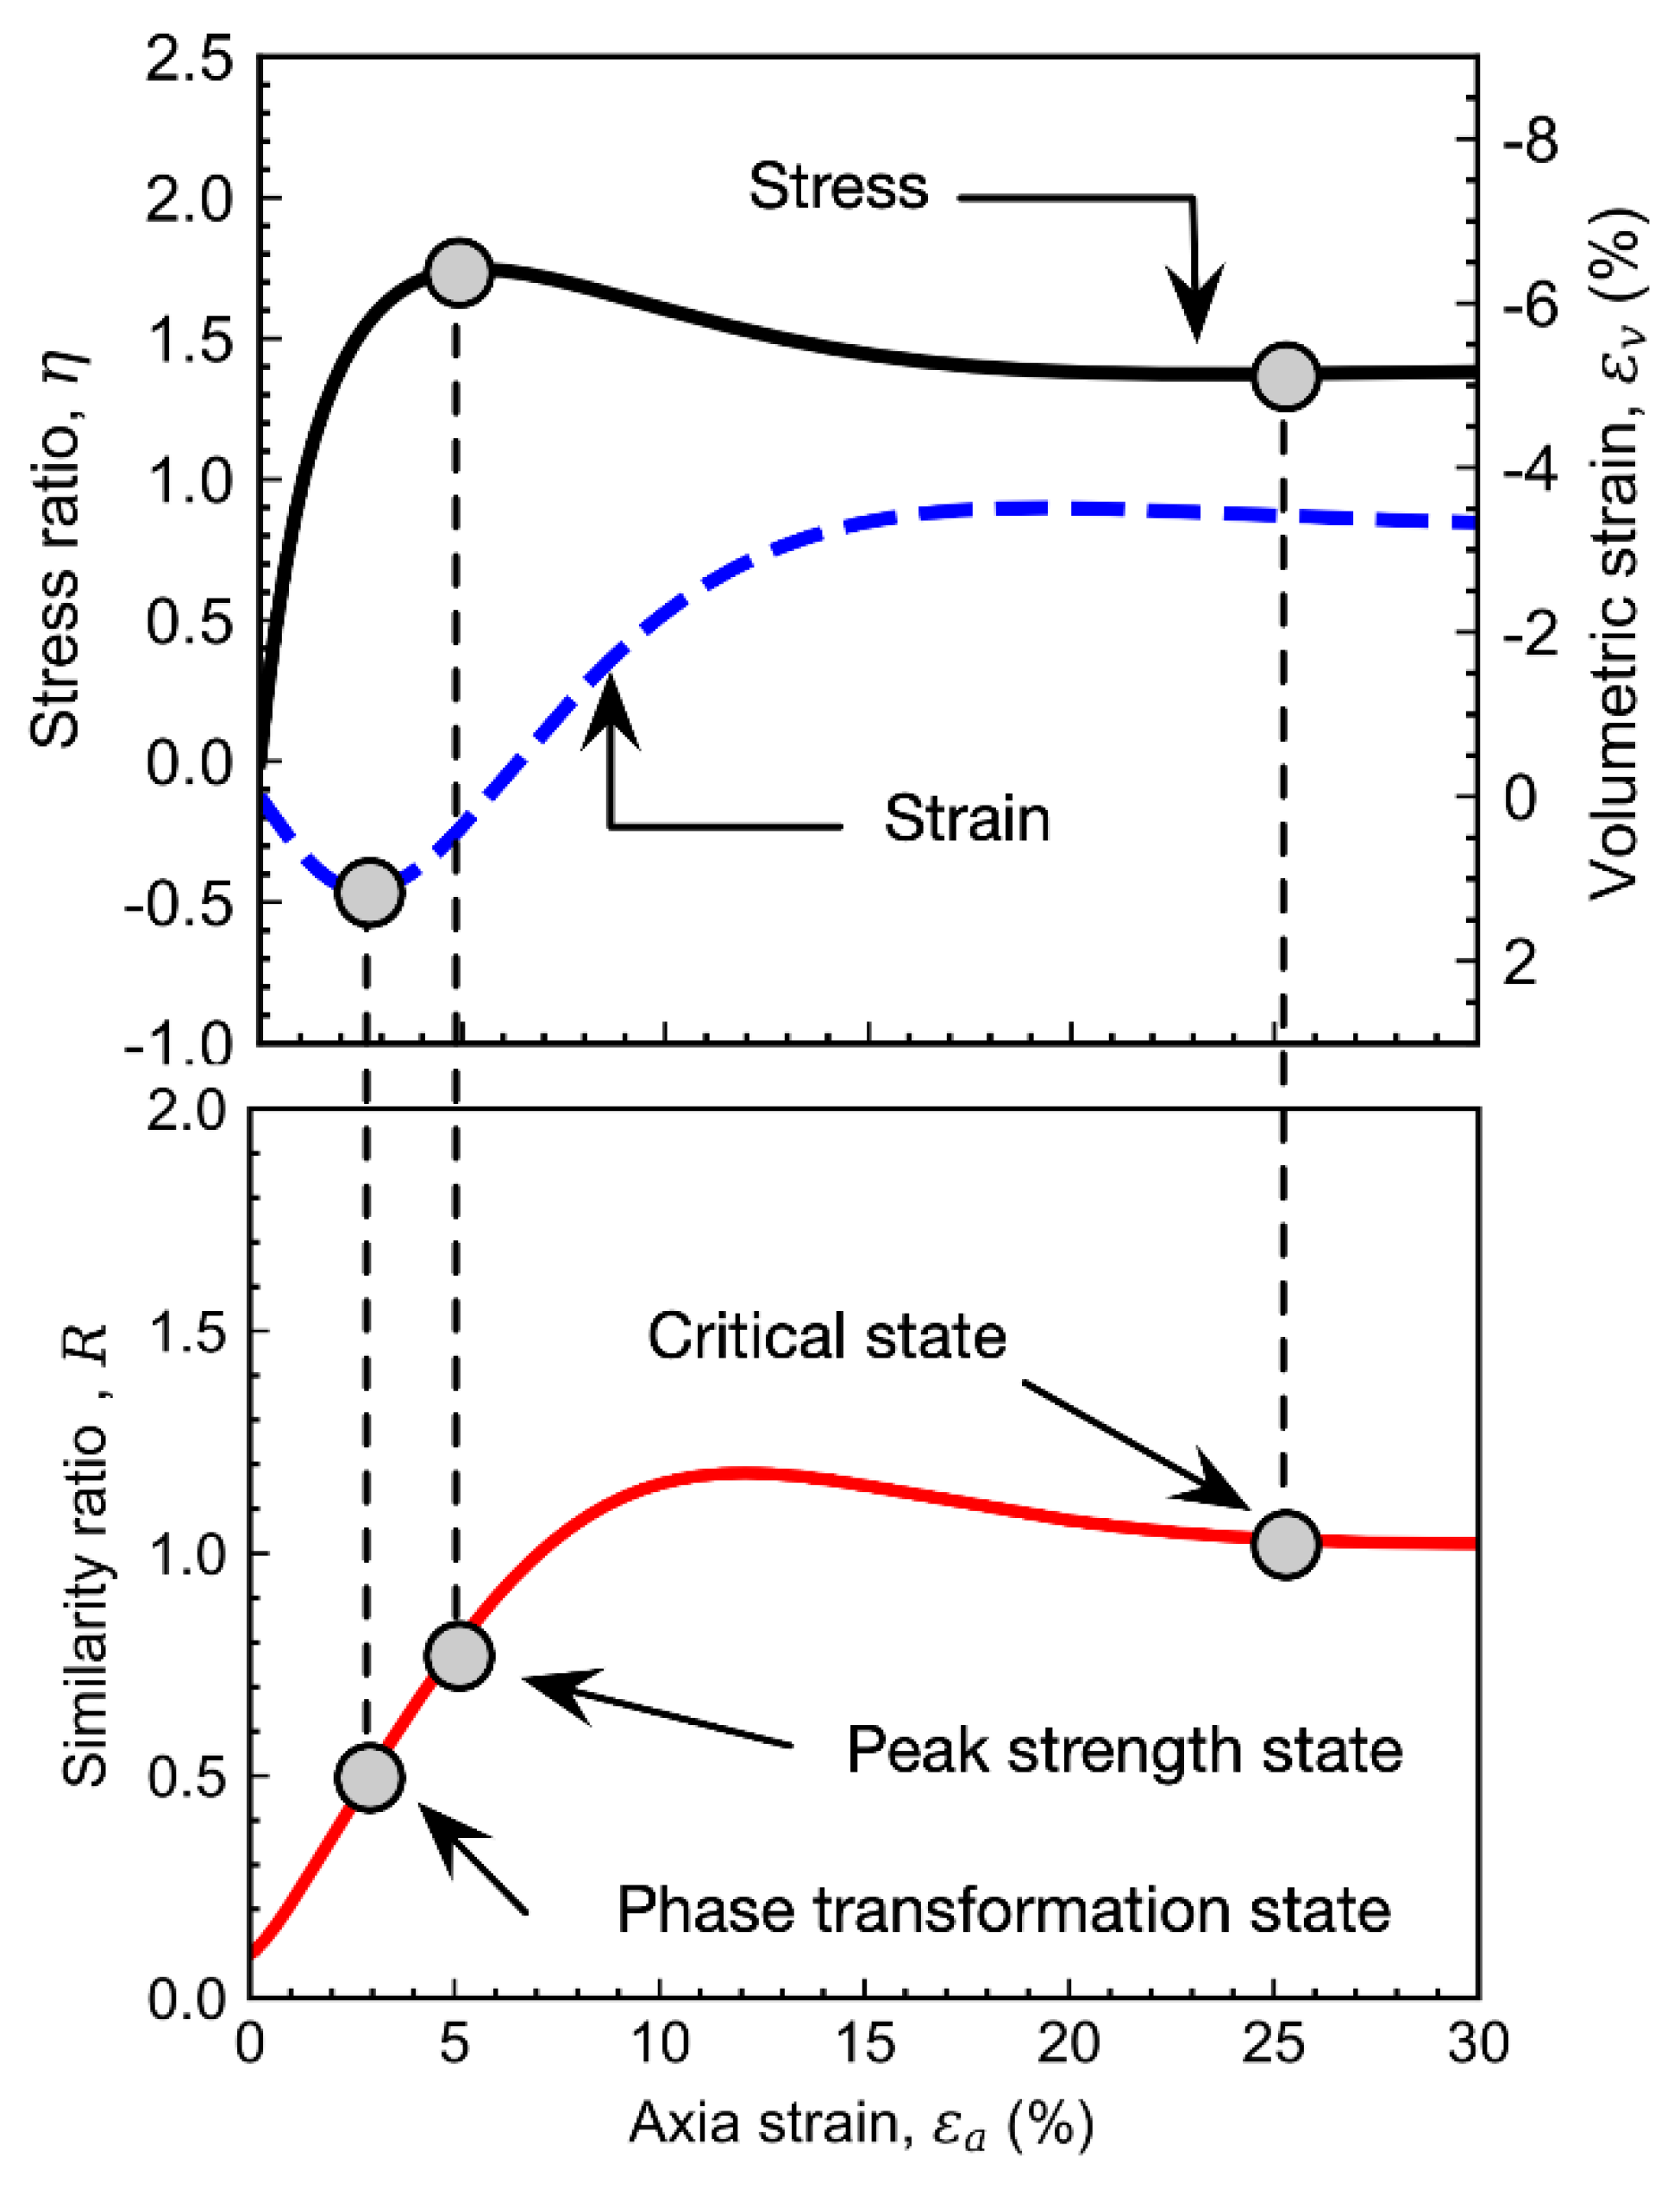
:1. Introduction
2. Constitutive Equations
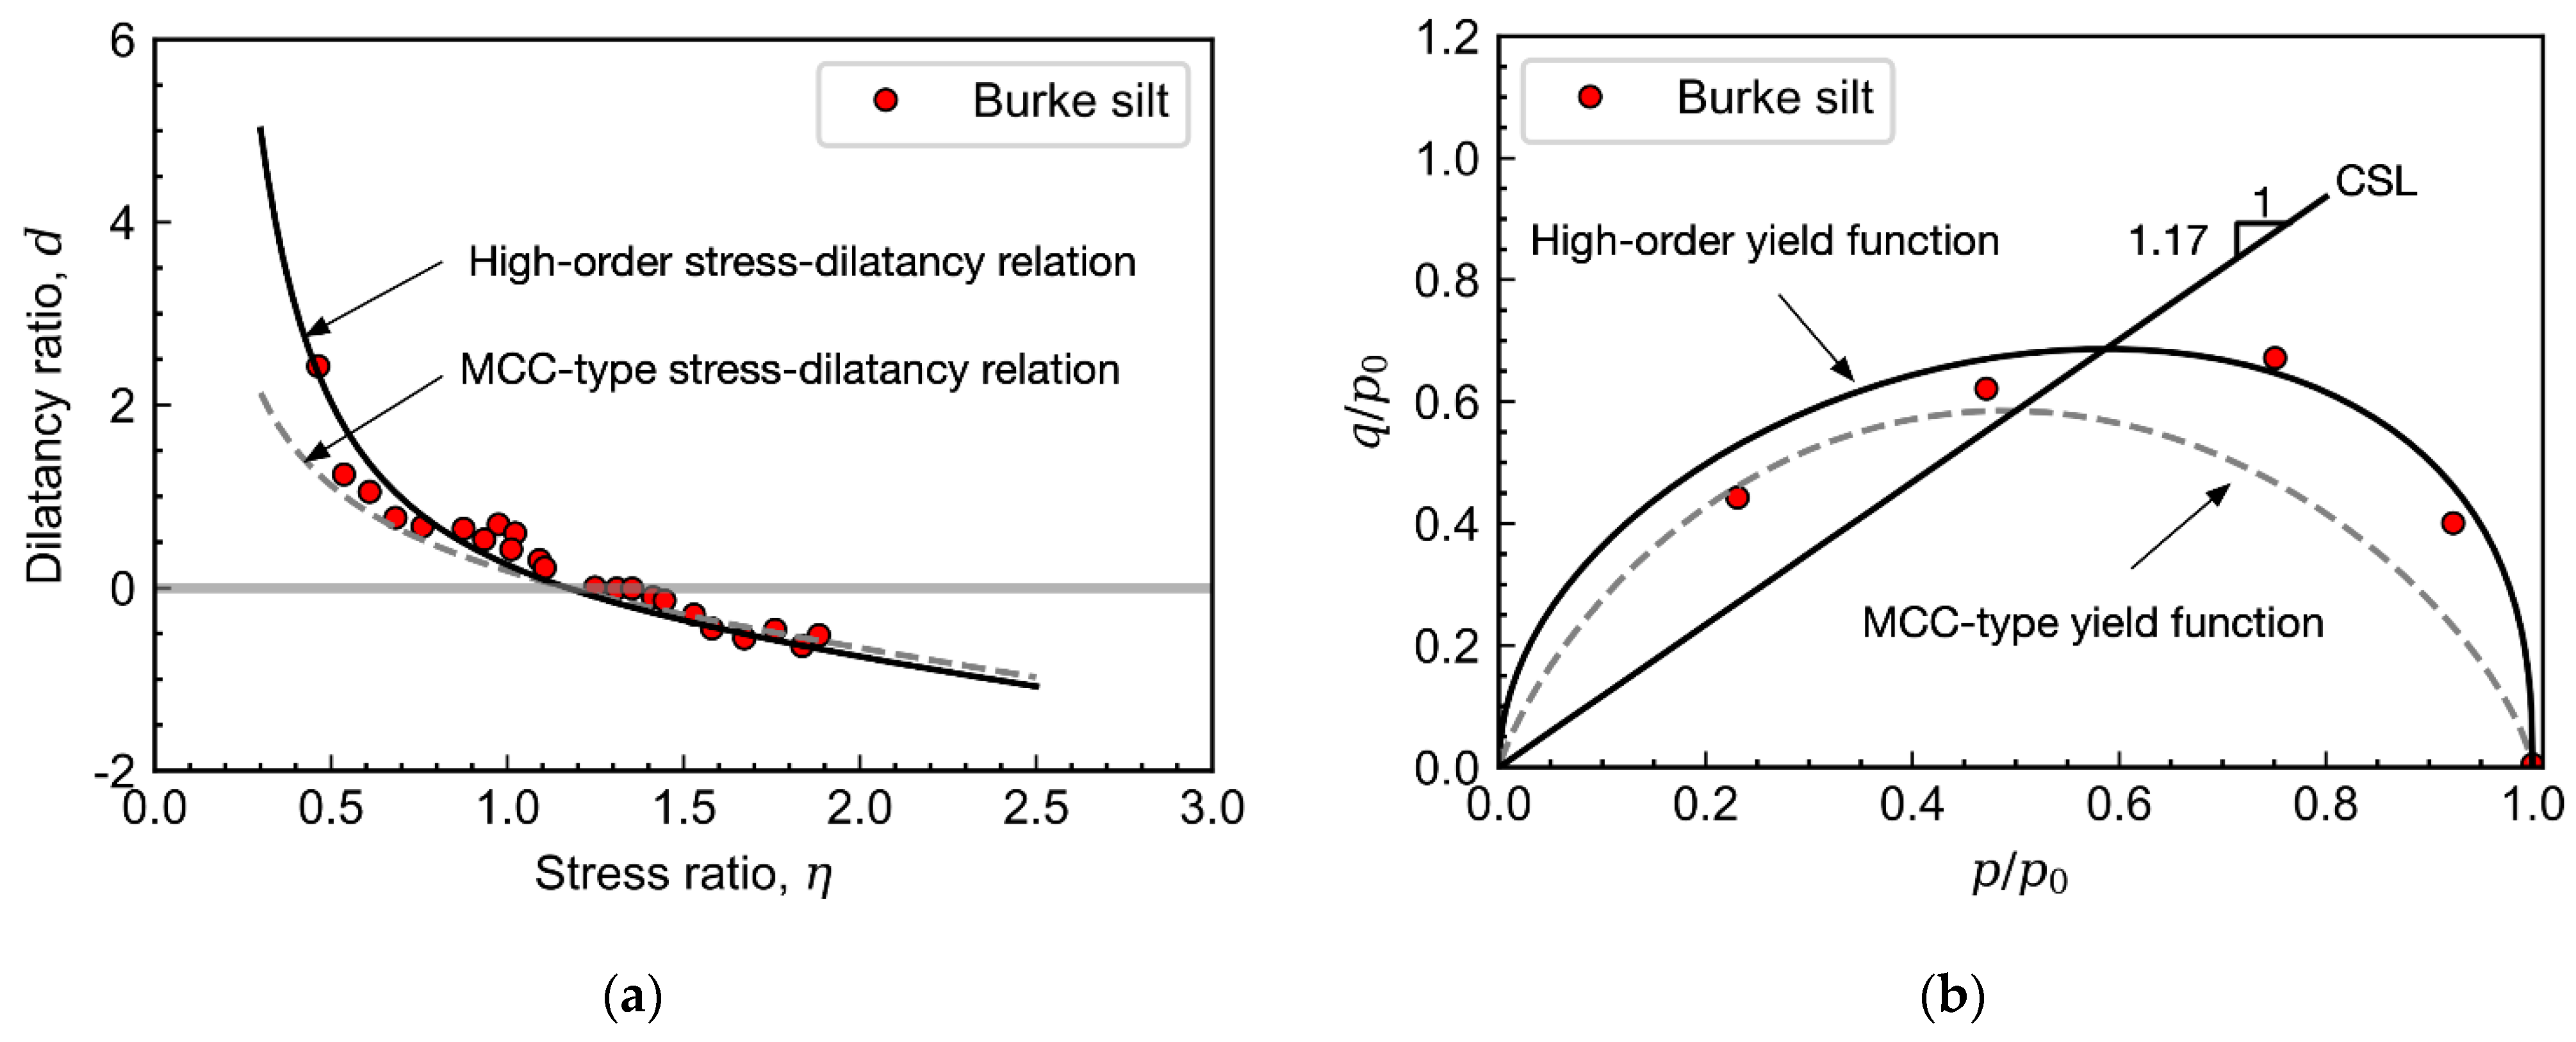
2.1. High-Order Yield Function
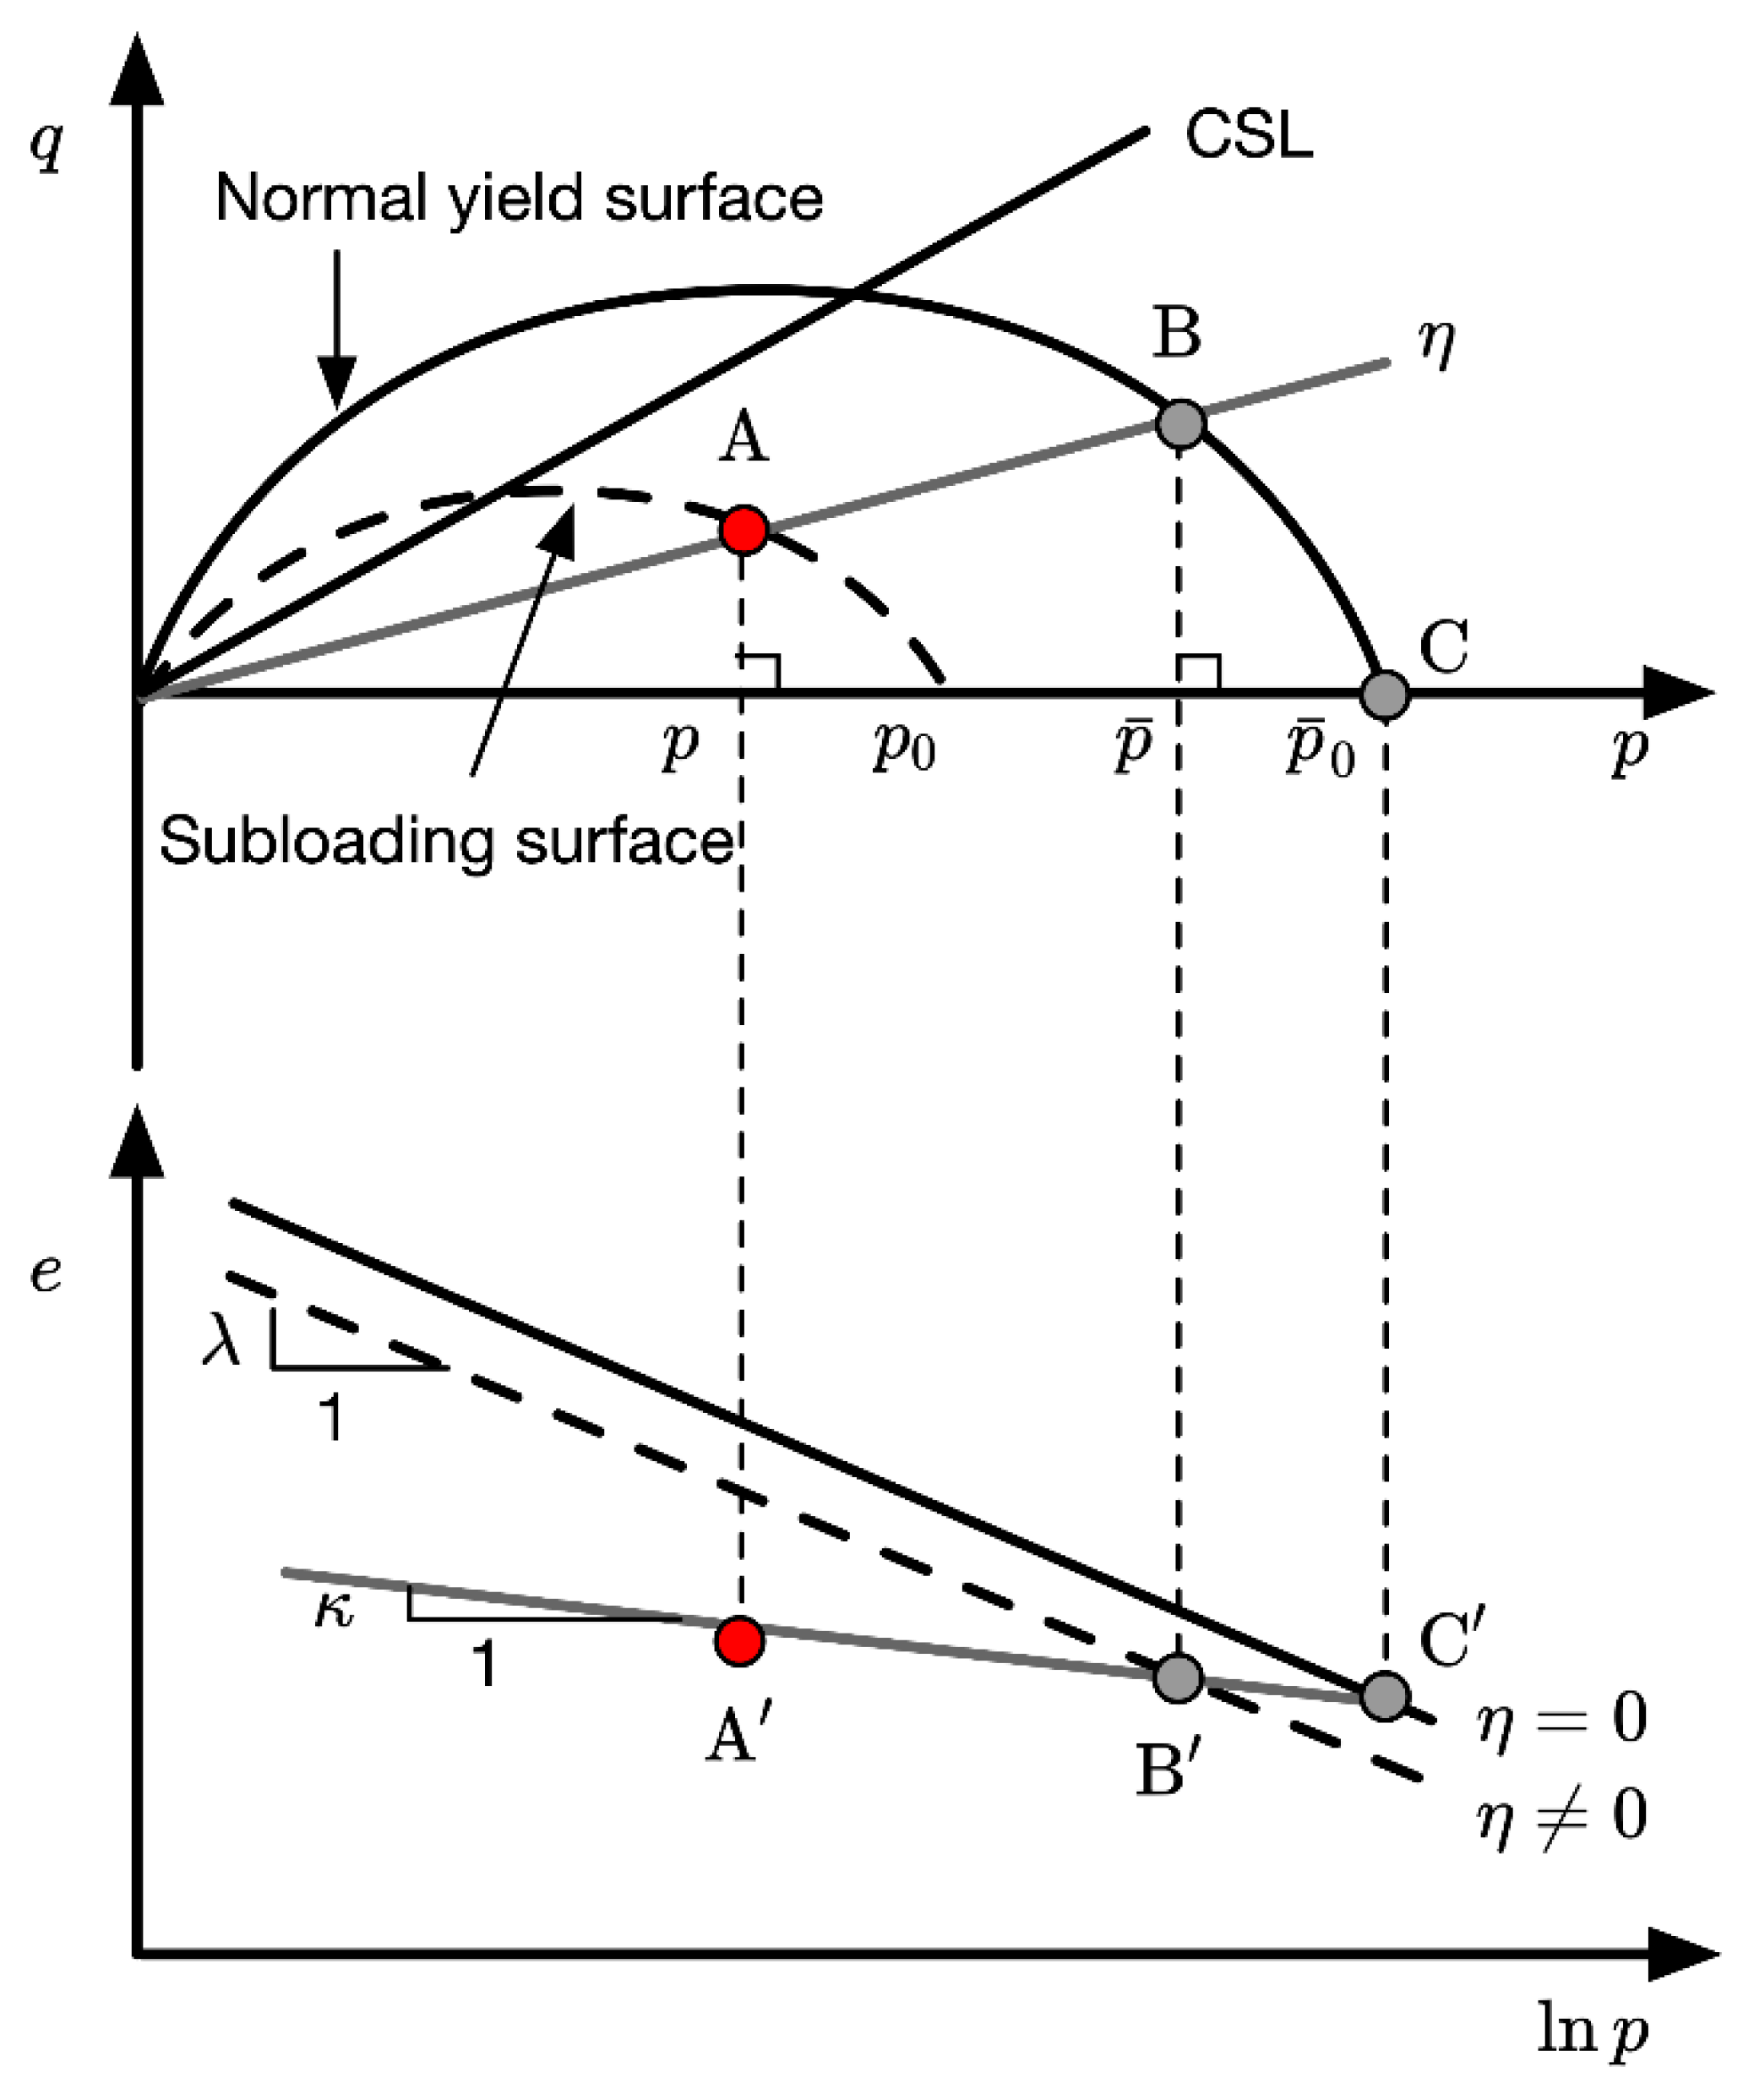
2.2. Yield Surfaces
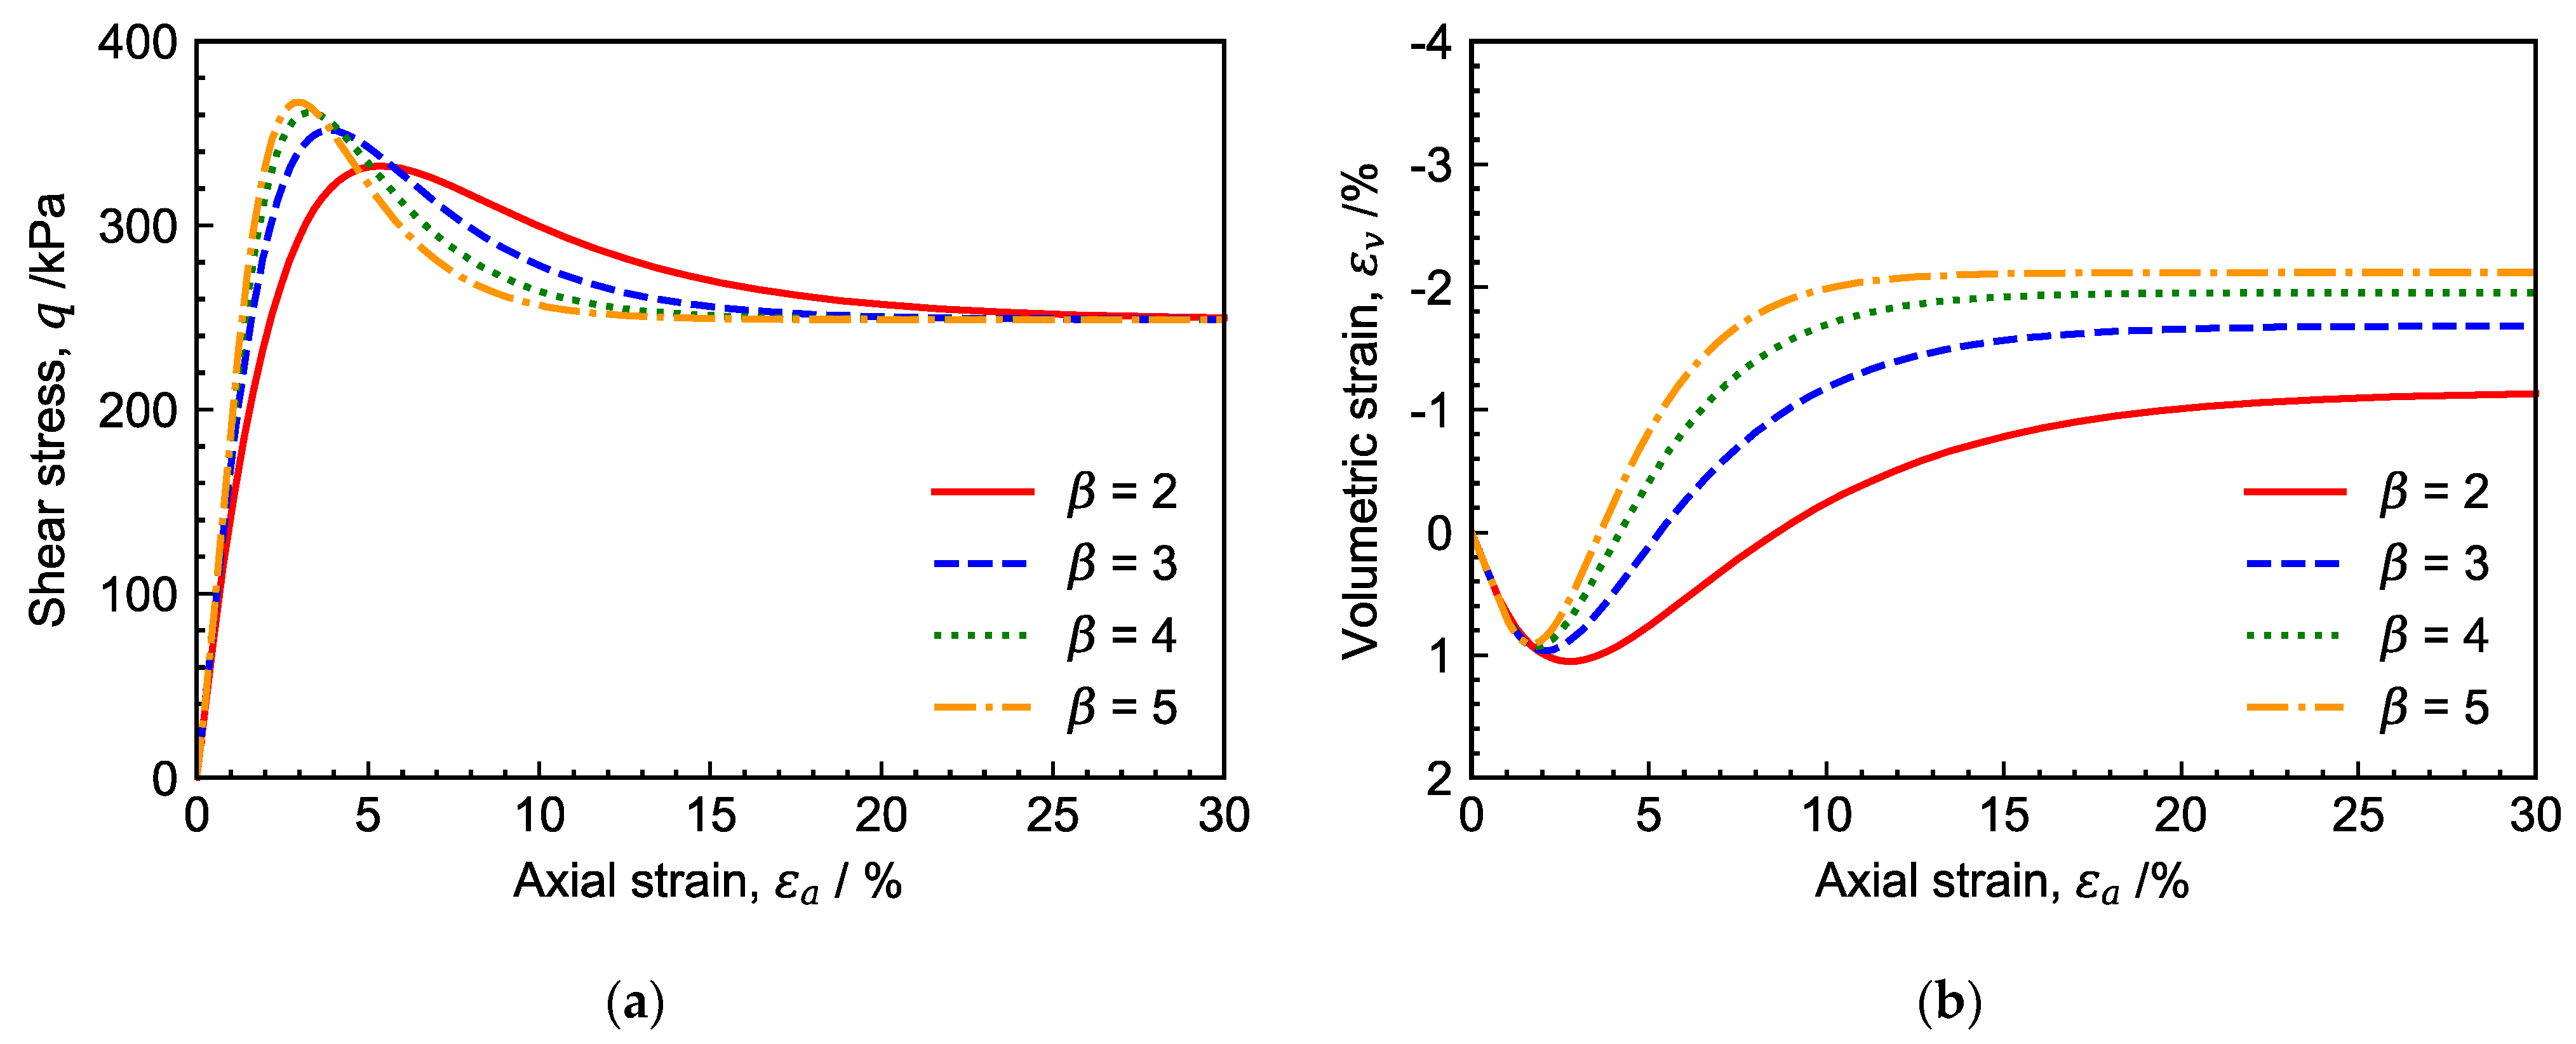
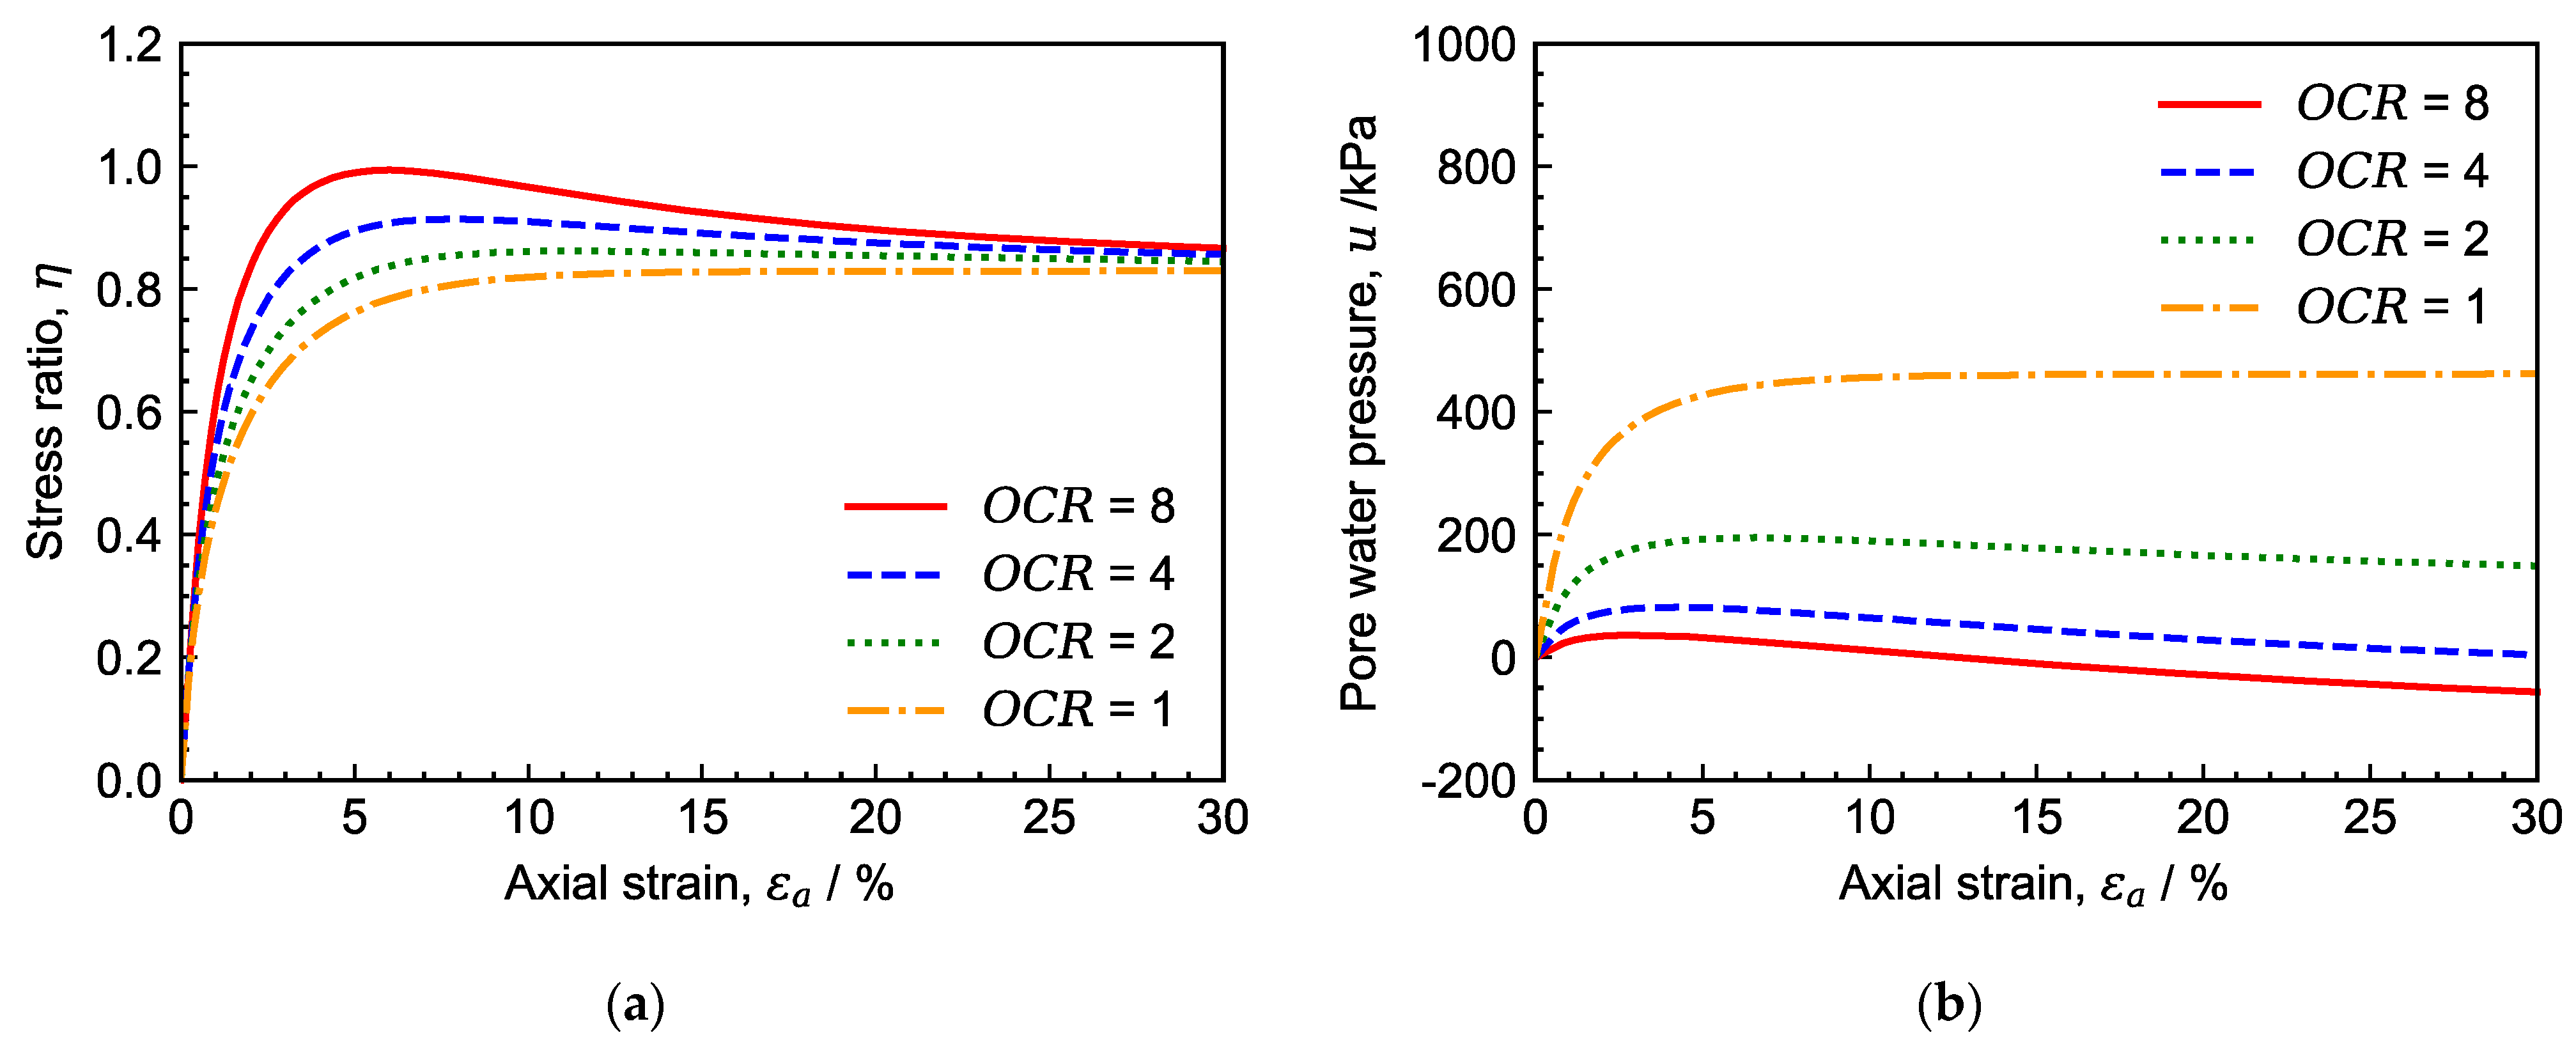
2.3. Model Performance
3. Model Verification
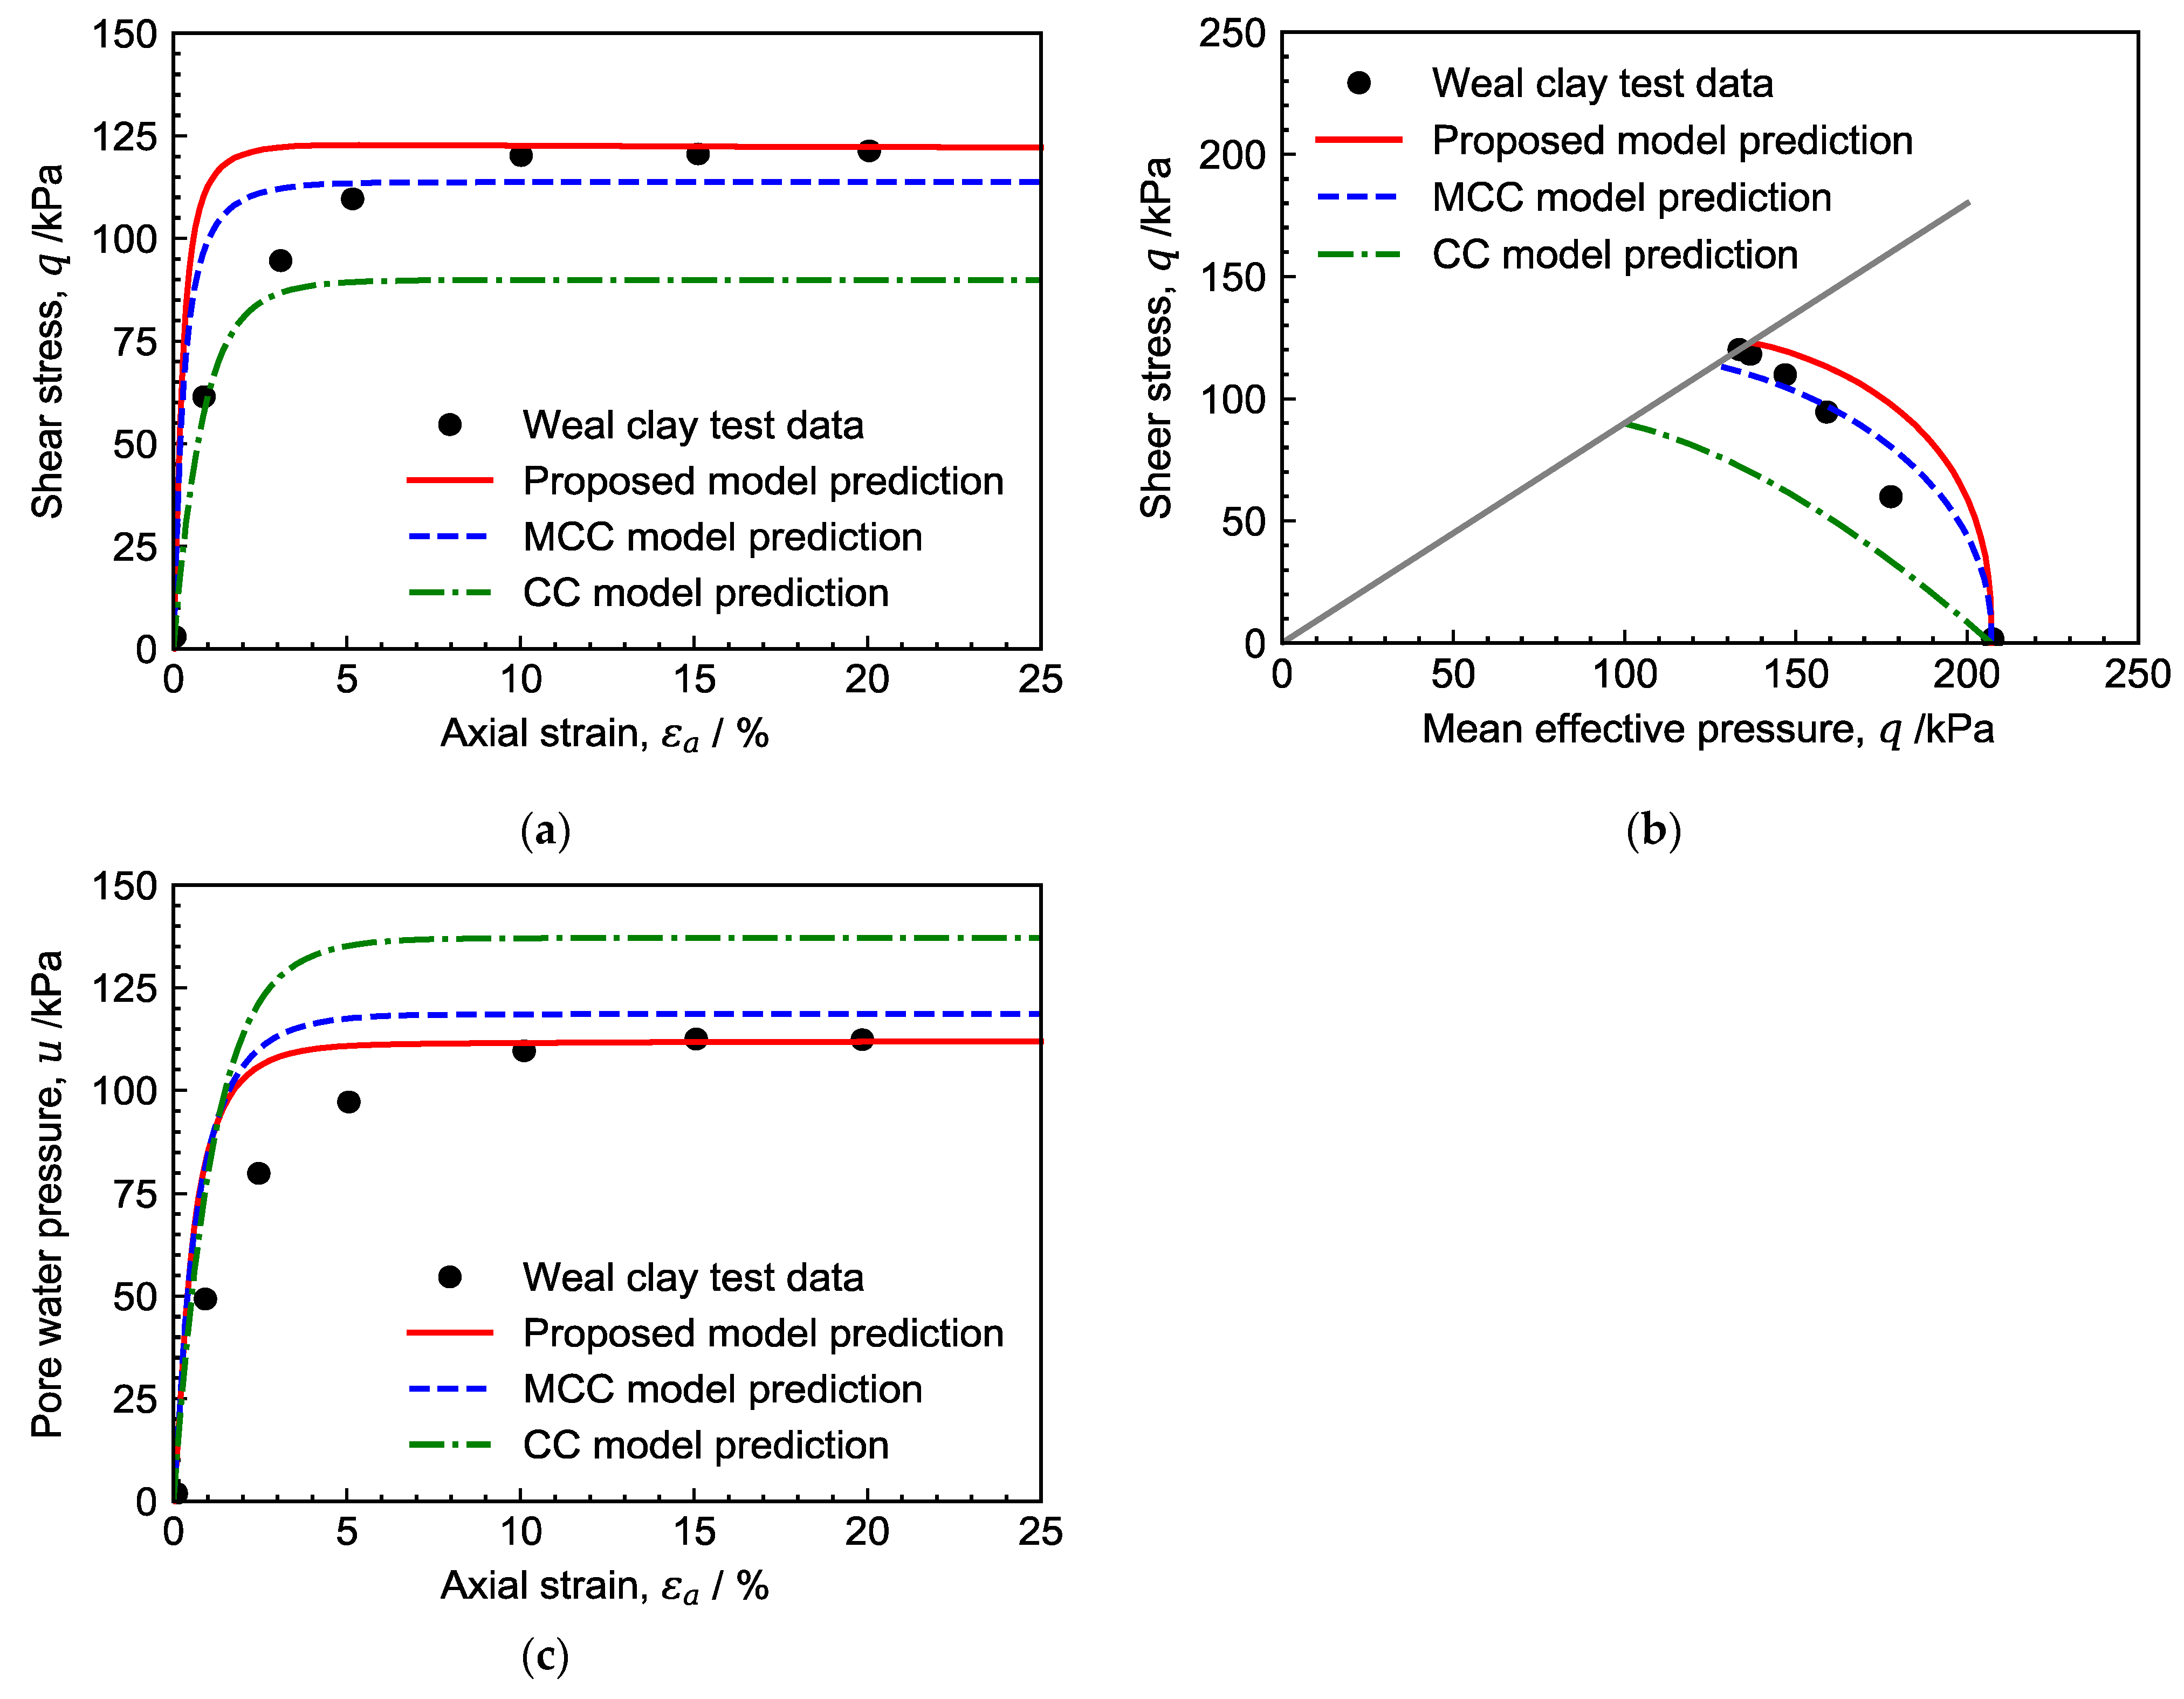
3.1. Weald Clay
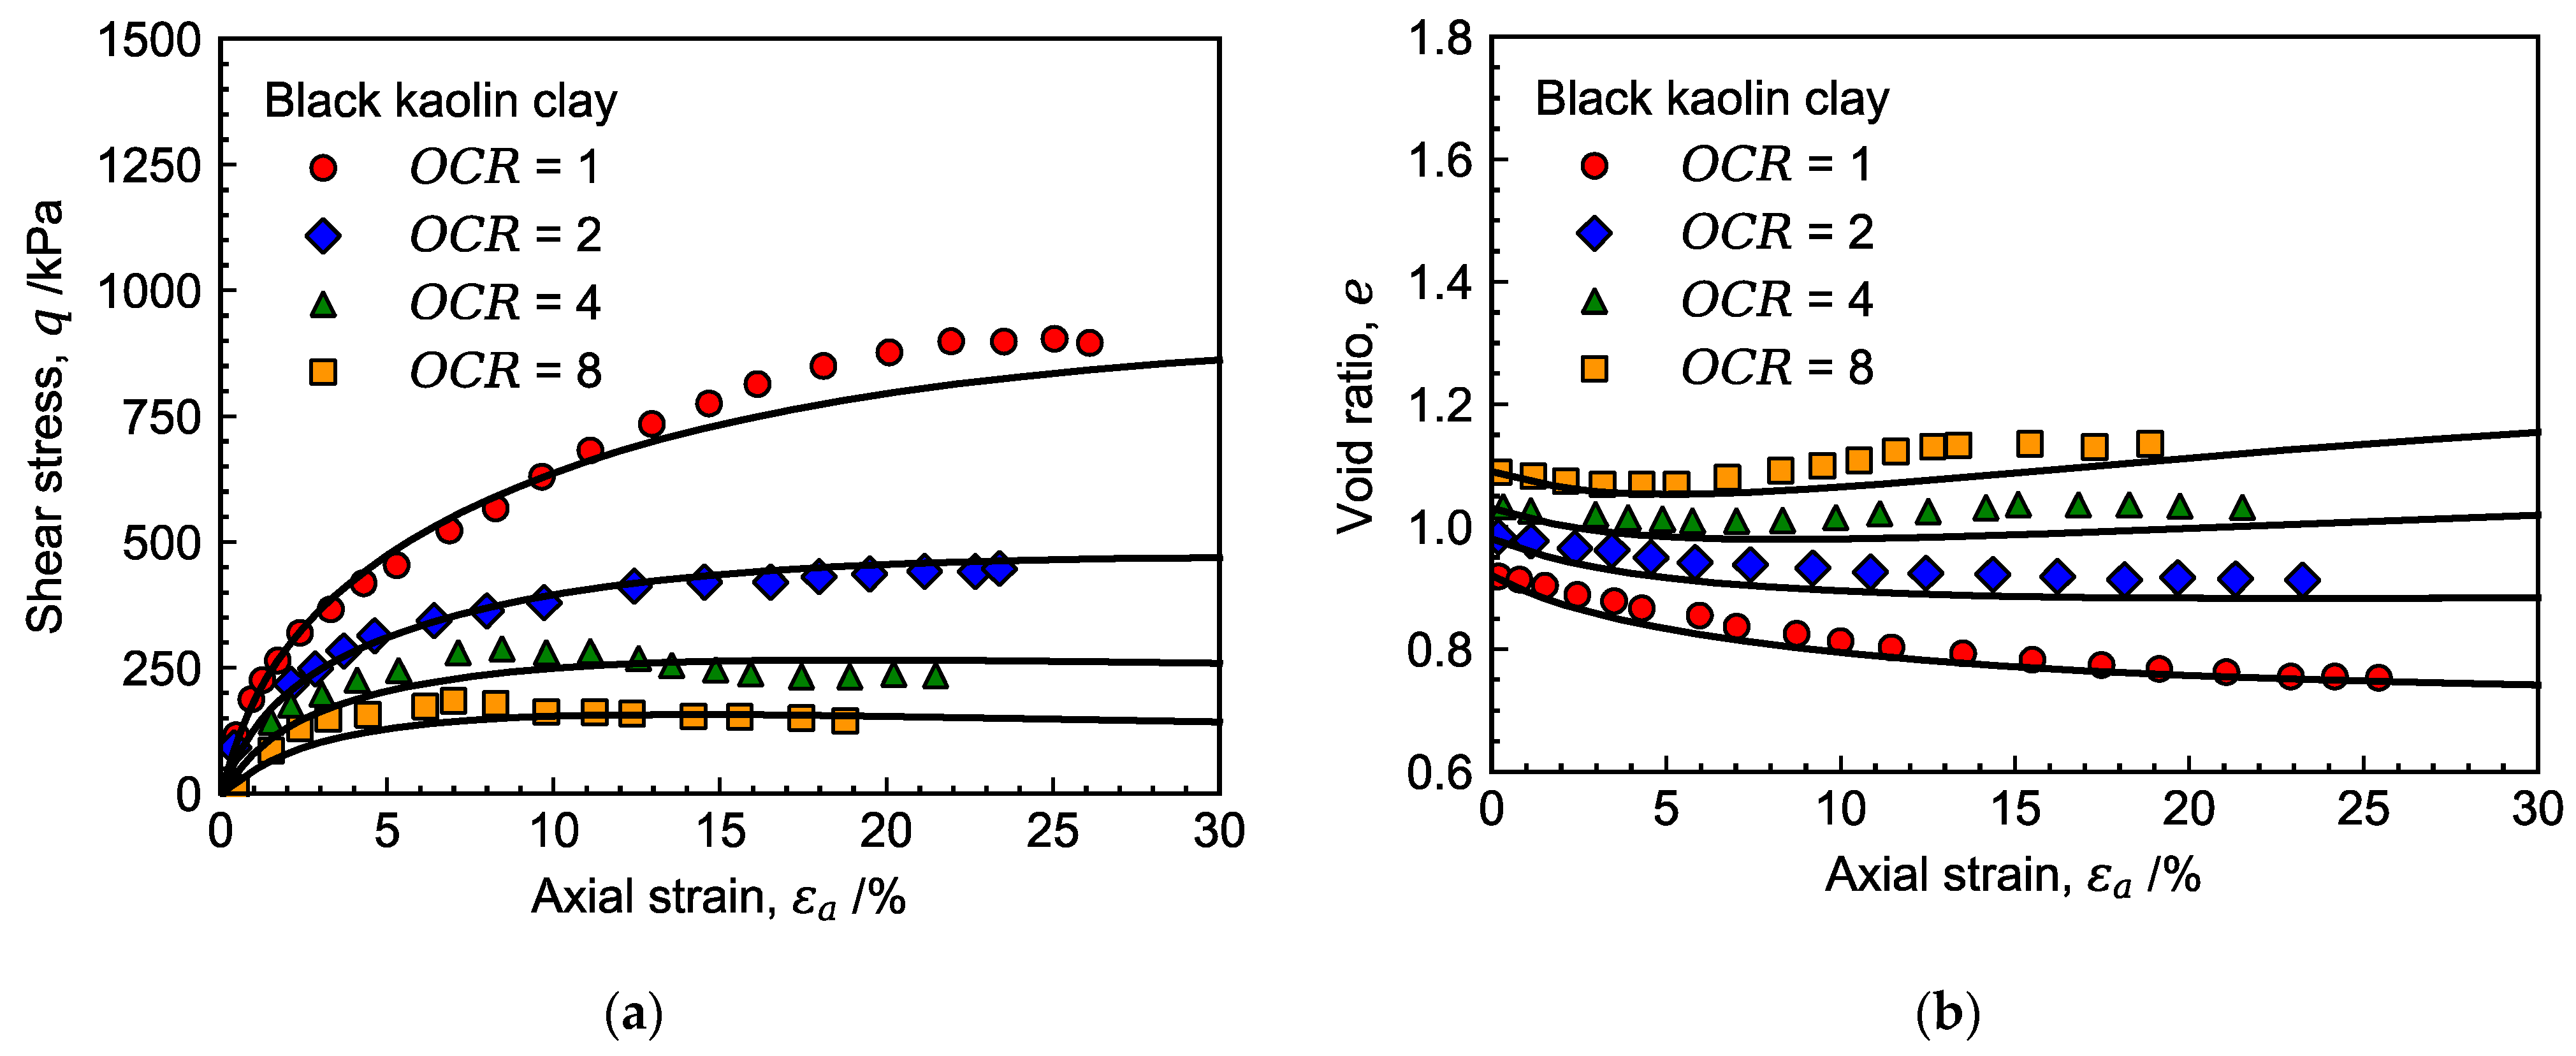
3.2. Black Kaolin Clay
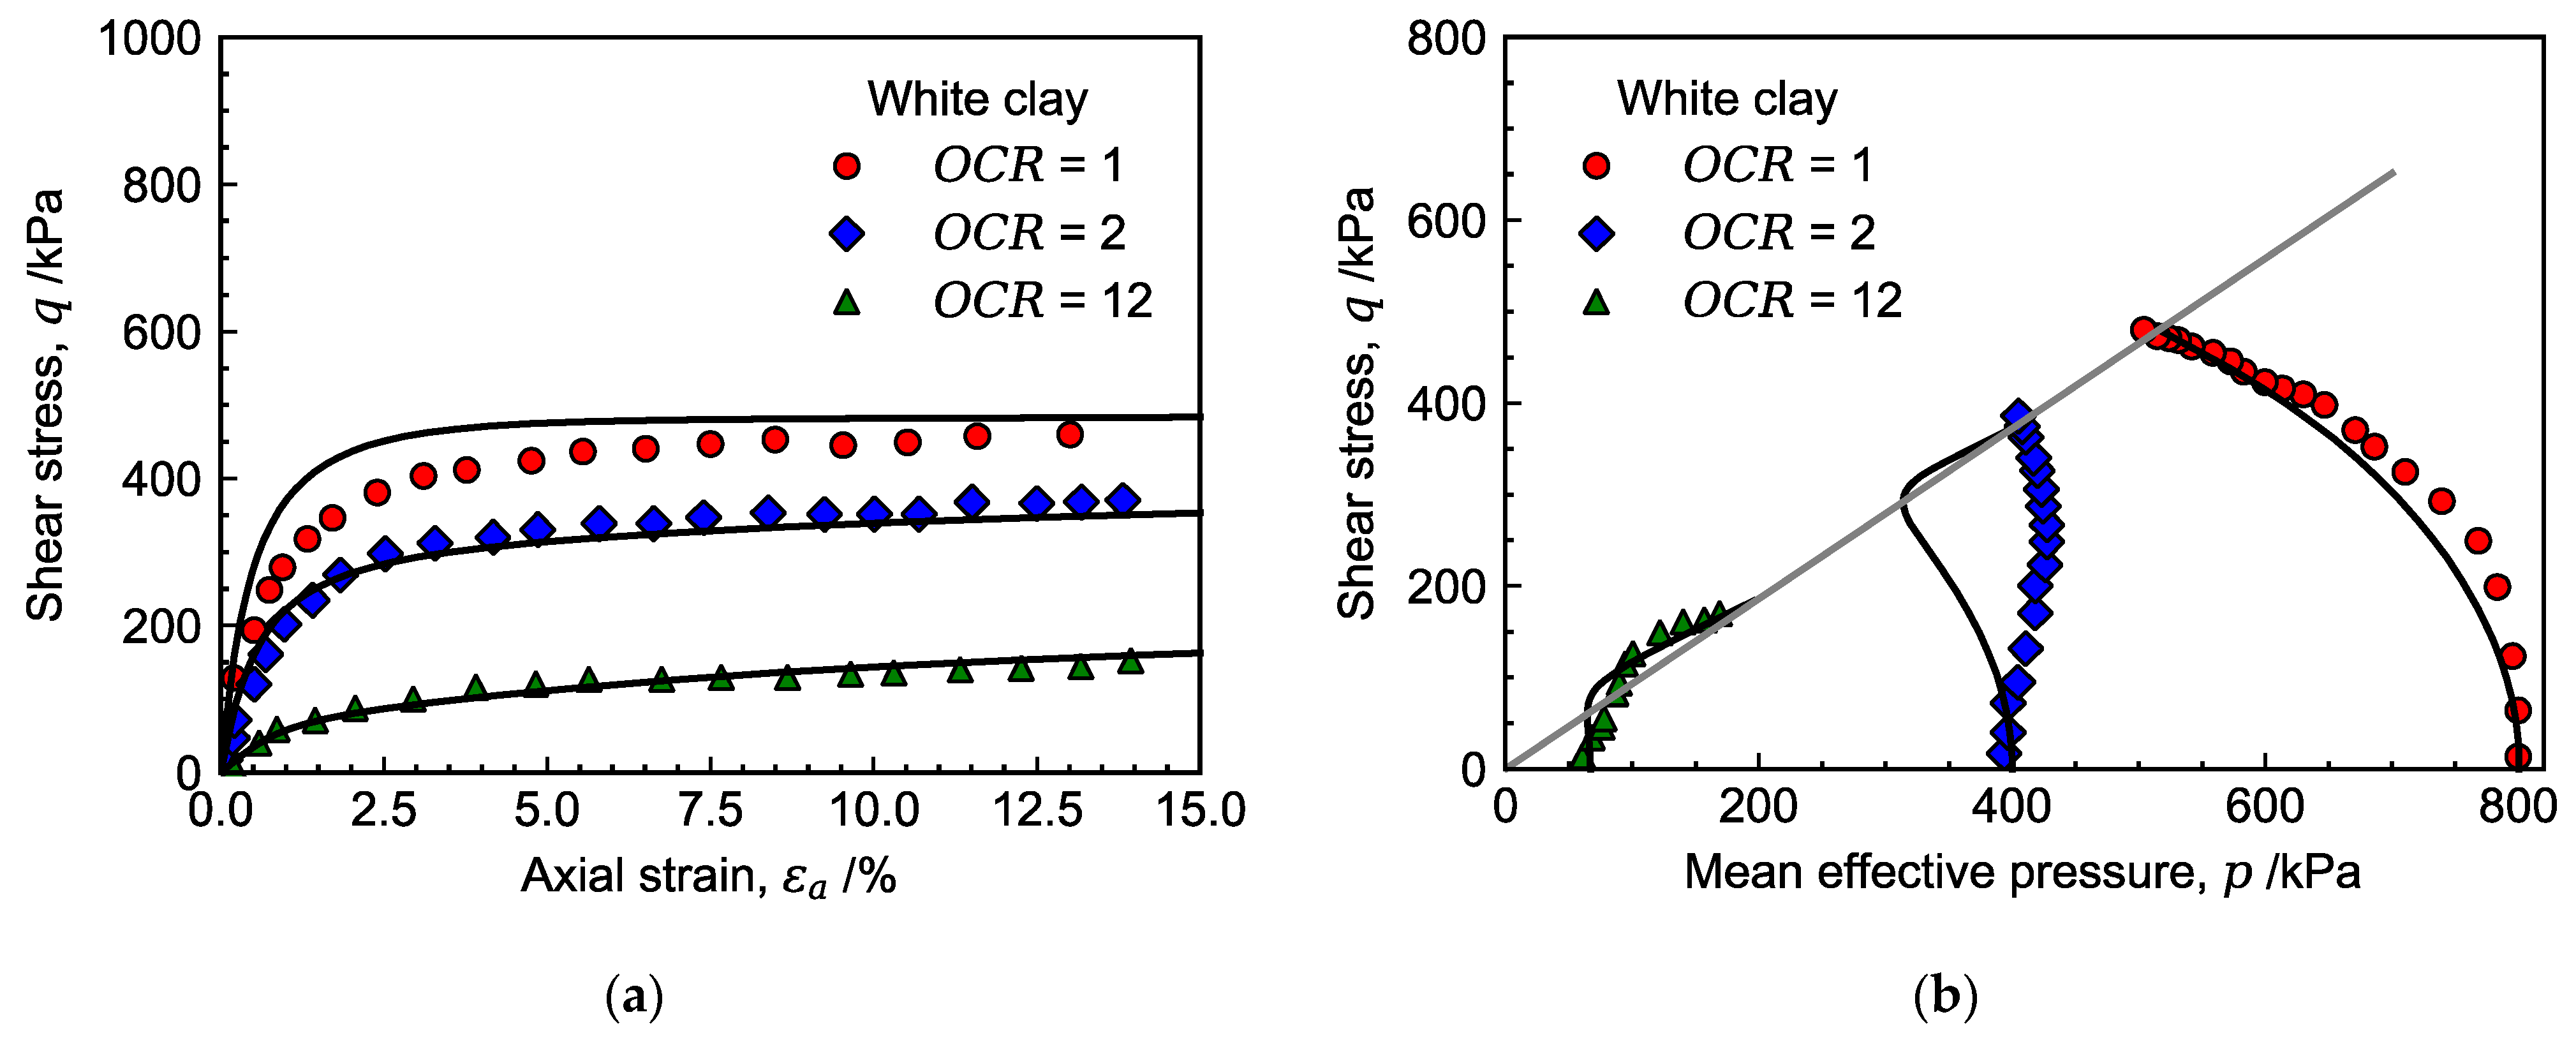
3.3. White Clay
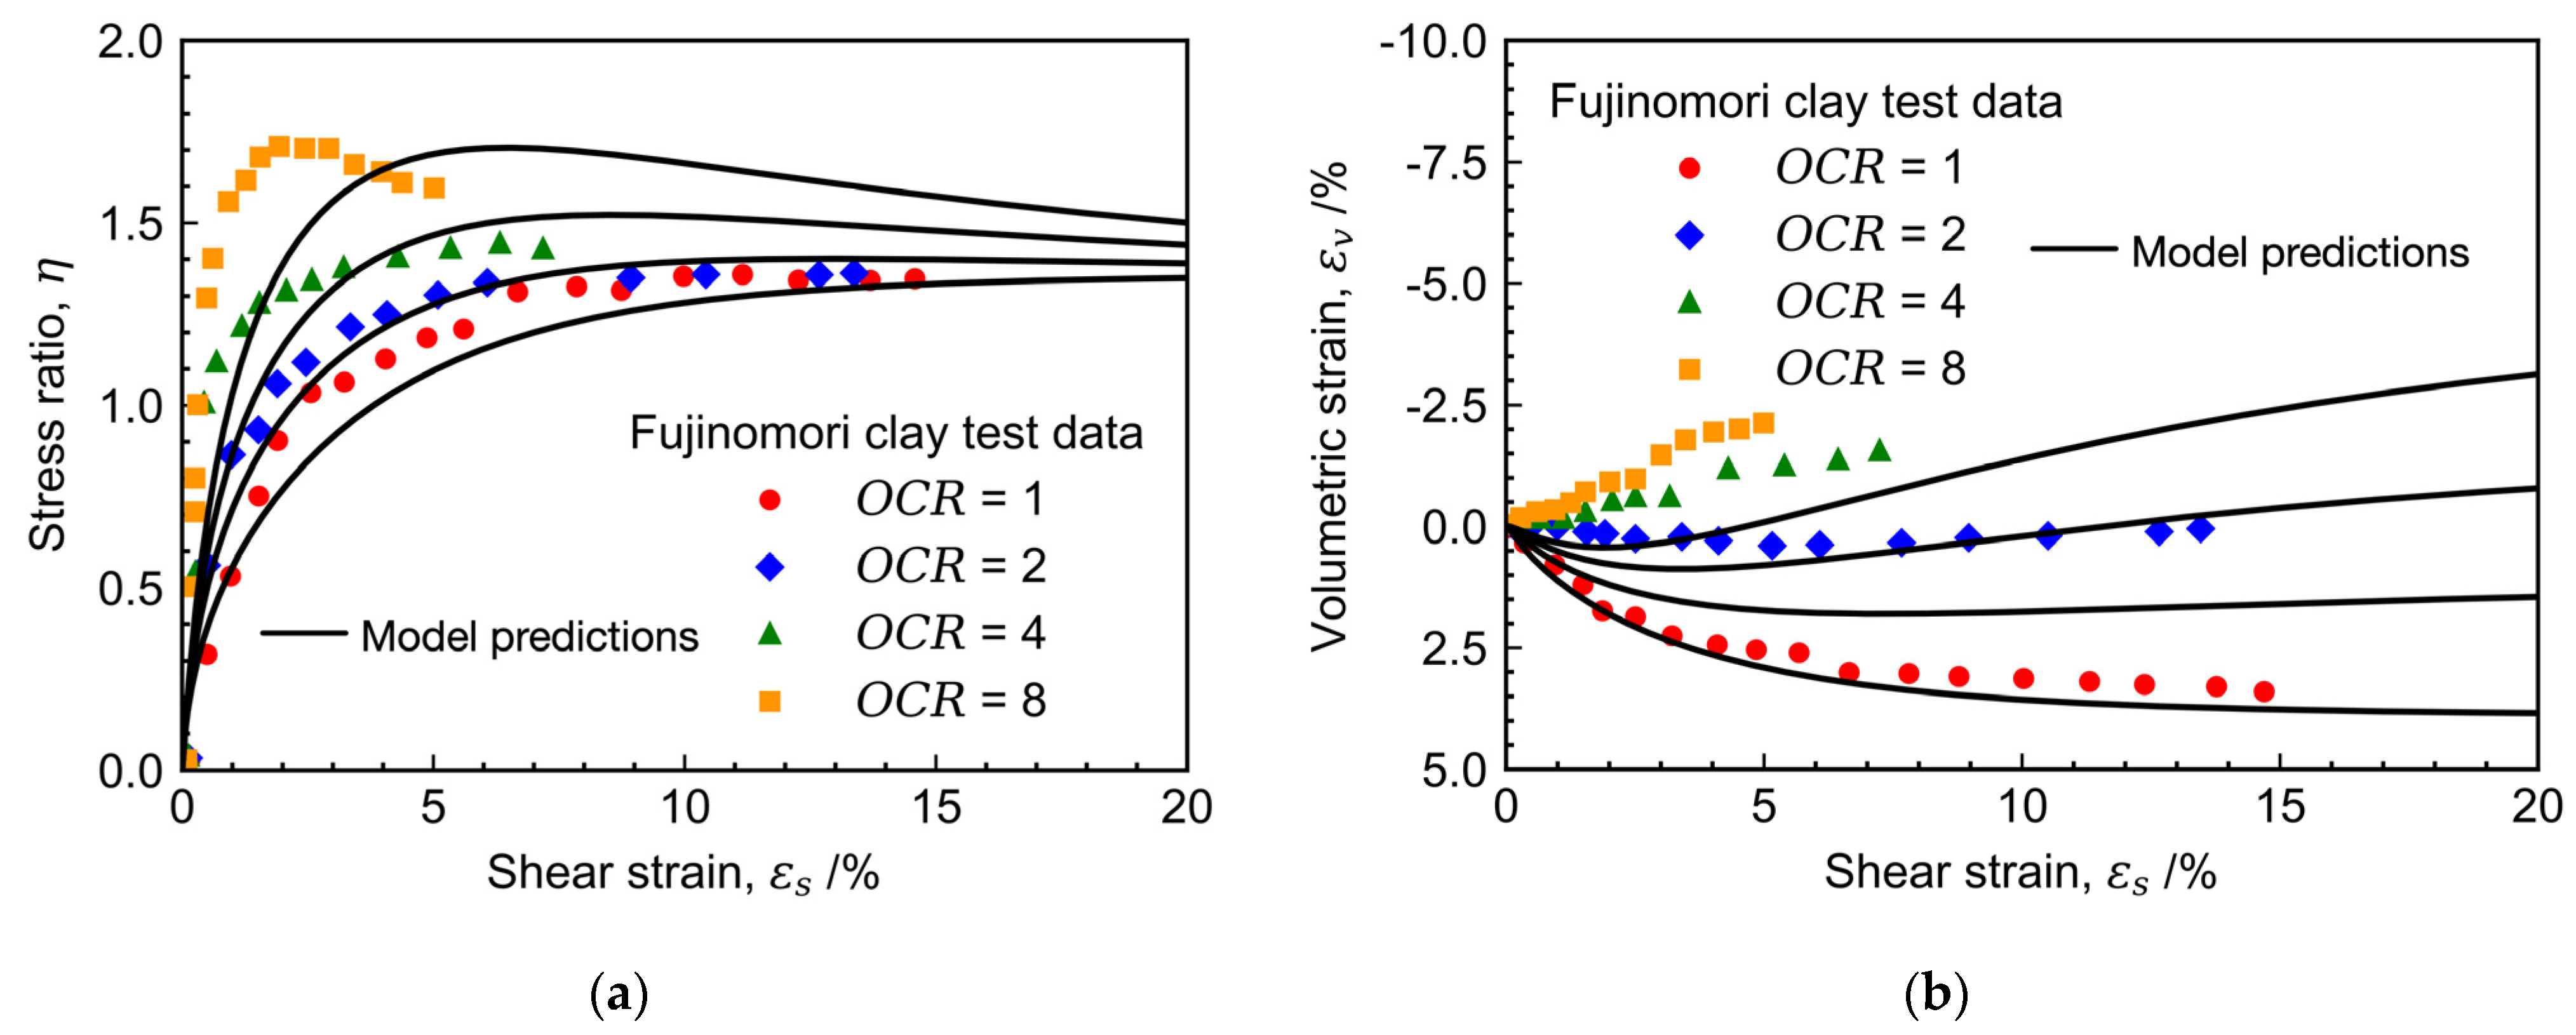
3.4. Fujinomori Clay
4. Conclusions
Author Contributions
Funding
Institutional Review Board Statement
Informed Consent Statement
Data Availability Statement
Conflicts of Interest
References
- Schofield, A.N.; Wroth, P. Critical State Soil Mechanics; McGraw-Hill: London, UK, 1968. [Google Scholar]
- Gu, C.; Wang, J.; Cai, Y.; Sun, L.; Wang, P.; Dong, Q. Deformation characteristics of overconsolidated clay sheared under constant and variable confining pressure. Soils Found. 2016, 56, 427–439. [Google Scholar] [CrossRef]
- Wang, S.; Wu, W.; Zhang, D.; Kim, J.R. Extension of a basic hypoplastic model for overconsolidated clays. Comput. Geotech. 2020, 123, 103486. [Google Scholar] [CrossRef]
- Wang, S.; Wu, W. A simple hypoplastic model for overconsolidated clays. Acta Geotech. 2020, 16, 21–29. [Google Scholar] [CrossRef]
- Yao, Y.-P.; Hou, W.; Zhou, A.-N. UH model: Three-dimensional unified hardening model for overconsolidated clays. Géotechnique 2009, 59, 451–469. [Google Scholar] [CrossRef] [Green Version]
- Yin, Z.-Y.; Chang, C.S.; Hicher, P.-Y.; Karstunen, M. Micromechanical analysis of kinematic hardening in natural clay. Int. J. Plast. 2009, 25, 1413–1435. [Google Scholar] [CrossRef] [Green Version]
- Been, K.; Jefferies, M.G. A state parameter for sands. Géotechnique 1985, 35, 99–112. [Google Scholar] [CrossRef]
- Yu, H.-S. CASM: A unified state parameter model for clay and sand. Int. J. Num. Anal. Methods Geomech. 1998, 22, 621–653. [Google Scholar] [CrossRef]
- Scarpelli, G.; Sakellariadi, E.; Fruzzetti, V. The dilatant behaviour of overconsolidated clays. In Proceedings of the International Symposium on Deformation Characteristic of Geomaterials, Lyon, France, 22–24 September 2003; pp. 451–460. [Google Scholar]
- Jocković, S.; Vukicevic, M. Bounding surface model for overconsolidated clays with new state parameter formulation of hardening rule. Comput. Geotech. 2017, 83, 16–29. [Google Scholar] [CrossRef]
- Gao, Z.; Zhao, J.; Yin, Z.-Y. Dilatancy Relation for Overconsolidated Clay. Int. J. Géoméch. 2017, 17, 06016035. [Google Scholar] [CrossRef] [Green Version]
- Yin, Z.-Y.; Xu, Q.; Hicher, P.-Y. A simple critical-state-based double-yield-surface model for clay behavior under complex loading. Acta Geotech. 2013, 8, 509–523. [Google Scholar] [CrossRef]
- Sultan, N.; Cui, Y.-J.; Delage, P. Yielding and plastic behaviour of Boom clay. Géotechnique 2010, 60, 657–666. [Google Scholar] [CrossRef] [Green Version]
- Alonso, E.E.; Romero, E.E.; Ortega, E. Yielding of rockfill in relative humidity-controlled triaxial experiments. Acta Geotech. 2016, 11, 455–477. [Google Scholar] [CrossRef] [Green Version]
- Panteghini, A.; Lagioia, R. An extended modified Cam-Clay yield surface for arbitrary meridional and deviatoric shapes retaining full convexity and double homothety. Géotechnique 2018, 68, 590–601. [Google Scholar] [CrossRef]
- Collins, I.F. Elastic/plastic models for soils and sands. Int. J. Mech. Sci. 2005, 47, 493–508. [Google Scholar] [CrossRef]
- Hashiguchi, K. Subloading surface model in unconventional plasticity. Int. J. Solids Struct. 1989, 25, 917–945. [Google Scholar] [CrossRef]
- Hashiguchi, K.; Chen, Z.-P. Elastoplastic constitutive equation of soils with the subloading surface and the rotational hardening. Int. J. Num. Anal. Methods Geomech. 1998, 22, 197–227. [Google Scholar] [CrossRef]
- Wan, Z.; Song, C.; Xue, S.; Xie, L. Elastoplastic Constitutive Model Describing Dilatancy Behavior of Overconsolidated Clay. Int. J. Géoméch. 2021, 21, 04021008. [Google Scholar] [CrossRef]
- Yamakawa, Y.; Hashiguchi, K.; Ikeda, K. Implicit stress-update algorithm for isotropic Cam-clay model based on the subloading surface concept at finite strains. Int. J. Plast. 2010, 26, 634–658. [Google Scholar] [CrossRef]
- Fincato, R.; Tsutsumi, S. Closest-point projection method for the extended subloading surface model. Acta Mech. 2017, 228, 4213–4233. [Google Scholar] [CrossRef]
- Yamada, S.; Noda, T.; Nakano, M.; Asaoka, A. Combined-loading elastoplastic constitutive model for a unified description of the mechanical behavior of the soil skeleton. Comput. Geotech. 2022, 141, 104521. [Google Scholar] [CrossRef]
- Yao, Y.; Gao, Z.; Zhao, J.; Wan, Z. Modified UH Model: Constitutive Modeling of Overconsolidated Clays Based on a Parabolic Hvorslev Envelope. J. Geotech. Geoenviron. Eng. 2012, 138, 860–868. [Google Scholar] [CrossRef]
- Yao, Y.-P.; Liu, L.; Luo, T.; Tian, Y.; Zhang, J.-M. Unified hardening (UH) model for clays and sands. Comput. Geotech. 2019, 110, 326–343. [Google Scholar] [CrossRef]
- Nakai, T.; Hinokio, M. A Simple Elastoplastic Model for Normally and Over Consolidated Soils with Unified Material Parameters. Soils Found. 2004, 44, 53–70. [Google Scholar] [CrossRef] [Green Version]
- Zhang, F.; Xiong, Y.; Itani, Y.; One, E. Thermo-elasto-viscoplastic mechanical behavior of manmade rock and its numerical modeling. Undergr. Space 2019, 4, 121–132. [Google Scholar] [CrossRef]
- Zhang, F.; Yashima, A.; Nakai, T.; Ye, G.L.; Aung, H. An elasto-viscoplastic model for soft sedimentary rock based on tij concept and subloading yield surface. Soils Found. 2005, 45, 65–73. [Google Scholar]
- Lu, Y.; Zhu, W.-X.; Ye, G.-L.; Zhang, F. A unified constitutive model for cemented/non-cemented soils under monotonic and cyclic loading. Acta Geotech. 2021, 1–19. [Google Scholar] [CrossRef]
- Uchaipichat, A.; Khalili, N. Experimental investigation of thermo-hydro-mechanical behaviour of an unsaturated silt. Géotechnique 2009, 59, 339–353. [Google Scholar] [CrossRef]
- Bishop, A.W.; Henkel, D.J. The Measurement of Soil Properties in the Triaxial Tests; Edward Arnold (Publishers) Ltd.: London, UK, 1957. [Google Scholar]
- Zervoyanis, C. Etude synthétique des propriétés mécaniques des argiles et des sables sur chemin oedométrique et triaxial de revolution. In Thèse de Docteur-Ingénieur; Ecole Centrale de Paris: Paris, France, 1982. (In French) [Google Scholar]
- Biarez, J.; Hicher, P.Y. Elementary Mechanics of Soil Behaviour; August Aimé Balkema: Rotterdam, The Netherlands, 1994. [Google Scholar]


| Soil Name | e0 | µ | M | λ | κ | β |
|---|---|---|---|---|---|---|
| Weald clay | 0.69 | 0.25 | 0.83 | 0.093 | 0.025 | 1.86 |
| Black Kaolin clay | 1.44 | 0.25 | 0.83 | 0.244 | 0.079 | 2.35 |
| White clay | 0.63 | 0.25 | 0.93 | 0.089 | 0.034 | 1.92 |
| Fujinomori clay | 0.83 | 0.25 | 1.36 | 0.093 | 0.02 | 1.80 |
Publisher’s Note: MDPI stays neutral with regard to jurisdictional claims in published maps and institutional affiliations. |
© 2022 by the authors. Licensee MDPI, Basel, Switzerland. This article is an open access article distributed under the terms and conditions of the Creative Commons Attribution (CC BY) license (https://creativecommons.org/licenses/by/4.0/).
Share and Cite
Tong, C.-X.; Liu, H.-W.; Li, H.-C. Constitutive Modeling of Normally and Over-Consolidated Clay with a High-Order Yield Function. Mathematics 2022, 10, 1376. https://doi.org/10.3390/math10091376
Tong C-X, Liu H-W, Li H-C. Constitutive Modeling of Normally and Over-Consolidated Clay with a High-Order Yield Function. Mathematics. 2022; 10(9):1376. https://doi.org/10.3390/math10091376
Chicago/Turabian StyleTong, Chen-Xi, Hong-Wei Liu, and Hai-Chao Li. 2022. "Constitutive Modeling of Normally and Over-Consolidated Clay with a High-Order Yield Function" Mathematics 10, no. 9: 1376. https://doi.org/10.3390/math10091376