1. Introduction
The paper has the following structure:
In Introduction, we describe some approaches of the capital structure theory: traditional approach, Modigliani–Miller theory, and some of its modifications.
We generalize the Brusov–Filatova–Orekhova (BFO) theory for the case of arbitrary frequency of payments of income tax and get generalized Brusov–Filatova–Orekhova (BFO) formulas for all main company financial indicators: for the weighted average cost of capital, WACC, for the company value, V, for the equity cost, ke.
Within the generalized Brusov–Filatova–Orekhova (BFO) theory, the dependence of the main financial parameters of the company (the weighted average cost of capital, WACC, equity cost, ke, company capitalization, V) on leverage level L at different frequency of payments of income tax p is studied.
Obtained results allow coming to some very important conclusions and present recommendations on how frequently a company should pay income tax in order to decrease the cost of attracting capital and to increase its capitalization.
1.1. Capital Structure of the Company
This article is the first article of Special issue “Recent Development of Mathematical Methods in Financial Management”, written by the editors, which could be considered as an Editorial. It is devoted to one of the most important problems of financial management—problem of capital cost and capital structure of the company. Management by capital structure of the company (the relationship between equity and debt capital of the company) allows the company′s management to solve the main task—increasing the company value. This also relates with the problem of optimal capital structure, which is one of the most important problems that needs to be solved in financial management: i.e., with the capital structure, minimizing the weighted average cost of capital,
WACC, and maximizing the company capitalization,
V. The first quantitative study of influence of capital structure of the company on its (company) financial indicators was the work by Nobel Prize winners Modigliani and Miller (1958) [
1]. Before their work, the traditional approach existed, based on empirical data analysis. In 2008 the modern capital cost and capital structure theory, Brusov–Filatova–Orekhova (BFO) theory, was developed [
2], which made Modigliani–Miller theory its particular case. Within BFO theory many qualitatively new effects have been discovered, which are absent within the Modigliani–Miller theory. BFO theory has destroyed some main existing principles of financial management, among them the world famous trade off theory [
3,
4,
5], which during many decades was considered as keystone of formation of optimal capital structure of the company. Brusov–Filatova–Orekhova have proven the bankruptcy of trade off theory and have found the cause of this (Section 4 in monograph [
6]). Below we briefly describe the historical development of the theory of the capital cost and the capital structure.
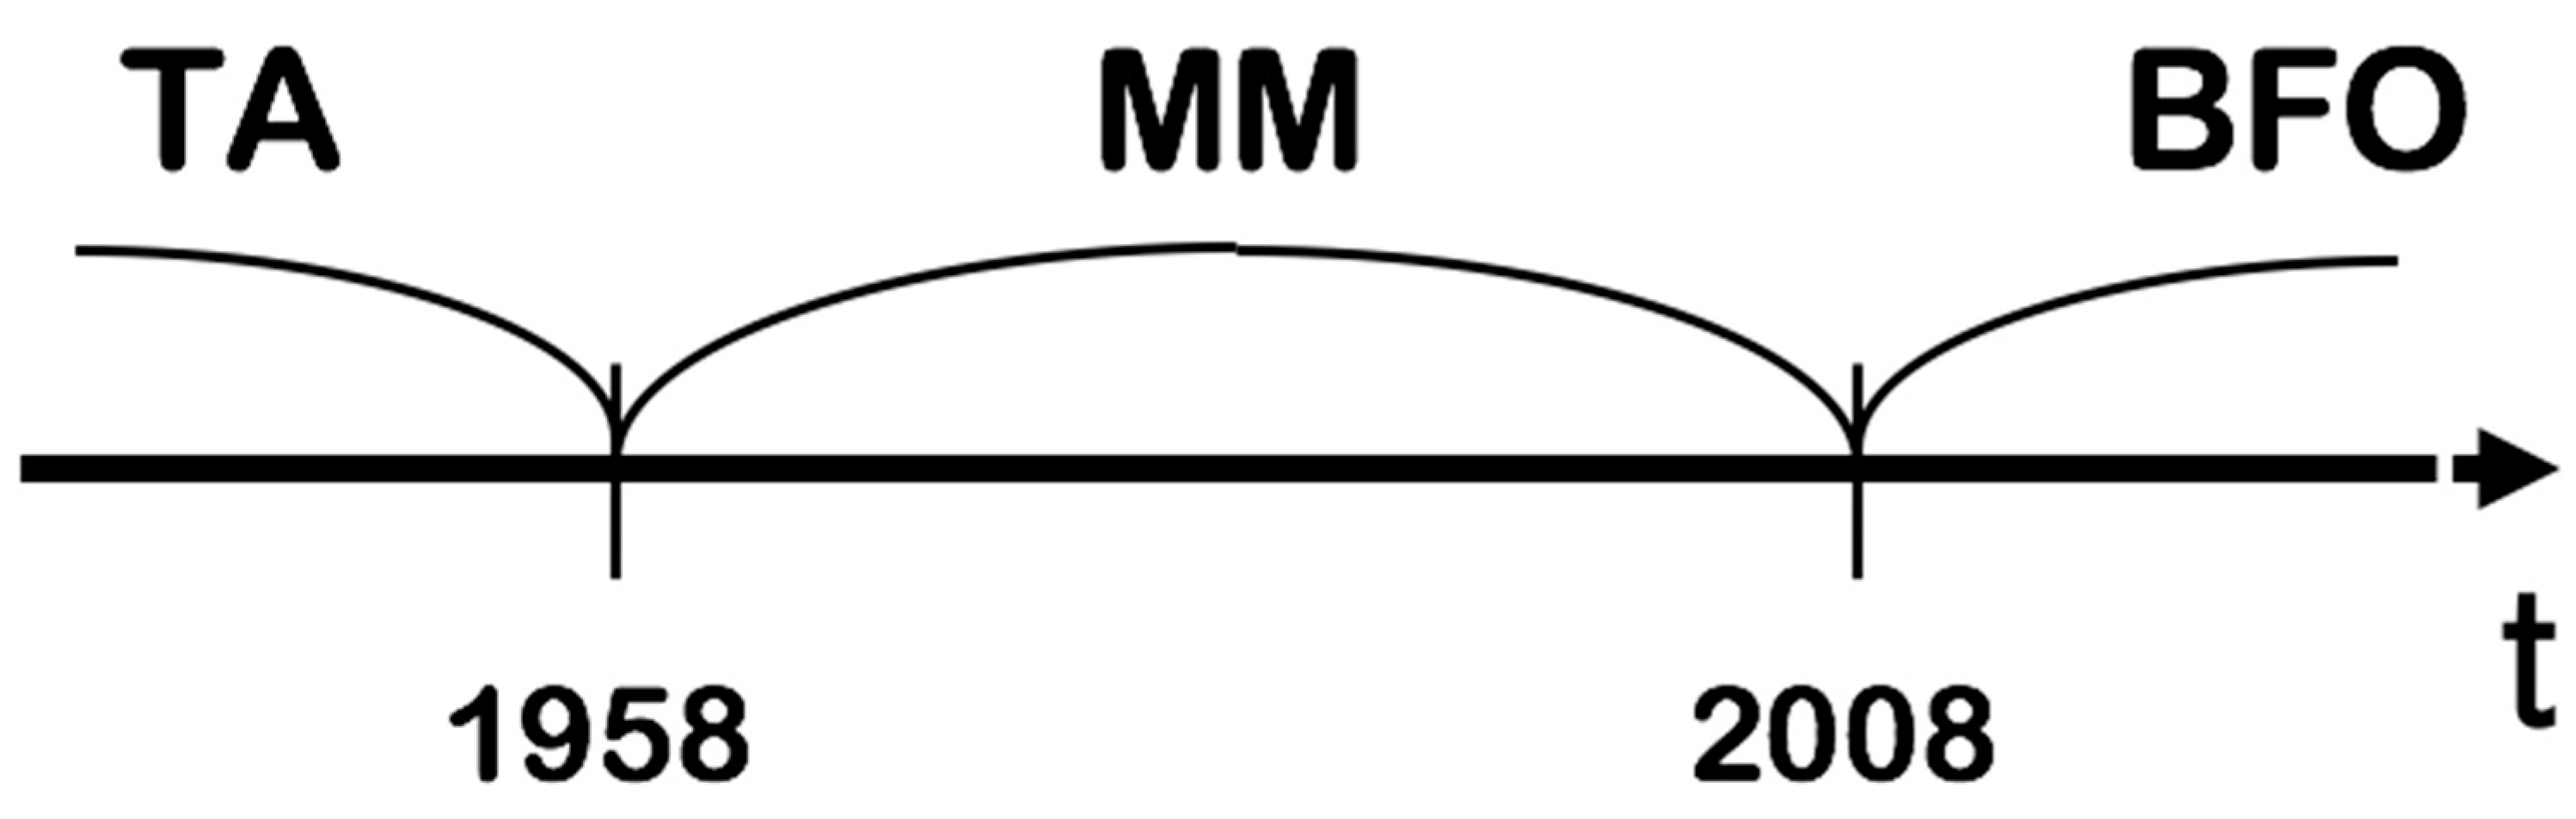
Figure 1 shows the historical development of the theory of capital cost and capital structure (from the empirical traditional approach, through perpetuity Modigliani–Miller theory to general theory of capital cost and capital structure–Brusov–Filatova–Orekhova (BFO) theory [
6].
Myers [
7] in 2001 considered the case of one-year company and showed that
WACC in this case is bigger than in the case of Modigliani–Miller, and the company value,
V, is less than in the case of Modigliani–Miller.
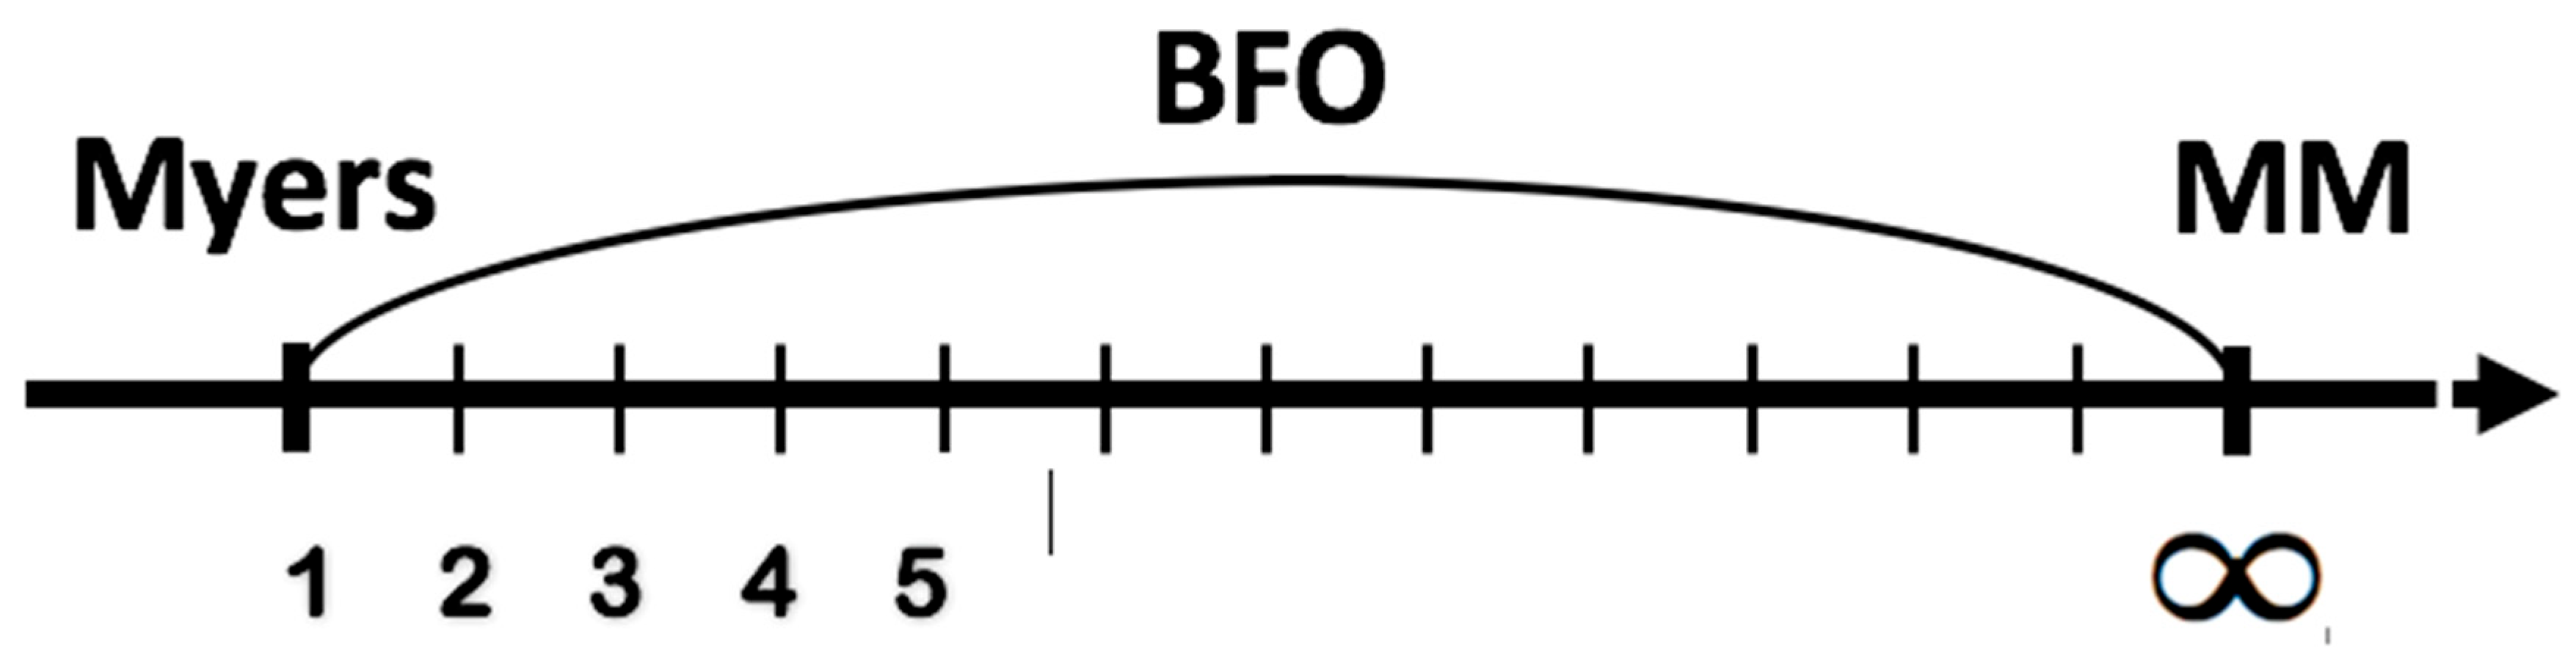
Before 2008 there were only two results for capital structure of the company: Modigliani–Miller one for perpetuity company [
1,
8,
9] and Myers [
7] for one-year company (see
Figure 2). Wherein the Brusov–Filatova–Orekhova theory filled out the whole interval between
t = 1 and
t =
. Brusov–Filatova–Orekhova theory allows calculating the company value,
V, the weighted average cost of capital,
WACC, the equity cost
, and other financial parameters for arbitrary age companies and for arbitrary life-time companies. A lot of new meaningful effects, which are absent in Modigliani–Miller theory [
6] have been discovered in the BFO theory.
The main purpose of this paper is to generalize and further develop the Brusov–Filatova–Orekhova (BFO) theory, taking into account the payment of tax on profit with an arbitrary frequency (monthly, quarterly, semi-annually, or annually), which takes place in real economic practice. Note that both major theories on the cost of capital and capital structure of the Brusov–Filatova–Orekhova (BFO) theory and its perpetuity limit, the Modigliani–Miller theory, take into account the annual income tax payments. The latter was recently generalized by us to the case of an arbitrary periodicity in the payment of income tax [
10], which showed a significant change in the results of the classical Modigliani–Miller theory. Here we make this generalization for the Brusov–Filatova–Orekhova (BFO) theory.
Below we discuss the traditional approach, the Modigliani–Miller theory and its different modifications, the Brusov–Filatova–Orekhova (BFO) theory.
1.2. The Modigliani–Miller Theory
Before the Modigliani–Miller work, the traditional approach existed, based on empirical data analysis. In the traditional approach, weighted average cost of capital,
WACC, and the company value,
V, depend on the capital structure, on the leverage level,
L. The cost of debt is lower than cost of equity via the fact that first one has lower risk, because creditor claims are met prior to shareholders claims in the event of bankruptcy. Thus, the increase of the share of lower-cost debt capital up to the values that do not violate the financial sustainability and do not lead to growth of risk of bankruptcy leads to lower weighted average cost of capital,
WACC. The profitability, required by investors, which is equal to the equity cost, is growing; but its growth does not compensate for the benefits from use of lower-cost debt capital. Therefore, in the traditional approach, the increase of leverage level (at low leverage level) leads to decrease of
WACC and to the associated increase of the value of company
V. At high leverage level, financial difficulties and the risk of bankruptcy appear. The debt capital cost increases as well as the equity cost (which always increases with leverage level), and these lead to increase of
WACC and decrease of company value
V. Thus, competition between the advantages of debt financing at a low level of leverage and its disadvantages at a high level of leverage forms the optimal capital structure, when
WACC reaches minimum and capital value V reaches maximum. This is the main point of the traditional approach and as well as trade off theory. This empirical approach existed up to creation of the first quantitative theory by Nobel Prize Winners Modigliani and Miller (1958) [
1].
In their first paper [
1] Modigliani and Miller (MM) have come to the conclusion, that choosing the ratio between the debt and equity capital does not affect the capitalization of the company,
V, as well as weighted average cost of capital,
WACC. This conclusion was absolutely different from the results of traditional approach. The main assumptions of MM were that there are no taxes, no bankruptcy costs, no transaction costs, perfect financial markets with symmetry information exist, the borrowing costs are equal for both companies and investors, etc.
Modigliani and Miller analyzing the influence of financial leverage on
V and
V0, weighted average cost of capital,
WACC and
ke, get the following results: (here, EBIT–earnings before interest and taxes,
k0 is discount rate,
V and
V0 are the values of levered and unlevered companies,
ke is the equity cost)
This leads to the following expressions for weighted average cost of capital,
WACC:
Here k0 is the equity cost for financially independent company. For financially dependent company, k0 is the equity cost at zero leverage level (L = 0).
From (1), and formula for
WACC definition
One can derive the formula for the cost of equity capital, ke.
Here,
| D | debt capital value; |
| S | equity capital value; |
| debt capital cost and its share; |
| equity capital cost and its share; |
WACC | leverage level
weighted average cost of capital. |
Thus, we have the following formula for equity cost
From (5) it follows that equity cost, ke, linearly increases with leverage level L.
In 1963, Modigliani and Miller [
8] accounted the tax on profit and got the following formula for the cost of financially dependent company,
V,
where
V0 is the value of financially independent company,
D is debt value, and
T is the tax on profit.
Below we get the expression for WACC and the equity cost ke under the existence of corporate taxes.
1.3. Weighted Average Cost of Capital, WACC
Substituting into (6)
, one gets
Putting
into Formula (7), we get
Here CF is the income of the company for one period.
From (8), we arrive to the expression for weighted average cost of capital,
WACCThis formula for WACC is one of the main results of Modigliani–Miller theory with taxes.
The equity cost, ke
Let us derive formula for equity cost.
The weighted average cost of capital
WACC in the presence of corporate taxes has the following form
Equating Equations (9) and (10), one gets
From (11), we get the following expression for equity cost,
ke [
8]:
The Formula (12) is different from Formula (5) (case without tax) only by the multiplier (1 − T) in term, meaning a premium for risk. The multiplier (1 − T) is less than unit, thus the corporate income tax leads to decrease of the slope of the curve ke(L) with respect to L–axis.
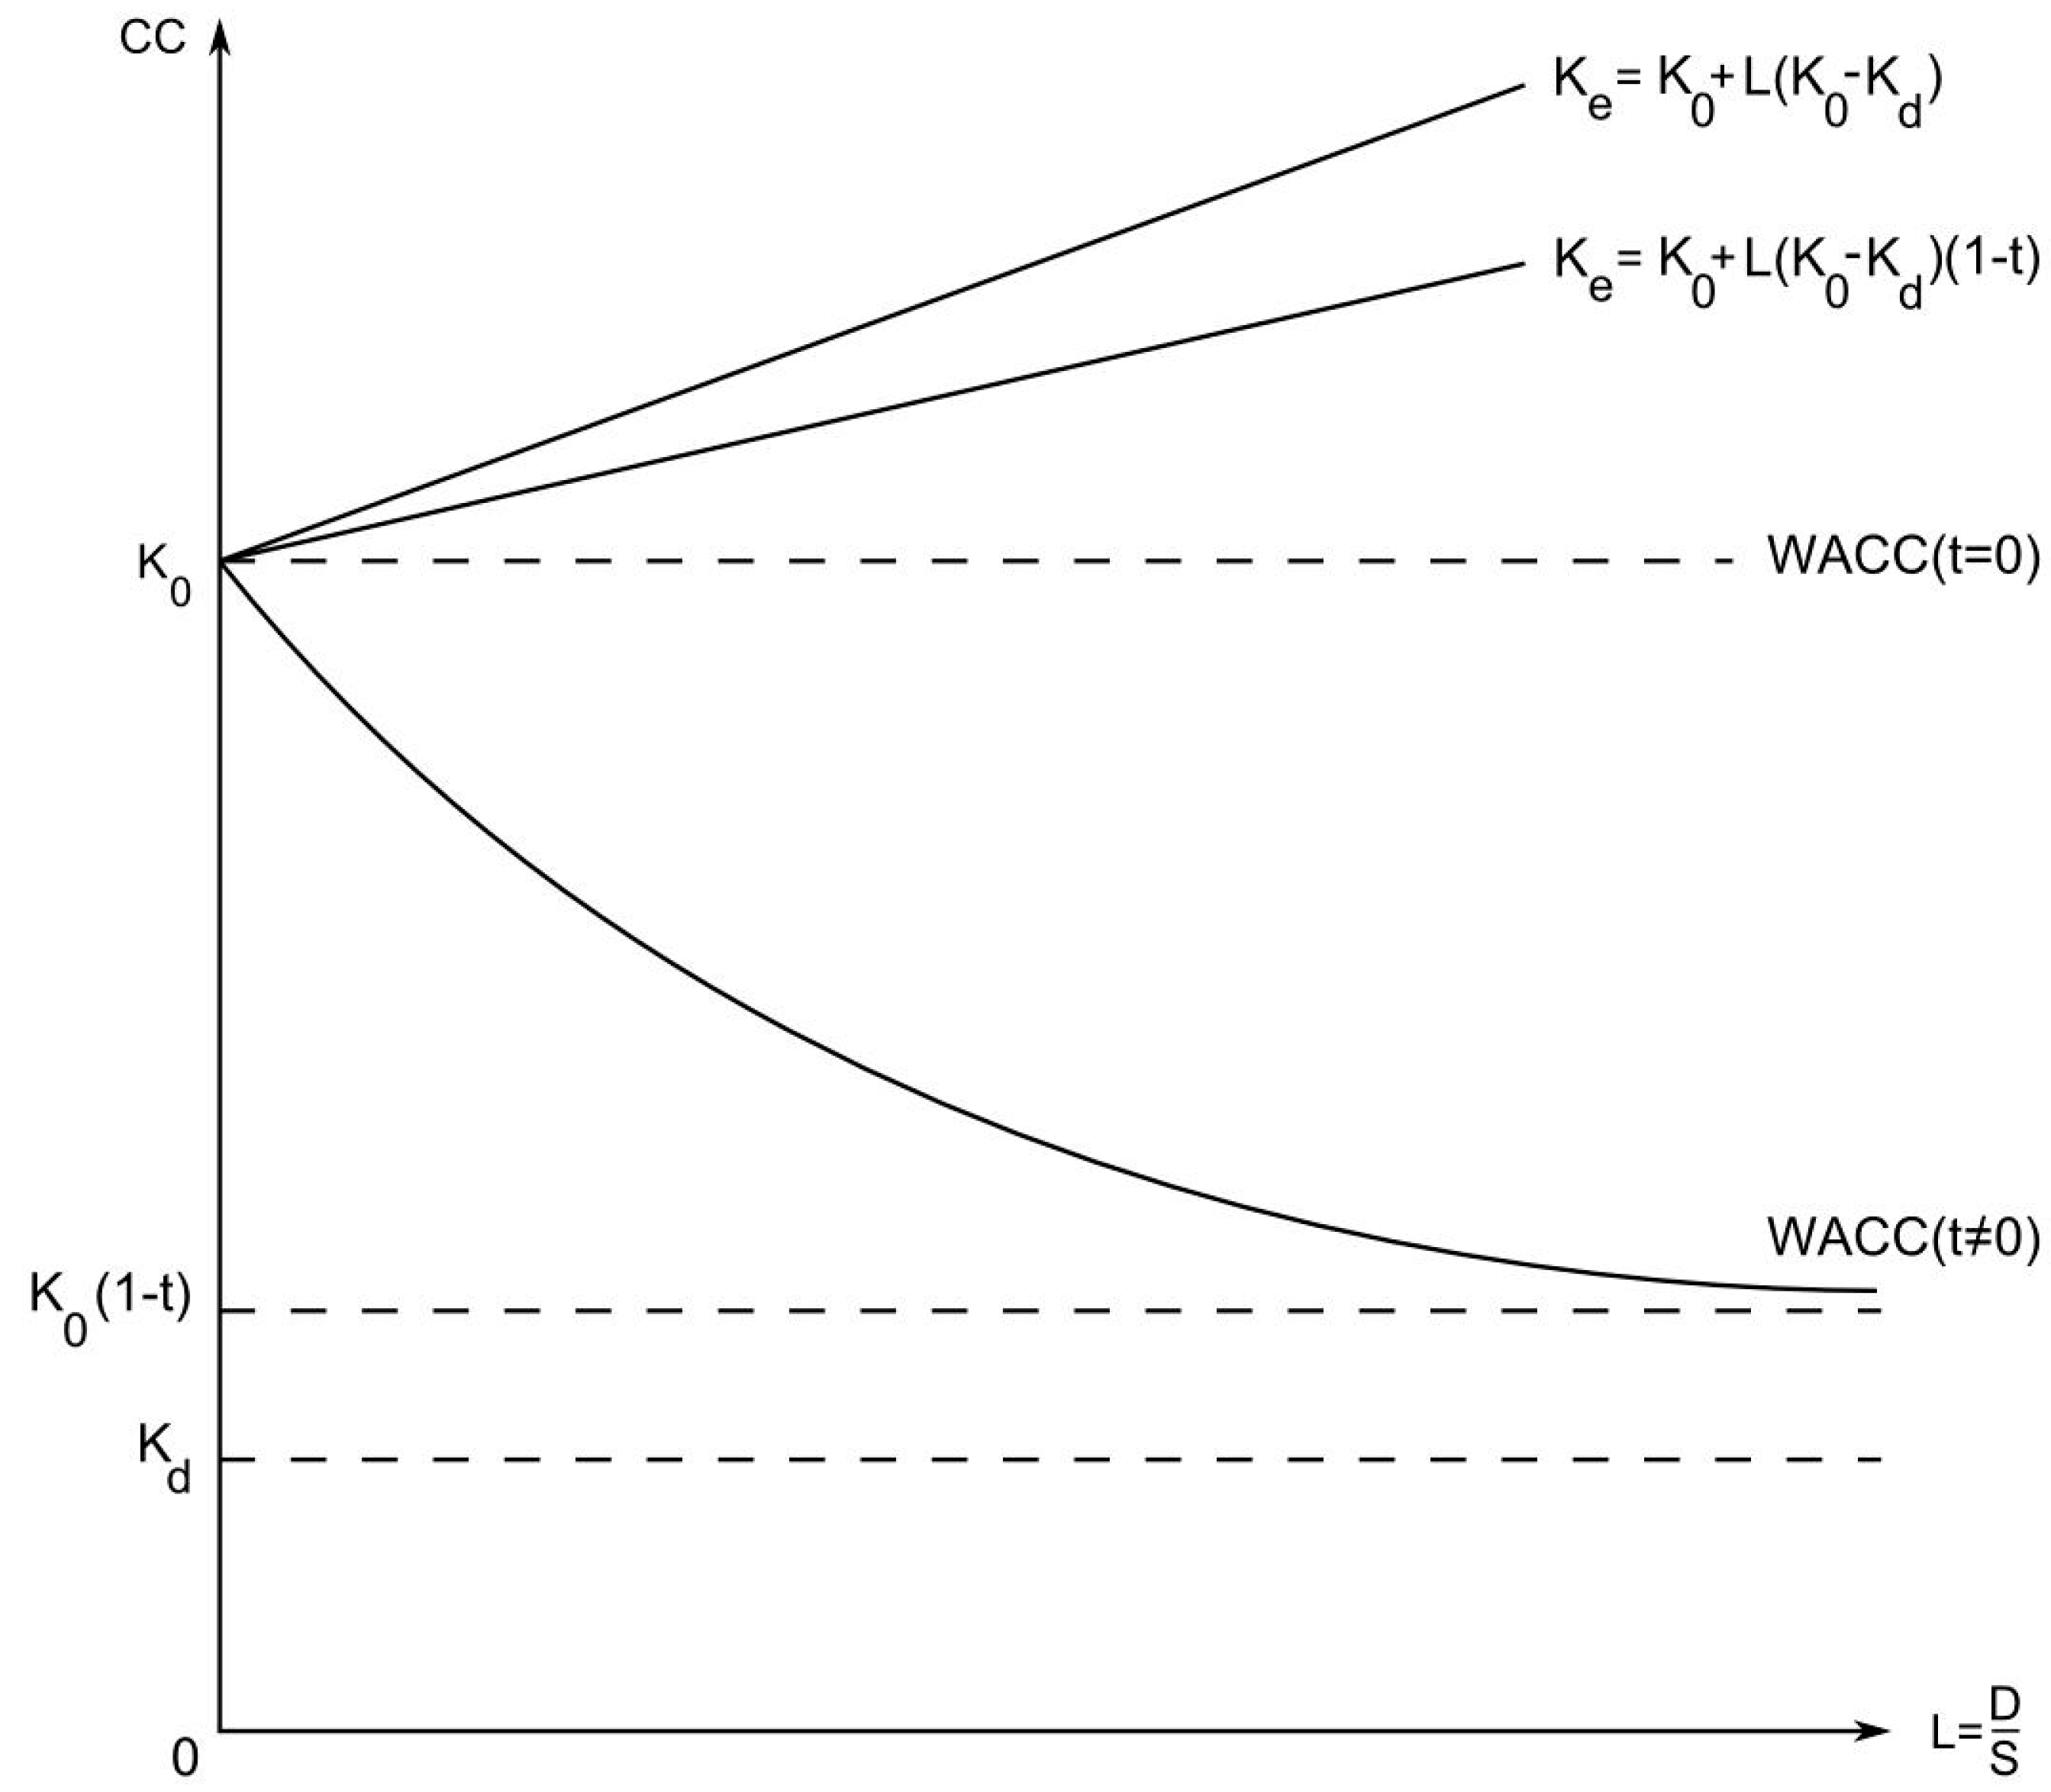
From Formulas (5), (9), and (12) we get the following conclusions. When leverage level grows, (1) value of company,
V, increases; (2)
WACC decreases from
k0 up to
(at
); (3) equity cost increases linearly from
k0 up to infinity (
Figure 3).
2. Some Modifications of Modigliani–Miller Theory
2.1. Hamada Model: Accounting Market Risk
The Modigliani–Miller theory were united with Capital Asset Pricing Model (CAPM) in 1969 [
11] by R. Hamada, who has derived the following formula for the leveraged company equity cost, accounting both financial and business risk of company:
where
bU is the
β-coefficient of the same group of business risk company, that the considering company, but with
L = 0. The Formula (13) describes the profitability of equity capital
ke and consists of a sum of three components: risk-free profitability
kF, which compensates a temporary value of their money to shareholders, premium for business risk
, and premium for financial risk
. Without debt financing, the financial risk is equal to zero, and only the business risk premium will be received by shareholders.
2.2. The Account of Corporate and Individual Taxes (Miller Model)
In 1963, Modigliani and Miller [
8] have accounted the taxation of corporate income, but the individual taxes of investors were not taken into account.
Both corporate and individual taxes has been taken into account by Merton Miller in 1977 [
12], who studied the influence of debt financing on the company capitalization. In Miller model, the following definitions have been used:
TC—the rate of tax on corporate income,
TS—the tax rate on income of an individual investor from his ownership by corporation stock,
TD—tax on interest income from the provision of investor-individuals of credits to other investors and companies rate. The income from shares comes in the form of a dividend and as capital profits, so
TS is a weighted average value of the tax on capital profits on shares and on dividends rates. The profit from the provision of loans comes in the form of the interests. The former are usually taxed at a higher rate. For the capitalization of the financially independent company one has:
Term accounts for the individual taxes. Numerator shows the part of the operating company′s profit which remains in the possession of the investors, after the company pays taxes on income, and then shareholders pay individual taxes on profit from stock ownership. Since individual taxes reduce profits, remaining at investors, the last reduce as well an overall assessment of the capitalization of financially independent company.
2.3. More General Case for WACC Formula
In [
13,
14,
15,
16] more general than Modigliani–Miller (MM) formula for the
WACC has been derived: it is described by the following formula [
13]
Here k0, kd, and kTS are the expected returns respectively on the financially independent company, the debt and the tax shield, V is the capitalization of the financially dependent company, VTS is the tax shield value, D is the debt value, and TC is the rate of corporate tax.
Formula (15) is derived from the
WACC definition and the balance identity (see as well Berk and De Marzo, 2007 [
15]). Although Equation (15) is general enough, some additional conditions are required for its practical applicability. If the
WACC is constant over time, as it is stated in [
13], the levered company value can be found by discounting with the
WACC for the unlevered free cash-flows. The resulting formulas, which describe the special cases, where the
WACC is constant, can be found in textbooks [
15,
16].
First, Modigliani and Miller in 1963 [
8] assume that the level of debt
D is constant. Then, as the expected after-tax cash-flow of the financially independent company is fixed,
V0 is also constant. By assumption,
kTS =
kd and the tax shield value is
TS =
tD. Thus, for the financially dependent company capitalization, V, we arrive to the following formula for
WACC instead of Formula (15):
We think that “classical” Modigliani–Miller (MM) theory, suggesting the equality of the expected returns on the debt
kd and of the tax shield
kTS (via the fact that both of them have debt nature), is much more reasonable and namely the “classical” Modigliani–Miller (MM) theory, which is still widely used in practice, has been modified by us in [
10].
2.4. Fiscal Pressure, Financial Liquidity, Financial Solvency and Financial Leverage
The problem of fiscal pressure is more current than ever in most countries. The article by Batrancea [
17] was the first empirical study of the impact of fiscal pressure on the financial equilibrium of energy companies. Empirical results obtained by econometric models showed that fiscal pressure has stronger impacts on the short- and long-term equilibrium of oil and electricity companies than of gas companies. The research could be useful to managers of energy companies when estimating the evolution of equilibrium state of the company considering different possible financial crises.
How financial liquidity and financial solvency impact the performance of healthcare companies has been studied by Batrancea [
18], who used econometric models with two-stage least squares (2SLS) panel and panel generalized method of moments (GMM). From an empirical evidence it follows that the financial parameters, such as current liquidity ratio, quick liquidity ratio, and financial leverage significantly influenced company performance measured by gross margin ratio, return on assets, operating margin ratio, earnings before interest, tax, depreciation, and amortization. Strategies were also addressed with the intention to improve business performance based on liquidity and solvency insights.
2.5. Brusov–Filatova–Orekhova (BFO) Theory
The suggestion about perpetuity of the companies and of all financial flows is the most serious limitations of the Modigliani–Miller theory. This limitation has been lifted up in 2008 by Brusov, Filatova, and Orekhova [
4], who have created the modern theory of capital cost and capital structure, generalizing the Modigliani–Miller theory for the companies of arbitrary age (arbitrary life–time). They have shown that in this case, all Modigliani–Miller results [
1,
2,
3] show significant changes: in the presence of corporative taxes the company value,
V, is changed, as well as the equity cost,
ke, and the weighted average cost of capital,
WACC. A number of qualitatively new effects in corporate finance, obtained in Brusov–Filatova–Orekhova theory [
4], are absent in the Modigliani–Miller theory [
1,
8,
9].
The Brusov–Filatova–Orekhova formula for weighted average cost of capital,
WACC for the company of arbitrary age
n, takes the following form [
4]
Here, S—the equity capital value, —the debt capital share; —the equity capital cost and its share, —leverage level.
Substituting in (14)
, we easily arrive at the perpetuity (Modigliani–Miller) limit formula for weighted average cost of capital,
WACC.
Results of BFO theory are well-known in the world literature (for example, see references [
19,
20,
21,
22,
23,
24,
25]). Some papers [
25] use the BFO theory in practical calculations.
The similarities and differences between BFO and MM results are shown in
Table 1:
2.6. Trade–Off Theory
As we mentioned above, the main theory of optimal capital structure of the company during many decades was the world famous trade-off theory [
3,
4,
5], which is still used now for decision on capital structure-making. However, in 2013, Brusov et al. [
6] have proven the trade-off theory′s bankruptcy. In opposite to waiting result, it was shown that suggestion of risky debt financing which causes growth of credit rate near bankruptcy, does not lead to the weighted average cost of capital,
WACC, growing, which still decreases with leverage level. Thus, the minimum in the
WACC dependence on leverage level is absent as well. This means, that the world famous trade-off theory lacks an optimal capital structure. Brusov et al. in 2013 [
6] provided the explanation of this fact by analyzing the equity capital cost dependence on the leverage level on the risky debt capital assumption.
3. Modification of the Brusov–Filatova–Orekhova (BFO) Theory for Companies with Frequent Payments of Tax on Income
Below we use the following definitions:
| D | debt capital value |
| S | equity capital value |
| debt capital cost and its share |
| debt capital cost and its share |
WACC | leverage level
weighted average cost of capital |
k0 is the equity cost for financially independent company;
p is the number of payments of tax on profit per year;
T is tax on profit.
3.1. Calculation of the Tax Shield
We start from the calculation of the tax shield within Brusov–Filatova–Orekhova theory for the case of
p payments of tax on profit per year (payments are made at the end of periods). The tax shield,
TS, for period of
n–years is equal to the sum of discounted values of benefits from the use of tax incentives
We have a geometric progression with denominator .
After summing the progression, one obtains:
In the classical Brusov–Filatova–Orekhova theory (at
p = 1):
It is easy to obtain this result from (19), putting the frequency of payments of tax on profit p = 1.
3.2. Derivation of the Modified BFO Formula for Weighted Average Cost of Capital (WACC)
We derive now the modified formula BFO for weighted average cost of capital (WACC) for the case of p payments of tax on profit per year (payments at the end of periods).
One has for the financially dependent company value V:
Here
V0 is the value of a financially independent company. Putting expression (19) for
TS, one has:
After substituting
, we get:
Accounting that the values of financially dependent company,
V, and financially independent company,
V0, are respectively equal to
one gets:
From here we derive now the modified formula BFO for weighted average cost of capital (
WACC) for company of age
n years for the case of
p payments of tax on profit per year (payments at the end of periods).
At
p = 1 we get the
classical BFO formula
3.3. Formulas for Capital Value, V, and Equity Cost, ke
Below, in
Section 3, we investigate the dependence of the weighted average cost of capital,
WACC, capital value, V, equity cost,
ke, on leverage level
L at different frequencies of payment of tax on profit
p for three-year and six-year companies, using Microsoft Excel. For
WACC, we use Formula (10) and for capital value,
V, and equity cost,
ke, we use Formulas (28) and (29) respectively (see below).
Company of age
n capitalization could be calculated by the following formula
ke should be found from the equation
where one should substitute
WACC in the Formula (26).
4. Results
In this section we study the dependence of the weighted average cost of capital, WACC, capital value, V, equity cost, ke, on leverage level L at different frequencies of payment of tax on profit p for three-year and six-year companies, using Microsoft Excel. As we mentioned above, for WACC we use Formula (10) and for capital value, V, and equity cost, ke, we use Formulas (11) and (13) respectively.
We use the following parameters: k0 = 0.2; kd = 0.18; t = 0.2; n = 3; 6; CF = 100.
4.1. Dependence of the Weighted Average Cost of Capital, WACC, Capital Value, V, Equity Cost, ke, on Leverage Level L at Different Frequency of Payment of Tax on Profit p for Three-Year Company
4.1.1. Dependence of the Weighted Average Cost of Capital, WACC, on Leverage Level L at Different Frequency of Payment of Tax on Profit p for Three–Year Company
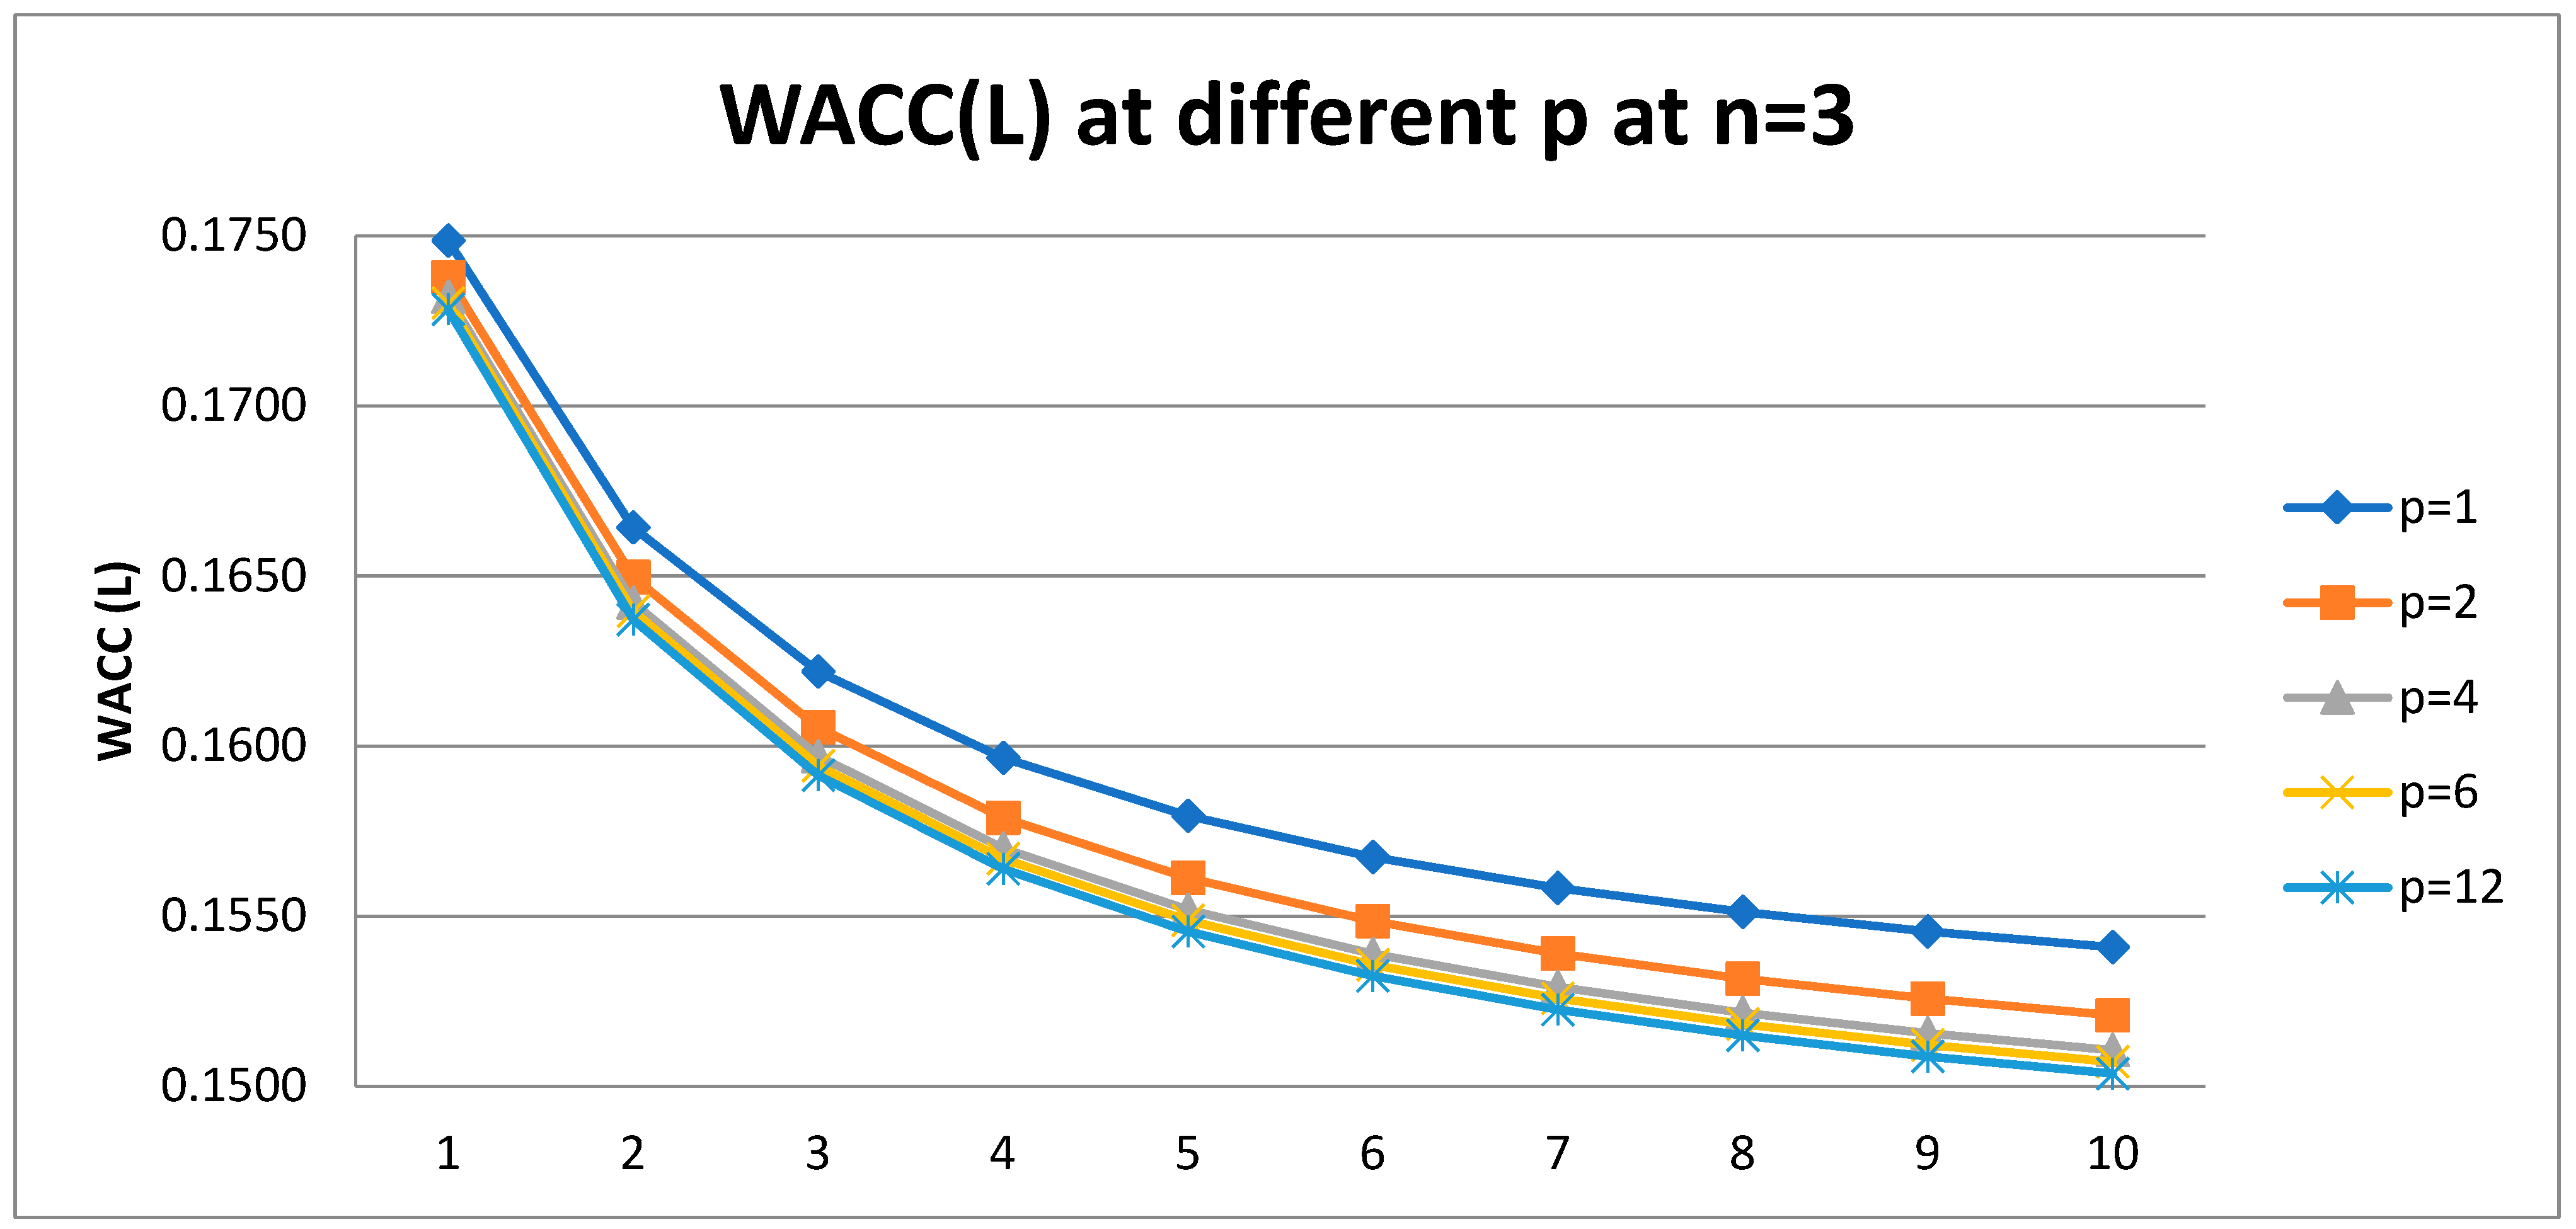
From
Table 2 and
Figure 4 it following that the weighted average cost of capital,
WACC, decreases with leverage level
L at any frequency of payments of tax on profit
p. The difference between the
WACC (
L) curves is maximum when moving from annual (
p = 1) to semi-annual (
p = 2) income tax payments and decreases when moving from semi-annual (
p = 2) to quarterly (
p = 4) payments and from quarterly (
p = 4) to monthly (
p = 12) payments.
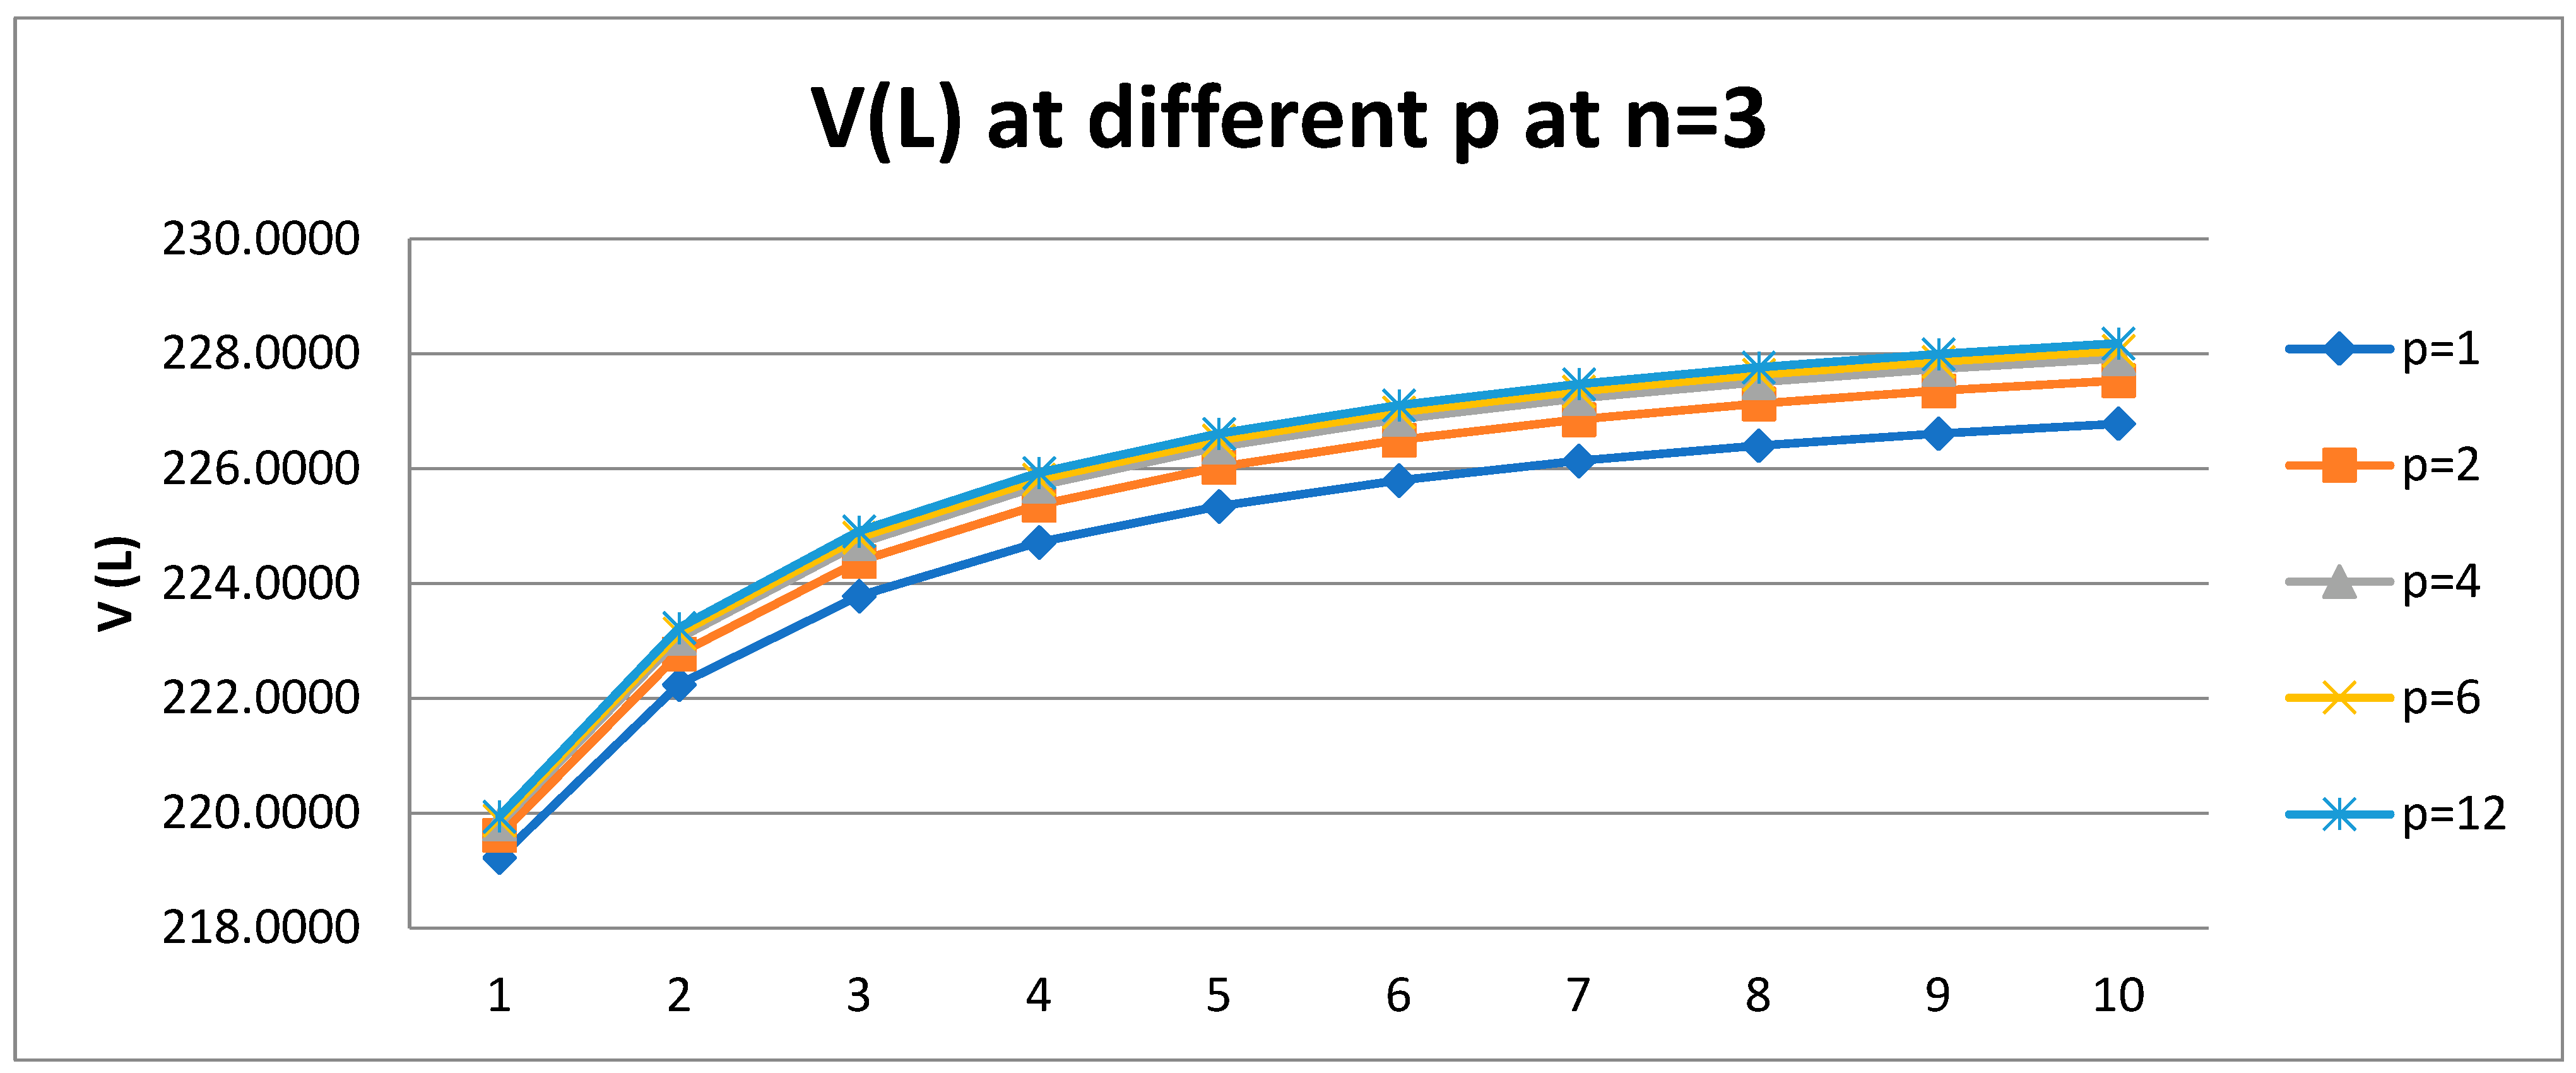
4.1.2. Dependence of the Company Value, V, on Leverage Level L at Different Frequency of Payment of Tax on Profit p for Three-Year Company
From
Table 3 and
Figure 5 it follows that the value of company
V increases with the frequency
p. The largest increase occurs when moving from annual (
p = 1) to semi-annual (
p = 2) income tax payments and decreases when moving from semi-annual (
p = 2) to quarterly (
p = 4) payments and from quarterly (
p = 4) to monthly (
p = 12) payments.
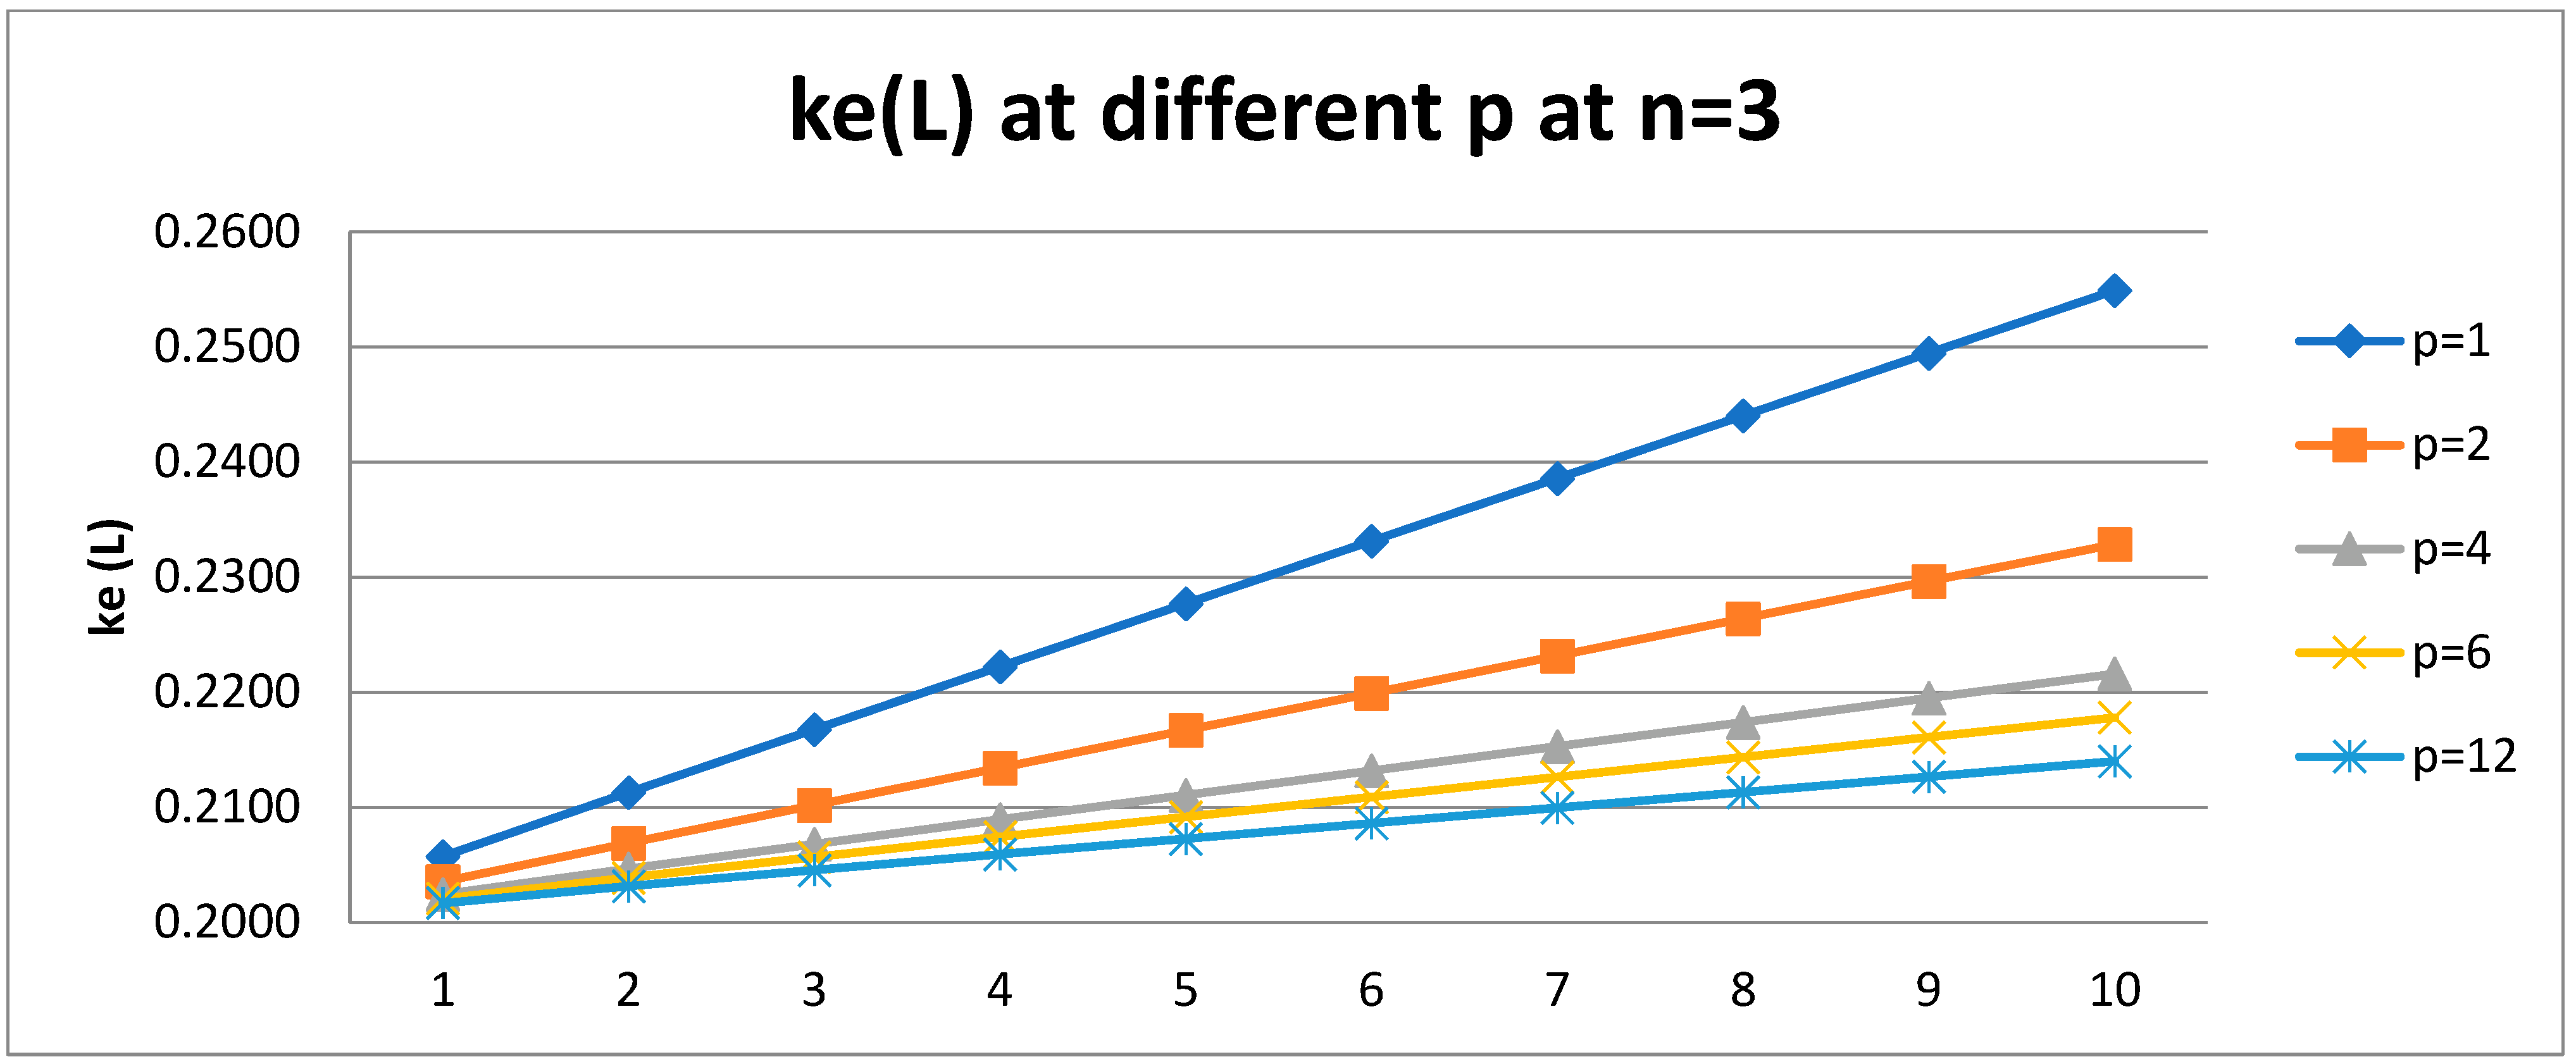
4.1.3. Dependence of the Equity Cost, ke, on Leverage Level L at Different Frequency of Payment of Tax on Profit p for Three-Year Company
From
Table 4 and
Figure 6 it following that the cost of equity
ke increases linearly with the level of leverage
L. The slope of the curve
ke(
L) depends on the frequency of paying income tax: it decreases with increasing
p, most rapidly when moving from annual (
p = 1) to semi-annual (
p = 2) payments of income tax and slower in the transition from semi-annual (
p = 2) to quarterly (
p = 4) payments and from quarterly (
p = 4) to monthly (
p = 12) payments.
4.2. Dependence of the Weighted Average Cost of Capital, WACC, Capital Value, V, Equity Cost, ke, on Leverage Level L at Different Frequency of Payment of Tax on Profit p for Six-Year Company
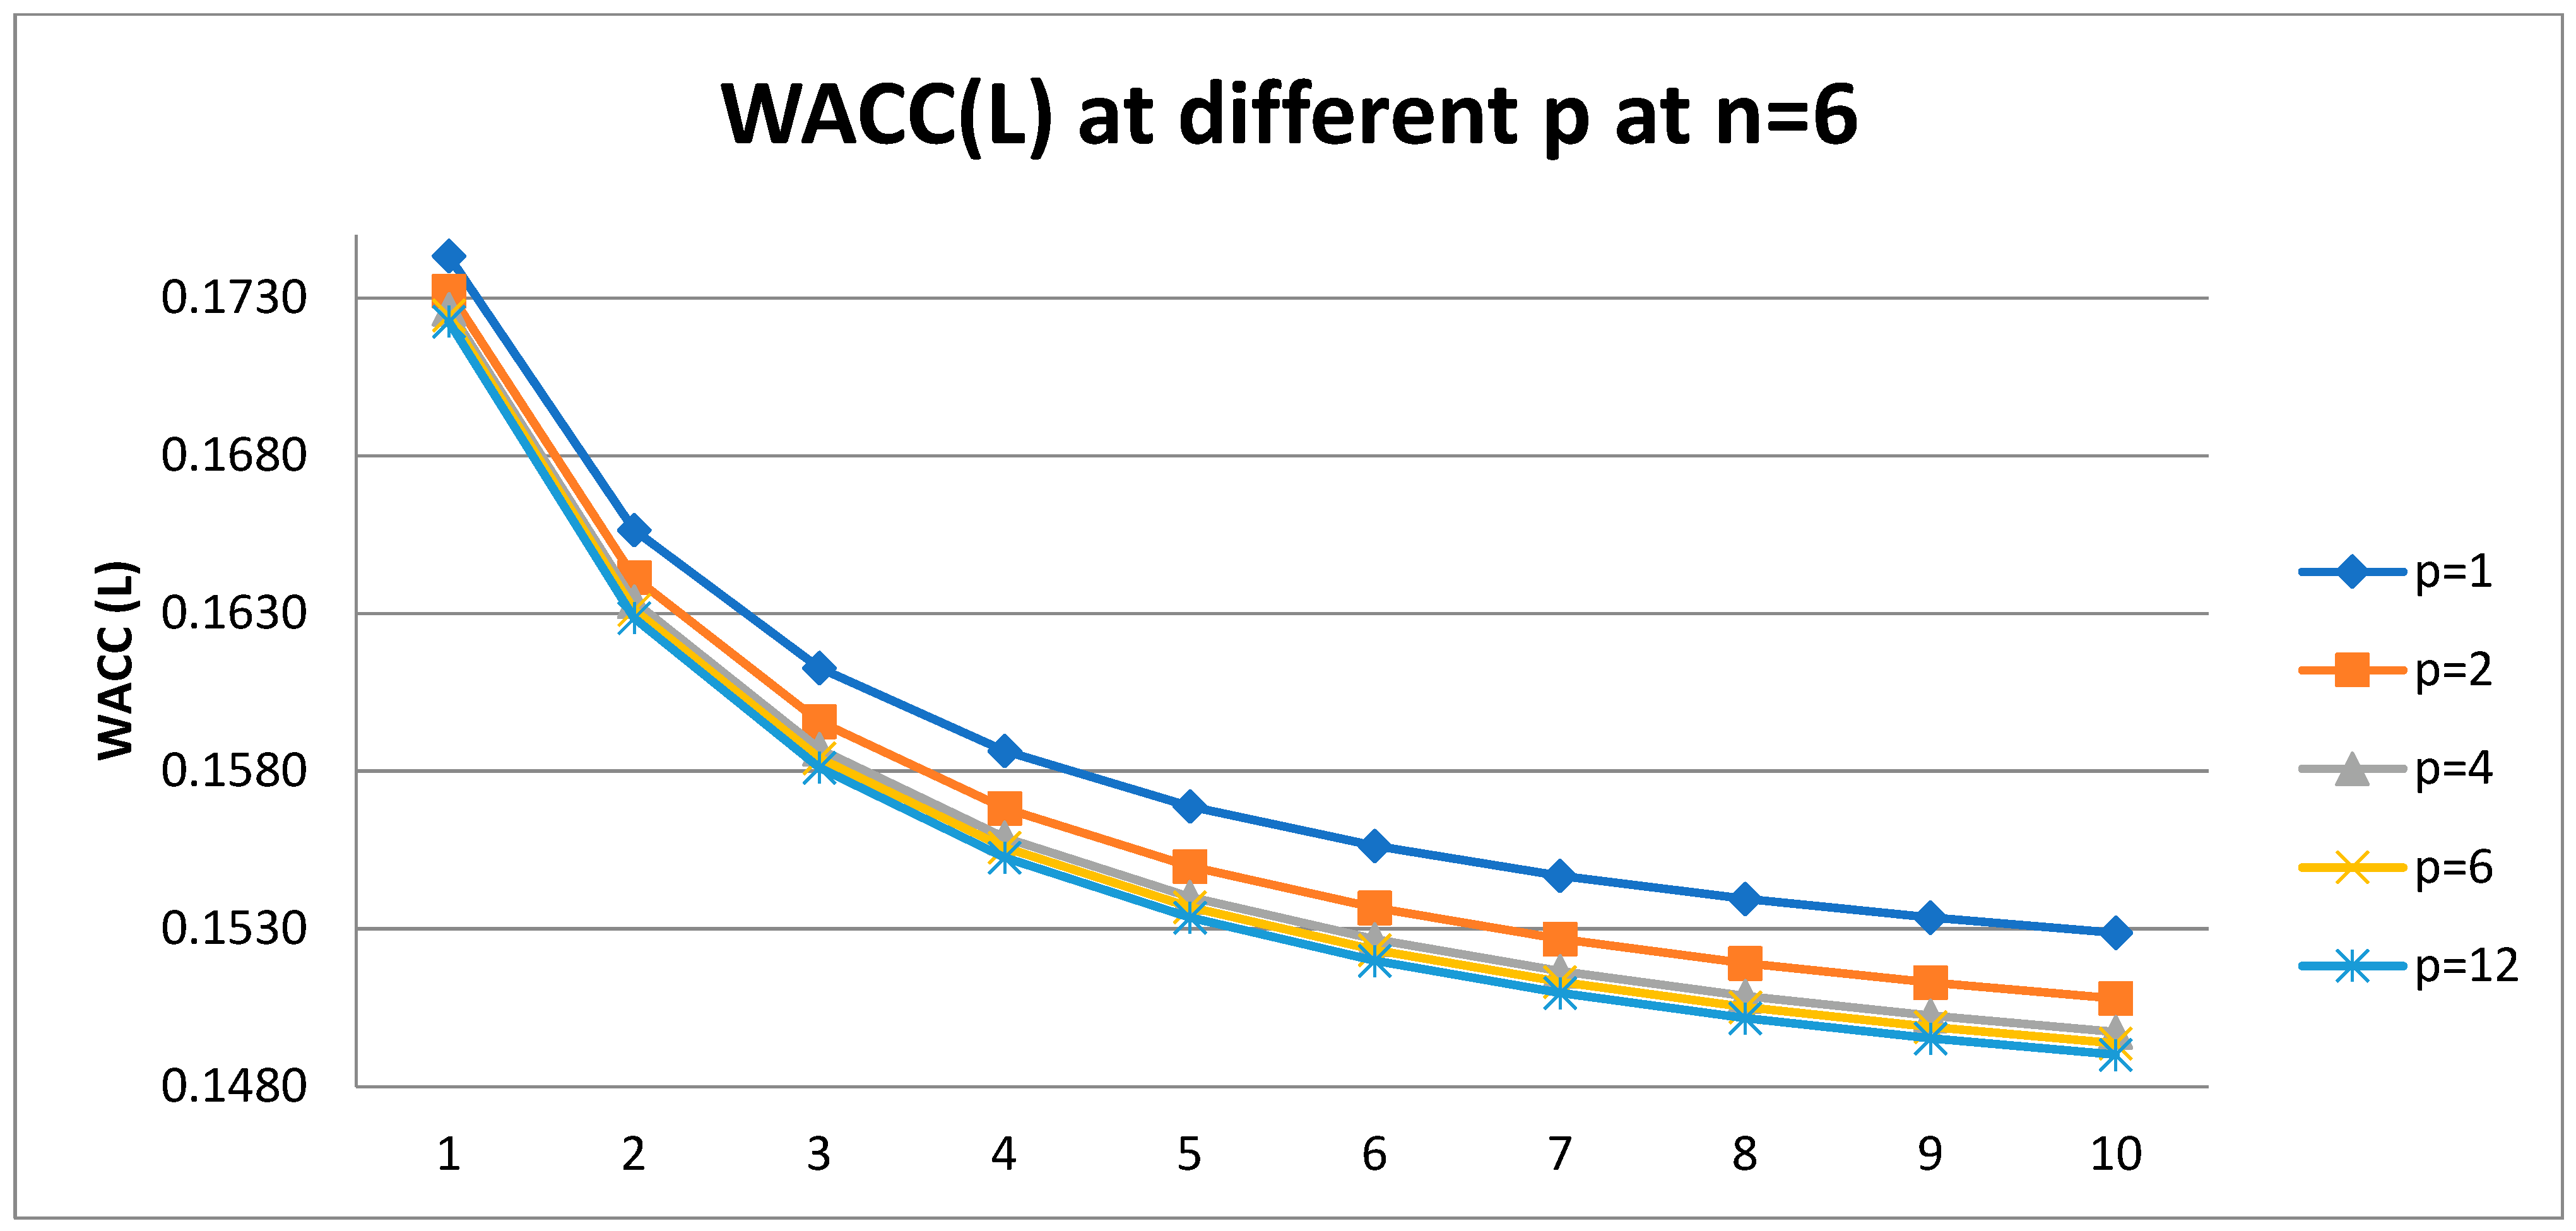
4.2.1. Dependence of the Weighted Average Cost of Capital, WACC, on Leverage Level L at Different Frequency of Payment of Tax on Profit p for Six-Year Company
We use the following parameters: k0 = 0.2; kd = 0.18; t = 0.2; n = 6;
From
Table 5 and
Figure 7 it following that the weighted average cost of capital,
WACC, decreases with leverage level
L at any frequency of payments of tax on profit
p. The difference between the
WACC(
L) curves is maximum when moving from annual (
p = 1) to semi-annual (
p = 2) income tax payments and decreases when moving from semi-annual (
p = 2) to quarterly (
p = 4) payments and from quarterly (
p = 4) to monthly (
p = 12) payments.
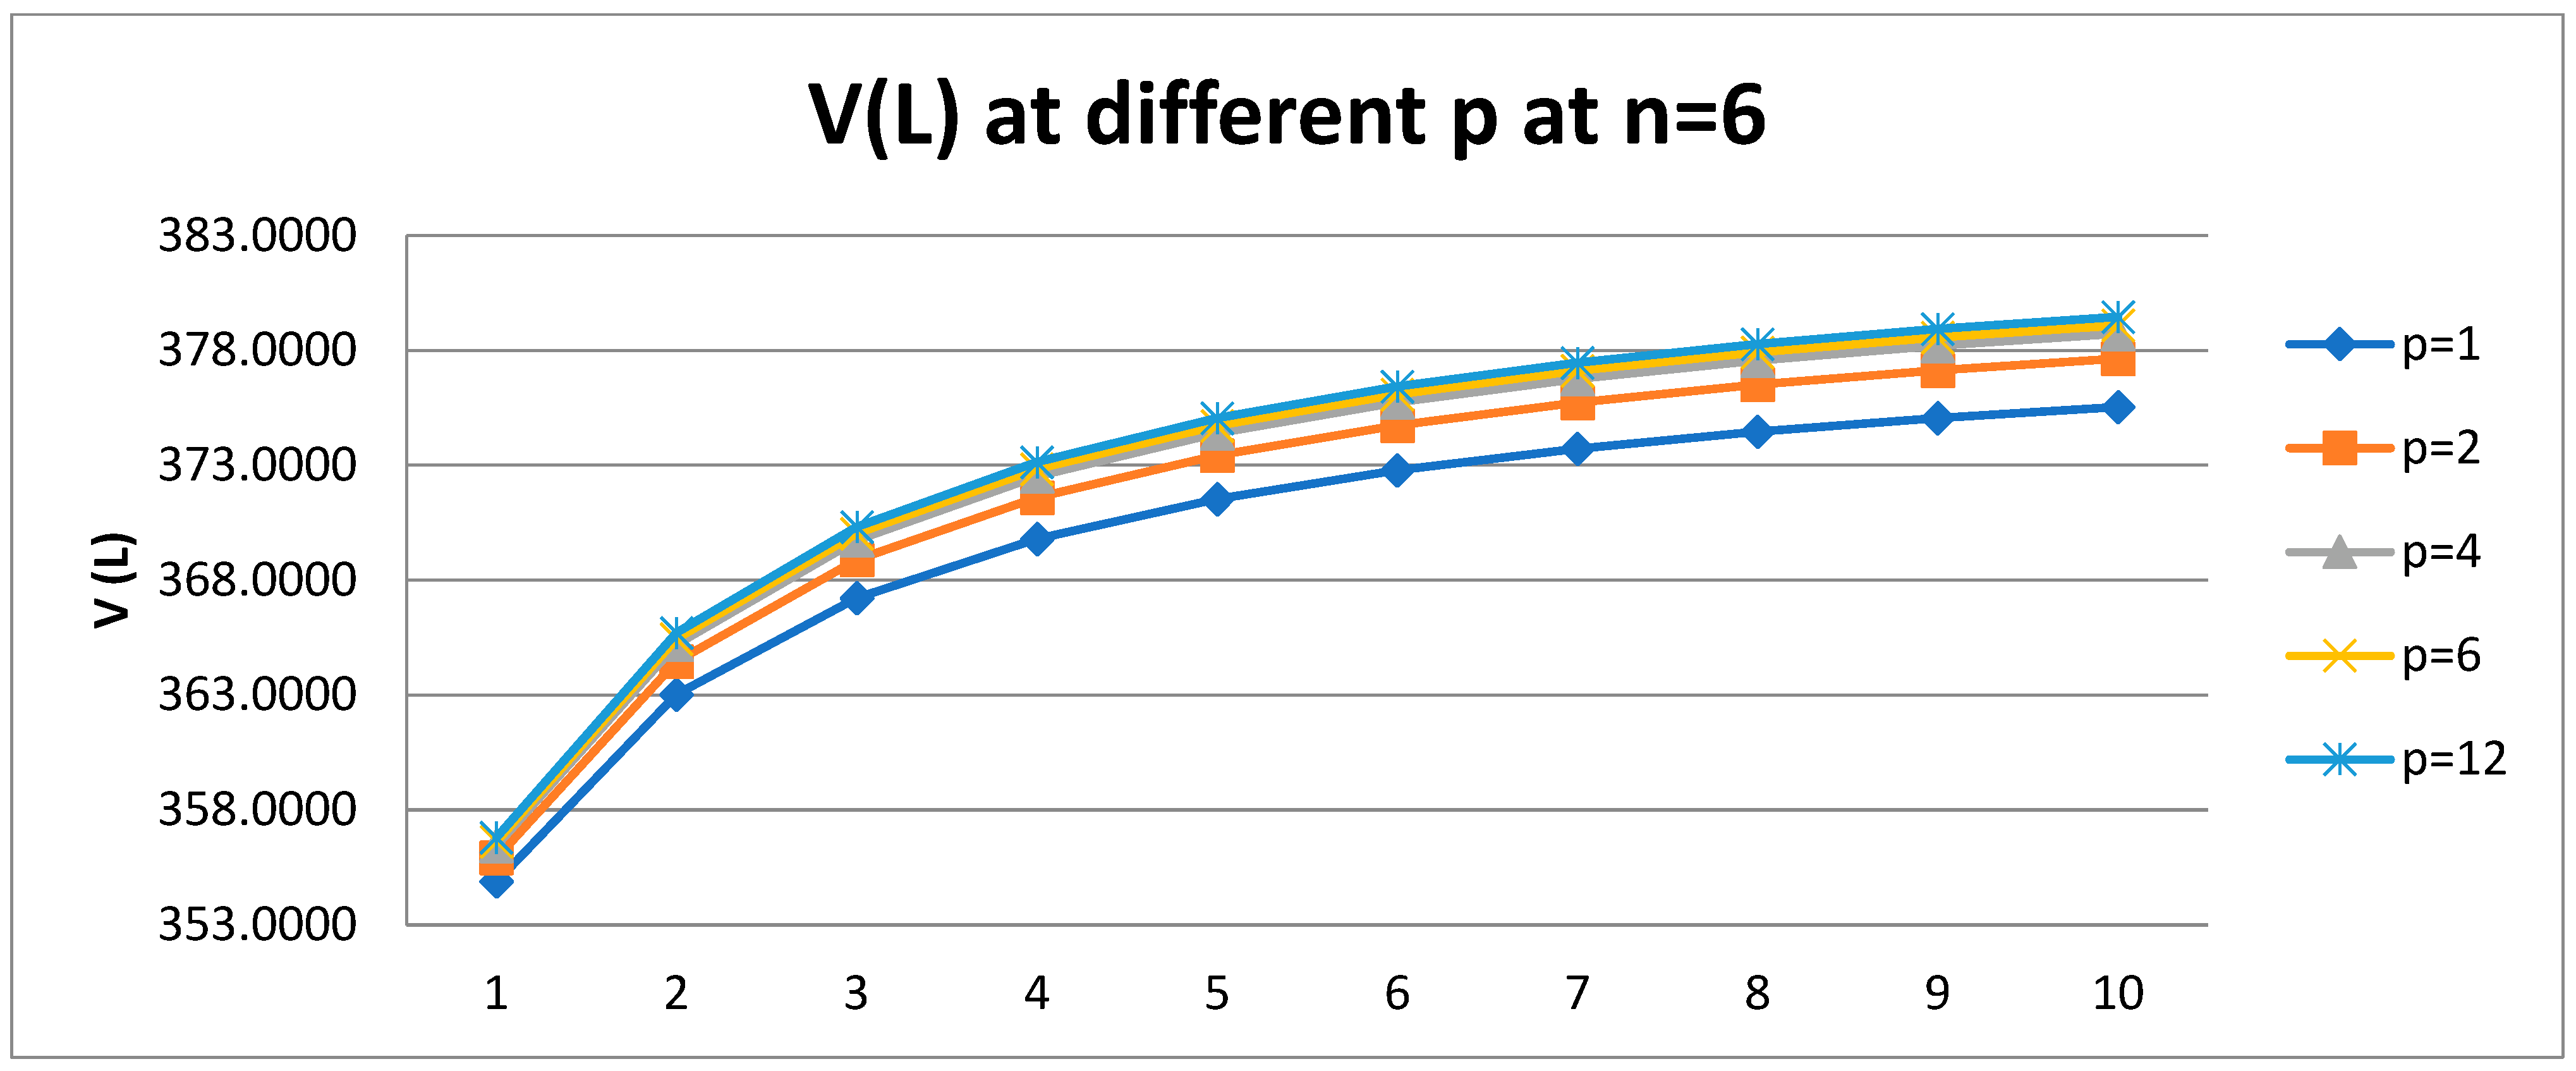
4.2.2. Dependence of the Company Value, V, on Leverage Level L at Different Frequency of Payment of Tax on Profit p for Six-Year Company
From
Table 6 and
Figure 8 it following that the value of company
V increases with the frequency
p. The largest increase occurs when moving from annual (
p = 1) to semi-annual (
p = 2) income tax payments and decreases when moving from semi-annual (
p = 2) to quarterly (
p = 4) payments and from quarterly (
p = 4) to monthly (
p = 12) payments.
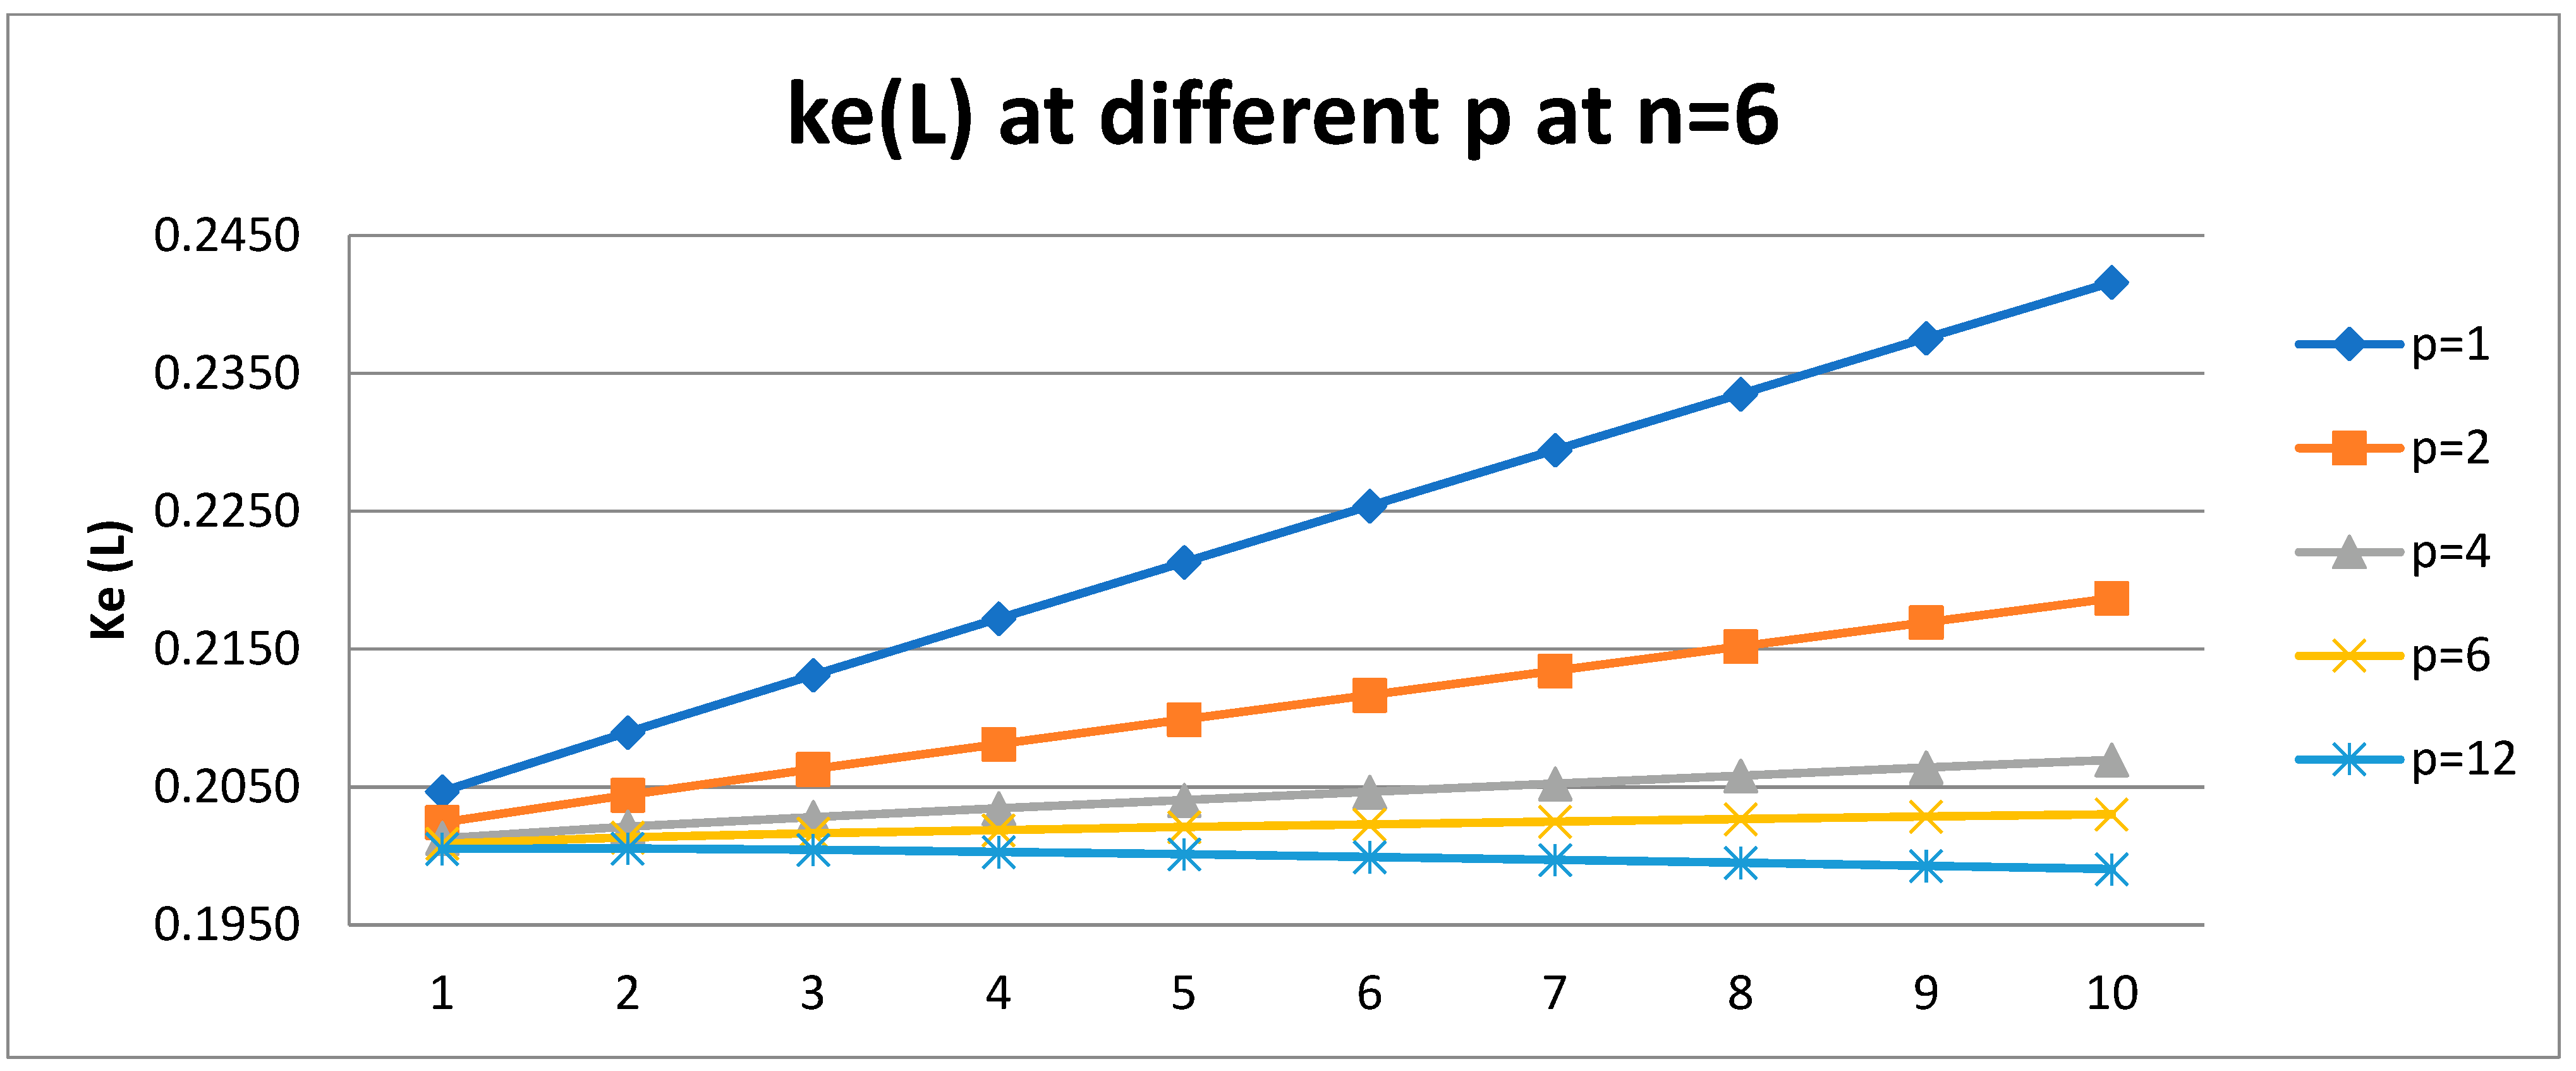
4.2.3. Dependence of the Equity Cost, ke, on Leverage Level L at Different Frequency of Payment of Tax on Profit p for Six-Year Company
From
Table 7 and
Figure 9 it folloing that the cost of equity
ke increases linearly with the level of leverage
L. The slope of the curve
ke(
L) depends on the frequency of paying income tax: it decreases with increasing
p, most rapidly when moving from annual (
p = 1) to semi-annual (
p = 2) payments of income tax and slower in the transition from semi-annual (
p = 2) to quarterly (
p = 4) payments and from quarterly (
p = 4) to monthly (
p = 12) payments.
One can see that for a six-year-old company with monthly income tax payments, a qualitatively new anomalous effect takes place: ke(L) decreases with an increase in the level of leverage L. This radically changes the company′s dividend policy, since the economically justified amount of the dividends is equal to the cost of equity.
5. The Discussion and Conclusions
The main purpose of the paper is to bring the Brusov–Filatova–Orekhova (BFO) theory closer to economic practice, taking into account one of the features of the real functioning of companies—the frequent payments of tax on profit. We generalize for the first time the Brusov–Filatova–Orekhova (BFO) theory for the case of tax on profit payments with an arbitrary frequency. We derive modified BFO formulas and show that: (1) All BFO formulas change; (2) all main financial parameters of the company, such as company value, V, the weighted average cost of capital, WACC, and equity cost, ke, depend on the tax on profit payments frequency. The increase of the payments of tax on income frequency leads to a decrease in attracting capital cost and to an increase in the capitalization of the company. More frequent payments of tax on profit are beneficial for both parties—for the company and for the tax regulator; for the company, this leads to an increase in the company capitalization, and for the tax regulator, earlier payments are beneficial due to the time value of money.
We numerically studied the dependence of the weighted average cost of capital WACC, value of company, V, cost of equity ke on the level of leverage L at different frequencies of income tax payments p for three- and six-year companies and obtained the following results. The calculation of financial indicators are made for some typical parameters of enterprises (equity and debt costs etc.,).
The weighted average cost of capital, WACC, decreases with leverage level L at any frequency of payments of tax on profit p. The difference between the WACC(L) curves is maximum when moving from annual (p = 1) to semi-annual (p = 2) income tax payments and decreases when moving from semi-annual (p = 2) to quarterly (p = 4) payments and from quarterly (p = 4) to monthly (p = 12) payments.
The value of company V increases with the frequency p. The largest increase occurs when moving from annual (p = 1) to semi-annual (p = 2) income tax payments and decreases when moving from semi-annual (p = 2) to quarterly (p = 4) payments and from quarterly (p = 4) to monthly (p = 12) payments.
The cost of equity ke increases linearly with the level of leverage L. The slope of the curve ke(L) depends on the frequency of paying income tax: it decreases with increasing p, most rapidly when moving from annual (p = 1) to semi-annual (p = 2) payments of income tax and slower in the transition from semi-annual (p = 2) to quarterly (p = 4) payments and from quarterly (p = 4) to monthly (p = 12) payments.
At a certain age of the company, a qualitatively new anomalous effect takes place: ke(L) decreases with an increase in the level of leverage L. We obtain this result for a six-year-old company with monthly income tax payments, but it is clear that this effect should take place for the companies of different age and at different frequencies of income tax payment. This radically changes the company′s dividend policy, since the economically justified amount of the dividends is equal to the cost of equity.
Note that this result reminds us of the discovery made by us earlier (Section 8 in monograph [
6]): the abnormal dependence of equity cost,
ke, on leverage level
L: above some value of tax on income,
T*, equity cost
ke decreases with the leverage level
L.
Thus, it is interesting to note that an increase in frequency of income tax payments p and increase of tax on profit T lead to the similar abnormal effect: decrease of equity cost ke with leverage level L. If in the first case there are threshold values for the frequency of paying income tax, p*, and the age of the company, n*, then in the second case there is a threshold value for income tax T*.
In
Table 8 we compare the impact of the frequency of income tax payments in BFO theory and in MM theory
6. Recommendations
From the analysis of the results of the current paper the following recommendations are made:
For company: company should pay tax on profit as frequently as it is possible, because in this case the company value increases.
For regulator: should encourage more frequent payments of tax on profit, because earlier payments are beneficial for budget due to time value of money.

 and
and 


