Article

Mining Stress Evolution Law of Inclined Backfilled Stopes Considering the Brittle-Ductile Transition in Deep Mining

School of Resources and Safety Engineering, Central South University, Changsha 410083, China
*
Authors to whom correspondence should be addressed.
Mathematics 2022, 10(8), 1308; https://doi.org/10.3390/math10081308
Submission received: 4 March 2022 / Revised: 5 April 2022 / Accepted: 12 April 2022 / Published: 14 April 2022

Abstract

:
To study the mining stress evolution law of inclined backfilled stope in deep mining, this paper first proposes a method for determining the parameters of the brittle-ductile transition model corresponding to the Hoek–Brown criterion and Mohr-Coulomb criterion under high geostress. Then, a model composed of inclined backfilled stopes with different depths is established to simulate the sequential mining process of ore bodies with varying depths from shallow to deep. The numerical model’s stratum displacement, rock mass stress distribution, and risk factors show that the mining-induced stress will move to the upper stopes and the stratum below the deepest stope. The transfer range and influence degree of mining-induced stress will increase with the increase of the deep mining, resulting in the most dangerous backfilled stope occurring one to two layers above the deepest stope and the apparent stress concentration area occurring below the deepest stope. To prevent disasters caused by mining stress, pillars in inclined deep stopes should have large safety factors. Replacing low-strength backfills with high-strength backfills can reduce the stress concentration in the stratum below the deepest stope.

1. Introduction

Backfill mining has become a standard mining method for deep metal mines [1,2,3]. With the increase of metal mines’ mining depth, the in situ stress of the formation increases [4,5]. A large mining-induced stress field will form near the excavation area with the high geostress environment, which will increase the risk of instability and rockburst in backfilled stopes [6,7]. Studying the mining stress evolution law of surrounding rock and backfill is helpful to better understand the stress state of deep backfilled stopes and to prevent disasters [8,9]. However, due to the influence of factors such as the in situ stress condition, orebody shape, stope size, and the mechanical properties of surrounding rock and backfill, it is difficult to obtain a reasonable evolution law of mining stress in backfilled stopes. Therefore, scholars have carried out a lot of research on this.
Li L. et al. studied the analytical solution of the stress state of vertical backfilled stopes [10], and the nonuniform distribution of vertical stress in the horizontal direction is considered [11]. Ting et al. proposed the analytical solution of the vertical stress of the inclined mine stope with non-parallel walls [12]. Li L. et al. studied the stress state of inclined backfilled stopes with FLAC2D [13]. They found that the cohesion, friction angle, Poisson’s ratio, and expansion angle of backfills significantly impact the stress distribution when the geometry of the stope remains unchanged. The vertical stress decreases significantly along the hanging wall and central line of the stope when the stope inclination angle is increased. Still, the horizontal stress along the footwall decreases significantly with the rise in the stope inclination. Jahanbakhshzadeh et al. studied the stress distribution of the inclined backfilled stope with void space on the top by FLAC, obtained conclusions similar to Li L. et al., and further proposed the new analytical solution for the stress state in included backfilled mine stopes based on Marston-arch equation [14,15]. Yan et al. proposed a three-dimensional analytical solution for inclined backfilled stops based on the limit equilibrium theory and verified it by the numerical simulation [16]. Based on the above research about the single stope, Falaknaz et al. simulated the stress distribution of two adjacent vertical stopes. They found that the geometry and backfill characteristics of the second stope will affect the stress distribution of the first backfilled stope. The greater the buried depth of the two stopes, the higher the stress level of the stope [17].
The backfill and surrounding rock’s mechanical properties determine the supporting force that the backfill can provide to the surrounding rock and then affect the stress distribution of them. Liu et al. studied the reasonable matches between and rock mass [18]. They found that the strength and stiffness of rock mass are the dominant factors determining the instability of the surrounding rock and backfill system. When the elastic modulus of rock mass is constant, the system’s stability declines with the decrease of the cement-tailing ratio. To simulate the failure process of the surrounding rock and backfill system, some scholars carried out the conventional triaxial test of rock-backfill composite specimens [19,20]. They found that multiple peaks will appear in the failure process of combined specimens. Increasing the volume fraction of the backfill will reduce the peak stress of the combined sample but increase the ductility of the post-peak deformation. To explain the mechanism of long-term stress growth in the backed stope, Qi et al. carried out a numerical simulation considering the creep behaviour of rock mass and the time-dependent characteristics of backfill [21]. They found that the squeeze-induced stress effect is the reason for the long-term stress growth in the backfilled stope [22].
The current research has revealed the mining stress distribution and the interaction mechanism between surrounding rock and backfill to a certain extent. However, there are still two shortcomings in the simulation research on the mining stress evolution law in deep metal mines. On the one hand, the research on the mining stress evolution law mainly focused on the horizontal or vertical orebody [23,24], and a few studies on the inclined orebody only analysed the mining stress evolution law in a single stope. The ore body dips in metal mines are different from those in coal mines. Specifically, the coal mine orebodies are primarily horizontal, while most metal mine orebodies are inclined. The results of the in situ stress measurements conducted at deep levels in metal mines show that the growth rate of the horizontal stress is significantly larger than that of the vertical stress at the post-mining stage, and the mining stress in the surrounding rock is transferred from the top to bottom [25,26]. Therefore, the mining stress evolution law summarized from horizontal orebodies is not entirely applicable to the metal mines.
On the other hand, most of these simulation studies used conventional plastic models or strain-softening models [26], which are not affected by minimum principal stress, to simulate the surrounding rock and backfill of stopes, which cannot sufficiently simulate the deformation behaviour of the deep rock mass. Many triaxial compression tests of rock materials have shown that the rock materials will have the characteristics of brittle-ductile transition when their post-peak deformation is affected by the minimum principal stress under triaxial stress [27,28]. Some triaxial compression tests with cemented backfill samples show that the backfill also has a brittle-ductile transition behaviour similar to that of rock materials [29,30]. Under the high geostress, mining-induced stress will make the surrounding rock and backfill of the stope enter the post-peak stage. Therefore, the brittle-ductile transition behaviour of the rock mass and backfill will also impact the evolution law of the mining stress [31]. The in situ stress restoration test conducted by Heping Xie et al. also shows that under the in situ stress, the post-peak deformation characteristics of deep rock cores are more ductile than those of shallow rock cores [32].
To study the evolution law of mining stress in inclined backfilled stopes under high geostress in deep mining, a strain-softening model considering the brittle-ductile transition behaviour of rock mass and backfill is proposed in this paper. The method is first proposed for determining the parameters of the brittle-ductile transition model corresponding to the H-B criterion and the M-C criterion to simulate rock mass and backfill, respectively. Then the proposed model is verified with a conventional triaxial compression numerical test in Section 2.1. In Section 2.2, based on the geological data and stope parameters of the Sanshandao gold mine, a model composed of multiple inclined backfilled stopes with different depths is established to simulate the process of sequential mining and filling ore bodies in different depths from shallow to deep. Then, the simulation results of the strata displacement, the stress distribution of rock mass, and risk factor distribution is described in Section 3. Finally, the stress evolution law in the backfilled stope and the influence of stope depth and backfill mechanical properties is discussed in Section 4.

2. Materials and Methods

2.1. Brittle-Ductile Transition Model

2.1.1. Simulation Theory

In the conventional triaxial test of rock materials, rock materials have the post-peak deformation characteristics of changing from brittleness to ductility with the increase of the confining pressure [27,33]. Wu X. et al. proposed a numerical model of the brittle-ductile transition to calculate the stress distribution and deformation after tunnel excavation under high geostress [34]. This numerical model adds the brittle-ductile transition formula related to the confining pressure based on the strain-softening model, which can simulate the transformation process of post-peak deformation characteristics of rock materials from brittleness to ductility with the increase of confining pressure. According to the results of the rock triaxial compression test, there is a nonlinear relationship between the confining pressure, σ 3 , and residual strength, σ 1 * [35], which can be expressed as:
σ 1 * σ 3 = σ 1 c σ 3 β · e γ · σ 3
where σ 1 c σ 3 is the principal yield stress corresponding to the confining pressure σ 3 ; β is the difference between peak and residual strength under the uniaxial compression test; γ is an exponential parameter. The conventional triaxial test of rock materials can fit β and γ through Equation (1).
To simulate the brittle-ductile transition, it is also necessary to establish the relationship between the post-peak strength parameters and minimum principal stress according to the strength criterion based on Equation (1). In the numerical simulation, the realization method of the strain-softening model is to make the strength parameter of the model element in the plastic stage decrease with the increase of plastic strain. The yield stress of the model element finally drops to the residual stress level.
Based on the Mohr-Coulomb (M-C) strength criterion, the relationship between peak strength, σ 1 c , and confining pressure, σ 3 , is shown as:
σ 1 c σ 3 = N p σ 3 + 2 c N p
where c is the cohesion of the material; N p is the confinement coefficient, which remains unchanged within the plastic region. The relationship between N p and friction angle of the rock is as follows:
N P = 1 + sin ϕ 1 sin ϕ
where ϕ is the friction angle of the material.
According to the principle of the strain-softening model, the strain-softening model based on the M-C criterion needs to gradually adjust the cohesion of the element from c to c* with the increase of plastic deformation after the element enters the plastic stage. Based on Equations (1) and (2), the relationship between c and c* satisfies:
σ 3 N p + 2 c * N p = σ 3 N p + 2 c N p β · e γ · σ 3
After simplifying Equation (4), the following relationship can be obtained:
c * = c β · e γ · σ 3 2   N p
Based on the Hoek–Brown (H–B) empirical strength criterion of rock [36,37], the relationship between peak strength, σ 1 c , and confining pressure, σ 3 , can be obtained as follows:
σ 1 c σ 3 = σ 3 + σ c i m b σ 3 σ c i + s a
where σ c i is the unconfined compressive strength. mb, s, and a are the rock mass material constants obtained by fitting from the results of the conventional triaxial test of rock through Equation (6). For intact rock, s = 1 and a = 0.5.
The strain-softening model based on the H–B criterion also needs to change the mechanical parameters σ c i to σ c i * gradually with the increase of plastic deformation to achieve the strain-softening effect. Based on Equations (1) and (6), the relationship between σ c i and σ c i * can be expressed as follows:
σ c i * m b σ 3 σ c i * + s a = σ c i m b σ 3 σ c i + s a β · e γ · σ 3
Equation (7) cannot be simplified to the same expression as Equation (5). Although the numerical method can obtain the accurate value of σ c i * , the calculation speed of the model will be affected. Therefore, it is necessary to deduce the approximate relationship to calculate σ c i * with σ 3 . When σ 3 is 0, Equation (7) can be expressed as follows:
σ c i * = σ c i β s a
When σ 3 is large enough, the post-peak deformation of the material will be ductility, at this time σ c i * = σ c i . Then the equation is obtained as follows:
σ c i * = σ c i β s a e γ · σ 3
where γ is the exponential parameter of the strain-softening model based on the H–B criterion.
Before the simulation calculation, Equation (7) is used to calculate the corresponding numerical solution of σ c i * under multiple σ 3 and then use Equation (9) to fit γ . During the simulation, σ c i * is calculated directly by using Equation (9), and no numerical solution is required. This way can reduce the calculation time significantly.

2.1.2. Verification Simulation

The brittle-ductile transition model is used it to simulate the conventional triaxial compression test in FLAC3D software to verify its effectiveness. The mechanical parameters of simulated rock material are determined according to the engineering geological exploration report and the literature of the Sanshandao Gold Mine [38,39]. The Young’s modulus of the simulated rock material is set to 8 GPa based on the modulus of the ore body. The peak strength and residual strength of the simulated rock material under different confining pressures are shown in Table 1. Referring to the latest triaxial rock test research conducted on the high-stiffness test machine [40], the residual strength of simulated rock material under uniaxial compression is corrected to 0 to ensure the mining safety.
As shown in Table 1, the relationship between the peak strength of the simulated rock material and the confining pressure is close to the Hoek–Brown failure criterion. Therefore, the relevant parameters of the Brittle-ductile transition model can be calculated according to Equations (6) and (9). The parameters of the Brittle-ductile transition model σci, mb, s, a, β, γ, and γ′ for the simulated rock material are 72.16 MPa, 7.22, 0.8, 0.5, 60.62 MPa, 0.07, and 0.08, respectively. The results of the conventional triaxial compression test simulated by these parameters are shown in Figure 1.
From Table 1 and Figure 1, it is clear that the proposed brittle-ductile transition model can reasonably simulate the behaviour whereby the peak strength and residual strength of rock materials increase with the increase in the confining pressure. Therefore, the Brittle-ductile transition model can analyse inclined backfilled stopes’ mining stress evolution law at different depths.

2.2. Simulation of Backfill Mining

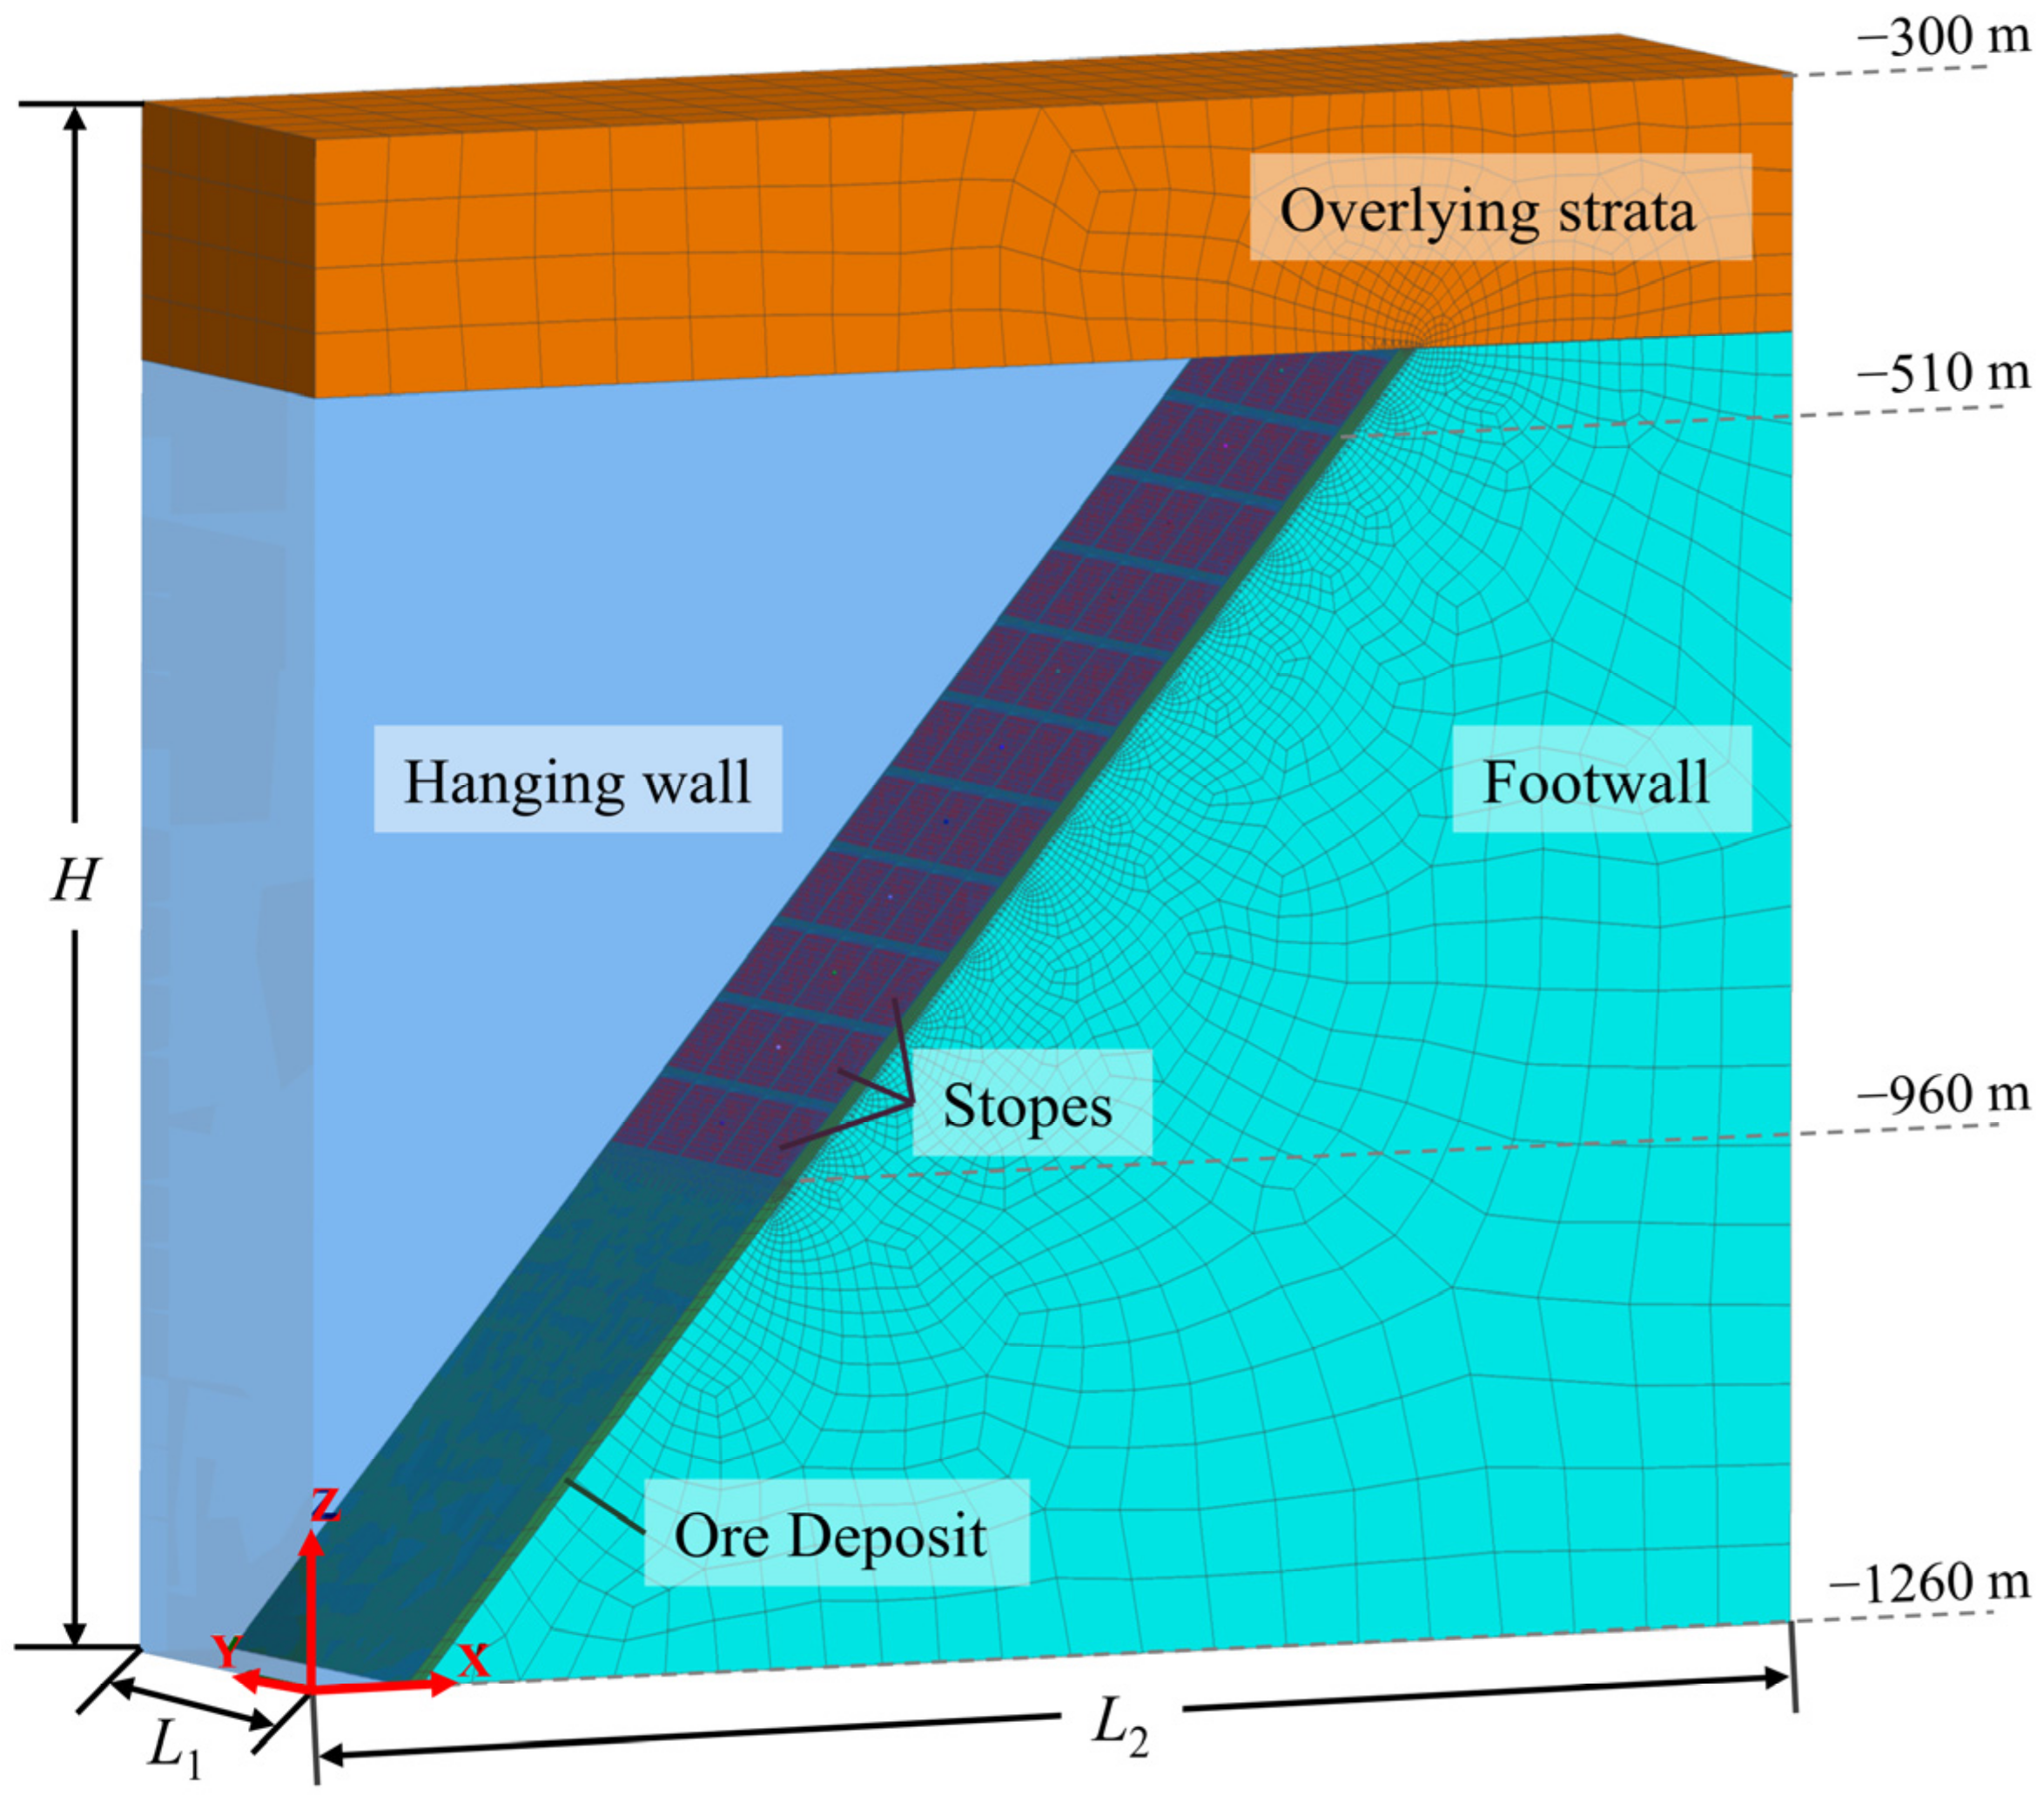
2.2.1. Numerical Model of Stopes

The backfill mining process of orebody from −510 m to −960 m is simulated with FLAC3D. As shown in Figure 2, the height (H) of the model is 960 m, the top elevation is −300 m, the bottom elevation is −1260 m, the length (L1) along the orebody strike is 250 m, and the length (L2) perpendicular to the orebody strike is 1000 m.
The orebody is in the centre of the model, with a thickness of 10 m and an inclination of 40°. The width (l) of the stope is 50 m and the height (h) is 45 m. The width of barrier pillars and the height of bottom pillars are both 3 m. Five stopes at each depth in the model are symmetrical, and there are 11 floors of stopes from top to bottom.
Grids of the simulation model are hex-dominant meshes created by Itasca’s automatic grid generator, Griddle. In order to balance the calculation accuracy and speed, the grid side length of the model boundary is set to 50 m, and the grid side length of stopes and pillars is set to 2 m. The grids of the transition area are automatically generated by Griddle.

2.2.2. Model Parameters

1. Parameters of the in situ stress field
To truly simulate the mining stress transfer process caused by backfill mining, obtaining the in situ stress in the case mine is necessary. The Sanshandao gold mine is located in the northwest of Jiaozhou. According to the research of Peng Li et al. [41], the maximum principal in situ stress in the northwest of Jiaozhou is the horizontal stress perpendicular to the strike of the orebody σ h   max , the intermediate principal in situ stress is the vertical stress σ v , and the minimum principal in situ stress is the horizontal stress along the strike of the orebody σ h   min . The variation law of each stress with depth H is as follows:
σ h   max = 0.0510 H + 1.9045 σ h   min = 0.0276 H 0.2094 σ v = 0.0303 H 0.4355
In the generation of the in situ stress model, vertical stress of 8.65 MPa and 37.74 MPa were applied to the top (−300 m) and bottom (−1260 m) of the numerical model shown in Figure 2 according to Equation (10). At the same time, σ h   max and σ h   min were calculated according to Equation (10) and applied to the two sides of the model in the XX direction and YY direction, respectively.
2. Parameters of rock masses
The Sanshandao gold mine, which mainly applies the backfill mining method, is a super large metal mine with a mining depth of over 1 km. According to the engineering geological survey reports and rock mechanical tests in the laboratory of the mine, the peak stress of rock masses from there applies to the H–B empirical strength criterion [38]. Thus, the physical and mechanical parameters of rock masses are determined, as shown in Table 2.
Some studies have shown that the uniaxial compressive strength of rock increases with the buried depth in the coal mine [42], but the similar laws did not appear in the testing and research on the rock cores from the Sanshandao gold mine with the depth of 1 km [39]. Therefore, this paper makes a conservative assumption that the uniaxial compressive strength of the rock does not increase with the increase of depth.
3. Parameters of the backfill
Studies show that the mechanical parameters of the backfill will affect the stress distribution of the backfilled stope, and changing the materials of the backfill and the mixing proportion of the backfill can adjust these mechanical parameters. Therefore, it is necessary to compare the effects of different strength backfills to improve the stope stress state to determine the best filling scheme.
The common materials of the backfill in metal mines are non-cemented tailings, cemented tailings, and cemented block stones. The non-cemented backfill generally needs to be wrapped with cemented tailings to form a low-strength cemented backfill. Therefore, three different backfill materials were designed to analyse the stress evolution law of backfilled stope according to the mechanical parameters of the backfill commonly used in metal mines. The three materials of the backfill are: low strength cemented tailings, high strength cemented tailings, and cemented block stones. Their uniaxial compressive strengths (UCS) are 1 MPa, 3 MPa, and 5 MPa, respectively The experiments showed that the strength criterion of backfill is suitable for the M-C criterion [30]. The specific physical and mechanical parameters are shown in Table 3.

2.2.3. Numerical Simulation Procedure

To study the stress evolution law of backfilled stope, the numerical simulation was divided into the following three steps:
Step 1: Establishing the model. The linear elastic numerical model was established according to the model size in Figure 2 and the physical and mechanical parameters of rock masses in Table 2. The parameters of the overlying strata were the same as those of the hanging wall rock mass.
Step 2: Applying in situ stress. The boundary stress was applied to the model according to the in situ stress field parameters in Section 2.2.2. After the calculation to the equilibrium state, the linear elastic model was modified to the plastic model with the H–B criterion, and the displacement field was reset to 0.
Step 3: Mining the orebody within the stopes layer by layer. Starting from the −510 m, the orebody within the five stopes in the current layer is modified to the null model and one cycle is performed to update the model. Then, the null model within the stope was modified to the M-C model according to the physical and mechanical parameters in Table 3 to simulate the backfill. A 1 m high null model was reserved between the backfill and the bottom pillar at the top of the stope to simulate the effect of the backfill gap. Finally, the stopes in the next layer would be excavated after the model was calculated to the equilibrium state. Since the shallow part of the mine is generally filled with low-strength cemented tailings, the −825 m and above stopes were filled with low-strength cemented tailings. A comparative study of three backfilling methods of low-strength cemented tailings, high-strength cemented tailings, and cemented block stones was carried out only for the stopes in layers of −870 m, −915 m and −960 m.

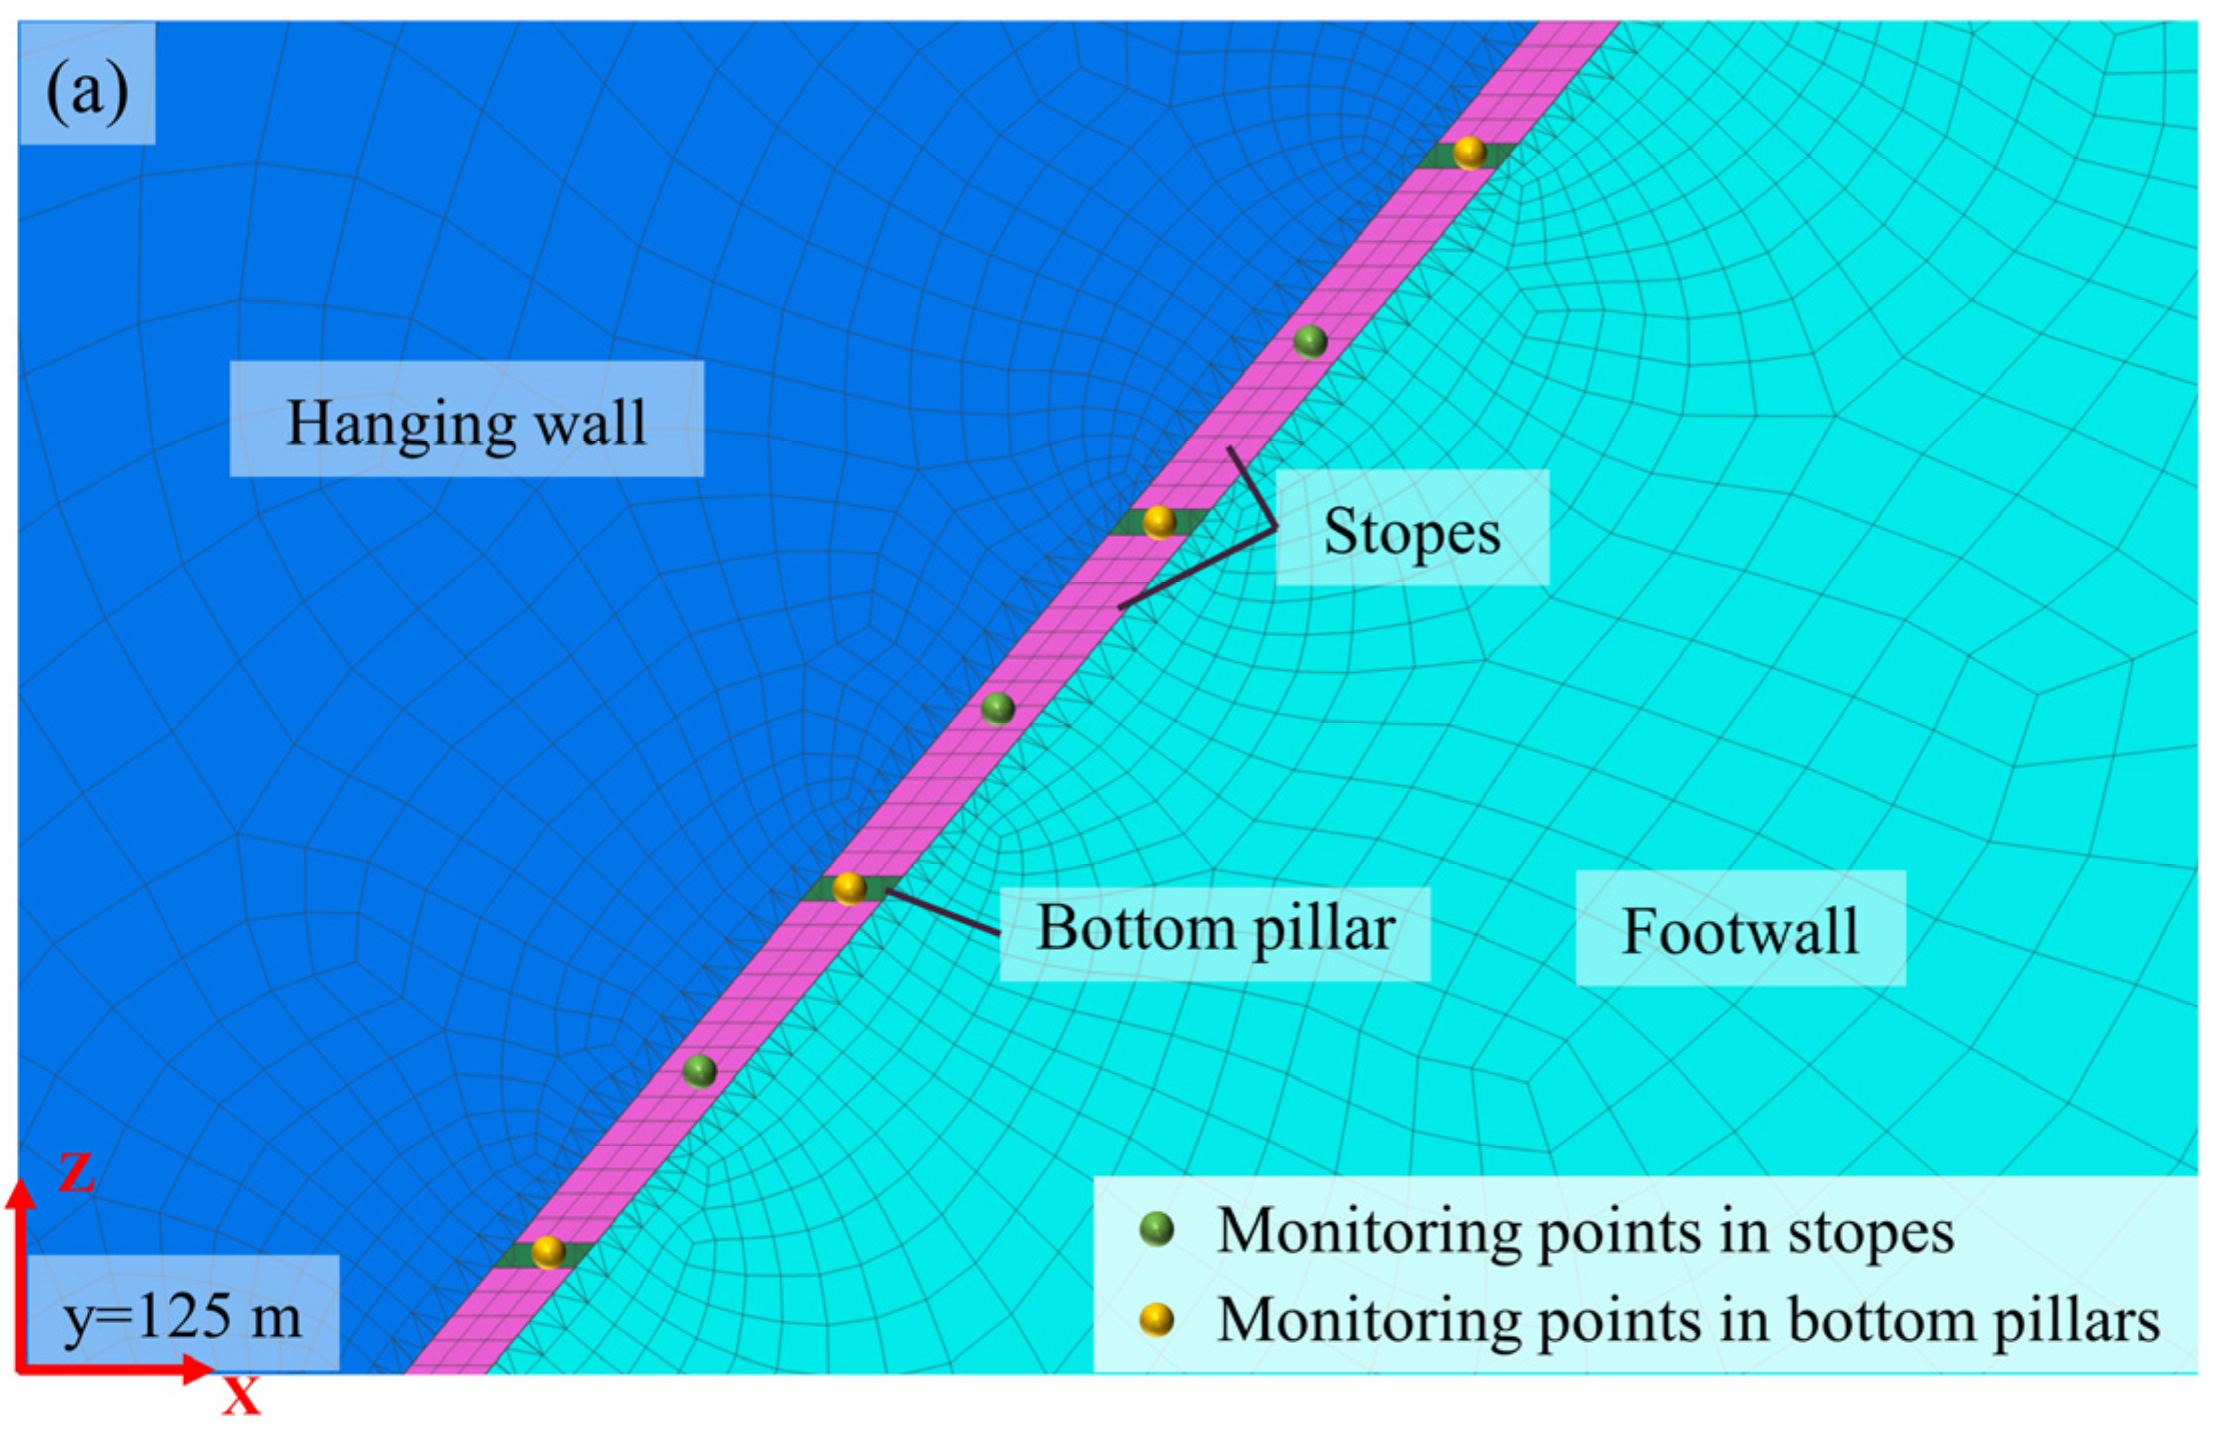
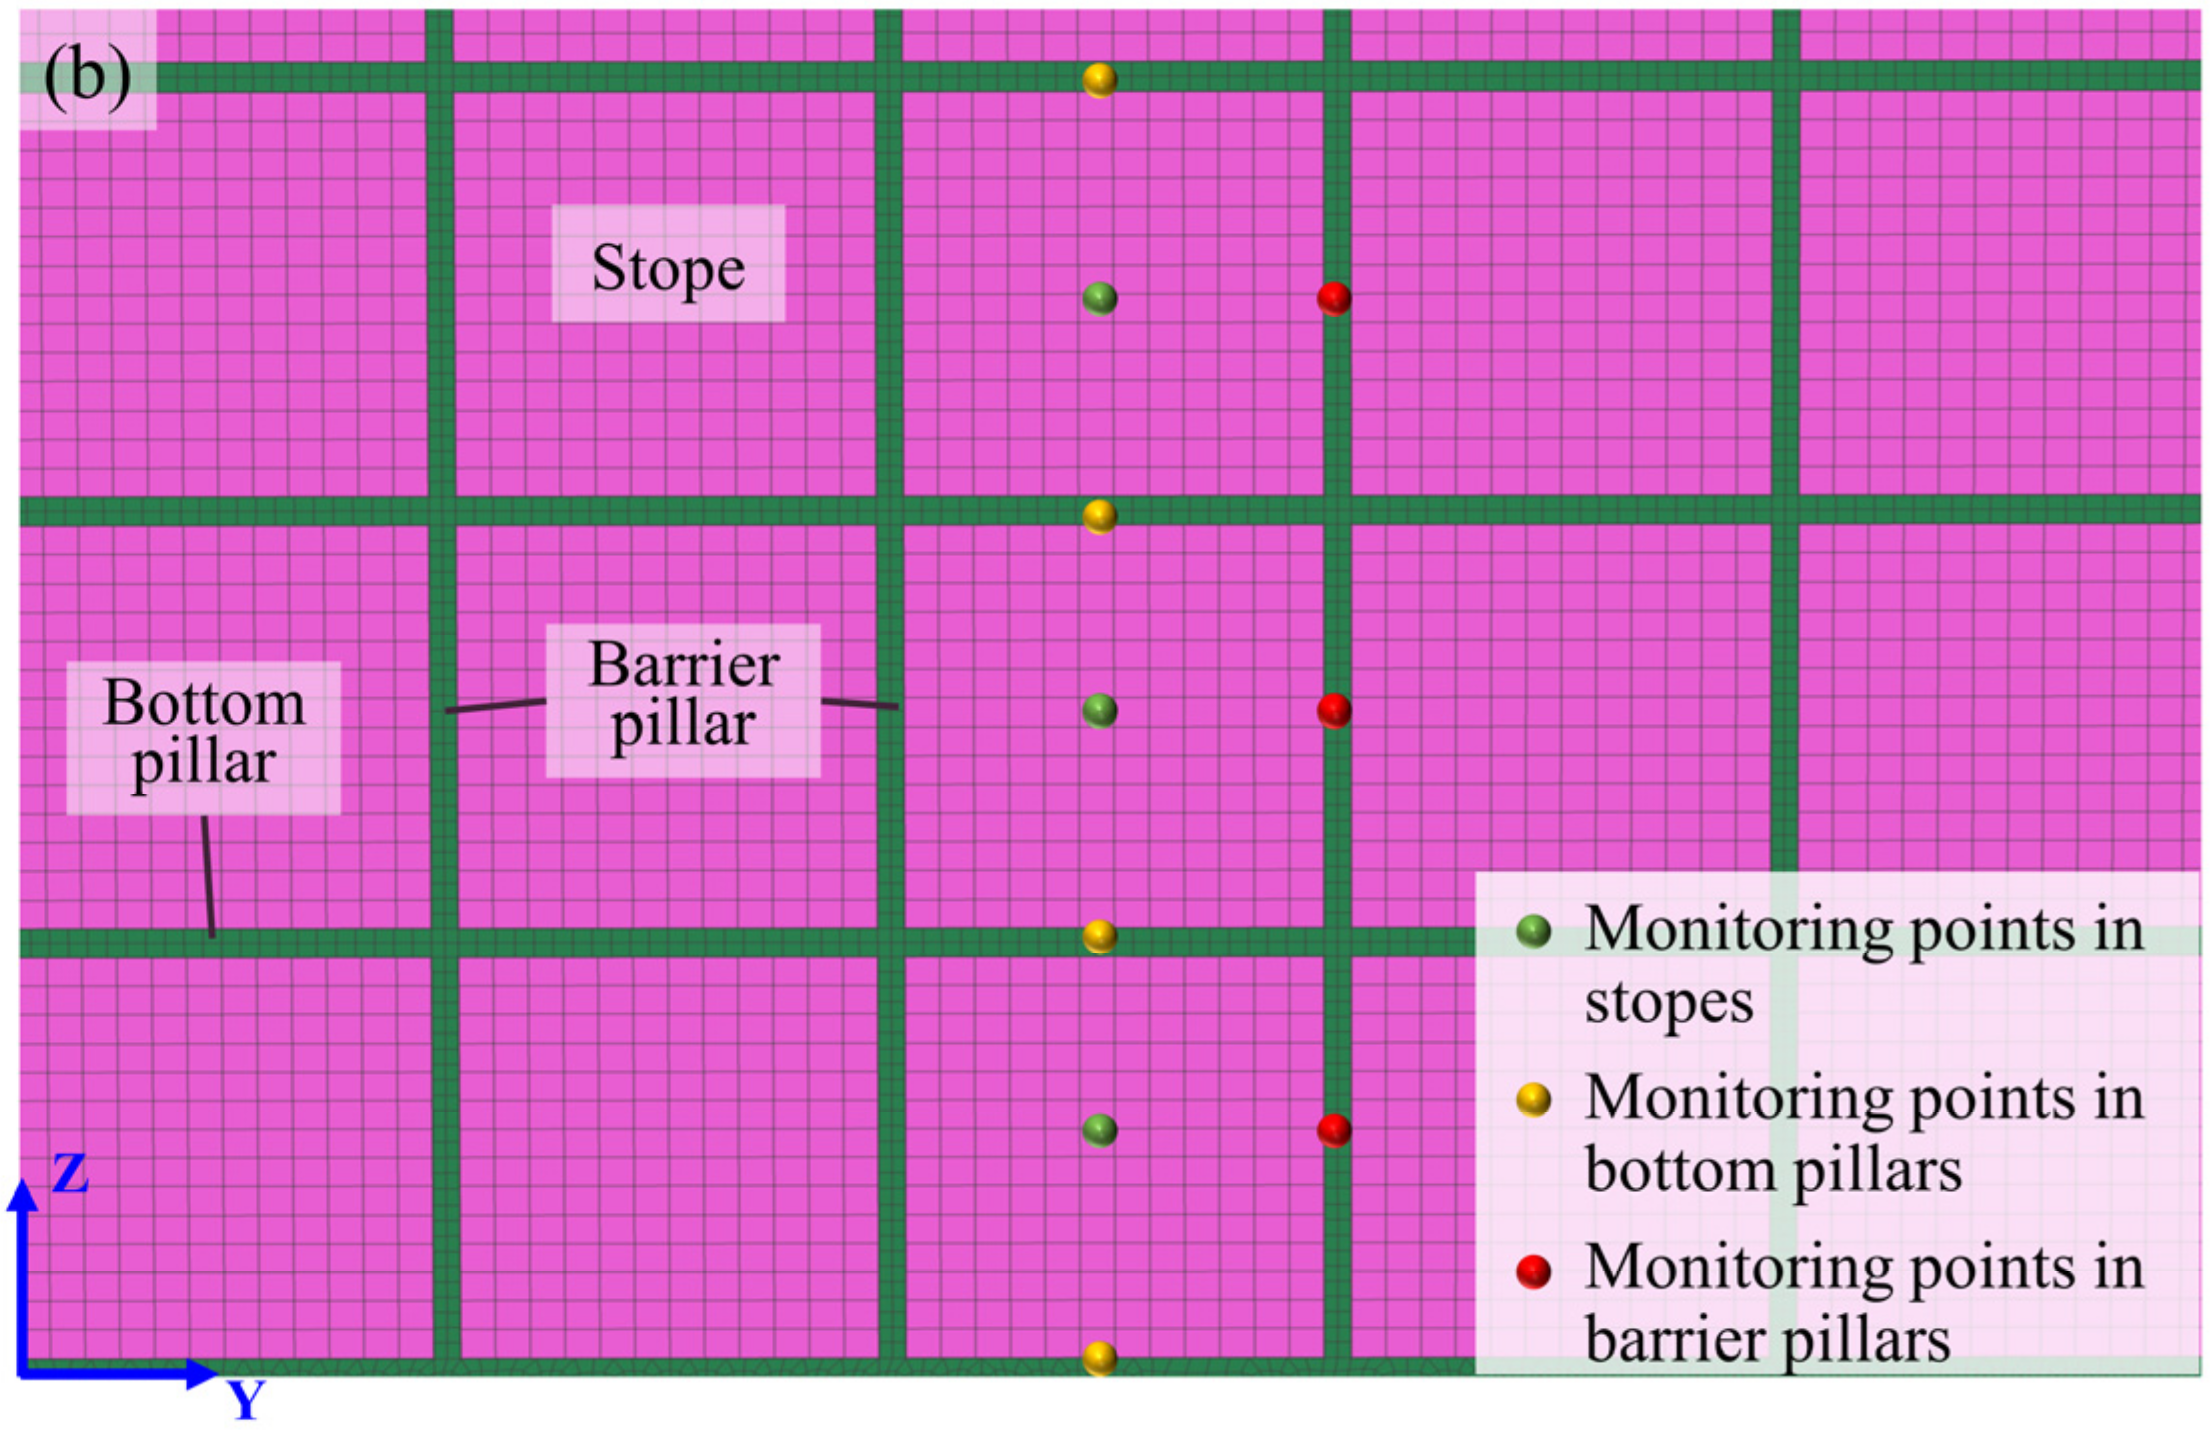
2.2.4. Monitoring Method

To obtain the variation law of the deformation and stress of backfilled stopes with the mining, 33 stress monitoring points are set to monitor the stress state of the barrier pillars, bottom pillars, and backfilled stopes, as shown in Figure 3. Since the structure and stress state of the model are symmetrical along the y-axis, the simulation program only records the stress of the middle stope in each layer.

3. Numerical Simulation Results

3.1. Formation Displacement

Figure 4 and Figure 5 are cloud diagrams of the horizontal and vertical displacements of the ground, respectively. They are the model section at the middle position along the orebody strike (y = 125 m), and the number in the upper left corner of each figure represents the mining depth. The color ramps in the cloud diagrams of different mining depths adopt different scales to clearly show the distribution of displacement field near the ore body.
After mining and filling the stopes, the horizontal displacement cloud diagram is in the shape of a water droplet, like a water droplet flowing along the inclined orebody. The horizontal displacement caused by cut and fill mining has two characteristics: the large influence range and the lag of the maximum displacement. In terms of the influence range, it can be seen from Figure 4 that even when mining the −960 m stope, the horizontal displacement of the −510 m stratum is still at a relatively large level, indicating that the −510 m stratum has been affected by deep mining. The specific performance of the lag of maximum displacement is that the maximum horizontal displacement of the ground always occurs in the upper stope during mining. As the mining depth increases, the stope where the maximum horizontal displacement occurs is farther from the deepest stope. The maximum horizontal displacement occurs in the −600 m and −645 m stopes when mining the −690 m stope, and the maximum horizontal displacement occurs at −825 m and −875 m stopes when mining the −960 m stope.
As shown in Figure 5, the vertical displacement cloud diagram formed by backfill mining of the inclined orebody is smoky, like the smoke rising from the hanging wall of the deepest stope. Compared with the horizontal displacement, the vertical displacement caused by backfill mining has a smaller influence range, and the maximum displacement of the surrounding rock in the hanging wall is always above the deepest stope. Starting from the mining of the −780 m stope, the vertical displacement of the surrounding rock in the hanging wall of the −510 m stope has been significantly smaller than the main deformation area, indicating that the influence of deep mining on shallow stopes has been weakened. In addition, the surrounding rock in the footwall of the shallow stope will show vertical displacement upward, the vertical displacement of the centre position in the vertical direction of each deep stope is more significant, and the vertical displacement near the bottom pillar is smaller.

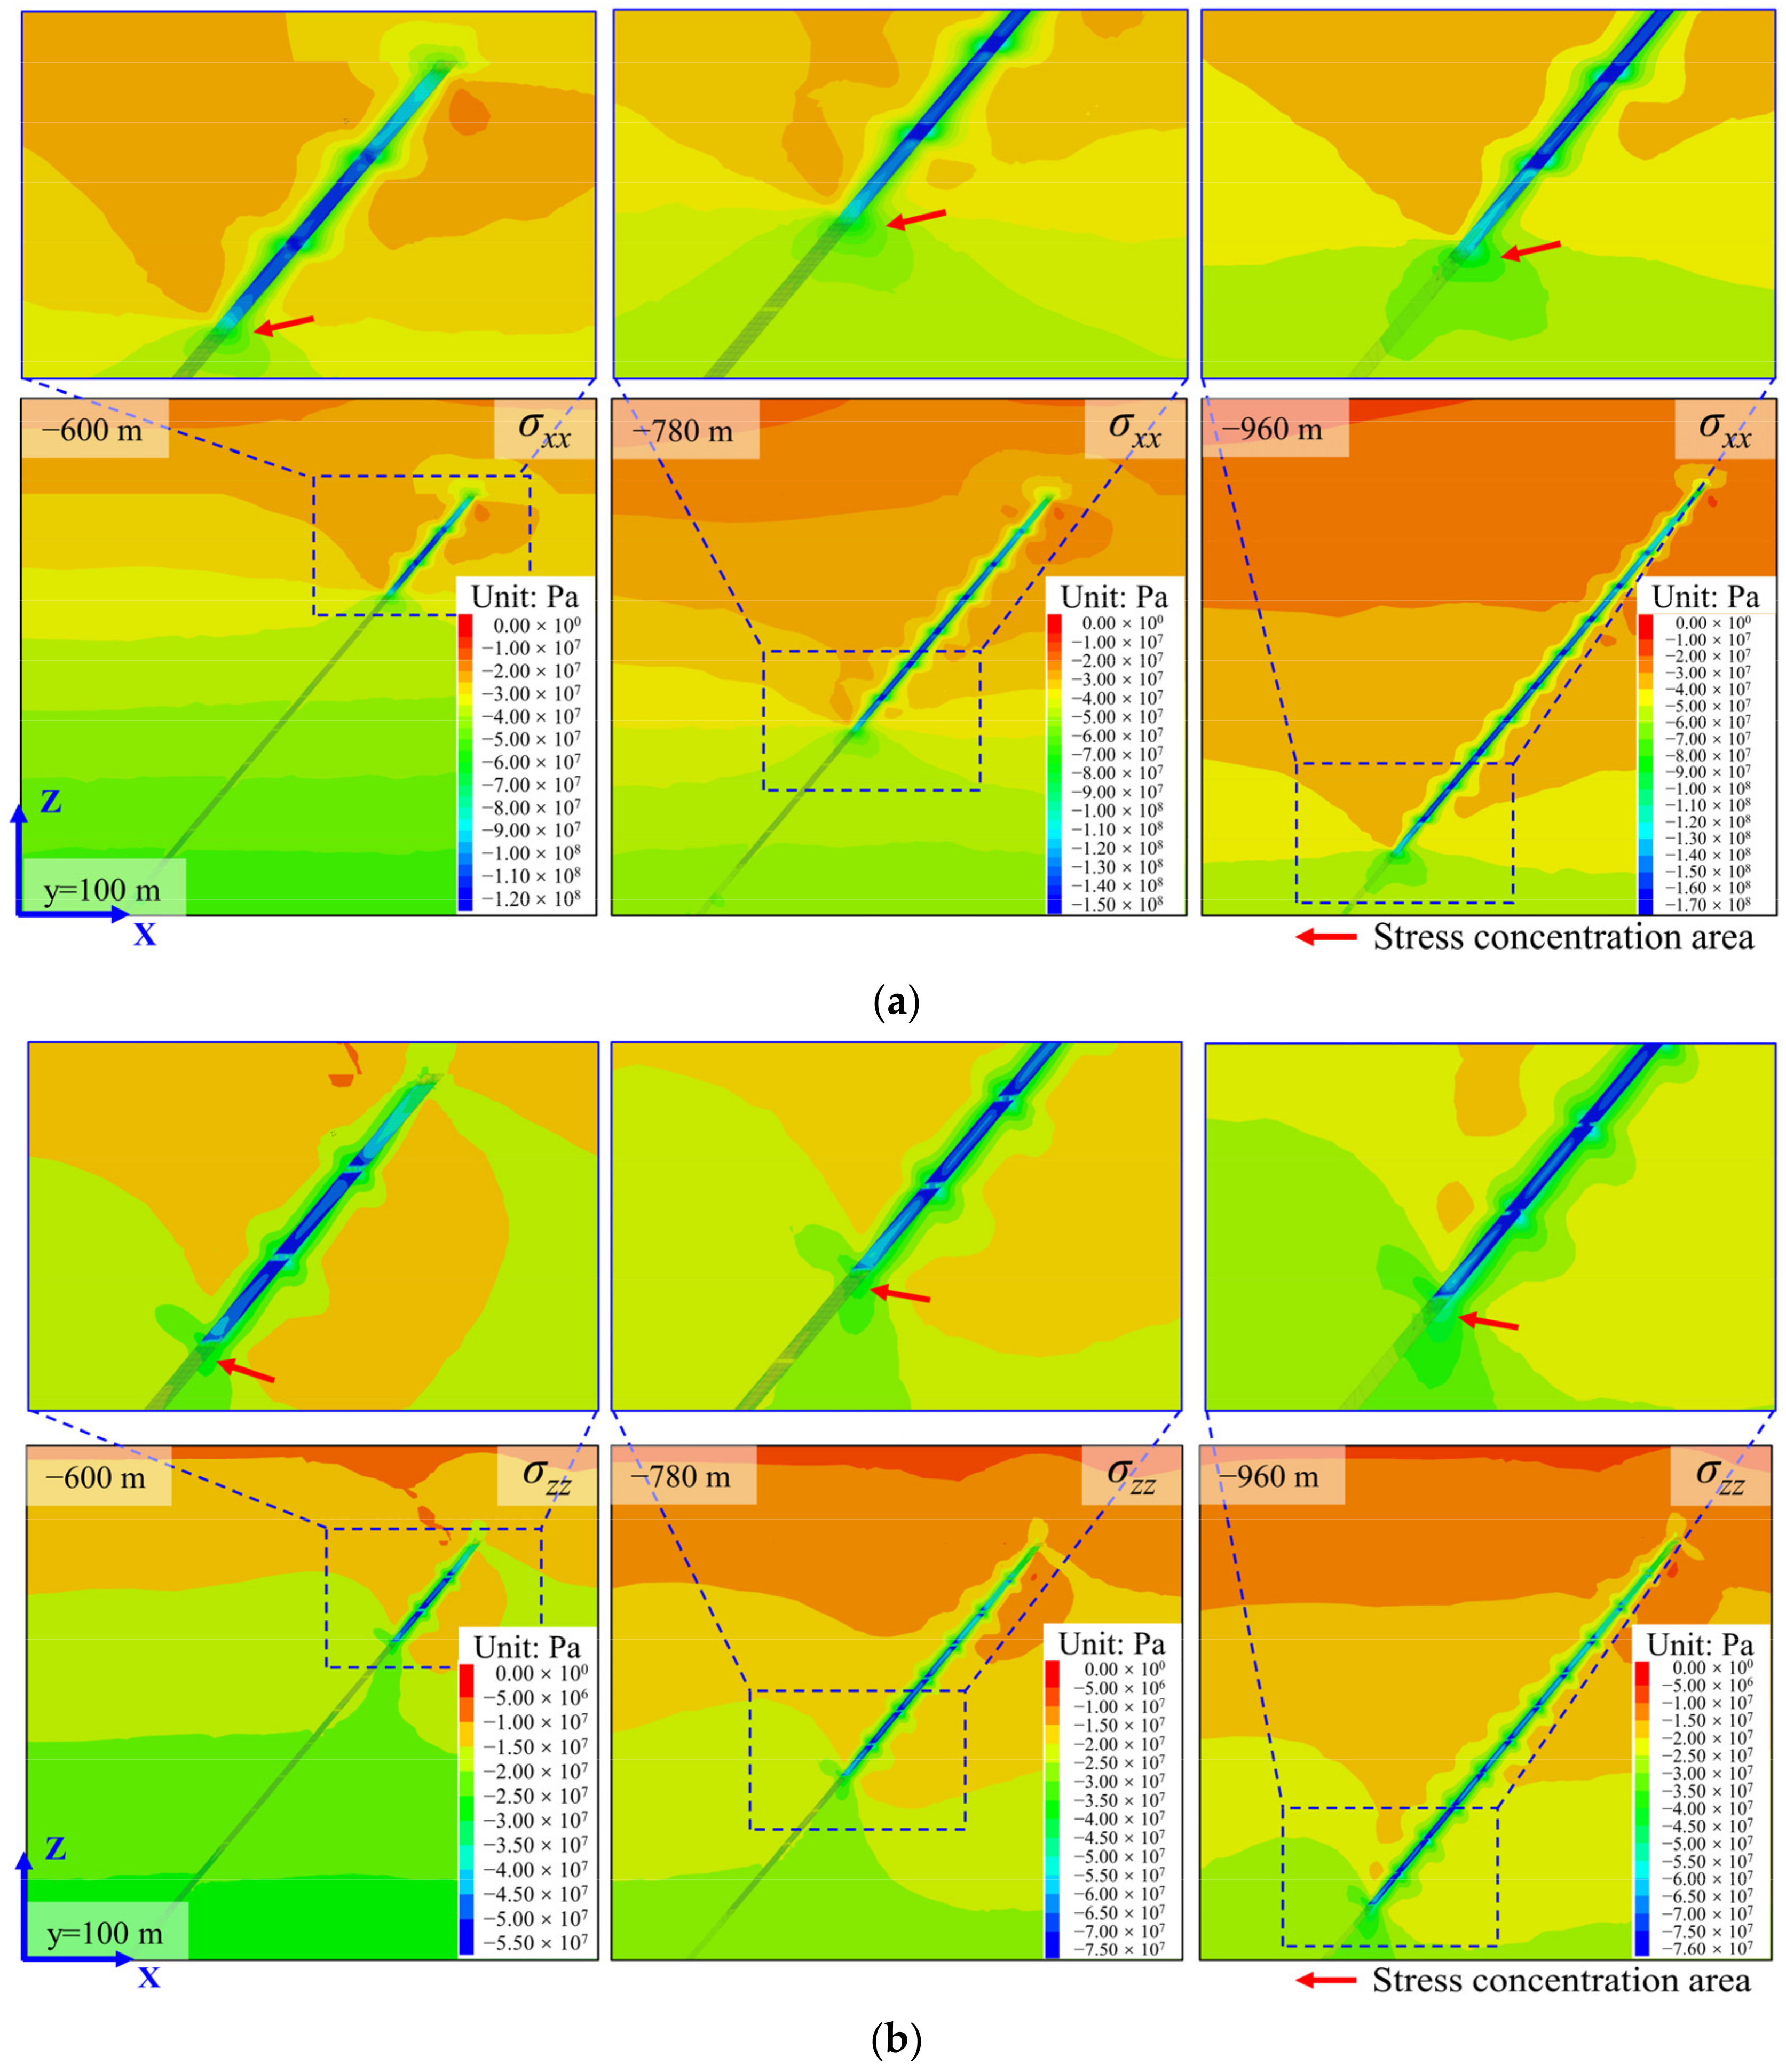
3.2. Stress Distribution of Rock Mass

Figure 6 shows the distribution of stratum stress along the midline section of the stope (y = 125 m) when mining −600 m, −780 m, and −960 m stopes. The color ramps in the cloud diagrams of different mining depths use different scales to clearly show the stress concentration areas in the stratum. On the whole, there are low-stress areas in the surrounding rocks of the hanging wall and footwall near the mined stope. As the depth increases, the range of the low-stress areas decreases. The low-stress area appears in the bottom pillar because the in situ stress initially acting on the mined stope is transferred to the adjacent pillars.
Due to the impact of mining, a prominent high-stress area will appear below the deepest stope. The stress increase areas in the XX direction are symmetrically distributed along the vertical direction, while the stress increase areas in the ZZ direction are concentrated in the footwall.
After excavating the orebody in the stope, the in situ stress acting on the orebody will transfer to the bottom and barrier pillars of the stope. Figure 7 is a diagram of the stratum stress distribution along the centre line of the barrier pillar (y = 100 m). The X-X and Z-Z stresses of barrier pillars in backfilled stopes and adjacent strata have increased noticeably, forming a high-stress area. The area with the highest stress is not on the barrier pillar in the deepest stope but rather on the barrier pillars one or two stopes above the deepest stope. This phenomenon corresponds to Figure 4, where the maximum horizontal displacement appears above the deepest stope.

3.3. Risk Factor

Since the maximum principal stress at the moment of rock failure will increase with the minimum principal stress under the triaxial compression test, the critical maximum principal stress, σ 1 c , is calculated by Equations (2) and (6) for filling and rock mass, respectively. The ratio of the current principal stress, σ 1 , to the critical stress, σ 1 c , represents the risk factor, f. The cloud diagram of risk factor, f, is shown in Figure 8.
Figure 8 is a cloud diagram of the stratum risk factor along the stope’s midline (y = 125 m) and along the barrier pillars’ midline (y = 100 m). Due to the low stress and high strength parameters, the risk coefficient of rock mass in the footwall is generally lower than that in the hanging wall. After backfill mining inclined ore bodies, mining stress transfer results in low-risk areas in the rock mass around the middle of each stope, high-risk areas in the bottom and barrier pillars, and the surrounding rock mass. As the mining depth increases, the range of the low-risk areas caused by mining stress transfer is reduced, and the range of the high-risk areas is increased.
From Figure 8, we can find that the location with the highest risk factor near the barrier pillars is not at the deepest stope, but rather at the position of one or two stopes above. As the mining depth increases, the distance between the position of the maximum risk factor and the deepest stope tends to increase. Therefore, it is necessary to discuss the influence of mining stress generated by deep mining on the upper stope structure in detail.

4. Discussion

4.1. Stress Evolution Law of Backfilled Stopes

From the results of Section 3.2 and Section 3.3, it can be seen that after excavation of the orebody in the stope, the in situ stress mainly transfers to barrier pillars and bottom pillars around the stope. Thus, monitoring the stress changes at the midpoints of barrier pillars and bottom pillars can reflect the stress evolution law of all backfilled stopes.
Due to different in situ stresses to varying depths of underground mines, using the stress value to express the stress evolution law of stopes is not conducive to comparing the effects of the mining depth. To make the obtained stress evolution law of stopes more universal, the stress concentration ratio (SCR) is used to represent the stress growth of rock mass under mining-induced stress. The expression of SCR is as follows:
SCR = σ i σ i 0 i = x , y , z
where, σ i 0 is the in situ stress at the measuring point in the i direction before the orebody is excavated; σi is the real-time stress at the measuring point in the i direction.
The stress evolution laws of barrier and bottom pillars are discussed separately below. SCR-XX is the concentration of σxx perpendicular to the strike of the ore body, SCR-YY is the concentration of σyy parallel to the strike of the orebody, and SCR-ZZ is the concentration of σzz in the vertical direction.

4.1.1. Barrier Pillars

Figure 9 is the change of SCR of the barrier pillars at different depths. Figure 9a–c displays SCR-XX, SCR-YY, and SCR-ZZ of the barrier pillars, respectively.
The X-direction perpendicular to the strike of the orebody is the same as the direction of the maximum principal stress of the in situ stress. It is evident from Figure 9a that the SCR-XX values of all barrier pillars are continuously increasing with mining activities. When the orebody in the stope is excavated, the barrier pillars in the current stope will bear more significant transfer stress. Still, the SCR-XX increment of the barrier pillars caused by excavation decreases with the increase of stope depth. The mining stress transferred to the barrier pillars in the −555 stope during the excavation of the −555 stope is 2.35 times the in situ stress, and the SCR-XX increment of the barrier pillars in the −960 stope dropped to about 1.2 during the excavation of the −960 stope. Since the mine room and pillar at each depth are the same, the decrease in the SCR-XX increment is due to the change of mining stress transfer mode, not the difference in the stope structure.
Figure 9a shows that the transfer range of mining stress expands with increasing mining depth. After excavating the orebody, the increase of SCR-XX of the barrier pillars in the current stope is most apparent. Some stress is transferred to the barrier pillar in the upper stopes and the rock mass below the current stope, causing the increase of SCR-XX of barrier pillars in the upper stopes and the rock mass below. Judging from the effect of causing rock mass SCR-XX changes, the range of mining stress transferred to upper stopes is much more extensive than that to the lower rock mass. For example, when the −825 stope was excavated, the SCR-XX of the above stopes had varying degrees of growth, while the SCR-XX of the rock mass within the range of two stopes below increased significantly.
After excavating the orebody, the midpoint of the barrier pillar in the YY direction was in a temporary unloading state. After filling the stope, the stress of the midpoint of the barrier pillar in the YY direction will gradually increase and exceed the in situ stress. Therefore, in Figure 9b, the SCR-YY of each barrier pillar in the stope will first decrease to a negative value and then gradually increases to above 0. With the increase of mining depth, the SCR-YY of barrier pillars at different depths is all approaching 0.5, which indicates that the transfer law of mining stress in the Y direction of the barrier pillars at different depths is the same.
The transfer law of the vertical stress on the barrier pillars is different from that of horizontal stress, showing a law of increasing first and then decreasing slightly (see Figure 9c). This phenomenon indicates that after mining deep ore bodies, the vertical stress had transferred to the shallow barrier pillars moved to the deep. The reason for this law may be that the rock mass in the hanging wall of the shallow stope will warp upward after mining the deep stope, as shown in Figure 5, thus reducing the vertical stress transferred from the rock mass in the hanging wall to the barrier pillars in the shallow stope.

4.1.2. Bottom Pillars

Figure 10 is the variation of the SCR of the bottom pillar at each depth. Figure 10a–c display SCR-XX, SCR-YY, and SCR-ZZ of the bottom pillars respectively.
As shown in Figure 10a, the SCR-XX of the bottom pillar will increase significantly after mining the stope above the bottom pillar, but it will decrease after mining the stope below the bottom pillar. As the depth increases, the increase of SCR-XX of the bottom pillar caused by mining the stope above the bottom pillar is greater, and the decrease of SCR-XX caused by the stope below the mining bottom pillar is also greater. When mining deep stopes, SCR-XX of the bottom pillar of the upper stope will gradually stabilize. The stable value of SCR-XX of the bottom pillars is between 1.0 and 2.0, which decreases as the depth of the bottom pillar increases.
The variation rule of SCR-YY of the bottom pillar is the same as that of SCR-XX. There is also a law that mining the stope above the bottom pillar causes the SCR-YY of the bottom pillar to increase, and mining the stope below the bottom pillar causes the SCR-YY of the bottom pillar to decrease, see Figure 10b. The final value of the SCR-YY of the bottom pillar in the shallow −510 stope is the largest, about 1.69. As the depth of the bottom pillar increases, its final value of SCR-YY gradually decreases to about 1.4.
Figure 10c shows that the SCR-ZZ of the bottom pillar decreases significantly after mining stopes above and below the bottom pillar due to the unloading effect of mining, and the SCR-ZZ increases slightly after filling the stope below the bottom pillar. The final value of the SCR-ZZ of the bottom pillar also gradually decreases as the depth of the bottom pillar increases. The SCR-ZZ of the bottom pillar at −510 m eventually drops 0.83, while the SCR-ZZ of the bottom pillar at −870 m eventually drops to 0.40.

4.2. Influence of Stope Depth on Stress Evolution

Figure 11 is a graph showing the variation of SCR-XX with the depth of the stope along the direction of maximum principal stress for all stopes. The curves of different colors represent different mining depths. Figure 11a,b are the SCR-XX of barrier pillars and bottom pillars. It can be seen from Figure 11 that the SCR curve of barrier pillars and bottom pillars shows a downward trend as a whole. After mining, the SCR of barrier pillars and bottom pillars in deeper stopes is smaller than that of the shallower stopes. Because all stopes in the model have the same size, the differences in SCR between pillars in different stopes is caused by the depth.
There are two reasons why the SCR of barrier pillars and bottom pillars in the deep stopes is lower than that in shallow stopes. One is that mining activities cause the horizontal principal stress to move to shallow stopes along the hanging wall and footwall. The other is that the shallow orebody’s in situ stress is low, and its safety factor is large so that it can bear more mining-induced stress. Since the barrier pillar is a continuous whole in the vertical direction, it can reflect the process of transferring the mining-induced stress to shallow parts. For example, after mining the −780 m stope, the SCR-XX of the barrier pillar in the −555 m stope also increased significantly (see Figure 11a). Unlike the barrier pillar, the bottom pillars are separated by backfilled stopes vertically. The mining-induced stress generated by mining the deep stope is difficult to transfer to the bottom pillar in the shallow stope. As a result, the SCR-XX of the bottom pillars will only increase slightly, as shown in Figure 11b.
The SCR-XX of most barrier pillars in mined stopes is over 3.0, as shown in Figure 11, because the backfill well encapsulates the barrier pillars. On the contrary, the bottom pillar’s SCR rapidly increases from around 1.0 to above 2.0 after mining the stope above and decreases significantly after mining the stope below. The main reason for this phenomenon is that the bottom pillars are not fully contacted with the backfill below. Therefore, when mining deep stopes, compared with the barrier pillars, the bottom pillars will have a significant stress drop, and it is difficult to withstand more mining-induced stress.
As the mining depth increases, barrier pillars and bottom pillars’ SCR decrease after mining the stopes. More mining stress is transferred to the strata under the excavation stope, and a stress concentration area forms in the strata which will be excavated in the next step. It can be seen from Figure 6 and Figure 7 that there is a stress concentration area below the deepest stope where the stress is greater than the in situ stress at the same level. The deeper the mining depth, the more significant the stress concentration area is. This phenomenon increases the risk of rockburst when excavating tunnels in deep strata.
The upper stopes need to bear more transfer loads to reduce the stress concentration in the strata below the deepest stope. The methods suitable for engineering are increasing the size and quantity of ore pillars and increasing the backfill strength. Increasing the size and amount of barrier pillars and bottom pillars will reduce the resource recovery rate of mining. Therefore, increasing the backfill strength is a more economical method to reduce the stress concentration of the strata below.

4.3. Influence of Mechanical Properties of the Backfill on the Stress Evolution

Studying the influence of mechanical properties on the stress evolution of the backfilled stope can explain the effect of increasing the strength of the backfill to reduce the stress concentration of the stratum below the deepest stope. In the numerical simulation for comparison, the stopes below −870 m are filled with low strength cemented tailings, high strength cemented tailings, and cemented block stones. These simulation models are used to compare the effects of different filling bodies on the stress concentration of the underlying stratum. The stress of the orebody in the next layer of the stope after filling the mining stope was recorded. Then the stress was used to calculate the SCR. The SCR of the orebody in the next layer of the excavated stope varies with the mining depth, as shown in Figure 12.
In the simulation, the stopes above −825 m are still filled with the low-strength cemented tailings. From Figure 12, the SCR of the orebody below the mining stope gradually rises with the increase of mining depth. Starting from mining −735 m, the SCR of the orebody under the mining stope increases linearly. When mining the stope above −735 m, the SCR of the orebody below the stope is lower because the overburden stratum can withstand mining stress greater than the barrier pillars and bottom pillars of stopes. When the mining depth exceeds −735 m, the vertical distance from the overlying stratum to the bottom of the stope is more than 270 m. After that, the mining stress is mainly borne by the pillars above the mining stope and the underlying stratum. Therefore, the SCR of the orebody below the stope increases linearly with the mining depth.
High strength cemented tailings and cemented block stones are used to replace low strength cemented tailings for filling from the −870 m. From the simulation results of Figure 12, the SCR curve showed a significant drop, indicating that the high strength filling method has indeed played a role in improving the stress of the orebody to be mined. The strength and elastic modulus of the backfill is higher, and the SCR of the underlying stratum is smaller.

5. Conclusions

Differences in mechanical properties between deep and shallow rock masses pose challenges in analysing the evolution law of mining stress in inclined backfilled stopes in deep mining. In this manuscript, a new method is proposed to determine the parameters of the brittle-ductile transition model corresponding to the H-B criterion and the M-C criterion, respectively. Next, the proposed method is verified with the conventional triaxial compression numerical test. Then, the model composed of multiple backfilled stopes with different depths is established. Finally, we discussed the formation displacement, the stress distribution of rock mass, the risk factor, and the general law of stress evolution in the backfilled stope according to the variation laws of SCR. The primary conclusions can be presented as follows:
(1)
The mining-induced stress will transfer to the shallow stope after mining and filling the inclined orebody. Therefore, the largest horizontal displacement of the formation, the highest stress area of the stratum, and the largest risk factor area all appear in one to two layers above the deepest stope. The most dangerous place is farther from the deepest stope as the mining depth increases. The SCR-XX of the shallow barrier pillars will continue to grow when mining and filling the deep stopes. Under the action of new transfer stress, the backfilled stope subjected to higher stress may cause disasters such as rockburst. The excavations closer to the orebody such as haulage drifts are typically exhibiting varying degrees of squeezing [43]. Therefore, the strength design of the pillars and the backfill should have a large safety factor when mining inclined deep stopes.
(2)
Barrier pillars and bottom pillars are the main support structures of the stope. Due to the brittle-ductile transition behaviour of rock mass, the backfill can increase the bearing capacity of pillars by increasing the minimum principal stress. After mining the deep stopes, the transfer stress of the barrier pillars in shallow stopes can always increase because the backfill wraps the barrier pillars nicely. On the contrary, the transfer stress that bottom pillars can withstand will decrease significantly after excavating the stope below because of the backfill gap.
(3)
Mining deep ore bodies transfers more mining stress to shallow stopes and the underlying stratum. The barrier pillars and bottom pillars’ SCR in the deep part is lower than in the shallow part since the mining-induced stress in the deep part has moved to the shallow part, which has a larger strength safety reserve. Similarly, more mining stress is transferred to the underlying stratum as the mining depth increases and forms a more obvious high-stress concentration area. The apparent stress of seismic events at the deep metal mine shows that the stress of the orebody below the excavated stope and the surrounding rock of the filled stope above will increase after the stope is excavated [44].
(4)
Part of the mining stress transferred to the underlying stratum after mining and filling the inclined orebody will form a stress concentration area below the deepest stope. The SCR monitoring results of the underlying stratum shows that the ratio of the transfer stress to in situ stress of the underlying stratum increases as the mining depth increases. Replacing low-strength backfill with high-strength backfill can reduce the stress concentration of the underlying stratum and improve the stress environment in the following mining operation.

Author Contributions

Conceptualization, Y.Z. and J.Z.; methodology, Y.Z.; software, J.M.; validation, Y.Z., X.C. and J.Z.; resources, Y.Z.; data curation, J.Z.; writing—original draft preparation, Y.Z.; writing—review and editing, J.Z.; visualization, X.C.; supervision, G.Z.; project administration, G.Z. All authors have read and agreed to the published version of the manuscript.

Funding

This research is supported by financial grants from the National Key Research and Development Program of China (2018YFC0604606), the National Natural Science Foundation for Young Scientists of China (52104111), the Natural Science Foundation of Hunan Province (2021JJ30819), and the Fundamental Research Funds for the Central Universities of Central South University (2019zzts306).

Institutional Review Board Statement

Not applicable.

Informed Consent Statement

Not applicable.

Conflicts of Interest

The authors declare no conflict of interest.

References

  1. Sobhi, M.A.; Li, L. Numerical investigation of the stresses in backfilled stopes overlying a sill mat. J. Rock Mech. Geotech. Eng. 2017, 9, 490–501. [Google Scholar] [CrossRef]
  2. Raffaldi, M.J.; Seymour, J.B.; Richardson, J.; Zahl, E.; Board, M. Cemented Paste Backfill Geomechanics at a Narrow-Vein Underhand Cut-and-Fill Mine. Rock Mech. Rock Eng. 2019, 52, 4925–4940. [Google Scholar] [CrossRef] [PubMed]
  3. Xinmin, W.; Desheng, G.; Qinli, Z. Theory of Backfilling Activity and Pipeline Transportation Technology of Backfill in Deep Mines; Central South University Press: Changsha, China, 2010; ISBN 978-7-5487-0152-1. [Google Scholar]
  4. Chen, X.; Li, L.; Wang, L.; Qi, L. The current situation and prevention and control countermeasures for typical dynamic disasters in kilometer-deep mines in China. Saf. Sci. 2019, 115, 229–236. [Google Scholar] [CrossRef]
  5. Wang, S.; Li, X.; Yao, J.; Gong, F.; Li, X.; Du, K.; Tao, M.; Huang, L.; Du, S. Experimental investigation of rock breakage by a conical pick and its application to non-explosive mechanized mining in deep hard rock. Int. J. Rock Mech. Min. Sci. 2019, 122, 104063. [Google Scholar] [CrossRef]
  6. Wagner, H. Deep Mining: A Rock Engineering Challenge. Rock Mech. Rock Eng. 2019, 52, 1417–1446. [Google Scholar] [CrossRef] [Green Version]
  7. Cai, X.; Cheng, C.; Zhao, Y.; Zhou, Z.; Wang, S. The role of water content in rate dependence of tensile strength of a fine-grained sandstone. Arch. Civ. Mech. Eng. 2022, 22, 58. [Google Scholar] [CrossRef]
  8. Zhou, Z.L.; Zhao, Y.; Cao, W.Z.; Chen, L.; Zhou, J. Dynamic Response of Pillar Workings Induced by Sudden Pillar Recovery. Rock Mech. Rock Eng. 2018, 51, 3075–3090. [Google Scholar] [CrossRef]
  9. Xiao, P.; Li, D.; Zhao, G.; Liu, H. New criterion for the spalling failure of deep rock engineering based on energy release. Int. J. Rock Mech. Min. Sci. 2021, 148, 104943. [Google Scholar] [CrossRef]
  10. Li, L.; Aubertin, M. An improved analytical solution to estimate the stress state in subvertical backfilled stopes. Can. Geotech. J. 2008, 45, 1487–1496. [Google Scholar] [CrossRef]
  11. Li, L.; Aubertin, M. An analytical solution for the nonlinear distribution of effective and total stresses in vertical backfilled stopes. Geomech. Geoengin. 2010, 5, 237–245. [Google Scholar] [CrossRef]
  12. Ting, C.H.; Sivakugan, N.; Read, W.; Shukla, S.K. Analytical Expression for Vertical Stress within an Inclined Mine Stope with Non-parallel Walls. Geotech. Geol. Eng. 2014, 32, 577–586. [Google Scholar] [CrossRef]
  13. Li, L.; Aubertin, M. Numerical Investigation of the Stress State in Inclined Backfilled Stopes. Int. J. Geomech. 2009, 9, 52–62. [Google Scholar] [CrossRef]
  14. Jahanbakhshzadeh, A.; Aubertin, M.; Li, L. A New Analytical Solution for the Stress State in Inclined Backfilled Mine Stopes. Geotech. Geol. Eng. 2017, 35, 1151–1167. [Google Scholar] [CrossRef]
  15. Jahanbakhshzadeh, A.; Aubertin, M.; Li, L. Analysis of the Stress Distribution in Inclined Backfilled Stopes Using Closed-form Solutions and Numerical Simulations. Geotech. Geol. Eng. 2018, 36, 1011–1036. [Google Scholar] [CrossRef]
  16. Yan, B.; Zhu, W.; Hou, C.; Guan, K. A three-dimensional analytical solution to the arching effect in inclined backfilled stopes. Geomech. Geoengin. 2019, 14, 136–147. [Google Scholar] [CrossRef]
  17. Falaknaz, N.; Aubertin, M.; Li, L. Numerical Analyses of the Stress State in Two Neighboring Stopes Excavated and Backfilled in Sequence. Int. J. Geomech. 2015, 15, 04015005. [Google Scholar] [CrossRef]
  18. Liu, Z.X.; Lan, M.; Xiao, S.Y.; Guo, H.Q. Damage failure of cemented backfill and its reasonable match with rock mass. Trans. Nonferrous Met. Soc. China (Engl. Ed.) 2015, 25, 954–959. [Google Scholar] [CrossRef]
  19. Cao, S.; Yilmaz, E.; Song, W.; Xue, G. Assessment of Acoustic Emission and Triaxial Mechanical Properties of Rock-Cemented Tailings Matrix Composites. Adv. Mater. Sci. Eng. 2019, 2019, 6742392. [Google Scholar] [CrossRef] [Green Version]
  20. Yu, X.; Kemeny, J.; Tan, Y.; Song, W.; Huang, K. Mechanical properties and fracturing of rock-backfill composite specimens under triaxial compression. Constr. Build. Mater. 2021, 304, 124577. [Google Scholar] [CrossRef]
  21. Thompson, B.D.; Grabinsky, M.W.; Bawden, W.F.; Counter, D.B. In-situ measurements of cemented paste backfill in long-hole stopes. In Proceedings of the 3rd CANUS Rock Mechanics Symposium, Toronto, ON, Canada, 9–15 May 2009; pp. 197–198. [Google Scholar]
  22. Qi, C.; Fourie, A. Numerical Investigation of the Stress Distribution in Backfilled Stopes Considering Creep Behaviour of Rock Mass. Rock Mech. Rock Eng. 2019, 52, 3353–3371. [Google Scholar] [CrossRef]
  23. Xue, D.; Wang, J.; Zhao, Y.; Zhou, H. Quantitative determination of mining-induced discontinuous stress drop in coal. Int. J. Rock Mech. Min. Sci. 2018, 111, 1–11. [Google Scholar] [CrossRef]
  24. Wu, X.; Li, G.; Luo, F.; Duan, S. A Study on the Distribution and Evolution of Mining Induced Stress under the Condition of Multiple Mining. Geotech. Geol. Eng. 2021, 39, 1637–1648. [Google Scholar] [CrossRef]
  25. Shankar, V.; Kumar, D.; Subrahmanyam, D. Impact and Severity of Deep Excavations on Stress Tensors in Mining. J. Min. Sci. 2019, 55, 213–218. [Google Scholar] [CrossRef]
  26. Hu, Y.; Zhang, J.; Li, C.; Song, Z.; Xiao, Y.; Wang, Y. Characteristics and Time-Space Evolution of Mining Stress in High Stope. Adv. Mater. Sci. Eng. 2021, 2021, 2785933. [Google Scholar] [CrossRef]
  27. Wawersik, W.R.; Fairhurst, C. A study of brittle rock fracture in laboratory compression experiments. Int. J. Rock Mech. Min. Sci. Geomech. Abstr. 1970, 7, 561–575. [Google Scholar] [CrossRef]
  28. Li, D.; Gao, F.; Han, Z.; Zhu, Q. Experimental evaluation on rock failure mechanism with combined flaws in a connected geometry under coupled static-dynamic loads. Soil Dyn. Earthq. Eng. 2020, 132, 106088. [Google Scholar] [CrossRef]
  29. Cui, L.; Fall, M. An evolutive elasto-plastic model for cemented paste backfill. Comput. Geotech. 2016, 71, 19–29. [Google Scholar] [CrossRef]
  30. Yang, L.; Xu, W.; Yilmaz, E.; Wang, Q.; Qiu, J. A combined experimental and numerical study on the triaxial and dynamic compression behavior of cemented tailings backfill. Eng. Struct. 2020, 219, 110957. [Google Scholar] [CrossRef]
  31. Wang, S.; Tang, Y.; Wang, S. Influence of brittleness and confining stress on rock cuttability based on rock indentation tests. J. Cent. South Univ. 2021, 28, 2786–2800. [Google Scholar] [CrossRef]
  32. Xie, H.; Li, C.; He, Z.; Li, C.; Lu, Y.; Zhang, R.; Gao, M.; Gao, F. Experimental study on rock mechanical behavior retaining the in situ geological conditions at different depths. Int. J. Rock Mech. Min. Sci. 2021, 138, 104548. [Google Scholar] [CrossRef]
  33. Li, D.; Sun, Z.; Xie, T.; Li, X.; Ranjith, P.G. Energy evolution characteristics of hard rock during triaxial failure with different loading and unloading paths. Eng. Geol. 2017, 228, 270–281. [Google Scholar] [CrossRef]
  34. Wu, X.; Jiang, Y.; Guan, Z. A modified strain-softening model with multi-post-peak behaviours and its application in circular tunnel. Eng. Geol. 2018, 240, 21–33. [Google Scholar] [CrossRef]
  35. Fang, Z.; Harrison, J.P. A mechanical degradation index for rock. Int. J. Rock Mech. Min. Sci. 2001, 38, 1193–1199. [Google Scholar] [CrossRef]
  36. Hoek, E.; Brown, E.T. Practical estimates of rock mass strength. Int. J. Rock Mech. Min. Sci. 1997, 34, 1165–1186. [Google Scholar] [CrossRef]
  37. Hoek, E.; Brown, E.T. The Hoek–Brown failure criterion and GSI – 2018 edition. J. Rock Mech. Geotech. Eng. 2019, 11, 445–463. [Google Scholar] [CrossRef]
  38. Lu, C. Reaserch on the Energy System of Deep Granite Considering the Stored Energy and Dissipated Energy Characteristics. Ph.D. Thesis, University of Science and Technology Beijing, Beijing, China, 2019. [Google Scholar]
  39. Kang, P.; Zhaopeng, L.; Quanle, Z.; Zhenyu, Z.; Jiaqi, Z. Static and Dynamic Mechanical Properties of Granite from Various Burial Depths. Rock Mech. Rock Eng. 2019, 52, 3545–3566. [Google Scholar] [CrossRef]
  40. Hou, P.Y.; Cai, M.; Zhang, X.W.; Feng, X.T. Post-peak Stress–Strain Curves of Brittle Rocks Under Axial- and Lateral-Strain-Controlled Loadings. Rock Mech. Rock Eng. 2022, 55, 855–884. [Google Scholar] [CrossRef]
  41. Li, P.; Cai, M.; Guo, Q.; Miao, S. In Situ Stress State of the Northwest Region of the Jiaodong Peninsula, China from Overcoring Stress Measurements in Three Gold Mines. Rock Mech. Rock Eng. 2019, 52, 4497–4507. [Google Scholar] [CrossRef]
  42. Jiang, G.; Zuo, J.; Li, Y.; Wei, X. Experimental Investigation on Mechanical and Acoustic Parameters of Different Depth Shale Under The Effect of Confining Pressure. Rock Mech. Rock Eng. 2019, 52, 4273–4286. [Google Scholar] [CrossRef]
  43. Mercier-Langevin, F. LaRonde Extension–mine design at three kilometres. Min. Technol. 2011, 120, 95–104. [Google Scholar] [CrossRef]
  44. Brown, L.; Hudyma, M. Identification of Stress Change within a Rock Mass Through Apparent Stress of Local Seismic Events. Rock Mech. Rock Eng. 2017, 50, 81–88. [Google Scholar] [CrossRef]
Figure 1. Stress-strain curves of the simulated rock material under different confining pressures.
Mathematics 10 01308 g001
Figure 2. The simulation model of backfilled stopes.
Mathematics 10 01308 g002
Figure 3. Schematic diagram of the location of stress monitoring points. (a) The view perpendicular to the Y axis; (b) The view perpendicular to the ore body.
Mathematics 10 01308 g003aMathematics 10 01308 g003b
Figure 4. Horizontal displacement of ground at different depths of mining.
Mathematics 10 01308 g004
Figure 5. Vertical displacement of ground at different depths of mining.
Mathematics 10 01308 g005
Figure 6. Stress distribution along the stope’s midline (y = 125 m) (tensile stress is positive). (a) Horizontal stress distribution, σxx; (b) Vertical stress distribution, σzz.
Mathematics 10 01308 g006
Figure 7. Stress distribution along the centre line of the barrier pillars (y = 100 m) (tensile stress is positive). (a) Horizontal stress distribution, σxx; (b) Vertical stress distribution, σzz.
Mathematics 10 01308 g007
Figure 8. Cloud diagram of risk factor ( σ 1 / σ 1 c ). (a) The risk factor along the stope’s midline (y = 125 m); (b) The risk factor along the barrier pillars’ midline (y = 100 m).
Mathematics 10 01308 g008
Figure 9. The change law of the stress concentration ratio (SCR) of the barrier pillars at different depths: (a) the SCR in the XX direction, (b) the SCR in the YY direction, and (c) the SCR in the ZZ direction.
Mathematics 10 01308 g009aMathematics 10 01308 g009b
Figure 10. Variation regularity of stress ratio of bottom columns at various depths. (a) Stress ratio in XX direction, (b) Stress ratio in YY direction, and (c) Stress ratio in ZZ direction.
Mathematics 10 01308 g010aMathematics 10 01308 g010b
Figure 11. SCR-XX curves of (a) barrier pillars and (b) bottom pillars at different depths after excavation of stopes at different depths.
Mathematics 10 01308 g011
Figure 12. Variation of SCR with mining depth in the next layer of the excavated stope.
Mathematics 10 01308 g012
Table 1. The peak strength and residual strength of the simulated rock material.
Confining Pressure (MPa)Peak Strength (MPa)Residual Strength (MPa)
0.0064.540.00
5.0087.2843.52
10.00106.8275.23
15.00124.44101.64
20.00140.75124.30
25.00156.09144.21
30.00170.67162.10
Table 2. The physical and mechanical parameters of rock masses (E is the Young’s modulus; σ c i is the unconfined compressive strength; mb, s, and a are the rock mass material constants of H–B empirical strength criterion; β, γ, and γ are residual strength parameters.).
NameDensity
(kg/m3)
Poisson’s RatioE
(GPa)
σci
(MPa)
mbsaβ
(MPa)
γγ
Hanging wall27000.211110.408.600.80.596.270.040.048
Orebody27000.2871.897.240.80.563.530.070.081
Footwall27000.2516160.7111.280.80.5139.150.030.038
Table 3. The physical and mechanical parameters of backfill (E is the Young’s modulus; c is the cohesion of the backfill; ϕ is the friction angle of the backfill; β and γ are residual strength parameters.).
NameDensity
(kg/m3)
Poisson’s RatioE
(GPa)
UCS (MPa)c
(MPa)
ϕ
(°)
β
(MPa)
γ
Low strength cemented tailings20000.30.210.35260.864.13
High strength cemented tailings20000.30.330.90302.583.74
Cemented block stones23000.30.451.30354.302.19
Publisher’s Note: MDPI stays neutral with regard to jurisdictional claims in published maps and institutional affiliations.

