Article

Determination of Significant Parameters on the Basis of Methods of Mathematical Statistics, and Boolean and Fuzzy Logic

Faculty of Computer Science and Technology, St. Petersburg State Electrotechnical University “LETI”, 197376 St. Petersburg, Russia
*
Author to whom correspondence should be addressed.
Mathematics 2022, 10(7), 1133; https://doi.org/10.3390/math10071133
Submission received: 15 February 2022 / Revised: 23 March 2022 / Accepted: 27 March 2022 / Published: 1 April 2022
(This article belongs to the Special Issue Application of Mathematical Methods in Artificial Intelligence)

Abstract

:
Among the set of parameters for which data are collected for decision-making based on artificial intelligence methods, often only some of the parameters are significant. This article compares methods for determining the significant parameters based on the theory of mathematical statistics, and fuzzy and boolean logic. The testing was conducted on several test data sets with a different number of parameters and different variability of parameter values. It was shown that for data sets with a small number of parameters (<5), the most accurate result was given for a method based on the theory of mathematical statistics and boolean logic. For a data set with a large number of parameters—the most suitable is the method of fuzzy logic.

1. Introduction

Over the past 5 years, more than 390,000 articles have been published on the topic of artificial intelligence as augmenting human capabilities with new capabilities and enhancing existing ones, according to Google Scholar. The authors of [1] argue that the most prospective result of AI development is an interactive symbiosis, in which humans and computers will work closely in a productive partnership, combining the best qualities of humans with the best qualities of machines. Modern computing power allows for performing resource-intensive computational tasks, freeing humans to perform more intelligent tasks, which artificial intelligence is not yet capable of solving. One such task, which on the one hand can be solved by AI, and on the other hand for more effective application of the obtained solution it is necessary to explain it, is the problem of classification.
The task of classification in artificial intelligence and machine learning is the task of dividing a set of objects into groups, called classes, based on the analysis of their formal description [2]. As a result of classification, each object belongs to a certain class.
The primary set of data input to the methods of artificial intelligence often contains a large set of parameters, called attributes. The attributes that characterize an object are called observable (independent) attributes (hereinafter attributes). An integral or target attribute is an attribute, calculated on the basis of independent attributes. According to the value of the target attribute, the object is assigned to a certain class.
There can be a lot of attributes measured in the observed object, but often only a small part of the attributes significantly affects the value of the target attribute. Hence, there are two problems, namely:
  • high time and resource costs of processing unneeded data;
  • lack of understanding of which attributes influenced the decision.
Such classification tasks requiring explanation are found in many applied fields, in particular in medicine [3,4]. When making a diagnosis, it is important to understand what number and what kind of features influence the decision of a medical intelligent system. Due to the fact that the decision must often be made as quickly as possible and using computing devices close to the end user (e.g., on wearable devices or mobile medicine devices), a lot depends on a classification method, which minimizes computational resources and provides insight into the decision-making process.
This article presents the results of research on the applicability of fuzzy and two-valued logic methods for the selection of significant features and for solving the problem of classifying objects, as well as the results of comparing the accuracy of the obtained solutions. The methods were tested on two data sets. One contained synthetic data about users’ keyboard operation on a cell phone. The second set contained records of patients, some of whom had heart disease and some of whom did not. The first set consisted of 80 records and the second set consisted of 303.
The purpose of the study was to evaluate the advantages and disadvantages of using boolean logic to improve the interpretability of the solution compared to methods based on fuzzy logic.
The article is structured as follows. The second section presents an overview of related work, showing that despite the existence of a large number of works in this area, a good solution to obtain an explainable solution does not yet exist. The third section describes the approach to the classification of objects based on methods of mathematical statistics. The fourth section is devoted to the description of the test data. The testing was conducted on two data sets with a different number of input parameters. The fifth section presents the method of object classification based on boolean logic and the results of the comparison of the described methods. The results of the study are summarized in the conclusion.

2. Overview of Related Research

The complexity of most objects to be analyzed makes the development of intelligent systems a difficult algorithmic decision because of the uncertainty inherent in many objects, such as biological objects. The human brain makes it possible to form clear decisions based on inaccurate, approximate data. In practice, there may not exist an exact mathematical model of the analyzed objects, or such a model may be too complex to implement. To solve such problems, for example, to provide effective and timely medical diagnosis, methods of fuzzy logic, neural networks, and evolutionary computation are being actively developed.
The use of fuzzy logic allows for designing fuzzy classifiers that have fuzzy rules and membership functions. In [5], the method of multidimensional feature selection is considered, in which both the search strategy and the proposed classifier are based on evolutionary computations. Testing of the method was conducted on a real data set and the results were compared with filtering methods, using deterministic and probabilistic search strategies. The testing showed that when testing the method on two real data sets, the accuracy of the classification result was 0.78, while the application of fuzzy classification methods showed a value of 0.76, and on the second data set the accuracy was 0.74, against a value of 0.63 obtained using fuzzy classification methods.
The study of [6] proposed a classification of blood pressure level based on expert knowledge, which is represented in fuzzy rules using the Mamdani type classifier. This allowed for the development of various architectures in type-1 and type-2 fuzzy systems, including a type-2 fuzzy system with adjustable intervals and with triangular, trapezoidal, and Gaussian membership functions.
Fuzzy and linguistic variables can be effectively applied to complex or unexpected situations and are often represented by second-order fuzzy sets [7]. For example, second-order fuzzy sets are most widely used for fuzzy recognition, decision making, knowledge classification, medical diagnosis, clustering, control systems, databases, and so on [8,9,10,11,12,13]. The use of fuzzy logic theory and linguistic variables can reduce the impact of inaccuracies in the description of the patient’s condition regarding the accuracy of the diagnosis and disease treatment scheme. Thus, based on the similarity of fuzzy numbers of the second order, in [13,14], a method is presented that allows for carrying out the choice of the most appropriate medical treatment. The authors of [13] developed a new measure of similarity of fuzzy sets of the second order, based on the difference in proportions, geometric distance, height, and distance to the center of gravity of two fuzzy numbers, on which the choice of treatment methods is based.
In [15], a method based on type 2 fuzzy logic (DT2FL), high performance computing, and cognitive science is proposed. It allows for the analysis of Magnetic resonance imaging (MRI) data within a massively parallel and distributed architecture of virtual mobile agents. In [16], a computer diagnostic model for the accurate diagnosis of coronary heart disease based on advanced fuzzy cognitive state space maps (AFCMs), an evolution of traditional fuzzy cognitive maps, was proposed. It is shown that the AFCM approach in the development of fuzzy cognitive maps is superior to the traditional approach of coronary heart disease diagnosis.
The combined use of fuzzy logic and neural network methods [17,18] is used indirectly in patient state classification systems through their direct application in accelerating data processing in relational and NoSQL databases.
Some studies apply logic theory based on automata models, in particular in [19], using the Mili automaton. In this work, a binary Hartley measure for estimating the changes in structural tissue topology was calculated and a method of automated diagnostics based on the analysis of pathology indicators was developed.
Application of the logic-based regression approach allows for obtaining binary results using logical combinations of predictors, to form easily interpretable models [20,21,22]. In [21], a fuzzy generalized multifactorial dimensionality reduction method is proposed, where the fuzzy sets apparatus is used as a combined analysis to identify cause–effect relationships of genetic diseases. The application of linguistic rules in [23] with the use of fuzzy inductive reasoning, allows for obtaining qualitative relationships between the variables that make up the system, and to predict the behavior of the system under study.
The analysis of the presented works has shown that for data with a small set of parameters, it is not always effective to use standard methods of mathematical statistics to solve the problem of belonging to a particular class. In particular, for data with a number of parameters less than five, it is advisable to use combined methods of research. Most often, the methods of fuzzy logic and mathematical statistics are combined. In this article, it is proposed to combine methods of mathematical statistics theory and boolean logic. A comparative analysis with the combination of methods of mathematical statistics and fuzzy logic is carried out, and it is shown in what cases what combination is better to use.
One of the potential disadvantages affecting the application of fuzzy logic methods in general and for data analysis in particular is the often limited interpretability of the results they produce. The interpretability of model results can be greatly improved by identifying significant attributes that can be relied upon to make decisions. This can be achieved by applying boolean logic.

3. Classification Methods Based on Mathematical Statistics, Fuzzy and Boolean Logic3

This section discusses two methods of classifying objects. The first method uses the apparatus of mathematical statistics and fuzzy logic, and the second approach uses the basics of Boolean logic.

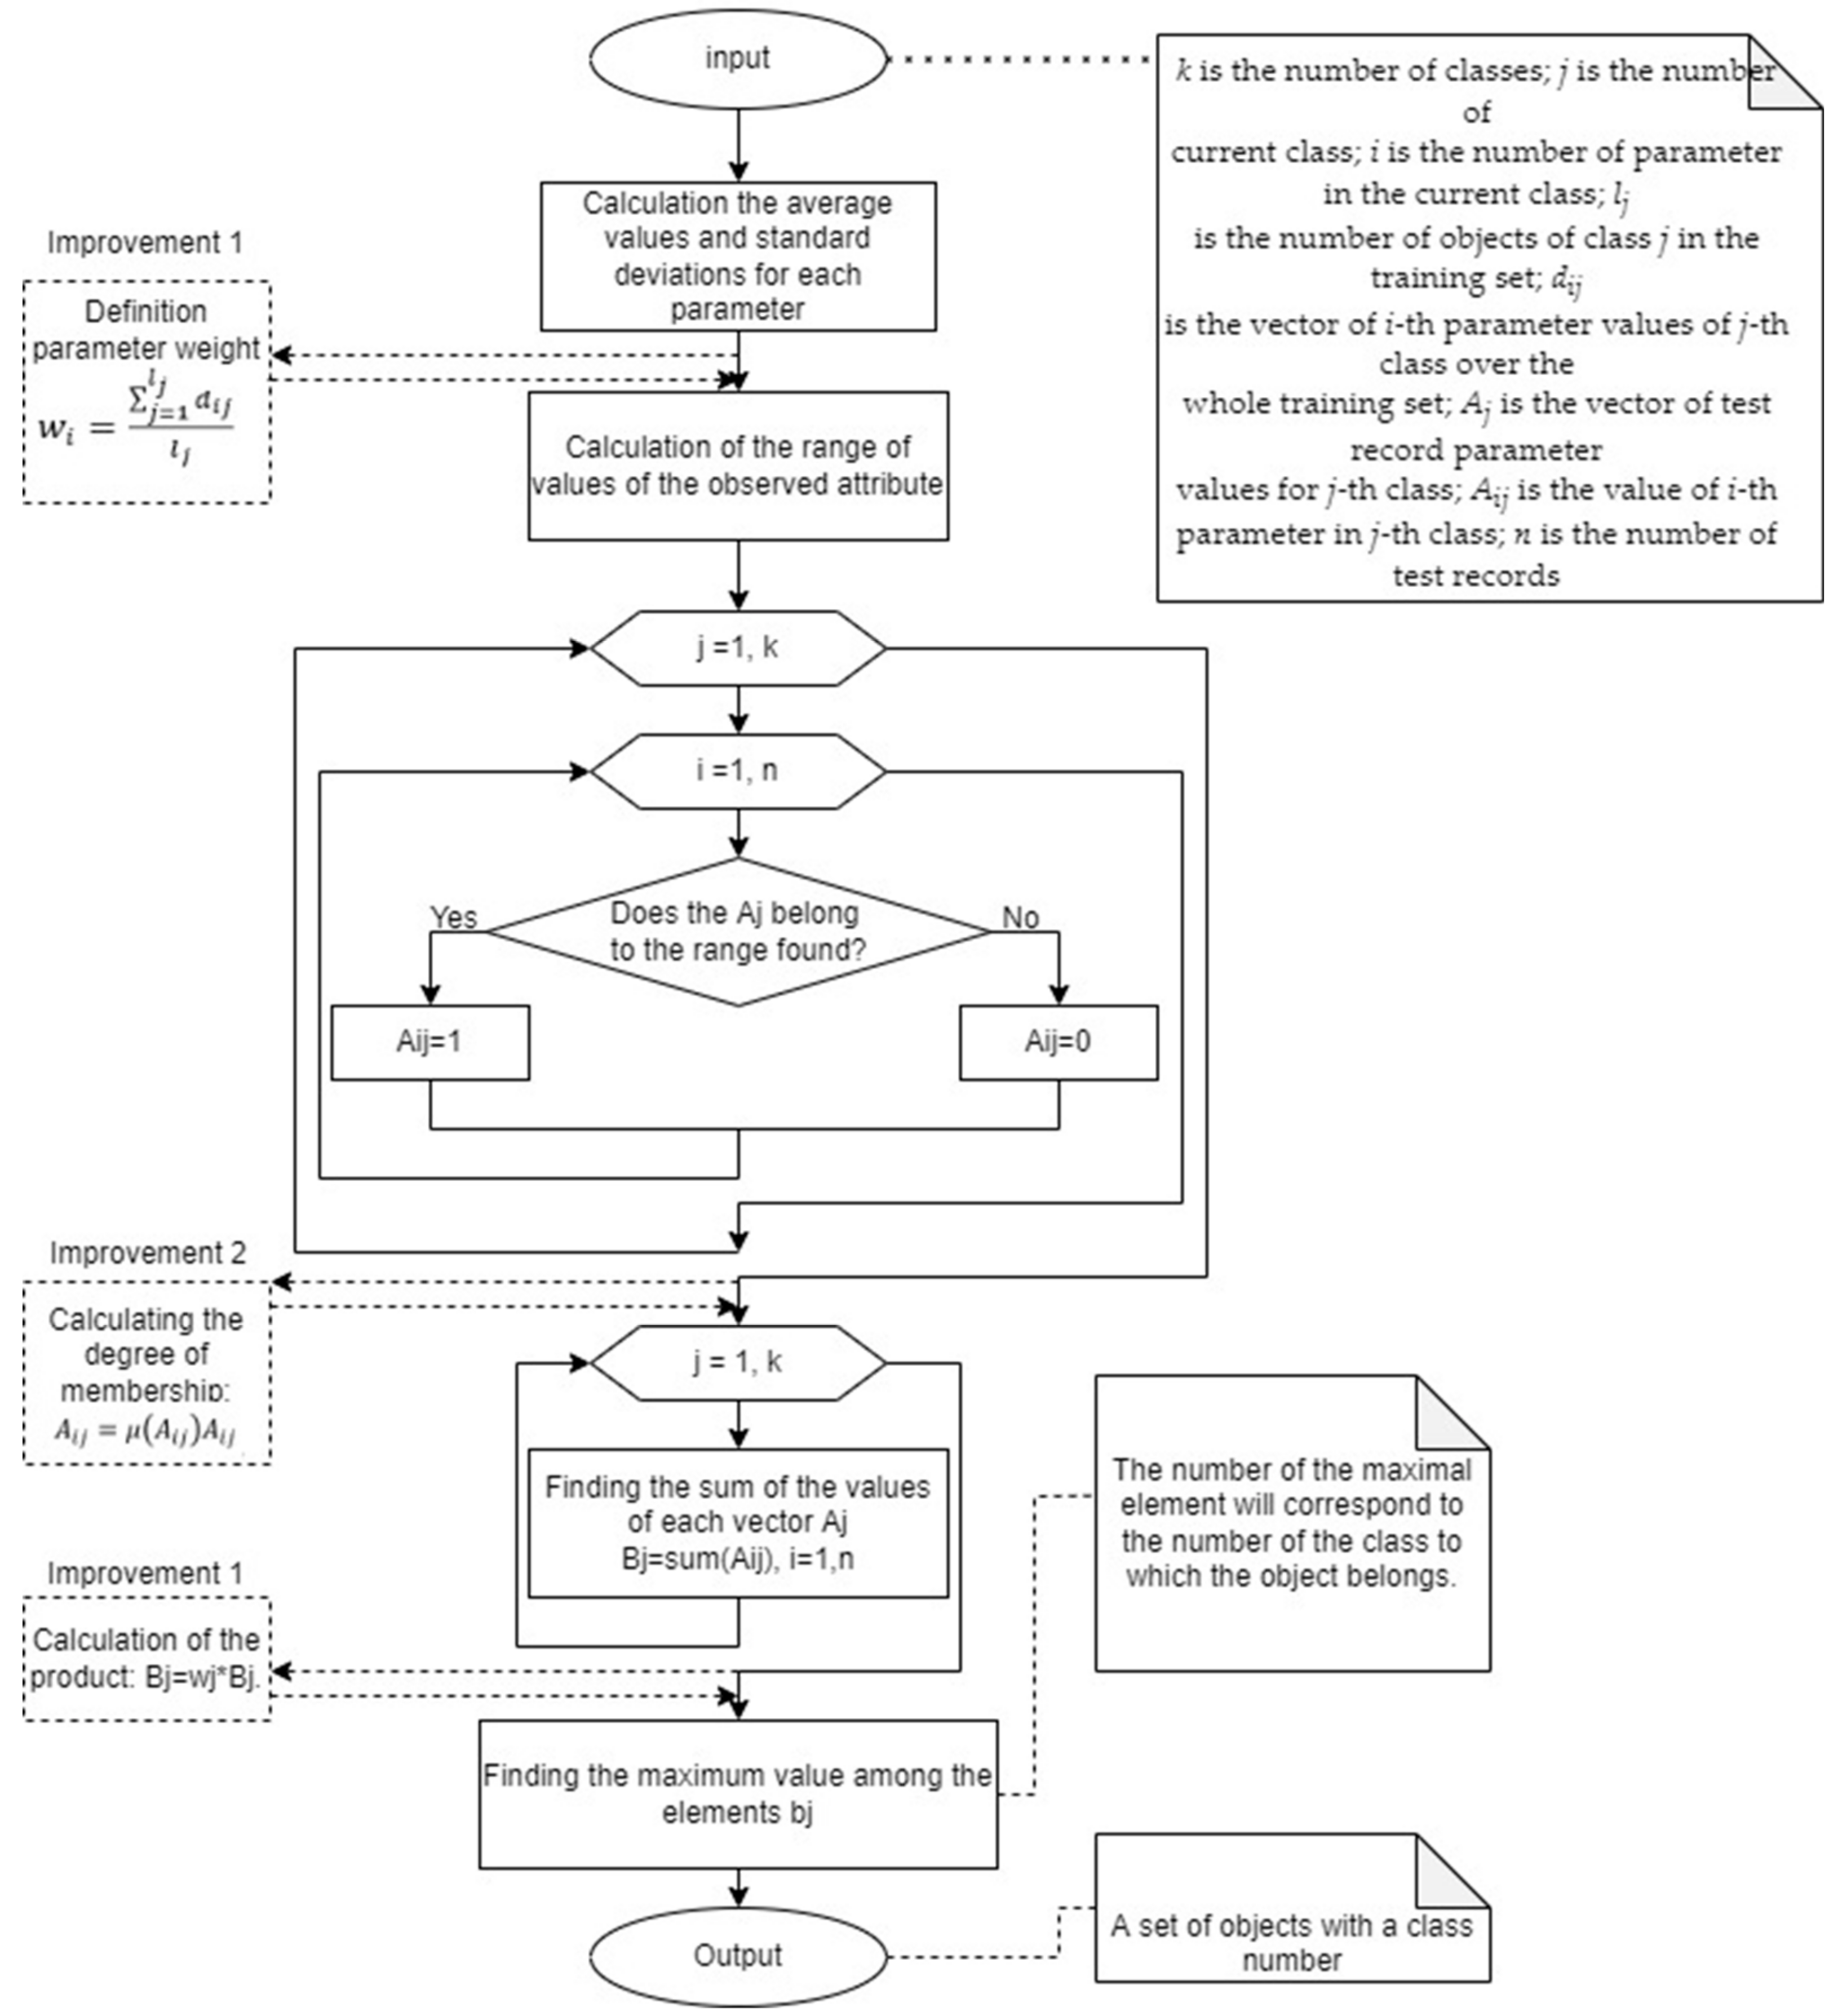
3.1. Classification by Means of Mathematical Statistics

Let k be the number of classes, j is the number of current class, i is the number of parameters in the current class, lj is the number of objects of class j in the training set, dij is the vector of the i-th parameter values of the j-th class over the whole training set, Aj is the vector of the test record parameter values for the j-th class, Aij is the value of the i-th parameter in the j-th class, and n is the number of test records.
Step 1. Calculate the average values and standard deviations (SD) for each parameter of each class in the training set.
Step 2. Calculate the range of observed trait values specific to each value of the integrated trait in the training set for each class. The left boundary of the range is obtained by subtracting the SD from the average value, and the right boundary is obtained by summing the SD and the average value.
Step 3. For each parameter of the test record, check whether the value belongs to the range (calculated in step 2) of each class. If the value belongs to the range, it is replaced by “1”, otherwise it is replaced by “0”. As a result, the test record will be a vector Ai of zeros and ones. Do this operation for each class. The result will be a set of vectors {Ai}, i = 1, ..., k. Each vector corresponds to a certain class.
Step 4. Find the sum of values of each vector Ai. The result will be a vector B = (bi), i = 1, ..., k.
Step 5. Find the maximum value among the elements bi, i = 1, ..., k. The number of the maximal element will correspond to the number of the class to which the object belongs.
Note. In some cases there can be r (rk) maximal elements among elements bi, i = 1, ..., k. In this case, it is necessary to calculate the probability of belonging of the observed object to the given classes: p = 1/r.
The disadvantage of this method is that the method allows for determining, with some probability, the object belonging to a given class, but does not give an exact explanation on the basis of presence of influence of what parameters and absence of influence of what parameters the decision on object classification is made.
To eliminate this disadvantage, the method can be improved by pre-calculating the weight for each parameter of each class. In this case, a number of steps are added to the method described above.
Improvement of method 1.
Step 2.1. Define the parameter weight as w i = j = 1 l j d i j l j , i.e., as number “1” divided by the total number of records in the given class.
Step 3.1. Find the product of vector values wi and Ai. In other words, find the sum of the products of the obtained weights by the value “0” or “1” corresponding to the given i-th parameter of the j-th class. In fact, the probability of getting the value in the given range is found.
This method differs from the previous one in the fact that when estimating the probability of the object belonging to each class, the influence of each individual parameter on the decision about classification is taken into account. In this case, for each class, the influence of the same parameter on the resulting value can differ significantly.
Improvement of method 2.
It is possible to increase the accuracy of the solution, if, at step 2, we replace the definition of the direct hit of the parameter value in the range by the value of the function of belonging of this parameter to a given range.
Figure 1 shows a flowchart of the method.

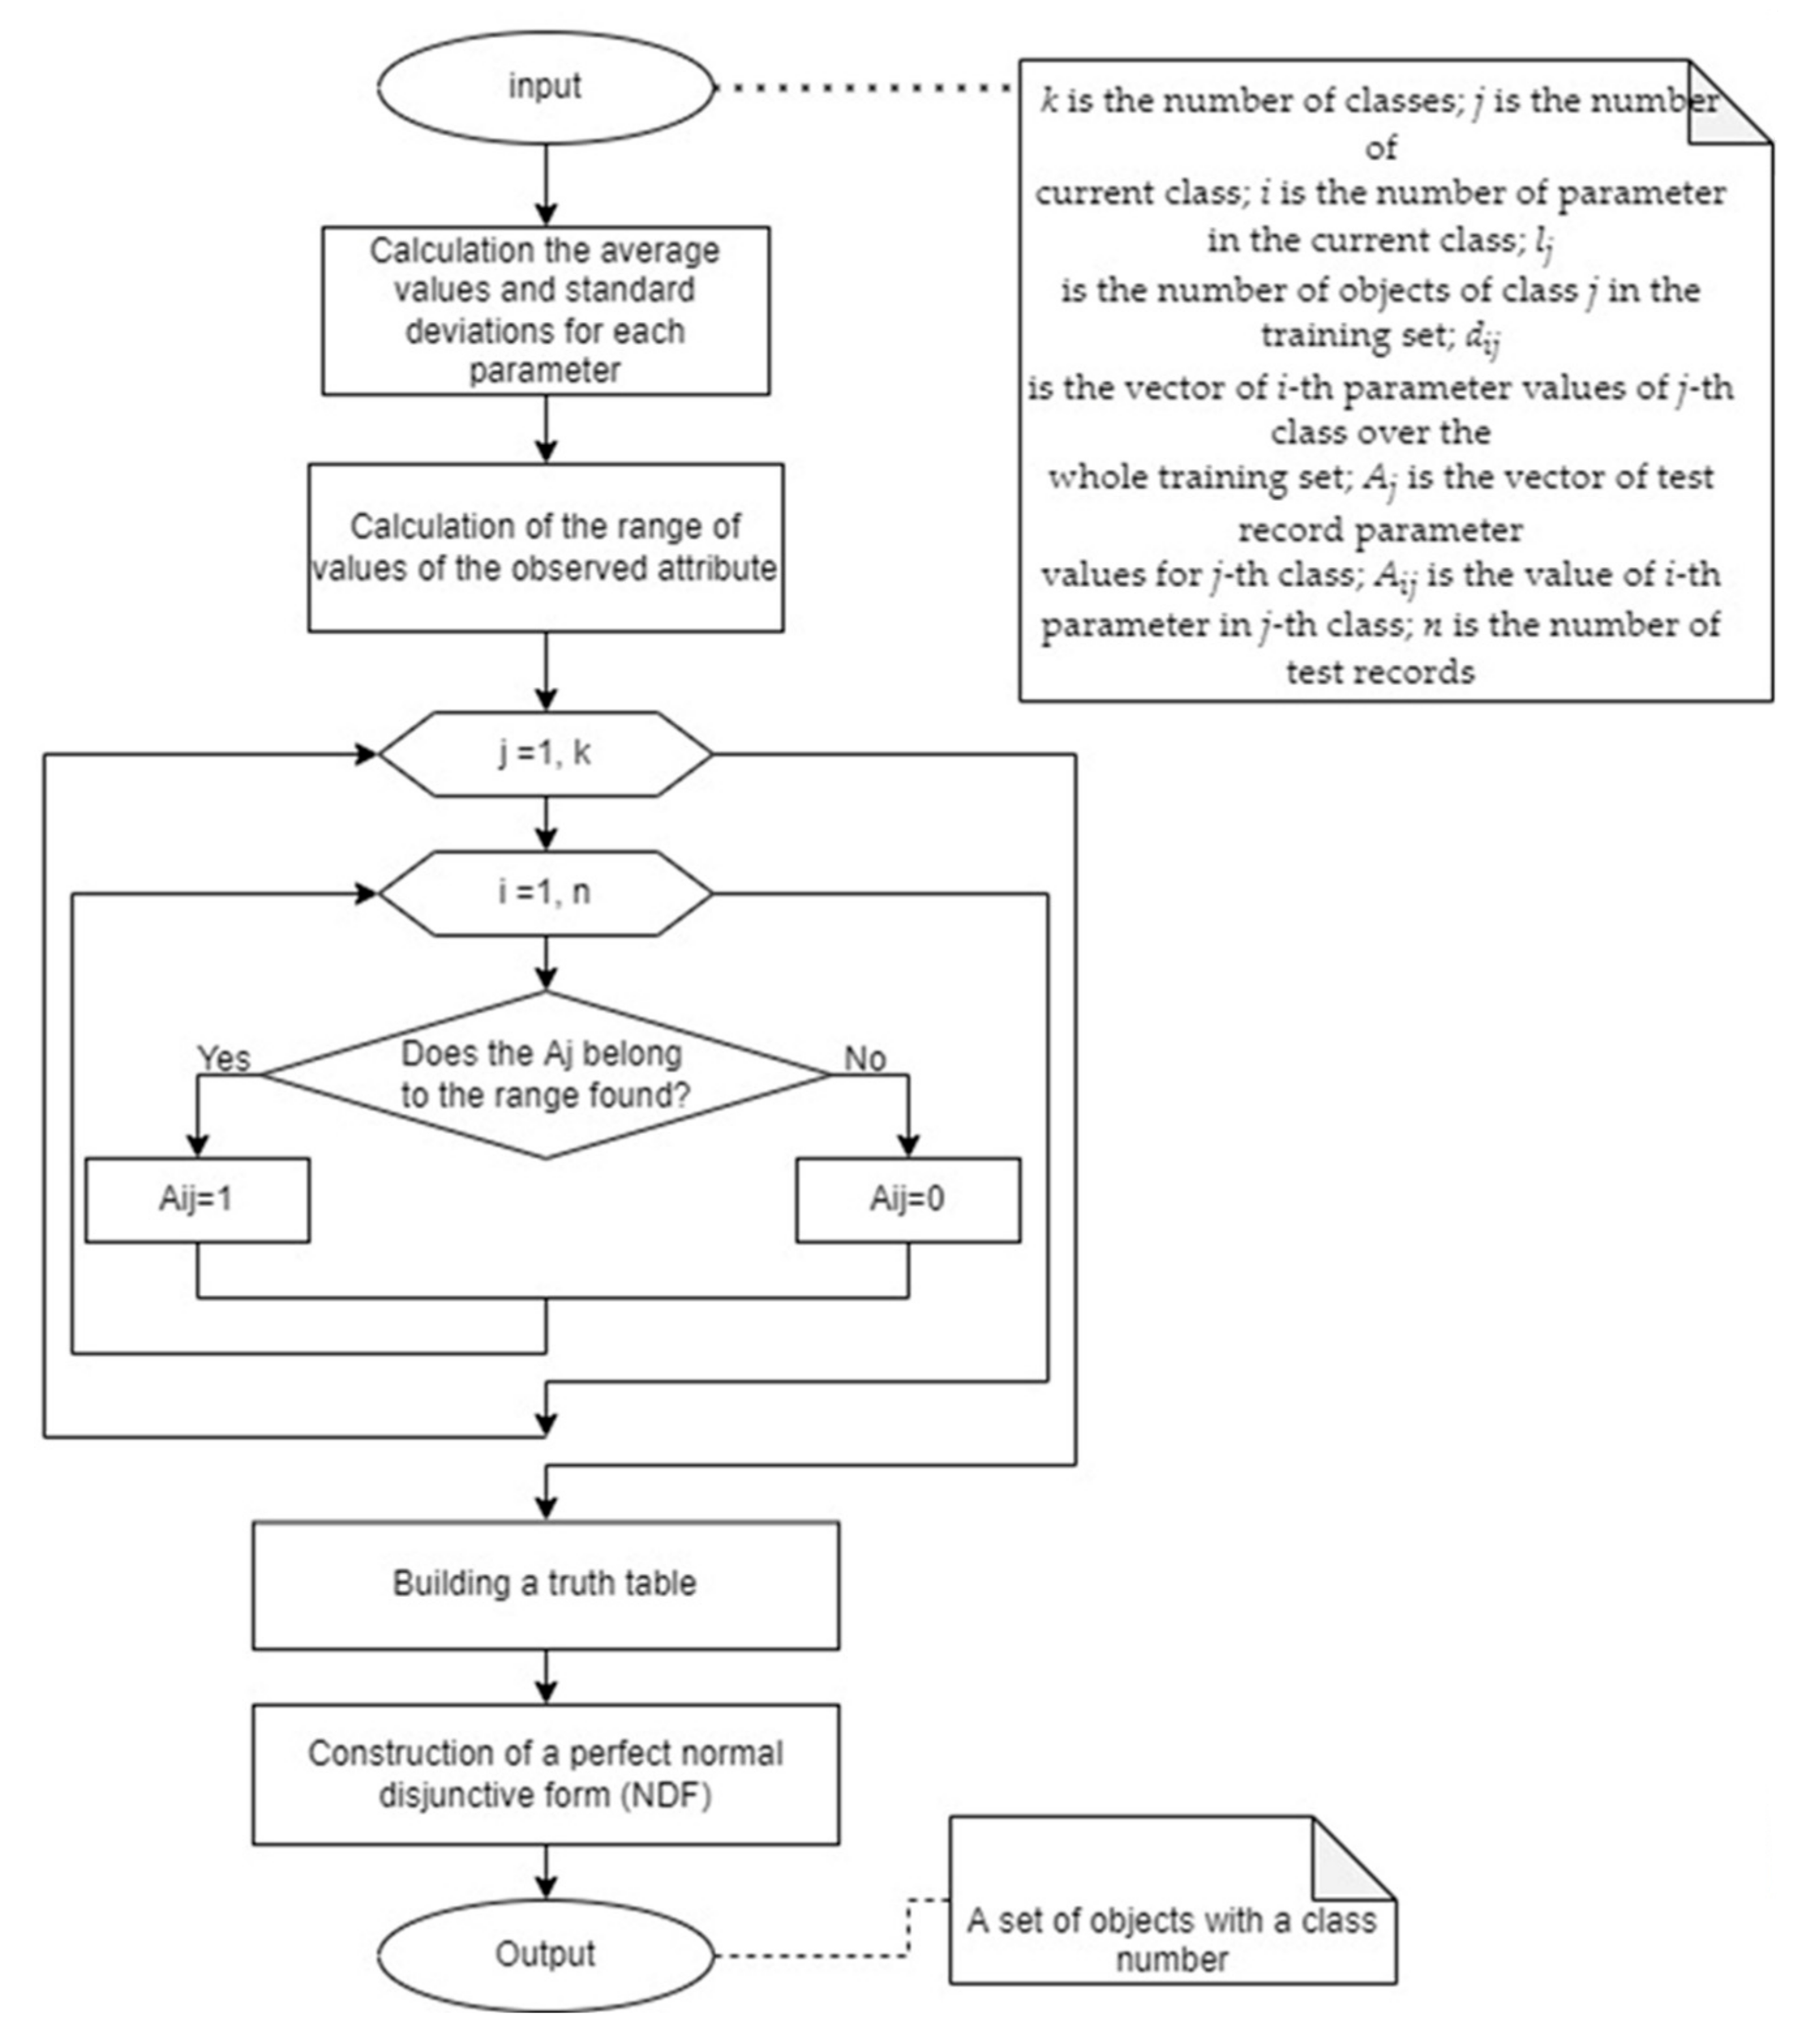
3.2. Classification Based on Boolean Logic

Boolean-based classification consists of constructing a logical function for each class in order to determine its membership. This classification method is suitable only for data that already have class labels. The following steps are required to build the desired function:
1.
Divide the whole set into sub-sets for each of the N classes.
2.
Calculate average values, SD, and value ranges for each parameter, for each of N classes (Section 2).
3.
Construct tables of “0” and “1” based on values falling within the ranges found (Section 2).
4.
Construct a truth table based on the number of parameters. Write “1” to the values of the functions (for each class a different function) on those rows of the table which correspond to the rows from the obtained tables of item 3, not taking into account the duplicates.
5.
Construct a perfect normal disjunctive form (NDF) using the truth table obtained.
Figure 2 shows a flowchart of the method.
Improvement of method.
When checking whether an object belongs to a given class, it is also possible to apply fuzzy logic as in the method based only on mathematical statistics and described above. In this case, in the formula of the perfect normal disjunctive form before each parameter, the degree of membership will appear as a multiplier:
C l a s s = j = 1 r i = 1 m μ x i B i
where m is the number of parameters and r is the number of conjunctions obtained from the truth table.

4. Input Data for Testing Methods

The input data for testing the methods for determining the significant parameters and solving the classification problem on their basis are represented by two different sets. The first set contains the records of four users (A, B, C, and D) about the keyboard operation on a mobile phone. For each record, there are five parameters: typing speed, % deletions, accuracy of hitting keys, number of T9, and user ID. This set contains 80 records, 76 of which are training records and the rest are test records. Some of the training data from this set are shown in Table 1. The test data are shown in Table 2.
The second set contains records of patients, some of whom have heart disease and some of whom do not. The data set is taken from the social network of data processing and machine learning specialists Kaggle [24]. Each record has the following parameters: age, sex, type of chest pain (four values), resting blood pressure, serum cholesterol in mg/dL, fasting blood sugar, resting ECG results (value of 0, 1, or 2), achieved maximum heart rate, etc. There is also information for each entry about whether the patient has a heart condition (0 or 1). The set consists of 303 records. For classification purposes, this set was divided into a ratio of 90% and 10% into training records and test records, respectively. An example of such data is presented in Table 3.
The test was repeated 25 times on both samples. The following are the averaged results and the results of one test are shown as an example.

5. Testing the Classification Approach Based on Mathematical Statistics

In this section, the results of testing two methods of object classification are considered.

5.1. Testing on the Mobile Phone Data Set

For the first set, the average values, SD, and value ranges for each individual were calculated. Table 4 shows the obtained mean values, SD, and value ranges, respectively. Table 5 shows the results obtained by the first method.
The results obtained using fuzzy logic and trapezoidal identity function for each interval are shown in Table 6.
The probability of a record belonging to a certain class is calculated by the following formula: P(x) = 1/m, where m is the number of elements equal to the maximum value of parameters. Table 7 uses this formula to calculate the probability of belonging to class C for record number 3.
Table 7 shows an example of the weight calculation for parameter A. Table 8 shows the found weights (probabilities) for each parameter of each class.
Table 9 shows the results obtained after using the weights.
According to the results obtained, we can confidently say that all the test records belonged to class C. The advantages of the method with two improvements were its simplicity and the relatively short time needed to calculate the necessary parameters. The disadvantages included the possible problem of classifying two or more objects with the same values (number of units or sum of products). This problem did not arise in this set. In addition, as with any other classification algorithm, prediction accuracy depended strongly on the amount of training data. On this set, the prediction accuracy was 100%.

5.2. Testing an Approach Based on a Set of Heart Disease Data

For the second set, the same steps as for the first set were performed. Table 10 shows the obtained value ranges, respectively.
Table 11 shows the found weights (probabilities) for each parameter of each class.
As there are a lot of training data, Table 12 and Table 13 show only part of the results obtained.
The accuracy of the results obtained after the method improvements was 90% and 77% without improvements. The results confirm that the application of fuzzy logic methods and the addition of weights could improve the quality of classification.
The confusion matrix of the results for a given data set after applying the method with improvement is shown in Figure 3.
According to this matrix, the main indicators were calculated as follows:
A c c u r a n c y = T P + T N T P + T N + F P + F N = 27 30 = 0.9
P r e c i s i o n = T P T P + F P = 16 17 = 0.94
F s c o r e = T P T P + F N = 16 18 = 0.89
The calculated values show the high accuracy and efficiency of the method.
To evaluate the quality of the proposed method and its improvement, we compared the results of its work with the known methods k-means and k-medoids, since the number of classes in our case is known in advance and is equal to 4 for the first test set and 2 for the second. The results of the methods are shown in the Table 14.
The results confirm the quality of the methods and their application to the classification of objects.

5.3. Testing an Approach Based on Boolean Logic

This method applies only to the first set of data. For example, the normal form for class C looks like this:
C l a s s C = X ¯ 1   X ¯ 2 X ¯ 3   X ¯ 4   V   X ¯ 1   X ¯ 2   X 3   X 4   V   X 1   X 2   X ¯ 3   X 4   V   X 1   X 2   X 3   X 4
The result of the classification of test data using these functions is presented in Table 15.
According to the results, it is possible to conclude that all records belong to class C. This has its own disadvantages:
  • Too cumbersome notation of the resulting function with a large number of parameters, and a quadratic dependence of the size of the truth table, which with a large enough number of parameters (such as images) can occupy a lot of memory.
  • If in the first method under uncertainty the result can be obtained that the object with different probability belongs to three or more classes, in this method, it is always only one or two classes.
The advantage of this method is that it is always possible to tell why an object belongs to a given class. For example, object 2 belongs to class C because it has a low typing speed, high accuracy of hitting keys, frequent use of T9, and rare erasing. Object 3 belongs to class C because it has a high typing speed and this parameter defines everything. The set of explanations for this will be limited. However, these explanations are more significant than just the presence of the fact of hitting the interval.

6. Conclusions

As a result of the study, the task of classifying objects of two different sets by methods of mathematical statistics and boolean logic with fuzzy logic was solved, and the accuracy of the obtained solutions was compared. For classification using two methods on the basis of mathematical statistics, on the first set of data accuracy for prediction was 100% in both cases, and on the second set was 90% and 77%.
The method based on boolean logic showed a higher accuracy for the first data set. However, as the parameters in the set grow and the amount of data grow, the formula for determining the object to a certain class will become very complicated and most likely show a decreasing quality. This requires additional research in the future.
These results indicate the possibility of using these methods in practice, but it should be understood that the results are highly dependent on the amount of input data. When classifying with boolean-based methods, it is possible to explain more precisely on the basis of which parameters a decision is made. Explanation is achieved by the fact that it is possible not just to say which parameters with what probability influenced the decision, but also which parameters’ absence influenced the decision. This can be important, for example, in the diagnosis of Parkinson’s disease, when according to medical methodology, some parameters must be present and three specific parameters must be absent in order to rule out another disease.

Author Contributions

Conceptualization, methodology, and formal analysis, Y.S.; project administration and writing—review and editing, F.R.; software, validation, formal analysis, original draft preparation, and visualization, M.P. All authors have read and agreed to the published version of the manuscript.

Funding

This research was funded by the “Development program of ETU “LETI” within the framework of the program of strategic academic leadership” Priority-2030 No 075-15-2021-1318 on 29 September 2021.

Institutional Review Board Statement

Not applicable.

Informed Consent Statement

Not applicable.

Data Availability Statement

Data available upon request.

Acknowledgments

Not applicable.

Conflicts of Interest

The authors declare that they have no known competing financial interest or personal relationships that could have appeared to influence the work reported in this paper.

References

  1. Zhu, M.; He, T.; Lee, C. Technologies toward next generation human machine interfaces: From machine learning enhanced tactile sensing to neuromorphic sensory systems. Appl. Phys. Rev. 2020, 7, 031305. [Google Scholar] [CrossRef]
  2. Classification Problem. Available online: https://wiki.loginom.ru/articles/classification-problem.html (accessed on 19 December 2021).
  3. Horn, W. AI in medicine on its way from knowledge-intensive to data-intensive systems. Artif. Intell. Med. 2001, 23, 5–12. [Google Scholar] [CrossRef]
  4. Blasiak, A.; Khong, J.; Kee, T. CURATE.AI: Optimizing Personalized Medicine with Artificial Intelligence. SLAS Technol. 2020, 25, 95–105. [Google Scholar] [CrossRef] [PubMed]
  5. Jimenez, F.; Martinez, C.; Marzano, E.; Palma, J.; Sanchez, G.; Sciavicco, G. Multi-objective evolutionary feature selection for fuzzy classification. IEEE Trans. Fuzzy Syst. 2019, 27, 1085–1099. [Google Scholar] [CrossRef]
  6. Guzman, J.C.; Miramontes, I.; Melin, P.; Prado-Arechiga, G. Optimal genetic design of type-1 and interval type-2 fuzzy systems for blood pressure level classification. Axioms 2019, 8, 8. [Google Scholar] [CrossRef] [Green Version]
  7. Yang, Y.; Hu, J.; Liu, Y.; Chen, X. Doctor Recommendation Based on an Intuitionistic Normal Cloud Model Considering Patient Preferences. Cogn. Comput. 2020, 12, 460–478. [Google Scholar]
  8. Castillo, O.; Cervantes, L.; Soria, J.; Sanchez, M.; Castro, J.R. A Generalized Type-2 Fuzzy Granular Approach with Applications to Aerospace. Inf. Sci. 2016, 354, 165–177. [Google Scholar] [CrossRef]
  9. Ontiveros-Robles, E.; Melin, P.; Castillo, O. Comparative analysis of noise robustness of type 2 fuzzy logic controllers. Kybernetika 2018, 54, 175–201. [Google Scholar] [CrossRef] [Green Version]
  10. Yang, Y.; Hu, J.; Sun, R.; Chen, X. Medical tourism estinations prioritization using group decision making method with neutrosophic fuzzy preference relations. Sci. Iran. 2018, 25, 3744–3764. [Google Scholar] [CrossRef] [Green Version]
  11. Cazarez-Castro, N.R.; Aguilar, L.T.; Castillo, O. Designing Type-1 and Type-2 Fuzzy Logic Controllers via Fuzzy Lyapunov Synthesis for nonsmooth mechanical systems. Eng. Appl. Artif. Intell. 2012, 25, 971–979. [Google Scholar] [CrossRef]
  12. Liang, X.; Teng, F.; Sun, Y. Multiple Group Decision Making for Selecting Emergency Alternatives: A Novel Method Based on the LDWPA Operator and LD-MABAC. Int. J. Environ. Res. Public Health 2020, 17, 2945. [Google Scholar] [CrossRef] [PubMed]
  13. Ekong, B.; Ifiok, I.; Udoeka, I.; Anamfiok, J. Integrated Fuzzy based Decision Support System for the Management of Human Disease. Int. J. Adv. Comput. Sci. Appl. 2020, 11, 1–7. [Google Scholar] [CrossRef]
  14. Hu, J.; Chen, P.; Yang, Y. An Interval Type-2 Fuzzy Similarity-Based MABAC Approach for Patient-Centered Care. Mathematics 2019, 7, 140. [Google Scholar] [CrossRef] [Green Version]
  15. Benchara, F.; Youssfi, M. A New Distributed Type-2 Fuzzy Logic Method for Efficient Data Science Models of Medical Informatics. Adv. Fuzzy Syst. 2020, 2020, 6539123. [Google Scholar] [CrossRef]
  16. Apostolopoulos, I.D.; Groumpos, P.P.; Apostolopoulos, D.J. Advanced fuzzy cognitive maps: State-space and rule-based methodology for coronary artery disease detection. Biomed. Phys. Eng. Express 2021, 7, 045007. [Google Scholar] [CrossRef] [PubMed]
  17. Shichkina, Y.; Irishina, Y.; Stanevich, E.; Salgueiro, A. The main aspects of creating a system of data mining on the status of patients with Parkinson’s disease. Procedia Comput. Sci. 2021, 186, 161–168. [Google Scholar] [CrossRef]
  18. Giordani, P.; Perna, S.; Bianchi, A.; Pizzulli, A.; Tripodi, S.; Matricardi, P. A study of longitudinal mobile health data through fuzzy clustering methods for functional data: The case of allergic rhinoconjunctivitis in childhood. PLoS ONE 2020, 15, e0242197. [Google Scholar] [CrossRef] [PubMed]
  19. Kostarev, S.N.; Tatarnikova, N.A.; Kochetova, O.V.; Sereda, T.G. Development of a sequence automaton for recognition of deviations indicators in diagnosis of natural systems. In Proceedings of the Publishing IOP Conference Series: Earth and Environmental Science, IV International Scientific Conference: AGRITECH-IV-2020: Agribusiness, Environmental Engineering and Biotechnologies, Krasnoyarsk, Russian, 8–20 November 2020. [Google Scholar]
  20. Wolf, B.; Slate, E.; Hill, E. Ordinal Logic Regression: A classifier for discovering combinations of binary markers for ordinal outcomes. Comput. Stat. Data Anal. 2015, 82, 152–163. [Google Scholar] [CrossRef] [Green Version]
  21. Jung, H.; Leem, S. Fuzzy set-based generalized multifactor dimensionality reduction analysis of gene-gene interactions. In Proceedings of the 28th International Conference on Genome Informatics: Medical Genomics, Berlin, Germany, 20 April 2018. [Google Scholar] [CrossRef]
  22. Bellavia, A.; Rotem, R.; Dickerson, A.; Hansen, J. The Use of Logic Regression in Epidemiologic Studies to Investigate Multiple Binary Exposures: An Example of Occupation History and Amyotrophic Lateral Sclerosis. Epidemiol. Methods 2020, 9, 20190032. [Google Scholar] [CrossRef] [PubMed]
  23. Castro, F.; Nebot, A.; Mugica, F. On the extraction of decision support rules from fuzzy predictive models. Appl. Soft Comput. 2011, 11, 3463–3475. [Google Scholar] [CrossRef]
  24. Heart Disease UCI. Available online: https://www.kaggle.com/ (accessed on 20 May 2021).
Figure 1. Flowchart of the method of classification by means of mathematical statistics (with improvements).
Mathematics 10 01133 g001
Figure 2. Flowchart of the method of classification based on boolean logic (with improvements).
Mathematics 10 01133 g002
Figure 3. The confusion matrix of the results.
Mathematics 10 01133 g003
Table 1. Training data of the first set.
Speed of TypingDeletion RateAccuracy of Key HittingNumber T9Class
11585632A
11916212B
11695937A
111165434D
113176040D
12468535B
127178590C
114186444D
128198895C
12468636B
1272510095D
12578838B
115196949D
116197252D
11796139A
Table 2. Test data of the first set.
Speed of TypingDeletion RateAccuracy of Key HittingNumber T9Class
123107069C
120128666C
124810093C
127128973C
Table 3. Second set of data.
AgeSexCpTrestbpsCholFbsRestecgThalachExangOldpeakSlopeCaThalTarget
63131452331015002.300011
37121302500118703.500021
56111202360117800.802021
57001203540116310.602021
57101401920114800.401011
56011402940015301.301021
44111202630117300.002031
52121781991116200.502031
57121501680117401.602021
54101402390116001.202021
48111302660117100.602021
64131102110014411.801021
Table 4. Average values (AV), standard deviations (SD), and values ranges (VR).
ClassSpeed of TypingDeletion RateAccuracy of KEY HittingNumber T9
AVSDVRAVSDVRAVSDVRAVSDVR
A2.384119.611(117.227–121.995)0.8339.833(9–10.666)6.45569(62.545–75.455)8.04348.611(40.568–56.654)
B2.071123.1(121.029–125.171)2.0715.10(3.029–7.717)9.61580.55(70.935–90.165)9.93530.70(20.765–40.635)
C4.011123.263(119.252–127.274)6.78310.789(4.006–17.572)14.56770.10(55.533–84.667)20.43271.684(51.252–92.116)
D3.776117.947(114.171–121.723)6.78319.947(13.164–26.73)12.5979.263(66.673–91.853)14.74560.053(45.308–74.798)
Table 5. Results obtained by the first method.
Record NumberNumber of UnitsOutput
ABCD
12242C
21233C with a probability of 0.5 or D with a probability of 0.5
30220B with a probability of 0.5 or C with a probability of 0.5
40131C
Table 6. The results obtained by improving method 2.
Record NumberNumber of UnitsOutput
ABCD
12242C
21242C
30220B with a probability of 0.5 or C with a probability of 0.5
40131C
Table 7. Example of weight calculation for parameter A.
Class A
Speed of TypingDeletion RateAccuracy of Key HittingNumber T9
0000
0100
0100
0111
1111
1111
1111
1111
55%72%66%66%
Table 8. Weights in all parameters of the four classes.
ClassSpeed of TypingDeletion RateAccuracy of Key HittingNumber T9
A55%72%66%66%
B70%70%70%70%
C63%100%63%68%
D63%63%63%68%
Table 9. The result obtained by improving method 1.
Record NumberNumber of UnitsOutput
ABCD
10.3450.350.64250.3275C
200.350.64250.3275C
300.1750.32750.25C
400.1750.4850.3275C
Table 10. Range of values.
ClassBorderAgeSexCpTrestbpsCholFbsRestecgThalachExangOldpeakSlopeCaThal
0bottom48.60.43−0.4115.5205−0.208−0.118115.70.010.2810.60.1451.9
0upper64.31.201.4153.43020.5200.970162.11.012.8871.72.2653.2
1bottom42.80.080.4113.4186.5−0.2080.060139.1−0.20−0.2090.99−0.5121.6
1upper61.81.072.4145.5295.40.5131.080178.20.501.3772.21.2012.6
Table 11. Weights of parameters.
ClassAgeSexCpTrestbpsCholFbsRestecgThalachExangOldpeakSlopeCaThal
00.6800.8200.8280.7210.6970.8440.5980.6640.5160.6230.6640.5410.934
10.6230.5760.6620.6890.7620.8480.5560.7090.8540.8150.9470.9210.775
Table 12. Part of the results obtained without improvements.
Record NumberThe Sum of the Products of WeightsOutput
01
1860
28101
36111
410111
51370
6970
7940
Table 13. Part of the results obtained after improvements.
Record NumberThe Sum of the Products of WeightsOutput
01
10.4430.3290
20.4580.5991
30.3730.6501
40.5750.6381
50.7020.3960
60.4970.4000
70.4470.2340
Table 14. Results of the comparison of methods.
The Proposed MethodImproving the Method by Adding WeightsImproving the Method by Applying Fuzzy Logick-Meansk-Medoids
Data set 10.75110.751
Data set 20.90.770.910.890.91
Table 15. The result of a normal form.
Record NumberThe Result of a Normal FormOutput
ABCD
10010C
20010C
30010C
40010C
Publisher’s Note: MDPI stays neutral with regard to jurisdictional claims in published maps and institutional affiliations.

