All articles published by MDPI are made immediately available worldwide under an open access license. No special
permission is required to reuse all or part of the article published by MDPI, including figures and tables. For
articles published under an open access Creative Common CC BY license, any part of the article may be reused without
permission provided that the original article is clearly cited. For more information, please refer to
https://www.mdpi.com/openaccess.
Feature papers represent the most advanced research with significant potential for high impact in the field. A Feature
Paper should be a substantial original Article that involves several techniques or approaches, provides an outlook for
future research directions and describes possible research applications.
Feature papers are submitted upon individual invitation or recommendation by the scientific editors and must receive
positive feedback from the reviewers.
Editor’s Choice articles are based on recommendations by the scientific editors of MDPI journals from around the world.
Editors select a small number of articles recently published in the journal that they believe will be particularly
interesting to readers, or important in the respective research area. The aim is to provide a snapshot of some of the
most exciting work published in the various research areas of the journal.
This paper explores the effectiveness of parallel stylometric document embeddings in solving the authorship attribution task by testing a novel approach on literary texts in 7 different languages, totaling in 7051 unique 10,000-token chunks from 700 PoS and lemma annotated documents. We used these documents to produce four document embedding models using Stylo R package (word-based, lemma-based, PoS-trigrams-based, and PoS-mask-based) and one document embedding model using mBERT for each of the seven languages. We created further derivations of these embeddings in the form of average, product, minimum, maximum, and norm of these document embedding matrices and tested them both including and excluding the mBERT-based document embeddings for each language. Finally, we trained several perceptrons on the portions of the dataset in order to procure adequate weights for a weighted combination approach. We tested standalone (two baselines) and composite embeddings for classification accuracy, precision, recall, weighted-average, and macro-averaged -score, compared them with one another and have found that for each language most of our composition methods outperform the baselines (with a couple of methods outperforming all baselines for all languages), with or without mBERT inputs, which are found to have no significant positive impact on the results of our methods.
Distant reading is a paradigm that involves the use of computational methods to analyze large collections of literary texts, aiming to complement the methods primarily used in the studies of theory and history of literature. The term was first mentioned by Moretti [1], when he proposed the use of quantitative text analysis methods in literary studies, pointing to their usefulness in the exploration of big text collections “at a distance” or looking at particular features within the texts. He argued this would help in the discovery of new information and patterns in corpora more objectively and enable scholars to learn more about the texts even without reading them in detail. The methodological novelty of his proposal lies in the use of text samples, statistics, metadata paratexts, and other features that were not commonly used in the study of literature until then.
Authorship analysis is a natural language processing (NLP) task that studies the characteristics of a text to extract information about its author. It is divided into three sub-tasks: author profiling, authorship verification, and authorship attribution. Author profiling is used to detect sociolinguistic attributes (e.g., gender or age), authorship verification is used to determine whether a certain person could have authored a given text, and authorship attribution assigns the text to the most likely author from a closed set of potential writers [2]. Authorship attribution (AA) is sometimes further divided into closed-set attribution, where the list of suspects necessarily includes the true author and open-set attribution, where the true author is not guaranteed to be represented in the list of suspects. AA methods are used in computational literary studies, resolving historical questions of unclear or disputed authorship [3], plagiarism detection (e.g., essays, research papers, and PhD thesis [4]), forensic investigations [5], and cyber-security (e.g., for author detection in case of threatening or harassing e-mails that were sent anonymously or under a pseudonym and social media analysis [6]).
Early methods drew primarily from linguistics and mathematics, with the earliest studies dating back to the 19th century and manual calculations of word frequencies, with one of the earliest works of the AA including successful authorship identification of particular works of Shakespeare [7] and of articles from the famous Federalist Papers set [8]. The field, however, started to develop rapidly with the introduction of computers and modern algorithms of machine learning. Up to date, the most extensive overview of the methods and their applications to specific problems is Stamatatos’s 2009 survey [9] and the comparison of methods provided by Jockers and Witten [10].
As examples of quantitative text analysis, methods of AA are naturally in line with the distant reading paradigm. While contemporary research varies in the type of features and algorithms, all have roots in observation that grammatical words are strong predictors of style and author [8] especially those occupying the top of the frequency list (following Zipf’s law). Another method that revolutionized the field was Burrows’s Delta [11] (later perfected by Evert et al. [12,13]), which allowed for calculating differences between profiles of feature frequencies in a more balanced way than the one provided by Euclidean distances.
1.1. Stylometry
Both distant reading and AA belong to a broader theoretical framework of stylometry. Specifically, stylometry is a method of statistical analysis of texts, and it is applied, among other things, to distinguish between authorial literary styles. For each individual author, there is an assumption that he/she exhibits a distinct style of writing [14]. This fundamental notion makes it possible to use stylometric methodology to differentiate between documents written by different authors and solve the AA task [15].
Performance of particular stylometric methods strongly depends on the choice of language features as the relevant style-markers. The determination of which features are the best to use for particular tasks and how they should be ordered has been a subject of many debates over the years. The earliest approaches relied solely on words, and examined differences in their use for particular authors [7], or general differences using lists of most frequent words (MFW) [11]. Further studies experimented with various types of features, with discussions on whether words should be lemmatized [14,16,17].
Evert et al. [13] discussed AA based on distance measures, different performance of diverse distance measures, and normalization strategies, as well as specificity for language families. Instead of relying on a specified number of MFW, they identified a set of discriminant words by using the method of recursive feature elimination. By repeatedly training a support vector classifier and pruning the least important ones, they obtained a minimal set of features for optimal performance. The resulting set contained function words and not so common content words. Eder and Byszuk [18] also experimented with changing the order of MFW on the list of used features and its influence on the accuracy of classification, confirming that the most discriminative features do not necessarily overlap with the MFW. Among the non-word approaches, most attempts were made using chunks of subsequent letters (so called character n-grams) [19], or grammatical features.
Weerasinghe and Greenstadt [20] used the following textual features: character n-grams: (TF-IDF values for character n-grams, where ), PoS tag n-grams (TF-IDF value of PoS tag trigrams), special characters (TF-IDF values for 31 pre-defined special characters), frequencies of function words (179 NLTK stopwords), number of characters and tokens in the document, average number of characters per word, per document, distribution of word-lengths (1–10), vocabulary richness, PoS tag chunks, and noun and verb phrase construction. For each document pair, they extracted stylometric features from the documents and used the absolute difference between the feature vectors as input to the classifier. They built a logistic regression model trained on a small dataset, and a neural network based model trained on the large dataset.
One of the most interesting and recent proposals was made by Camps et al. [3], who attempted stylometric analysis of medieval vernacular texts, noting that the scribal variation and errors introduced over the centuries complicate the investigations. To counter this textual variance, they developed a workflow combining handwritten text recognition and stylometric analysis performed using a variety of lexical and grammatical features to the study of a corpus of hagiographic works, examining potential authorial groupings in a vastly anonymous corpus.
Despite the overall good performance of these various approaches, MFW still proved to be most effective in discrimination between authors. Popular tools for conducting stylometric analyses like Stylo R package [21] are still suggesting the use of word tokens, or word or character n-grams, while also supporting further deviations from classic MFW.
Apart from the above shallow text representations, often referred to as a bag-of-words models, recent studies in AA are also exploring context-aware representations, or features that take into account contextual information, usually extracted using neural networks.
Kocher and Savoy [22] proposed two new AA classifiers using distributed language representation, where the nearby context of each word in a document was used to create a vector-space representation for either authors or texts, and cosine similarities between these representations were used for authorship-based classification. The evaluations using the k-nearest neighbors (k-NNs) on four test collections indicated good performance of that method, which in some cases outperformed even the state-of-the-art methods. Salami and Momtazi [23] proposed a poetry AA model based on recurrent convolutions neural networks, which captured temporal and spatial features using either a poem or a single verse as an input. This model was shown to significantly outperform other state-of-the-art models.
Segarra et al. [24] used the normalized word adjacency networks as relational structures data between function words as stylometric information for AA. These networks express grammatical relationships between words but do not carry lexical meaning on their own. For long profiles with more than 60,000 words, they achieve high attribution accuracy even when distinguishing between a large number of authors, and also achieve reasonable rates for short texts (i.e., newspaper articles), if the number of possible authors is small. Similarly, Marinho et al. [25] presented another study that focuses on solving the AA task using complex networks, but by focusing on network subgraphs (motifs) as features to identify different authors.
Finally, state-of-the-art stylometry is also exploring a combination of several representations. Such a setup is usually referred to as parallel architecture. Arguably, the use of a heterogeneous classifier that combines independent classifiers with different approaches usually outperforms the ones obtained using a single classifier [26,27]. Segarra et al. [24] also showed that word adjacency networks and frequencies capture different stylometric aspects and that their combination can halve the error rate of existing methods.
1.2. Multilingual BERT in Authorship Attribution
Multilingual BERT (mBERT) is a 12 layer transformer (768 hidden units, 12 heads, and 110 million parameters), trained on the Wikipedia pages of 104 languages with a shared word piece vocabulary [28]. While corpora used varied in size between languages, up-sampling of words from low resource languages and down-sampling words from high resource languages was performed during the pre-training in order to equalize their representations, so no difference in results for different languages should be apparent when using the model.
Though it was shown that the information captured by this model can be used for various NLP tasks [29], few attempts were made to use it to tackle the problem of AA. Fabien et al. [30] present an approach based on the fine-tuning of this model for author classification. They evaluate the impact of adding stylometric and hybrid features in an ensemble approach and find improvement over state-of-the-art approaches on standardized tests. Iyer [29] focuses on training a random forest classifier on top of mBERT outputs to try and detect changes in style, without the additional fine-tuning of the model, and achieves good results on a short text AA task. These experiments were our motivation to use this model to create document embeddings for our research and combine them with other stylometric-based document embeddings in pursue of better results.
1.3. Research Questions, Aims, Means, and Novelty
Authorship attribution (as well as authorship verification) inevitably involves pairwise comparison of documents written by different authors, in order to determine the degree of similarity between them. A convenient way of presenting the final similarities is a symmetric matrix usually referred to as a distance matrix or a document embedding matrix. In the present study, document embedding matrices for each feature type and across each language collection will be used to perform classification benchmarks. Furthermore, our parallel architectures approach will rely on these embedding matrices, as they will be combined using different averaging strategies. This paper is focused on four research questions revolving around the efficiency of particular document embedding methods in solving the authorship attribution task:
RQ1
There is no single best document representation method suitable for the AA task across European languages;
RQ2
Several document embeddings can be combined in order to produce improved results for the said task;
RQ3
Adding weights to the inputs in a parallel architecture can induce further improvements of the results;
RQ4
Including deep learning-based transformations of the document in a parallel architecture can improve the results of the said architecture.
The general workflow used in this study involves the following steps:
Producing document embedding matrices for each standalone document representation and testing them against each other in AA for seven European languages. These representations include: the original document, a lemmatized document, a document where all tokens are substituted by their Universal PoS tags, and finally a document in which the words with most frequent PoS tags are masked by their respective tags;
Combining the standalone results document embedding matrices—on a matrix level into new composition-based embeddings, using five different methods, and testing them against one another in the same aforementioned test;
Creating perceptrons that use the said embeddings as inputs and training them for authorship verification on a chunk of our dataset in order to procure suitable weights for each representation in a composite architecture. The results are to be a set of weights for each language, and a set of weights trained without each language in order to avoid bias;
Test the acquired weights for mutual euclidean distances to find suitable language pairs and use transfer learning to generate and test weight-based embeddings for each of the seven languages;
Test the mBERT based-document embeddings as a standalone and include them in our new, composition-based embeddings using the aforementioned techniques. Compare the results of the embedding methods both with and without mBERT usage.
The main contributions of this paper are:
The introduction of new datasets. Four different document representations of 7051 10,000-token chunks from 700 novels written in 7 languages, as well as more then 130 different document embeddings of these chunks, which will be available as material for further research;
A novel approach to solve the AA task, combining document representations on embeddings level after the distance calculation for standalone methods, rather than the usual inline combination of features before distance calculation;
An architecture for training the weights for each document embeddings using a single perceptron with several document distances as inputs and a single distance as output;
Trained weights of different document representations for seven different languages as well as weights trained in a multilingual setting;
Evaluation of the proposed standalone and combination methods.
The second section of this paper will present the text collection that was used for this research and the main dataset preparation. The third section is related to the research workflow and describes the creation of all necessary document embeddings. The fourth section will describe the evaluation process and present the quantitative and qualitative results obtained, followed by the Discussion and Concluding remarks, together with plans for future research.
2. Dataset
The COST Action “Distant Reading for European Literary History” (https://www.distant-reading.net, accessed on 29 January 2022) coordinates the creation of a multilingual European Literary Text Collection (ELTeC) [31]. This resource will be used to establish best practices and develop innovative methods of Distant Reading for the multiple European literary traditions. Its core will contain at least 10 linguistically annotated 100 novels sub-collections comparable in their internal structure in at least 10 different European languages, totaling at least 1000 annotated full-text novels. The extended ELTeC will take the total number of full-text novels to at least 2500.
In order to create representative sub-collections for the corresponding languages, the novels were selected to evenly represent (1) novels of various sizes: short (10–50,000 words), medium (50–100,000 words), and long (more than 100,000 words); (2) four 20-year time periods T1 [1840–1859], T2 [1860–1879], T3 [1880–1899], T4 [1900–1920]; (3) the number of reprints, as a measure of canonicity (novels known to wider audience and completely forgotten), and (4) female and male authors [32].
This multiple encoding levels are provided in the ELTeC scheme: at level–0, only the bare minimum of markup is permitted, while at level–1 a slightly richer encoding is defined. At level–2, additional information is introduced to support various linguistic processing, with mandatory being part of speech (PoS) tags, named entities and lemmas.
In its current version, the ELTeC contains comparable corpora for 17 European languages, with each intended to be a balanced sample of 100 novels from the period 1840 to 1920. The current total number of novels is 1355 (104,084,631 words), with 10 languages reaching a collection of 100 encoded in level–1: Czech, German, English, French, Hungarian, Polish, Portuguese, Romanian, Slovenian, and Serbian. The current state in ELTeC corpus building can be seen in a github overview web page (https://distantreading.github.io/ELTeC, accessed on 29 January 2022). The action is set to finish by the end of April of 2022, so more novels are expected to be added. Each novel is supported by metadata concerning their production and reception, aiming to become a reliable basis for comparative work in data-driven textual analysis [31]. All novels and transformation scripts and available on GitHub for browse and download, and more curated versions are published periodically on Zenodo (https://zenodo.org/communities/eltec, accessed on 29 January 2022). ELTeC sub-collections and their derivations are already being used, for example in TXM (https://txm.gitpages.huma-num.fr/textometrie, accessed on 29 January 2022), SketchEngine [33,34], or for word embedding development.
The level–2 ELTeC collection currently contains 7 sub-collections of 100 novels for the following languages: German, English, French, Hungarian, Portuguese, Slovenian, and Serbian (as of December 2021). For the research in this paper, we used these 700 novels, since in this iteration each token is supplied with lemma and PoS tag as required for the experiment. The second column of Table 1 presents the number of words per language sub-collection, totaling in 58,061,996 for these 7 languages, while the third column contains the number of tokens, totaling in 73,692,461.
For the purpose of this experiment, we produced four document representations for each novel, each in the form of vertical texts, consisting of: (1) words (as in vertical original text of the novel), (2) lemmas (as in vertical lemmatized text), (3) PoS tags (each token in verticalized text is replaced by its PoS tag) and (4) masked text, where tokens were substituted with PoS tag for following PoS tags: ADJ, NOUNS, NPROP, ADV, VERB, AUX, NUM, SYM, X, for PoS tags: DET and PRON tokens are substituted with lemma, while others: ADP, CCONJ, INTJ, PART, PUNCT, SCONJ remained unchanged, as inspired by [35].
Keeping in mind the remarkable variation in size of the novels within and across particular language collections, we applied chunking. Relaying on results presented in [36] and the well-known phenomenon: attribution effectiveness grows with the number of words analyzed, and at a certain point it tends to stabilize or slightly decrease [37]. After a few calibrating experiments with different sizes of chunks, we chose the 10,000 token sample size as the most representative. Each novel was split into chunks of exactly 10,000 tokens, with the last, shorter chunk, being excluded. This resulted in a dataset consisting of 28,204 chunks (documents)—7051 chunks per each of the 4 aforementioned document representations. Table 1 also presents the number of chunks for each language sub-collection. The produced dataset was used as the base for all further processing in this research, with each language collection considered separately.
3. Workflow
In this section we will explore the generation of all the 19 different word embedding types we envisioned. Firstly, we created five baseline, standalone embeddings: four based on stylometry, and one based on a deep-learning language model (Figure 1). Based on those, we derived 10 more using 5 simple combination techniques, and, finally, 4 more using weight-based linear combinations.
3.1. Stylo-Based Document Embeddings
When preparing document embeddings based on our document representations, we opted for the aforementioned Stylo R package in a manner depicted in the Figure 2. From a list of documents we produced a document embedding matrix containing stylometric distances between these documents grouped by the document representation from which they were derived. For calculating document similarities (distances), Stylo uses frequencies of n most frequent words as features. Since our documents were already tokenized and divided into chunks of equal size, the remaining task was to calculate the specific frequencies. In order to produce a satisfying number of candidates for frequency tables, we used trigrams for chunks containing PoS tags and bigrams for chunks containing PoS-masked words. For these chunks we picked top 300 and 500 features, while for the original and lemmatized chunks we picked the 800 most frequent features.
For each representation, we calculated the cosine delta distance (also known as Würzburg distance) [12] between each two chunks regarding the previously obtained frequency tables. Distances were put together in symmetric, hollow matrices , in which every cell , represents distances between documents and k is the number of documents for specific language. Thus,
where and * denotes a numerical distance.
These four matrices, , , and , produced for each of the seven languages, are used to convey document embeddings grouped by a document representation method. Each one contains mutual document distances for the same set of documents with distances differing between matrices as they were obtained using different representations of the same documents.
3.2. mBERT-Based Document Embeddings
As we were testing the use of mBERT embeddings without fine-tuning, like in the aforementioned paper [29], and since the source code of that solution is publicly available, we adapted it to fit the needs of this research. The complete process of generating a document embeddings matrix for each of the seven language using mBERT is shown in Figure 3, with a list of documents resulting in a matrix containing stylometric distances between them.
In the first step, each document was split into sentences using several regular expressions. Since mBERT requires each sentence to have 512 tokens or less, longer sentences were trimmed. Sentences were tokenized using Google AI’s BERT tokenizer [28] with 110k shared WordPiece vocabulary (provided by the mBERT authors). The model assigns each token in a sentence with a word embedding. Those are then summed into sentence tensors of the same length. All sentence tensors in each document are averaged into a single tensor, which is used as a document representation.
If there are k documents, then there will be k document tensors, . Using cosine similarity between vector pairs we get distances between documents represented by those vectors , , with the final product being the document embedding matrix:
where , .
We produced one document-embedding matrix for each language and added them to the ones previously obtained through Stylo R to be used as the main resource of this experiment.
3.3. Simple Composition-Based Document Embeddings
Each document embeddings matrix, , , , and , was tested individually, but we also engaged in their simple composition in pursuit of better classification results. The goal was to create new, composed, document embeddings using the ones already available. Five methods were used to generate elements of composed embeddings matrices . The motivation for the selection of these particular five methods was the choice of functions for which the domain is a vector space, and the co-domain is a set of real numbers, such as average, minimum, maximum, norm, or the product of coordinates of a vector. The goal was to produce a single scalar distance from an array of distances obtained for the same pair of documents, where each distance is obtained via a different method and is located in a separate document embedding matrix.
A matrix composed of particular document embeddings matrices is defined as follows. Assume there are n matrices, , , respectively,
Matrix is a composed matrix of matrices ,
where each element , can be generated using a different method m as:
Since we wanted to test the effectiveness of inclusion of mBERT-based document embeddings into the composite environment, we generated two classes of composed-embeddings matrices. Using the procedure described above, they are
where m is one of methods described in Equation (5), and represents inclusion of matrix into the environment. Ultimately, one class of matrices (, , , and ) is produced without mBERT embeddings using Equation (6), and the other (, , , and ) with mBERT embeddings using Equation (7), resulting in 10 new composite document embedding matrices for each language, all with the same shape and size as the previously cratered ones (, , , and ), only with possibly different distance values.
Apart from the above simple ways of combining the matrices , , , and into composition-based document embeddings, we also considered weighting the input matrices during the combination step, assuming that the weights are to be determined empirically. The motivation is, firstly, that particular features might influence parallel architectures to a different extent and, secondly, the importance of particular features might depend on the language. In our approach, a resulting composition-based matrix is a linear combination of the matrices , , and (and ), each of them multiplied by a respective weight.
Let there be n matrices as in Equation (3), and each is tied to a supposed specific weight . Then, each element (distance) of the weighted composed matrix can be generated by using a specific element of each of n matrices separately and combining it with an appropriate weight using an expansion of the array’s mean, namely the weighted arithmetic mean. Thus:
where,
In order to determine the appropriate weights for the matrices , , , and , we opted to use a single perceptron artificial neural network with the number of inputs matching the number of matrices that we want to procure weights for (either 4 or 5 depending on whether mBERT input is used) and an output layer with a single node to ensure the number of weights trained matched the number of inputs.
Since a single output node was devised for the training, the perceptron was trained on authorship verification rather than attribution task, with a single output optimized to be closer to 1 if two documents are of the same author and closer to 0 if the two documents are of different authors (Figure 4). For the sake of training simplicity, and since we used cosine distances in our input document embedding matrices, all distances were converted to similarities, using Equation (11) before input, and reverted to distances afterwards using Equation (12) in order to match the other, previously created embeddings for easier evaluation,
Adam optimizer [38] with standard initial learning rate of 0.01 was used to train all of the perceptrons used in this research. The number of inputs with the desired output of 0 was truncated to the number of inputs with desired output of 1 in order to avoid author verification bias, and the distances between the documents that belong to the same novel were excluded from the training. The number of inputs for each training was afterwards truncated to 6384, which was the size of the available set for the smallest dataset, in order to avoid language bias in a multilingual setting. These inputs and outputs were split into training and validation sets in a 9:1 ratio, and the batch sizes were fixed at 64. The final epoch number was set to 356 according to other parameters and several training inspections. During these inspections what we were looking for specifically was the average number of epochs across languages before the validation error rate trend changes from descending to ascending, indicating over-fitting. Once the training of the perceptrons was completed, the model was used to predict the final weights as shown in Figure 5. The weights were then used to solve the Equation (9). It has to be emphasized that using the procured weights for any method satisfies in the Equation (10), because the weights were normalized to sum up to 1. The normalized weights are presented in Table 2.
A total of 28 perceptrons were trained, 14 not using the mBERT (upper) and 14 using the mBERT inputs (bottom half of Table 2). Out of those 14, 7 were trained on inputs from each language respectively (labeled and , with being the acronym of the language used for the training) and 7 were trained on multilingual inputs, each excluding a different language (labeled and in Table 2, with being the acronym of the excluded language).
Using the obtained weights and previously created document embedding matrices, we generated four new ones for each language using Equation (9). In order to avoid any bias problem, two strategies were employed. The first strategy was to, for each language, use universal weights where that language was excluded from their training e.g., applying universal_excl_deu weights on German (deu). Thus, from Equations (9) and (10) we derived:
for and for . We used these two formulas to generate two document embeddings based on universally trained weights, one without and one with the use of mBERT based embeddings.
Our second strategy was to involve direct transfer-learning and produce weight-based embeddings using the weights trained on a different language dataset, as another way to avoid the training-testing bias. Suitable weights to compute the document embedding matrix for a given language were selected through comparison of Euclidean distances of the trained weights for all languages. Results of these comparisons are presented in Table 3 (distances were calculated separately for perceptrons without and with mBERT input, presented in the upper and bottom half of the table, respectively).
Two new embeddings were generated for each language based on the nearest Euclidean neighbor in trained weights. For example, Serbian (srp) embeddings were calculated with French fra) weights (without mBERT) and with Hungarian (hun) weights (with mBERT) input, as shown via the bold values in Table 3 upper and lower part, respectively. Thus, based on Equations (9) and (10), we derived:
for and for and being the nearest Euclidean neighbor, minding distances of trained weights presented in Table 3.
4. Results
The results reported in this section rely on the following supervised classification setup. The evaluation was carried out for each of the 19 document embeddings (4 from Section 3.1, 1 from Section 3.2, 10 from Section 3.3, and 4 from Section 3.4) computed for each of the 7 languages, totaling in 133 evaluated document embeddings. Only the authors represented by at least two novels were chosen for the evaluation subset, in order to achieve a closed-set attribution scenario. All of their chunks (documents) were evaluated against all the other documents, excluding the ones originating from the same novel, in order to avoid easy hits.
Each resulting subset from the original document embeddings matrix contained pairwise comparisons (distances) between the selected documents and classification was thus performed by identifying the minimal distance for each document, which is equivalent to using the k-NN classifier with . If a document’s nearest neighbour originates from another novel of the same author, it is considered a hit. In this section, we will report the overall performance for each document embeddings matrix via accuracy, precision, recall, weighted-average -score, and macro-averaged -score, as well as the statistical significance of the procured results. It should be noted that due to the nature of our test, where the domain of possible authors outnumbers the domain of expected authors, the macro-averaged -score reflects the potential domain reduction, where the methods that predict fewer authors tend to have higher scores.
4.1. Baseline
As already mentioned, using the most frequent words as features has been the primary method of solving AA tasks for many decades. Therefore, we marked the word-based embeddings results as our primary baseline (baseline 1), while looking for improvements in accuracy and in weighted-averaged -score across all the remaining embeddings.
Recently, however, for some highly-inflected languages, most frequent lemmas emerged as a better alternative to most frequent words [39]. The PoS tags and the document representation with masked words, where PoS labels are used to mask predefined set of PoS classes, also achieved good results for specific problems [35]. In evaluation of this experiment we used the following document representations: most frequent words, lemmas, PoS trigrams, and PoS-masked bigrams (, , and ), as the secondary baseline methods. Specifically, we used the best performing method (from the above list) for each language as a respective secondary baseline (baseline 2).
4.2. Quantitative Results
Obtained accuracy and weighted-average scores for each language inspected and each embedding produced, are shown in Table 4 and Table 5, with the upper five embeddings representing the methods from which the baseline scores were derived. We looked at the correlation between these metrics (grouped by language) and calculated the average Pearson correlation coefficient of 0.9971 using Equation (17),
where n is the sample size, , are the individual data points indexed with i, (the sample mean) and analogously for . Given a very high correlation between the two measures of performance, we decided to focus on one of these (i.e., accuracy) in the further presentation.
The complete results for all metrics used in the evaluation (accuracy, precision, recall, weighted and macro-averaged -score) for each language and embedding method are shown in the Appendix ATable A1, Table A2, Table A3, Table A4, Table A5, Table A6 and Table A7.
The total improvement of each composite method over the primary and secondary baseline scores is shown in percentages in Table 6, followed by its visual representation in Figure 6, a heat map of the accuracy improvement of each composite methods over the primary (left) and the secondary (right) baseline, for each language inspected.
The effect of using mBERT embeddings in a composite environment is shown in Table 7, and it is calculated as a percentual difference of accuracy scores between the respective composition-based methods from the Table 4, with the results omitted from the table if equal to 0. Visual representation of the impact is depicted in the form of a heat map in Figure 7, grouped by composition method and language. The left side of the heat map visualizes data from Table 7 with yellow meaning low, green meaning high, and white meaning no improvement, and depicts cases in which the inclusion of mBERT improved the results. The right side of the heat map visualizes negated values from Table 7 with the same color codes, and depicts cases where the exclusion of mBERT improved the results.
4.3. Qualitative Results
The improvement of our composite method over the baseline for French (0.8347 vs. 0.7561) is remarkable and could not be due to mere chance. However, we cannot be equally sure in other cases. Even if the improvements are clearly noticeable, we cannot ascertain their statistical significance by simple eyeballing. In order to check the integrity of the quantitative results, then, we analyzed confusion matrices of the best performing (in terms of -score and accuracy) baseline methods and best-performing overall methods for each of the seven languages. In each case, we used the Newcombe-Wilson continuity-corrected test [40], which is designed to test the significance between proportions of events.
Our comparisons show that the improvement over the primary baseline is statistically significant in the case of deu (), fra (), por (), slv (), and srp (), at the conventional level of significance . In the case of both eng and hun, the improvement over the baseline cannot be considered statistically significant. The explanation is rather straightforward for hun, since the baseline accuracy is already very high (0.9812), leaving little room for improvement. Chances are that the gain would have been more noticeable if our Hungarian dataset had contained novels more challenging for authorship discrimination. The behaviour of eng is more difficult to explain, but we assume it is related to its low-inflection, which diminishes the information gap between words and lemmas and its strict word-order, which diminishes the effect of the POS-based document representations.
If we apply the same testing procedure in relation to the secondary baseline—which records the most efficient standalone method for each language—a similar picture emerges. The improvement over such a more demanding baseline is statistically significant for deu (), fra (), por (), and srp (), at the level of significance . As previously, eng () and hun () exhibited no significance. Additionally, the improvement against the secondary baseline in slv () cannot be considered significant anymore, and this is due to the very large divergence between the performance of words and the performance of lemmas in slv (0.7245 and 0.8113, respectively). Such a difference between two similar types of features has no simple explanation, but it inevitably made the winning type of features (i.e., the product of all the matrices) less impressive for slo.
5. Discussion
According to the accuracy scores presented in Table 4, the best scores for the baseline methods were divided mostly among word-based and lemma-based embeddings. Word-based embeddings performed best for fra (0.7561), hun (0.9812), and srp (0.7279), while lemma-based embeddings performed best for deu (0.9212), eng (0.8351) and slv (0.7729) for accuracy. PoS-mask-based embeddings were best-performing only for por (0.8113) and PoS-based embeddings matched the best accuracy score for srp (0.7279). These findings undoubtedly answer RQ1:
RQ1:
There is no single best document representation method suitable for the AA task across European languages.
with all but mBERT-based embeddings marking the baseline for at least one language.
From the accuracy score improvement presented in the Table 6 (upper part) and its visualization in Figure 6, it can be observed that most of our composite embeddings ( being a clear outlier) outperform the primary baseline for most of the assessed languages, with four methods improving accuracy for all languages both with and without mBERT inputs. As for the more strict secondary baseline (represented by the best base method accuracy for each language), the improvements are presented in Table 6 (lower part). Our composition-based methods outperform this baseline by 10.4% for fra, 9.91% for srp, 8.37% for por, 3.64% for deu, 2.43% for slv, 1.6% for hun, and 0.84% for eng using the respective top-performing methods. Using the Newcombe-Wilson continuity-corrected test, we prove the statistical significance of these results for at least four languages (fra, srp, por and deu), while the improvements are present but debatable for the rest. In the case of hun, it should be noted that the baseline was already at 0.9812 and, considering this, our method actually reduced the error rate by 83% (from 0.0188 to 0.0031), which is an outstanding improvement. As for slv, the statistical significance of improvement was corroborated only against the primary baseline. With a definite improvement for at least four languages, these findings answer RQ2:
RQ2:
Several document embeddings can be combined in order to produce improved results for the said task.
showing that they can indeed be used together in order to produce improved results for the said task, and that this method outperforms the established baseline for most languages. This is particularly significant given previous attempts at using lemmas and PoS as features, described in the Introduction, which presented them as worse classifiers than most frequent words.
The results of our weight-based combination methods, as presented in Table 6 and Figure 6, demonstrate that adding weights to the inputs in a parallel architecture can induce further improvements of the results.
The – method, based on training weights on one and then applying them to distances from another language in a linear composition, was found to be the best performing solution for four out of seven languages (deu, eng, fra, and slv), and it matched the best solution for one language (hun). It was only outperformed by other compositions for two languages (por and srp), where the best performing method was found to be -based simple composition. Note, however, that for srp the difference between the method and the – method was neglectable (0.8000 vs. 0.7967). With an average improvement of 4.47% across all languages (Figure 8), – was found to be the best performing composition method, giving the answer to RQ3:
RQ3:
Adding weights to the inputs in a parallel architecture can induce further improvements of the results.
Data from Table 7, as visualized in Figure 7, show that in a few cases the achievement was gained by including deep learning-based transformations of the document in a parallel architecture, with up to 2.19% for accuracy for slv in over . These results address RQ4,:
RQ4:
Including deep learning-based transformations of the document in a parallel architecture can improve the results of the said architecture.
however, most of these improvements are statistically insignificant and it is apparent that for the majority of the methods there was no improvement in using mBERT. Moreover, the results deteriorate when mBERT’s embeddings are composed with other methods, which is most likely due to the model not being trained nor fine-tuned on this task [41,42].
It should also be noted that distances between documents produced by calculating cosine similarity over mBERT outputs were by far lower (average of 0.0085) than the ones produced by Stylo R package (average of 0.9998). This resulted in them being completely ignored by the composition method, and consequently made the results for and identical. For the same reasons, the distances produced by mBERT were picked for the method every time, which resulted in being equal to (Table 4). Arguably, this explains why the method never outperforms the baseline. A similar behaviour can be observed for the - method, where the final distance was squared. This leads to even smaller values and thus exponentially decreases the impact of mBERT on the final distance (resulting in equal results for - and -). The same remark applies to the method, except that here the impact decreases linearly rather than exponentially, which resulted in nearly identical results for and , as shown in Table 7 and Figure 7. With the exception of the method, the only opportunity for the mBERT embeddings to actually influence the composite matrices were, firstly, the -based simple composition, where the distance was multiplied by the product of all the other distances and, secondly, the weight-based methods, where the distance was multiplied by its optimized weight. In the case of the method, it was shown that it negatively impacts the accuracy in six out of seven languages with a decrease of up to 8.63% (Table 7). As for the weight-based embeddings, the results are split, with some methods using the mBERT inputs outperforming the ones not using it. However, it must be noted that the weights of the mBERT inputs were set to low negative (gravitating around −0.045) during the training of all the 14 perceptrons using them, thus diminishing their impact on the final scores.
A summary of the improvements is presented in Figure 8, where the best performing composition methods were selected. The bar stands for the average percentual increase of accuracy scores of the six methods across all seven languages, while the points stand for the gain for each method and for each distinct language. It can be seen that the -, with an average improvement of 3.8%, is the best performing simple composition method. This is a valuable observation for AA tasks relying on limited resources, since the aggregation of simple features does not involve external language models (e.g., mBERT or trained weights), and requires less execution time. However, is the best performing method overall with 4.471% average improvement. This is also the only method achieving improvements for each of our scrutinized languages.
The benefits of this research mainly result from the use of a multilingual dataset, as this marks an effort to verify methods using multiple languages, including ones that are somewhat under-researched, particularly when it comes to stylometric applications (i.e., Hungarian, Serbian, Slovenian). Examining such a number of languages at a time provides us with a rare opportunity to generalize our findings. Using such diverse, yet similarly designed, corpora was possible thanks to the international COST Action, in which the authors actively participate, and which led to the creation of comparable representative corpora of European literature. This study further advances the Action’s initiatives towards development of distant reading methods and tools, and towards analysis of European literature at the distance. The use of multilingual corpora allowed us to conduct transfer learning through document embeddings for one language, using the weights trained on other languages’ datasets. The reasonable performance of the above method is in line with the findings of another outcome of the Action [43], which found that different types of information combined together improved the performance of BERT-based direct speech classifier. Secondly, the use of ELTeC level–2 corpora, which contain rich grammatical annotation that is encoded in a way that facilitates cross-language comparisons, allowed us to use information about lemmas and PoS. By examining them both on their own, and in combined embeddings, we were able to determine that combined lexical and grammatical information outperforms traditional word-based approaches. Finally, the paper also contributes to the efforts of making artificial intelligence and neural network based stylometric endeavors more transparent. While mBERT-based classifications are largely obtained in a black-box manner, the use of a shallow neural network in calculating weights produces clear and interpretable values.
This research also brought one unexpected result in discovering one unknown author. Namely, the author of the novel Beogradske tajne (Belgrade’s secrets) in Serbian sub-collection has been unknown (according to the National and University libraries), but the computed distances suggested that the author is Todorović Pera. By further research, it was found that the same suspicion was raised by some historians.
Future research will, firstly, extend the application to other languages, as more text sub-collections are expected to be published within the same project. This would focus on the use of the best performing simple composition methods and the previously trained universal weights. Expanding the list of baseline methods with more different features (e.g., character n-grams, word length, punctuation frequency) and using them in further compositions, is also an obvious next step. We also expect that fine-tuning of mBERT for AA task should produce the expected results and allow for further investigations of RQ3, making it another area demanding further studies.
Another aspect we intend to test is the effect of document lengths on our proposed methods. Initial calibration tests, during which we settled with the fixed document length of 10,000 tokens, suggested an extended gap in accuracy scores of baseline and composition methods when dealing with shorter texts (2000 and 5000 tokens). We suspect that, since the baseline accuracy is lower when working with shorter texts, there is an increased possibility for improvement using the combination methods.
6. Conclusions
In this research, we tested standalone (word-based, lemma-based, PoS-based, and PoS mask-based) and composition-based embeddings (derived from the standalone ones using different methods of combining them on a matrix level, e.g., mean, product, norm of the matrices), compared them with one another, and found that for most of the examined languages most of our methods outperform the baseline. It is examined that our composition-based embeddings outperform the best baseline by a significant margin for four languages: German, French, Portuguese, and Serbian, and also bring a certain batch of improvements for Hungarian and Slovenian. Our transfer-learning-based method also outperformed the best baseline for every language, averaging in nearly 5% improvement. On the other hand, we found no statistically significant impact of the usage of out-of-the-box mBERT-based document representations on the performance of this composite models for this task. Based on all of the findings, we conclude that the combination of word, lemma, and PoS-based document representations can model the language to a greater extent than any of them alone, which is especially viable for languages where PoS-based embeddings carry enough information and for authorship attribution task.
Other benefits of our research include creating the multilingual document representations dataset (28,204 10,000-token documents), 133 literary document embeddings for 7 European languages and multilingually trained weights grouped by document representation and language, all of which can be used in future research in stylometry and natural language processing with an accent on the authorship attribution task.
Author Contributions
Conceptualization, M.Š. and R.S.; methodology, M.Š. and M.I.N.; software, M.Š.; validation, M.E., M.I.N. and M.Š.; formal analysis, M.Š.; investigation, J.B.; resources, R.S.; data curation, R.S.; writing—original draft preparation, M.Š.; writing—review and editing, all authors; visualization, M.Š.; supervision, R.S. and M.E.; project administration, J.B.; funding acquisition, J.B. All authors have read and agreed to the published version of the manuscript.
Funding
This research and work on the ELTeC corpora was performed in the framework of the project Distant Reading for European Literary History, COST (European Cooperation in Science and Technology) Action CA16204, with funding from the Horizon 2020 Framework Programme of the EU.
The authors thanks to numerous contributors to the ELTeC text collection, specially the members of the COST Action CA16204 Distant Reading for European Literary History: WG1 for preparing the text collections and WG2 for making the available annotated versions.
Conflicts of Interest
The authors declare no conflict of interest. The funders had no role in the design of the study; in the collection, analyses, or interpretation of data; in the writing of the manuscript, or in the decision to publish the results.
Abbreviations
The following abbreviations are used in this manuscript:
AA
Authorship Attribution
BERT
Bidirectional Encoder Representations from Transformers
Table A1.
Authorship attribution task evaluation metrics for German—deu.
Table A1.
Authorship attribution task evaluation metrics for German—deu.
Embedding Base
Accuracy
Precision
Recall
Weighted -Score
Macro -Score
bert
0.7129
0.8184
0.7129
0.7423
0.2582
word
0.9203
0.9790
0.9203
0.9387
0.4283
pos
0.8370
0.9154
0.8370
0.8611
0.3468
lemma
0.9212
0.9644
0.9212
0.9391
0.4815
masked_2
0.7346
0.8949
0.7346
0.7822
0.2979
mean
0.9420
0.9863
0.9420
0.9579
0.4915
mean_b
0.9420
0.9863
0.9420
0.9579
0.4915
max
0.9257
0.9781
0.9257
0.9436
0.4623
max_b
0.9257
0.9781
0.9257
0.9436
0.4623
min
0.8433
0.9215
0.8433
0.8679
0.3714
min_b
0.7129
0.8184
0.7129
0.7423
0.2582
product
0.9375
0.9826
0.9375
0.9529
0.4773
product_b
0.9058
0.9556
0.9058
0.9196
0.4609
l2-norm
0.9466
0.9856
0.9466
0.9604
0.5053
l2-norm_b
0.9466
0.9856
0.9466
0.9604
0.5053
weights_fra
0.9547
0.9871
0.9547
0.9660
0.5403
weights_fra_b
0.9538
0.9854
0.9538
0.9646
0.5520
weights_universal-deu
0.9475
0.9861
0.9475
0.9617
0.5387
weights_universal_b-deu
0.9484
0.9861
0.9484
0.9623
0.5571
Table A2.
Authorship attribution task evaluation metrics for English—eng.
Table A2.
Authorship attribution task evaluation metrics for English—eng.
Embedding Base
Accuracy
Precision
Recall
Weighted -Score
Macro -Score
bert
0.5561
0.6796
0.5561
0.5966
0.1134
word
0.8175
0.9482
0.8175
0.8588
0.2215
pos
0.6632
0.8415
0.6632
0.72
0.133
lemma
0.8351
0.9645
0.8351
0.8753
0.217
masked_2
0.6439
0.8261
0.6439
0.7017
0.1329
mean
0.8158
0.9244
0.8158
0.8484
0.2052
mean_b
0.8175
0.9248
0.8175
0.8493
0.2166
max
0.8298
0.9523
0.8298
0.8698
0.2047
max_b
0.8298
0.9523
0.8298
0.8698
0.2047
min
0.6649
0.8385
0.6649
0.7199
0.1329
min_b
0.5561
0.6796
0.5561
0.5966
0.1134
product
0.8035
0.9223
0.8035
0.8364
0.2031
product_b
0.7474
0.8679
0.7474
0.7734
0.1717
l2-norm
0.8193
0.9236
0.8193
0.8509
0.2232
l2-norm_b
0.8193
0.9236
0.8193
0.8509
0.2232
weights_slv
0.8421
0.9487
0.8421
0.8772
0.2419
weights_slv_b
0.8404
0.9519
0.8404
0.877
0.235
weights_universal-eng
0.8316
0.9451
0.8316
0.8658
0.2292
weights_universal_b-eng
0.8386
0.9464
0.8386
0.8735
0.2405
Table A3.
Authorship attribution task evaluation metrics for French—fra.
Table A3.
Authorship attribution task evaluation metrics for French—fra.
Embedding Base
Accuracy
Precision
Recall
Weighted -Score
Macro -Score
bert
0.4444
0.6286
0.4444
0.4912
0.1390
word
0.7561
0.8832
0.7561
0.7992
0.2927
pos
0.6125
0.7563
0.6125
0.6485
0.2210
lemma
0.7507
0.9025
0.7507
0.7951
0.2842
masked_2
0.7046
0.8886
0.7046
0.7718
0.2539
mean
0.8238
0.9272
0.8238
0.8551
0.3757
mean_b
0.8238
0.9278
0.8238
0.8551
0.3755
max
0.8049
0.9298
0.8049
0.8412
0.2938
max_b
0.8049
0.9298
0.8049
0.8412
0.2938
min
0.6341
0.7625
0.6341
0.6717
0.2422
min_b
0.4444
0.6286
0.4444
0.4912
0.1390
product
0.8157
0.9164
0.8157
0.8446
0.3711
product_b
0.7453
0.8677
0.7453
0.7848
0.2987
l2-norm
0.8293
0.9276
0.8293
0.8583
0.3882
l2-norm_b
0.8293
0.9276
0.8293
0.8583
0.3882
weights_slv
0.8347
0.9295
0.8347
0.8644
0.3943
weights_slv_b
0.8320
0.9294
0.8320
0.8630
0.3710
weights_universal-fra
0.8347
0.9295
0.8347
0.8644
0.3827
weights_universal_b-fra
0.8293
0.9269
0.8293
0.8602
0.3699
Table A4.
Authorship attribution task evaluation metrics for Hungarian—hun.
Table A4.
Authorship attribution task evaluation metrics for Hungarian—hun.
Embedding Base
Accuracy
Precision
Recall
Weighted -Score
Macro -Score
bert
0.6991
0.8204
0.6991
0.7403
0.2987
word
0.9812
1.0000
0.9812
0.9904
0.6423
pos
0.8088
0.9596
0.8088
0.8675
0.2905
lemma
0.9781
0.9909
0.9781
0.9840
0.7219
masked_2
0.9185
0.9822
0.9185
0.9433
0.4289
mean
0.9937
1.0000
0.9937
0.9968
0.8433
mean_b
0.9937
1.0000
0.9937
0.9968
0.8433
max
0.9906
1.0000
0.9906
0.9952
0.7834
max_b
0.9906
1.0000
0.9906
0.9952
0.7834
min
0.8150
0.9661
0.8150
0.8741
0.2860
min_b
0.6991
0.8204
0.6991
0.7403
0.2987
product
0.9875
1.0000
0.9875
0.9933
0.7791
product_b
0.9718
0.9887
0.9718
0.9789
0.8254
l2-norm
0.9969
1.0000
0.9969
0.9984
0.9157
l2-norm_b
0.9969
1.0000
0.9969
0.9984
0.9157
weights_srp
0.9969
1.0000
0.9969
0.9984
0.9157
weights_srp_b
0.9969
1.0000
0.9969
0.9984
0.9157
weights_universal-hun
0.9906
0.9970
0.9906
0.9937
0.8412
weights_universal_b-hun
0.9906
1.0000
0.9906
0.9952
0.7826
Table A5.
Authorship attribution task evaluation metrics for Portuguese—por.
Table A5.
Authorship attribution task evaluation metrics for Portuguese—por.
Embedding Base
Accuracy
Precision
Recall
Weighted -Score
Macro -Score
bert
0.5925
0.8853
0.5925
0.6510
0.1152
word
0.7245
0.9051
0.7245
0.7742
0.2112
pos
0.7509
0.9646
0.7509
0.8167
0.1709
lemma
0.8000
0.9688
0.8000
0.8588
0.2826
masked_2
0.8113
0.9752
0.8113
0.8705
0.2083
mean
0.8717
0.9861
0.8717
0.9163
0.3076
mean_b
0.8717
0.9861
0.8717
0.9163
0.3076
max
0.8226
0.9673
0.8226
0.8790
0.2778
max_b
0.8226
0.9673
0.8226
0.8790
0.2778
min
0.7547
0.9735
0.7547
0.8223
0.1724
min_b
0.5925
0.8853
0.5925
0.6510
0.1152
product
0.8792
0.9863
0.8792
0.9202
0.3333
product_b
0.8189
0.9572
0.8189
0.8672
0.2722
l2-norm
0.8717
0.9811
0.8717
0.9147
0.3493
l2-norm_b
0.8717
0.9811
0.8717
0.9147
0.3493
weights_slv
0.8415
0.9626
0.8415
0.8866
0.3250
weights_slv_b
0.8415
0.9593
0.8415
0.8851
0.3108
weights_universal-por
0.8151
0.9523
0.8151
0.8641
0.2920
weights_universal_b-por
0.8075
0.9473
0.8075
0.8566
0.2774
Table A6.
Authorship attribution task evaluation metrics for Slovenian—slv.
Table A6.
Authorship attribution task evaluation metrics for Slovenian—slv.
Embedding Base
Accuracy
Precision
Recall
Weighted -Score
Macro -Score
bert
0.5042
0.5991
0.5042
0.5170
0.2819
word
0.7188
0.8148
0.7188
0.7259
0.4221
pos
0.6958
0.7906
0.6958
0.7181
0.4226
lemma
0.7729
0.8530
0.7729
0.7860
0.5034
masked_2
0.7208
0.8093
0.7208
0.7377
0.4866
mean
0.7646
0.8603
0.7646
0.7771
0.5455
mean_b
0.7646
0.8603
0.7646
0.7771
0.5455
max
0.7854
0.8622
0.7854
0.7979
0.4819
max_b
0.7854
0.8622
0.7854
0.7979
0.4819
min
0.6979
0.7941
0.6979
0.7212
0.4363
min_b
0.5042
0.5991
0.5042
0.5170
0.2819
product
0.7625
0.8600
0.7625
0.7775
0.5482
product_b
0.7792
0.8657
0.7792
0.7947
0.4955
l2-norm
0.7646
0.8602
0.7646
0.7777
0.5455
l2-norm_b
0.7646
0.8602
0.7646
0.7777
0.5455
weights_eng
0.7854
0.8692
0.7854
0.7960
0.5411
weights_eng_b
0.7917
0.8600
0.7917
0.7988
0.4956
weights_universal-slv
0.7812
0.8743
0.7812
0.7934
0.5398
weights_universal_b-slv
0.7771
0.8668
0.7771
0.7878
0.5530
Table A7.
Authorship attribution task evaluation metrics for Serbian—spr.
Table A7.
Authorship attribution task evaluation metrics for Serbian—spr.
Embedding Base
Accuracy
Precision
Recall
Weighted -Score
Macro -Score
bert
0.4918
0.6537
0.4918
0.5226
0.2441
word
0.7279
0.8941
0.7279
0.7518
0.4200
pos
0.7279
0.8312
0.7279
0.7364
0.3765
lemma
0.7082
0.8973
0.7082
0.7414
0.3824
masked_2
0.7016
0.7880
0.7016
0.7140
0.3676
mean
0.7967
0.9692
0.7967
0.8120
0.5383
mean_b
0.8000
0.9692
0.8000
0.8174
0.5404
max
0.7541
0.8896
0.7541
0.7740
0.4676
max_b
0.7541
0.8896
0.7541
0.7740
0.4676
min
0.7344
0.8360
0.7344
0.7388
0.3888
min_b
0.4918
0.6537
0.4918
0.5226
0.2441
product
0.8000
0.9668
0.8000
0.8160
0.5389
product_b
0.7836
0.9406
0.7836
0.8042
0.4453
l2-norm
0.7869
0.9622
0.7869
0.8067
0.5310
l2-norm_b
0.7869
0.9622
0.7869
0.8067
0.5310
weights_fra
0.7967
0.9709
0.7967
0.8220
0.5331
weights_hun_b
0.7869
0.9428
0.7869
0.8036
0.5098
weights_universal-srp
0.7934
0.9655
0.7934
0.8169
0.5464
weights_universal_b-srp
0.7934
0.9673
0.7934
0.8181
0.5325
References
Moretti, F. Conjectures on World Literature. New Left Rev.2000, 1, 54–68. [Google Scholar]
El, S.E.M.; Kassou, I. Authorship analysis studies: A survey. Int. J. Comput. Appl.2014, 86, 22–29. [Google Scholar]
Camps, J.B.; Clérice, T.; Pinche, A. Stylometry for Noisy Medieval Data: Evaluating Paul Meyer’s Hagiographic Hypothesis. arXiv2020, arXiv:2012.03845. [Google Scholar]
Stamatatos, E.; Koppel, M. Plagiarism and authorship analysis: Introduction to the special issue. Lang. Resour. Eval.2011, 45, 1–4. [Google Scholar] [CrossRef] [Green Version]
Yang, M.; Chow, K.P. Authorship Attribution for Forensic Investigation with Thousands of Authors. In Proceedings of the ICT Systems Security and Privacy Protection; Cuppens-Boulahia, N., Cuppens, F., Jajodia, S., Abou El Kalam, A., Sans, T., Eds.; Springer: Berlin/Heidelberg, Germany, 2014; pp. 339–350. [Google Scholar]
Iqbal, F.; Binsalleeh, H.; Fung, B.C.; Debbabi, M. Mining writeprints from anonymous e-mails for forensic investigation. Digit. Investig.2010, 7, 56–64. [Google Scholar] [CrossRef] [Green Version]
Mosteller, F.; Wallace, D.L. Inference & Disputed Authorship: The Federalist; CSLI Publications: Stanford, CA, USA, 1964. [Google Scholar]
Stamatatos, E. A survey of modern authorship attribution methods. J. Am. Soc. Inf. Sci. Technol.2009, 60, 538–556. [Google Scholar] [CrossRef] [Green Version]
Jockers, M.L.; Witten, D.M. A comparative study of machine learning methods for authorship attribution. Lit. Linguist. Comput.2010, 25, 215–223. [Google Scholar] [CrossRef]
Burrows, J. ‘Delta’: A Measure of Stylistic Difference and a Guide to Likely Authorship. Lit. Linguist. Comput.2002, 17, 267–287. [Google Scholar] [CrossRef]
Evert, S.; Proisl, T.; Vitt, T.; Schöch, C.; Jannidis, F.; Pielström, S. Towards a better understanding of Burrows’s Delta in literary authorship attribution. In Proceedings of the Fourth Workshop on Computational Linguistics for Literature, Denver, CO, USA, 4 June 2015; pp. 79–88. [Google Scholar]
Evert, S.; Proisl, T.; Schöch, C.; Jannidis, F.; Pielström, S.; Vitt, T. Explaining Delta, or: How do distance measures for authorship attribution work? In Proceedings of the Corpus Linguistics 2015, Lancaster, UK,, 21–24 July 2015. [Google Scholar]
Kestemont, M. Function Words in Authorship Attribution. From Black Magic to Theory? In Proceedings of the 3rd Workshop on Computational Linguistics for Literature (CLfL@EACL), Gothenburg, Sweden, 27 April 2014; pp. 59–66. [Google Scholar]
Sarwar, R.; Li, Q.; Rakthanmanon, T.; Nutanong, S. A scalable framework for cross-lingual authorship identification. Inf. Sci.2018, 465, 323–339. [Google Scholar] [CrossRef]
Rybicki, J.; Eder, M. Deeper Delta across genres and languages: Do we really need the most frequent words? Lit. Linguist. Comput.2011, 26, 315–321. [Google Scholar] [CrossRef]
Górski, R.; Eder, M.; Rybicki, J. Stylistic fingerprints, POS tags and inflected languages: A case study in Polish. In Proceedings of the Qualico 2014: Book of Abstracts; Palacky University: Olomouc, Czech Republic, 2014; pp. 51–53. [Google Scholar]
Eder, M.; Byszuk, J. Feature selection in authorship attribution: Ordering the wordlist. In Digital Humanities 2019: Book of Abstracts; Utrecht University: Utrecht, The Netherlands, 2019; Chapter 0930; p. 1. [Google Scholar]
Kestemont, M.; Luyckx, K.; Daelemans, W. Intrinsic Plagiarism Detection Using Character Trigram Distance Scores—Notebook for PAN at CLEF 2011. In Proceedings of the CLEF 2011 Labs and Workshop, Notebook Papers, Amsterdam, The Netherlands, 19–22 September 2011. [Google Scholar]
Weerasinghe, J.; Greenstadt, R. Feature Vector Difference based Neural Network and Logistic Regression Models for Authorship Verification. In Proceedings of the Notebook for PAN at CLEF 2020, Thessaloniki, Greece, 22–25 September 2020; Volume 2695. [Google Scholar]
Eder, M.; Rybicki, J.; Kestemont, M. Stylometry with R: A package for computational text analysis. R J.2016, 8, 107–121. [Google Scholar] [CrossRef] [Green Version]
Kocher, M.; Savoy, J. Distributed language representation for authorship attribution. Digit. Scholarsh. Humanit.2018, 33, 425–441. [Google Scholar] [CrossRef]
Salami, D.; Momtazi, S. Recurrent convolutional neural networks for poet identification. Digit. Scholarsh. Humanit.2020, 36, 472–481. [Google Scholar] [CrossRef]
Segarra, S.; Eisen, M.; Ribeiro, A. Authorship Attribution Through Function Word Adjacency Networks. Trans. Sig. Proc.2015, 63, 5464–5478. [Google Scholar] [CrossRef] [Green Version]
Marinho, V.Q.; Hirst, G.; Amancio, D.R. Authorship Attribution via Network Motifs Identification. In Proceedings of the 2016 5th Brazilian Conference on Intelligent Systems (BRACIS), Recife, Brazil, 9–12 October 2016; pp. 355–360. [Google Scholar]
Stamatatos, E.; Daelemans, W.; Verhoeven, B.; Juola, P.; López-López, A.; Potthast, M.; Stein, B. Overview of the Author Identification Task at PAN 2014. CLEF (Work. Notes)2014, 1180, 877–897. [Google Scholar]
Akimushkin, C.; Amancio, D.R.; Oliveira, O.N. On the role of words in the network structure of texts: Application to authorship attribution. Phys. A Stat. Mech. Its Appl.2018, 495, 49–58. [Google Scholar] [CrossRef] [Green Version]
Devlin, J.; Chang, M.; Lee, K.; Toutanova, K. BERT: Pre-training of Deep Bidirectional Transformers for Language Understanding. arXiv2018, arXiv:1810.04805. [Google Scholar]
Iyer, A.; Vosoughi, S. Style Change Detection Using BERT—Notebook for PAN at CLEF 2020. In Proceedings of the CLEF 2020 Labs and Workshops, Notebook Papers, Thessaloniki, Greece, 22–25 September 2020; Cappellato, L., Eickhoff, C., Ferro, N., Névéol, A., Eds.; CEUR-WS: Aachen, Germany, 2020. [Google Scholar]
Fabien, M.; Villatoro-Tello, E.; Motlicek, P.; Parida, S. BertAA: BERT fine-tuning for Authorship Attribution. In Proceedings of the 17th International Conference on Natural Language Processing (ICON), Patna, India, 18–21 December 2020; NLP Association of India (NLPAI): Indian Institute of Technology Patna: Patna, India, 2020; pp. 127–137. [Google Scholar]
Burnard, L.; Schöch, C.; Odebrecht, C. In search of comity: TEI for distant reading. J. Text Encoding Initiat.2021, 2021, 1–21. [Google Scholar] [CrossRef]
Schöch, C.; Patras, R.; Erjavec, T.; Santos, D. Creating the European Literary Text Collection (ELTeC): Challenges and Perspectives. Mod. Lang. Open2021, 1, 25. [Google Scholar] [CrossRef]
Kilgarriff, A.; Rychly, P.; Smrz, P.; Tugwell, D. The Sketch Engine. In Proceedings of the Eleventh EURALEX International Congress, Lorient, France, 6–10 July 2004; pp. 105–116. [Google Scholar]
Kilgarriff, A.; Baisa, V.; Bušta, J.; Jakubíček, M.; Kovář, V.; Michelfeit, J.; Rychlỳ, P.; Suchomel, V. The Sketch Engine: Ten years on. Lexicography2014, 1, 7–36. [Google Scholar] [CrossRef] [Green Version]
Embarcadero-Ruiz, D.; Gómez-Adorno, H.; Embarcadero-Ruiz, A.; Sierra, G. Graph-Based Siamese Network for Authorship Verification. Mathematics2022, 10, 277. [Google Scholar] [CrossRef]
Eder, M. Does Size Matter? Authorship Attribution, Small Samples, Big Problem. In Digital Humanities 2010: Conference Abstracts; King’s College London: London, UK, 2010; pp. 132–134. [Google Scholar]
Eder, M. Style-markers in authorship attribution: A cross-language study of the authorial fingerprint. Stud. Pol. Linguist.2011, 6, 99–114. [Google Scholar]
Kingma, D.P.; Ba, J. Adam: A Method for Stochastic Optimization. In Proceedings of the 3rd International Conference on Learning Representations, ICLR 2015, San Diego, CA, USA, 7–9 May 2015; Conference Track, Proceedings. Bengio, Y., LeCun, Y., Eds.; International Conference on Representation Learning (ICLR): La Jolla, CA, USA, 2015; pp. 1–15. [Google Scholar]
Eder, M.; Piasecki, M.; Walkowiak, T. An open stylometric system based on multilevel text analysis. Cogn. Stud. Études Cognitives2017, 17, 1–26. [Google Scholar] [CrossRef] [Green Version]
Newcombe, R.G. Estimation for the difference between independent proportions: Comparison of eleven methods. Stat. Med.1998, 17, 873–890. [Google Scholar] [CrossRef]
Ehrmanntraut, A.; Hagen, T.; Konle, L.; Jannidis, F. Type-and Token-based Word Embeddings in the Digital Humanities. In Proceedings of the Conference on Computational Humanities Research 2021, Amsterdam, The Netherlands, 17–19 November 2021; Volume 2989, pp. 16–38. [Google Scholar]
Brunner, A.; Tu, N.D.T.; Weimer, L.; Jannidis, F. To BERT or not to BERT-Comparing Contextual Embeddings in a Deep Learning Architecture for the Automatic Recognition of four Types of Speech, Thought and Writing Representation. In Proceedings of the 5th Swiss Text Analytics Conference (SwissText) and 16th Conference on Natural Language Processing (KONVENS), Zurich, Switzerland, 23–25 June 2020; pp. 1–11. [Google Scholar]
Byszuk, J.; Woźniak, M.; Kestemont, M.; Leśniak, A.; Łukasik, W.; Šeļa, A.; Eder, M. Detecting Direct Speech in Multilingual Collection of 19th-Century Novels. In Proceedings of the LT4HALA 2020-1st Workshop on Language Technologies for Historical and Ancient Languages, Marseille, France, 11–16 May 2020; pp. 100–104. [Google Scholar]
Figure 1.
A flowchart depicting a path from the annotated novels to document embeddings using multilingual BERT and Stylo R package methods.
Figure 1.
A flowchart depicting a path from the annotated novels to document embeddings using multilingual BERT and Stylo R package methods.
Figure 2.
A flowchart describing a path from documents to document embeddings using Stylo R package, with N-gram transformation being applied only when generating non-unigram baseddocument representations.
Figure 2.
A flowchart describing a path from documents to document embeddings using Stylo R package, with N-gram transformation being applied only when generating non-unigram baseddocument representations.
Figure 3.
Flowchart describing the path from documents to document embeddings using mBERT.
Figure 3.
Flowchart describing the path from documents to document embeddings using mBERT.
Figure 4.
Visualisation of perceptron inputs and targeted outputs during the training phase—inputs for each iteration being distances between the same documents from four (or five) different embeddings and desired outputs of either 0 or 1.
Figure 4.
Visualisation of perceptron inputs and targeted outputs during the training phase—inputs for each iteration being distances between the same documents from four (or five) different embeddings and desired outputs of either 0 or 1.
Figure 5.
Visualisation of trained perceptron inputs and outputs—inputs being distances between the same documents from four (or five) different embeddings and the output being their new weighted-based scalar distance.
Figure 5.
Visualisation of trained perceptron inputs and outputs—inputs being distances between the same documents from four (or five) different embeddings and the output being their new weighted-based scalar distance.
Figure 6.
Heat map visualization representing the improvement of accuracy over primary (left) and secondary baseline (right) for each language, with yellow meaning low, green meaning high, and white meaning no improvement.
Figure 6.
Heat map visualization representing the improvement of accuracy over primary (left) and secondary baseline (right) for each language, with yellow meaning low, green meaning high, and white meaning no improvement.
Figure 7.
Heat map visualization representing the accuracy improvement in including mBERT inputs (left) and excluding them (right), with yellow meaning low, green meaning high, and white meaning no improvement.
Figure 7.
Heat map visualization representing the accuracy improvement in including mBERT inputs (left) and excluding them (right), with yellow meaning low, green meaning high, and white meaning no improvement.
Figure 8.
Average accuracy score gain over the best baseline method across seven languages for selected composition methods.
Figure 8.
Average accuracy score gain over the best baseline method across seven languages for selected composition methods.
Table 1.
Numerical data for seven language-specific text sub-collections.
Table 1.
Numerical data for seven language-specific text sub-collections.
Language
Words
Tokens
Chunks per Derivation
Total Chunks
Number of Authors
German (deu)
12,738,842
19,735,312
1934
7736
56
English (eng)
12,386,749
14,730,705
1431
5724
80
French (fra)
8,712,219
10,206,135
974
3896
74
Hungarian (hun)
6,948,590
8,250,330
772
3088
80
Portuguese (por)
6,799,385
8,007,906
754
3016
82
Slovenian (slv)
5,682,120
6,900,210
642
2568
47
Serbian (srp)
4,794,091
5,861,863
544
2176
66
Table 2.
Normalized weights acquired through training of 28 perceptrons.
Table 2.
Normalized weights acquired through training of 28 perceptrons.
Trained on:
Words
Lemmas
PoS
Masked
mBERT
deu
0.486
0.331
0.330
−0.147
eng
0.305
0.488
0.142
0.065
fra
0.355
0.358
0.211
0.076
hun
0.535
0.219
0.044
0.201
por
−0.128
0.686
0.063
0.379
slv
0.298
0.476
0.154
0.072
srp
0.397
0.223
0.226
0.155
universal_excl_deu
0.321
0.472
0.132
0.074
universal_excl_eng
0.354
0.407
0.210
0.029
universal_excl_fra
0.255
0.498
0.160
0.087
universal_excl_hun
0.303
0.511
0.176
0.010
universal_excl_por
0.423
0.418
0.183
−0.023
universal_excl_slv
0.294
0.486
0.212
0.007
universal_excl_srp
0.236
0.507
0.161
0.095
deu_b
0.490
0.381
0.339
−0.169
−0.040
eng_b
0.373
0.558
0.076
0.021
−0.028
fra_b
0.338
0.373
0.245
0.101
−0.056
hun_b
0.508
0.243
0.086
0.241
−0.078
por_b
−0.118
0.776
0.078
0.310
−0.047
slv_b
0.319
0.511
0.151
0.068
−0.049
srp_b
0.466
0.208
0.225
0.149
−0.048
universal_b_excl_deu
0.270
0.530
0.141
0.106
−0.047
universal_b_excl_eng
0.272
0.532
0.176
0.068
−0.048
universal_b_excl_fra
0.321
0.502
0.138
0.079
−0.040
universal_b_excl_hun
0.340
0.495
0.178
0.028
−0.041
universal_b_excl_por
0.467
0.379
0.217
−0.019
−0.043
universal_b_excl_slv
0.392
0.404
0.199
0.046
−0.041
universal_b_excl_srp
0.326
0.516
0.150
0.052
−0.044
Table 3.
Euclidean distances between weights acquired through perceptron training, with bold indicating the shortest distances between different language weights.
Table 3.
Euclidean distances between weights acquired through perceptron training, with bold indicating the shortest distances between different language weights.
deu
eng
fra
hun
por
slv
srp
deu
0.000
0.371
0.287
0.467
0.922
0.368
0.349
eng
0.371
0.000
0.156
0.392
0.576
0.020
0.307
fra
0.287
0.156
0.000
0.309
0.674
0.143
0.162
hun
0.467
0.392
0.309
0.000
0.831
0.389
0.233
por
0.922
0.576
0.674
0.831
0.000
0.573
0.753
slv
0.368
0.020
0.143
0.389
0.573
0.000
0.293
srp
0.349
0.307
0.162
0.233
0.753
0.293
0.000
deu_b
eng_b
fra_b
hun_b
por_b
slv_b
srp_b
deu_b
0.000
0.388
0.324
0.503
0.907
0.371
0.380
eng_b
0.388
0.000
0.267
0.410
0.610
0.116
0.412
fra_b
0.324
0.267
0.000
0.302
0.665
0.172
0.215
hun_b
0.503
0.410
0.302
0.000
0.825
0.378
0.178
por_b
0.907
0.610
0.665
0.825
0.000
0.570
0.843
slv_b
0.371
0.116
0.172
0.378
0.570
0.000
0.354
srp_b
0.380
0.412
0.215
0.178
0.843
0.354
0.000
Table 4.
Accuracy scores obtained in authorship attribution task evaluation, with italic indicating the baseline and bold indicating best performing methods for each language (baseline and overall).
Table 4.
Accuracy scores obtained in authorship attribution task evaluation, with italic indicating the baseline and bold indicating best performing methods for each language (baseline and overall).
Embedding Base
deu
eng
fra
hun
por
slv
srp
avg
bert
0.7129
0.5561
0.4444
0.6991
0.5925
0.5042
0.4918
0.5716
word
0.9203
0.8175
0.7561
0.9812
0.7245
0.7188
0.7279
0.8066
pos
0.8370
0.6632
0.6125
0.8088
0.7509
0.6958
0.7279
0.7280
lemma
0.9212
0.8351
0.7507
0.9781
0.8000
0.7729
0.7082
0.8237
masked
0.7346
0.6439
0.7046
0.9185
0.8113
0.7208
0.7016
0.7479
baseline 1
0.9203
0.8175
0.7561
0.9812
0.7245
0.7188
0.7279
0.8066
baseline 2
0.9212
0.8351
0.7561
0.9812
0.8113
0.7729
0.7279
0.8294
mean
0.9420
0.8158
0.8238
0.9937
0.8717
0.7646
0.7967
0.8583
mean_b
0.9420
0.8175
0.8238
0.9937
0.8717
0.7646
0.8000
0.8590
max
0.9257
0.8298
0.8049
0.9906
0.8226
0.7854
0.7541
0.8447
max_b
0.9257
0.8298
0.8049
0.9906
0.8226
0.7854
0.7541
0.8447
min
0.8433
0.6649
0.6341
0.8150
0.7547
0.6979
0.7344
0.7349
min_b
0.7129
0.5561
0.4444
0.6991
0.5925
0.5042
0.4918
0.5716
product
0.9375
0.8035
0.8157
0.9875
0.8792
0.7625
0.8000
0.8551
product_b
0.9058
0.7474
0.7453
0.9718
0.8189
0.7792
0.7836
0.8217
l2-norm
0.9466
0.8193
0.8293
0.9969
0.8717
0.7646
0.7869
0.8593
l2-norm_b
0.9466
0.8193
0.8293
0.9969
0.8717
0.7646
0.7869
0.8593
weights_transfer
0.9547
0.8421
0.8347
0.9969
0.8415
0.7854
0.796
0.8646
weights_transfer_b
0.9538
0.8404
0.8320
0.9969
0.8415
0.7917
0.7869
0.8633
weights_universal
0.9475
0.8316
0.8347
0.9906
0.8151
0.7812
0.7934
0.8563
weights_universal_b
0.9484
0.8386
0.8293
0.9906
0.8075
0.7771
0.7934
0.8550
Table 5.
Weighted-average -scores obtained through authorship attribution task evaluation, with italic indicating the baseline and bold indicating best performing methods for each language (baseline and overall).
Table 5.
Weighted-average -scores obtained through authorship attribution task evaluation, with italic indicating the baseline and bold indicating best performing methods for each language (baseline and overall).
Embedding Base
deu
eng
fra
hun
por
slv
srp
avg
bert
0.7423
0.5966
0.4912
0.7403
0.6510
0.5170
0.5226
0.6087
word
0.9387
0.8588
0.7992
0.9904
0.7742
0.7259
0.7518
0.8341
pos
0.8611
0.7200
0.6485
0.8675
0.8167
0.7181
0.7364
0.7669
lemma
0.9391
0.8753
0.7951
0.9840
0.8588
0.7860
0.7414
0.8542
masked
0.7822
0.7017
0.7718
0.9433
0.8705
0.7377
0.7140
0.7887
baseline 1
0.9387
0.8588
0.7992
0.9904
0.7742
0.7259
0.7518
0.8341
baseline 2
0.9391
0.8753
0.7992
0.9904
0.8705
0.7860
0.7518
0.8589
mean
0.9579
0.8484
0.8551
0.9968
0.9163
0.7771
0.8120
0.8805
mean_b
0.9579
0.8493
0.8551
0.9968
0.9163
0.7771
0.8174
0.8814
max
0.9436
0.8698
0.8412
0.9952
0.8790
0.7979
0.7740
0.8715
max_b
0.9436
0.8698
0.8412
0.9952
0.8790
0.7979
0.774
0.8715
min
0.8679
0.7199
0.6717
0.8741
0.8223
0.7212
0.7388
0.7737
min_b
0.7423
0.5966
0.4912
0.7403
0.6510
0.5170
0.5226
0.6087
product
0.9529
0.8364
0.8446
0.9933
0.9202
0.7775
0.8160
0.8773
product_b
0.9196
0.7734
0.7848
0.9789
0.8672
0.7947
0.8042
0.8461
l2-norm
0.9604
0.8509
0.8583
0.9984
0.9147
0.7777
0.8067
0.8810
l2-norm_b
0.9604
0.8509
0.8583
0.9984
0.9147
0.7777
0.8067
0.8810
weights_transfer
0.9660
0.8772
0.8644
0.9984
0.8866
0.7960
0.8220
0.8872
weights_transfer_b
0.9646
0.8770
0.8630
0.9984
0.8851
0.7988
0.8036
0.8844
weights_universal
0.9617
0.8658
0.8644
0.9937
0.8641
0.7934
0.8169
0.8800
weights_universal_b
0.9623
0.8735
0.8602
0.9952
0.8566
0.7878
0.8181
0.8791
Table 6.
Accuracy scores with percentual increase/decrease between the primary (upper) and secondary (lower) baseline method and each composite method for each examined language, with the highest improvements for each language indicated in bold.
Table 6.
Accuracy scores with percentual increase/decrease between the primary (upper) and secondary (lower) baseline method and each composite method for each examined language, with the highest improvements for each language indicated in bold.
Embedding Base
deu
eng
fra
hun
por
slv
srp
mean
2.36%
−0.21%
8.95%
1.27%
20.32%
6.37%
9.45%
mean_b
2.36%
0.00%
8.95%
1.27%
20.32%
6.37%
9.91%
max
0.59%
1.50%
6.45%
0.96%
13.54%
9.27%
3.60%
max_b
0.59%
1.50%
6.45%
0.96%
13.54%
9.27%
3.60%
min
−8.37%
−18.67%
−16.14%
−16.94%
4.17%
−2.91%
0.89%
min_b
−22.54%
−31.98%
−41.22%
−28.75%
−18.22%
−29.86%
−32.44%
product
1.87%
−1.71%
7.88%
0.64%
21.35%
6.08%
9.91%
product_b
−1.58%
−8.57%
−1.43%
−0.96%
13.03%
8.40%
7.65%
l2-norm
2.86%
0.22%
9.68%
1.60%
20.32%
6.37%
8.11%
l2-norm_b
2.86%
0.22%
9.68%
1.60%
20.32%
6.37%
8.11%
w._transfer
3.74%
3.01%
10.40%
1.60%
16.15%
9.27%
9.45%
w._transfer_b
3.64%
2.80%
10.04%
1.60%
16.15%
10.14%
8.11%
w._universal
2.96%
1.72%
10.40%
0.96%
12.51%
8.68%
9.00%
w._universal_b
3.05%
2.58%
9.68%
0.96%
11.46%
8.11%
9.00%
mean
2.26%
−2.31%
8.95%
1.27%
7.44%
−1.07%
9.45%
mean_b
2.26%
−2.11%
8.95%
1.27%
7.44%
−1.07%
9.91%
max
0.49%
−0.63%
6.45%
0.96%
1.39%
1.62%
3.60%
max_b
0.49%
−0.63%
6.45%
0.96%
1.39%
1.62%
3.60%
min
−8.46%
−20.38%
−16.14%
−16.94%
−6.98%
−9.70%
0.89%
min_b
−22.61%
−33.41%
−41.22%
−28.75%
−26.97%
−34.77%
−32.44%
product
1.77%
−3.78%
7.88%
0.64%
8.37%
−1.35%
9.91%
product_b
−1.67%
−10.50%
−1.43%
−0.96%
0.94%
0.82%
7.65%
l2-norm
2.76%
−1.89%
9.68%
1.60%
7.44%
−1.07%
8.11%
l2-norm_b
2.76%
−1.89%
9.68%
1.60%
7.44%
−1.07%
8.11%
w._transfer
3.64%
0.84%
10.40%
1.60%
3.72%
1.62%
9.45%
w._transfer_b
3.54%
0.63%
10.04%
1.60%
3.72%
2.43%
8.11%
w._universal
2.85%
−0.42%
10.40%
0.96%
0.47%
1.07%
9.00%
w._universal_b
2.95%
0.42%
9.68%
0.96%
−0.47%
0.54%
9.00%
Table 7.
Percentual increase/decrease in accuracy when using the mBERT embeddings as composition input grouped by composition method and language, with results omitted if there is no change.
Table 7.
Percentual increase/decrease in accuracy when using the mBERT embeddings as composition input grouped by composition method and language, with results omitted if there is no change.
embedding base
deu
eng
fra
hun
por
slv
srp
mean
0.21%
0.41%
max
min
−15.46%
−16.36%
−29.92%
−14.22%
−21.49%
−27.75%
−33.03%
product
−3.38%
−6.98%
−8.63%
−1.59%
−6.86%
2.19%
−2.05%
l2-norm
w._transfer
−0.09%
−0.20%
−0.32%
0.80%
−1.23%
w._universal
0.09%
0.84%
−0.65%
−0.93%
−0.52%
Publisher’s Note: MDPI stays neutral with regard to jurisdictional claims in published maps and institutional affiliations.
Škorić, M.; Stanković, R.; Ikonić Nešić, M.; Byszuk, J.; Eder, M.
Parallel Stylometric Document Embeddings with Deep Learning Based Language Models in Literary Authorship Attribution. Mathematics2022, 10, 838.
https://doi.org/10.3390/math10050838
AMA Style
Škorić M, Stanković R, Ikonić Nešić M, Byszuk J, Eder M.
Parallel Stylometric Document Embeddings with Deep Learning Based Language Models in Literary Authorship Attribution. Mathematics. 2022; 10(5):838.
https://doi.org/10.3390/math10050838
Chicago/Turabian Style
Škorić, Mihailo, Ranka Stanković, Milica Ikonić Nešić, Joanna Byszuk, and Maciej Eder.
2022. "Parallel Stylometric Document Embeddings with Deep Learning Based Language Models in Literary Authorship Attribution" Mathematics 10, no. 5: 838.
https://doi.org/10.3390/math10050838
Note that from the first issue of 2016, this journal uses article numbers instead of page numbers. See further details here.
Article Metrics
No
No
Article Access Statistics
For more information on the journal statistics, click here.
Multiple requests from the same IP address are counted as one view.
Škorić, M.; Stanković, R.; Ikonić Nešić, M.; Byszuk, J.; Eder, M.
Parallel Stylometric Document Embeddings with Deep Learning Based Language Models in Literary Authorship Attribution. Mathematics2022, 10, 838.
https://doi.org/10.3390/math10050838
AMA Style
Škorić M, Stanković R, Ikonić Nešić M, Byszuk J, Eder M.
Parallel Stylometric Document Embeddings with Deep Learning Based Language Models in Literary Authorship Attribution. Mathematics. 2022; 10(5):838.
https://doi.org/10.3390/math10050838
Chicago/Turabian Style
Škorić, Mihailo, Ranka Stanković, Milica Ikonić Nešić, Joanna Byszuk, and Maciej Eder.
2022. "Parallel Stylometric Document Embeddings with Deep Learning Based Language Models in Literary Authorship Attribution" Mathematics 10, no. 5: 838.
https://doi.org/10.3390/math10050838
Note that from the first issue of 2016, this journal uses article numbers instead of page numbers. See further details here.


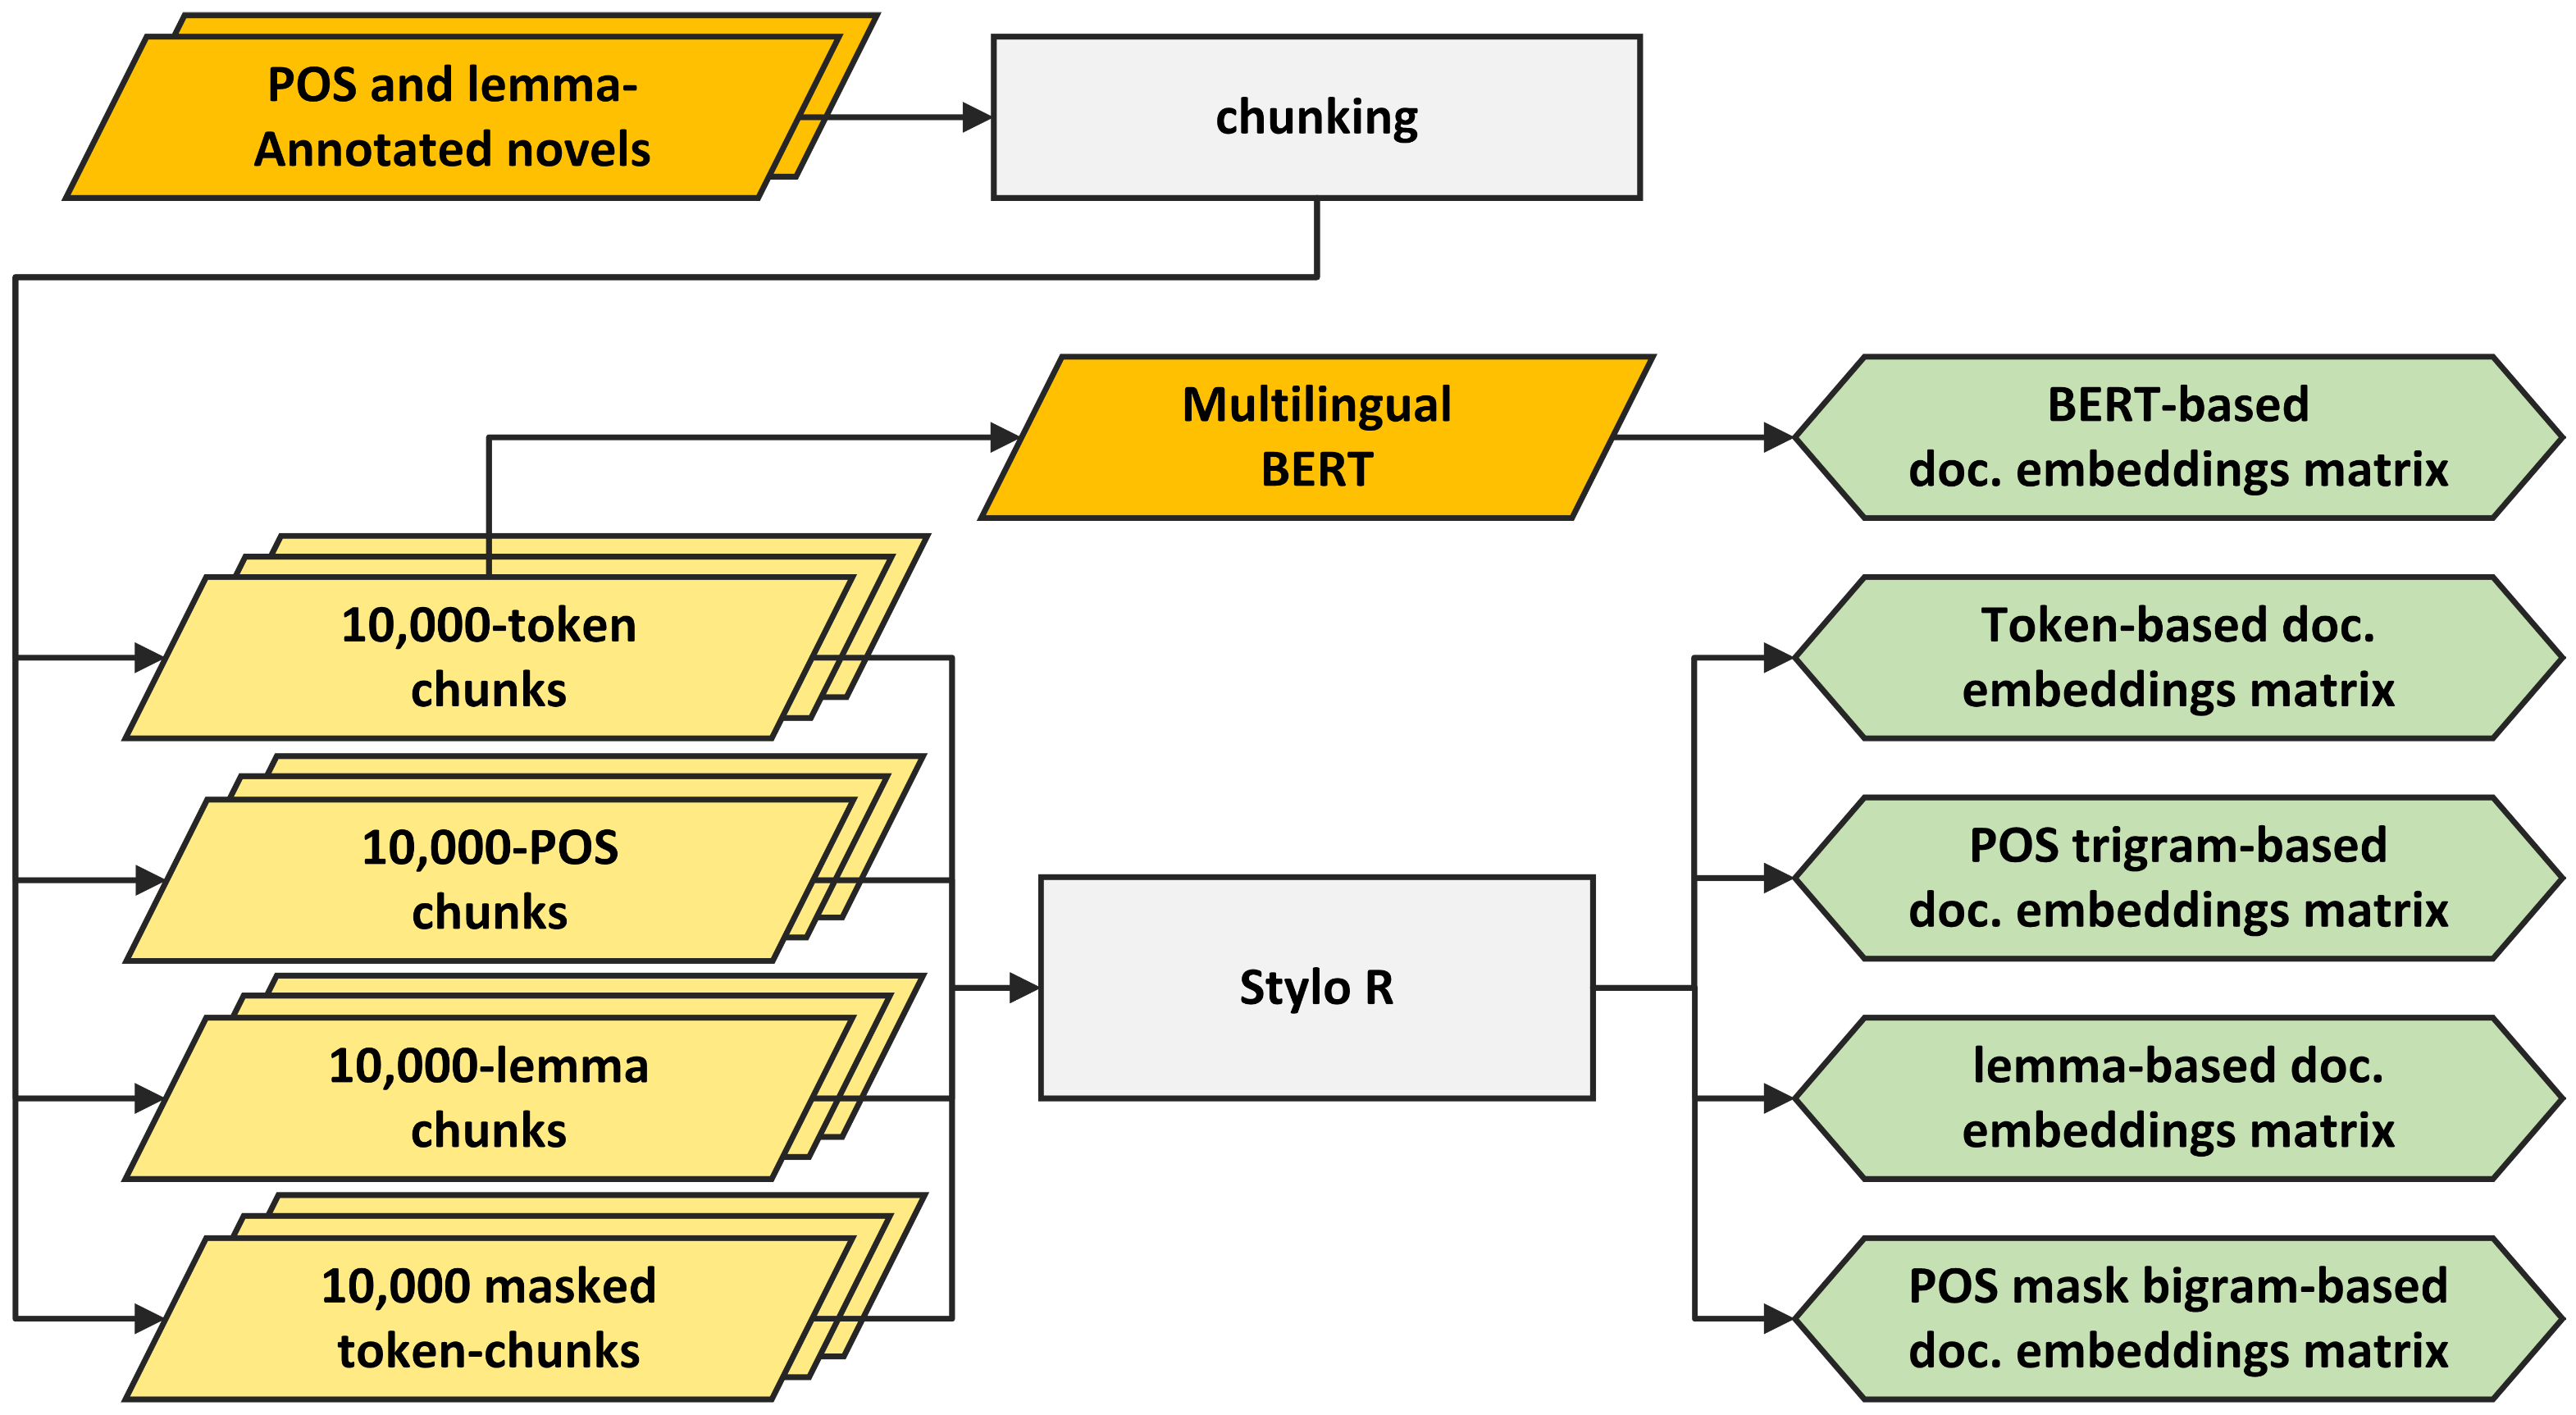
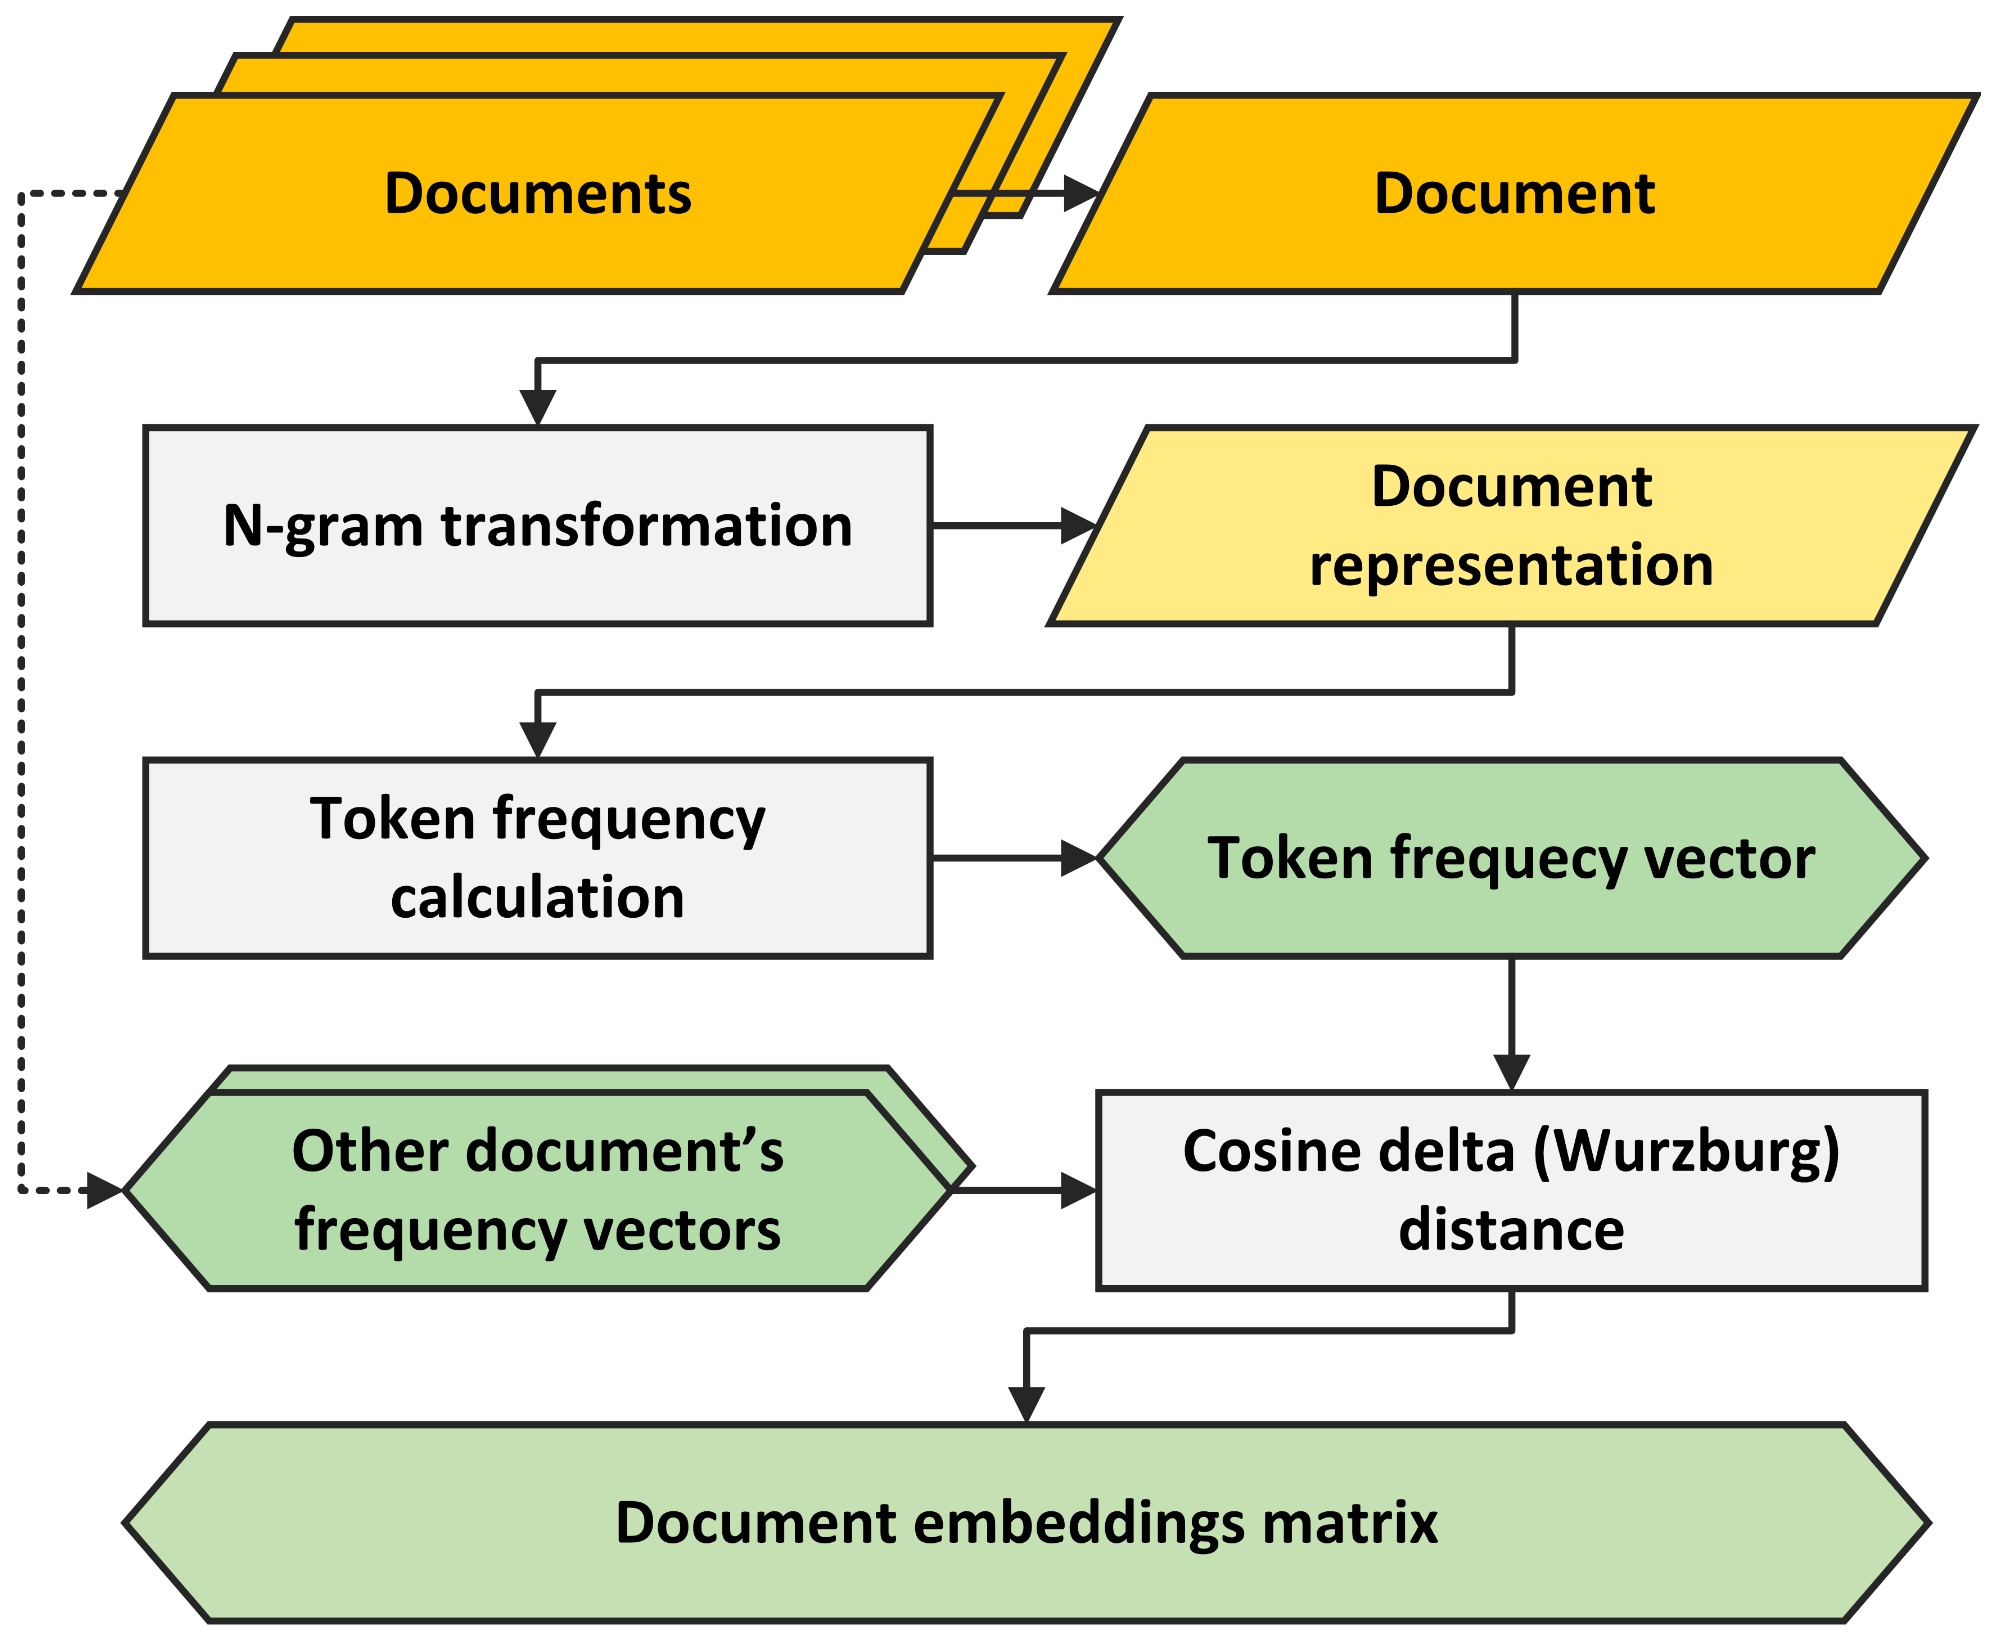
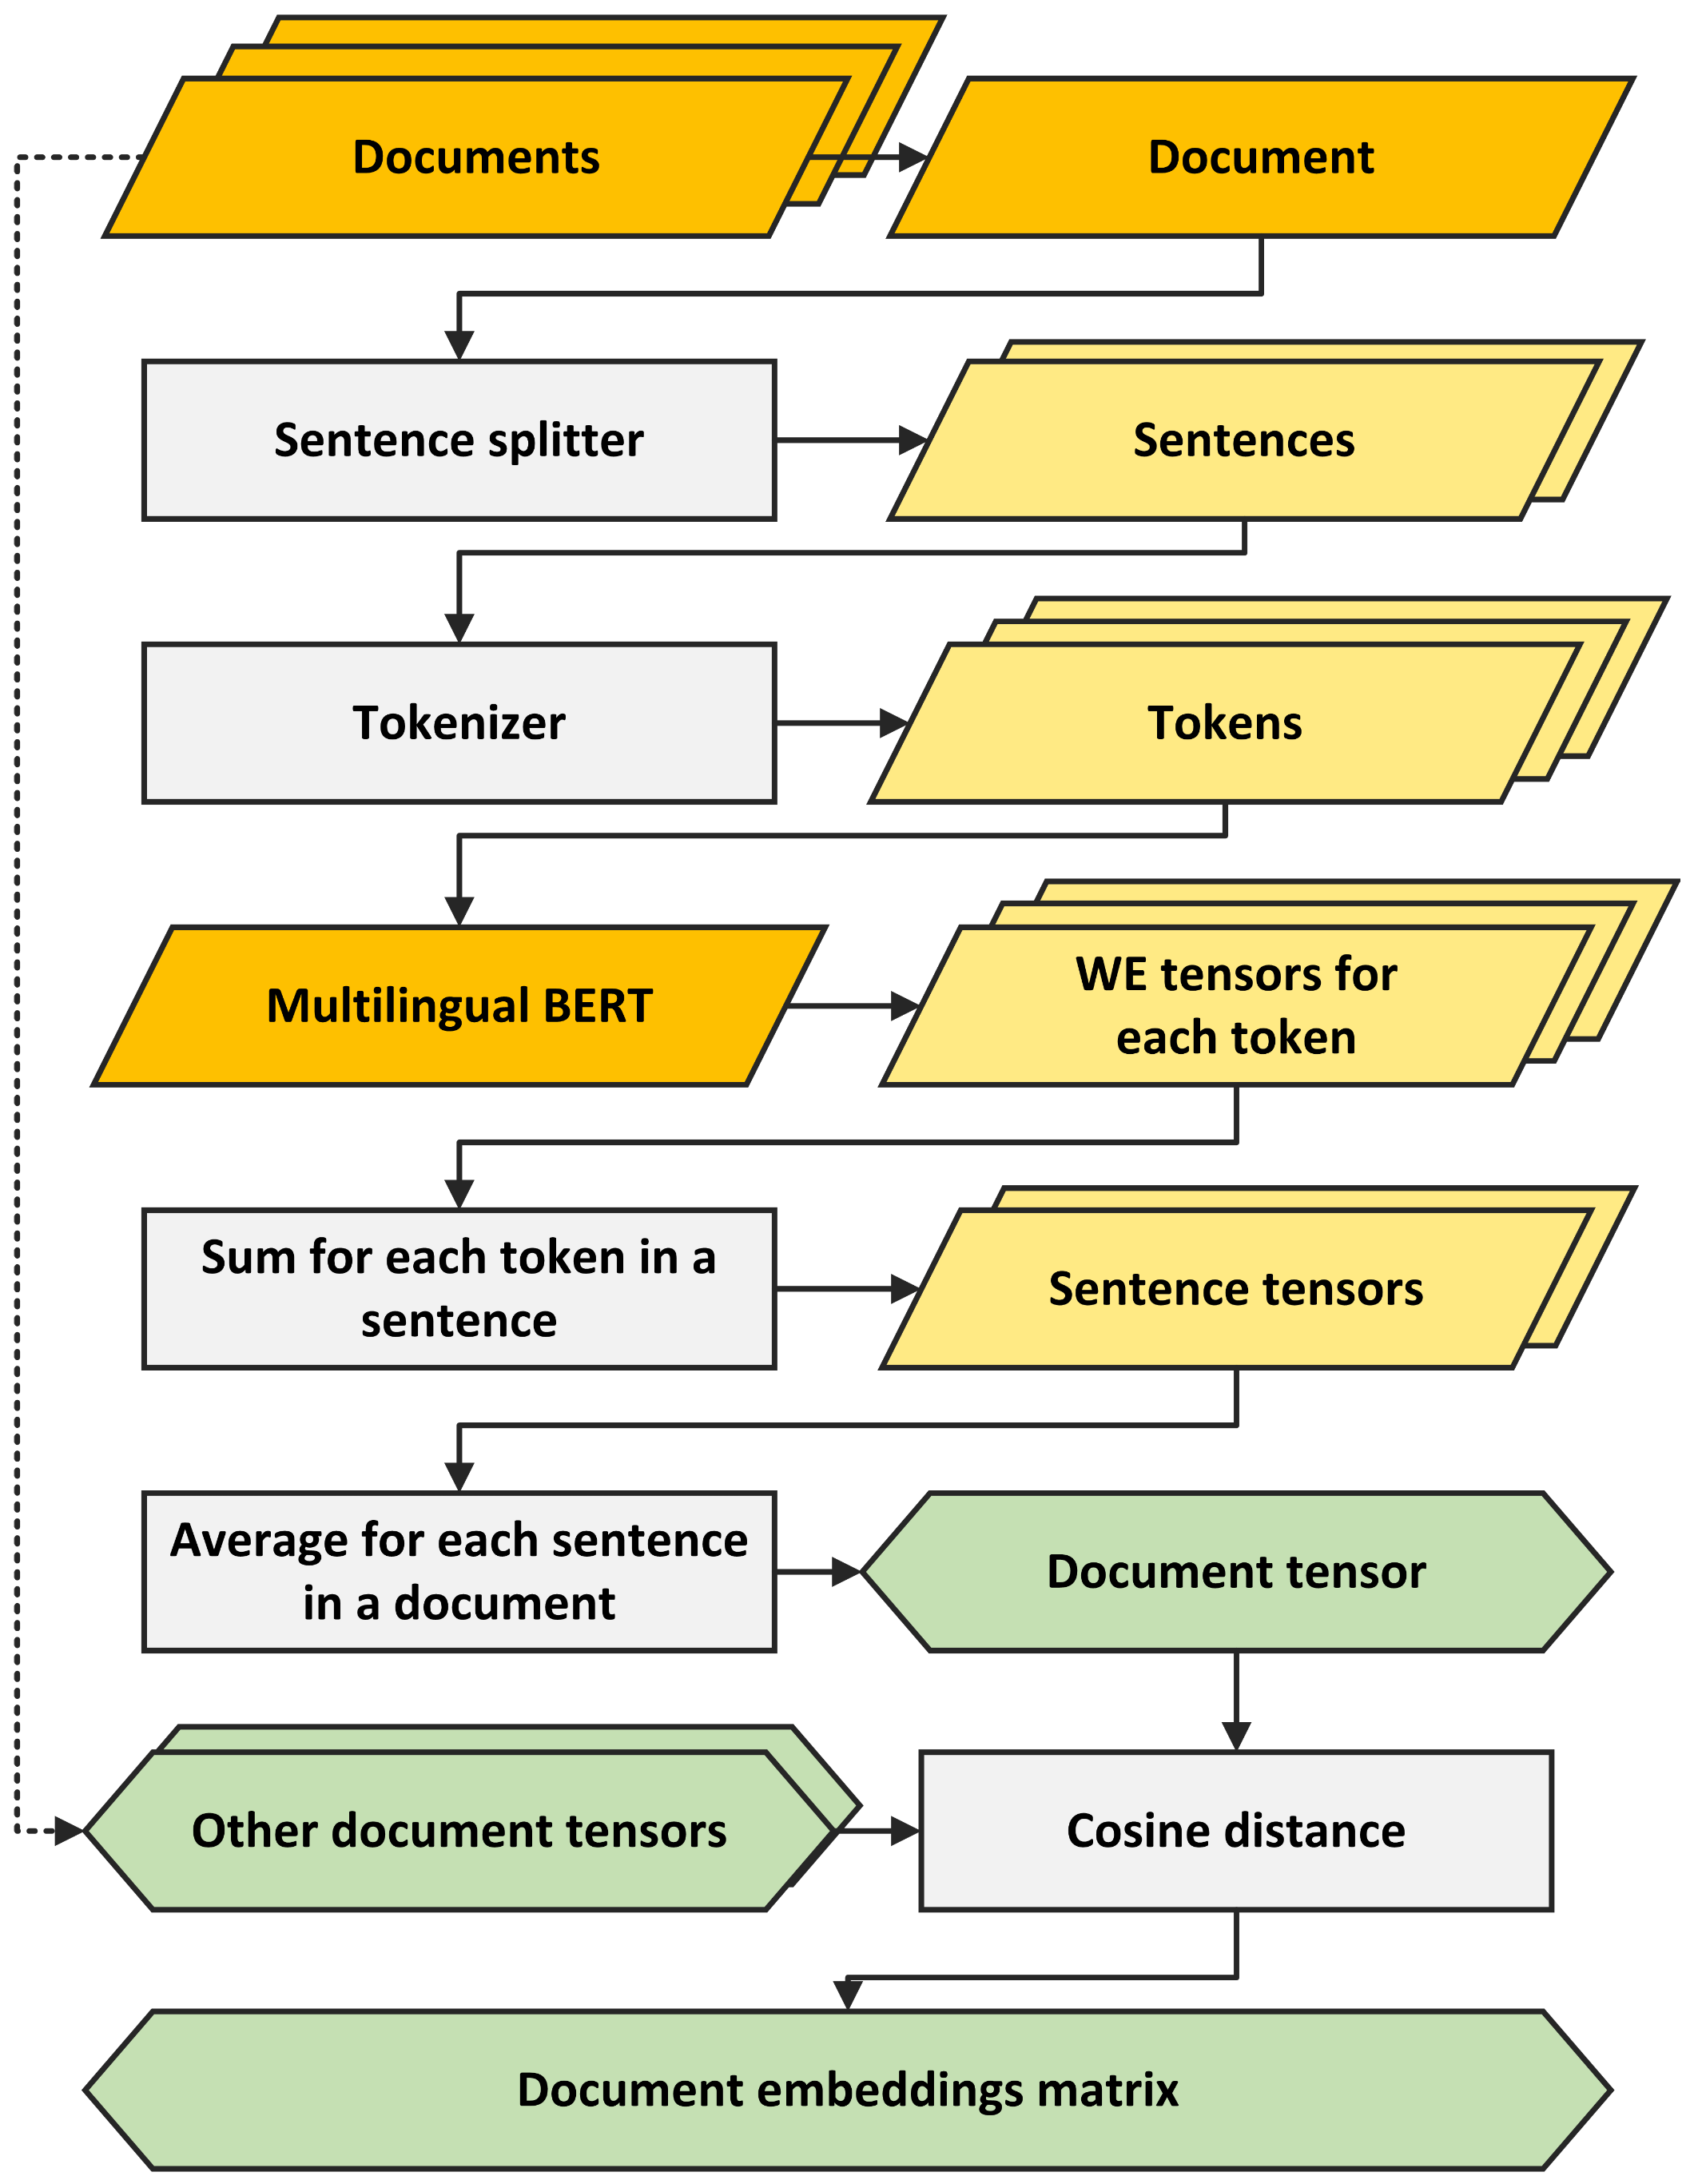
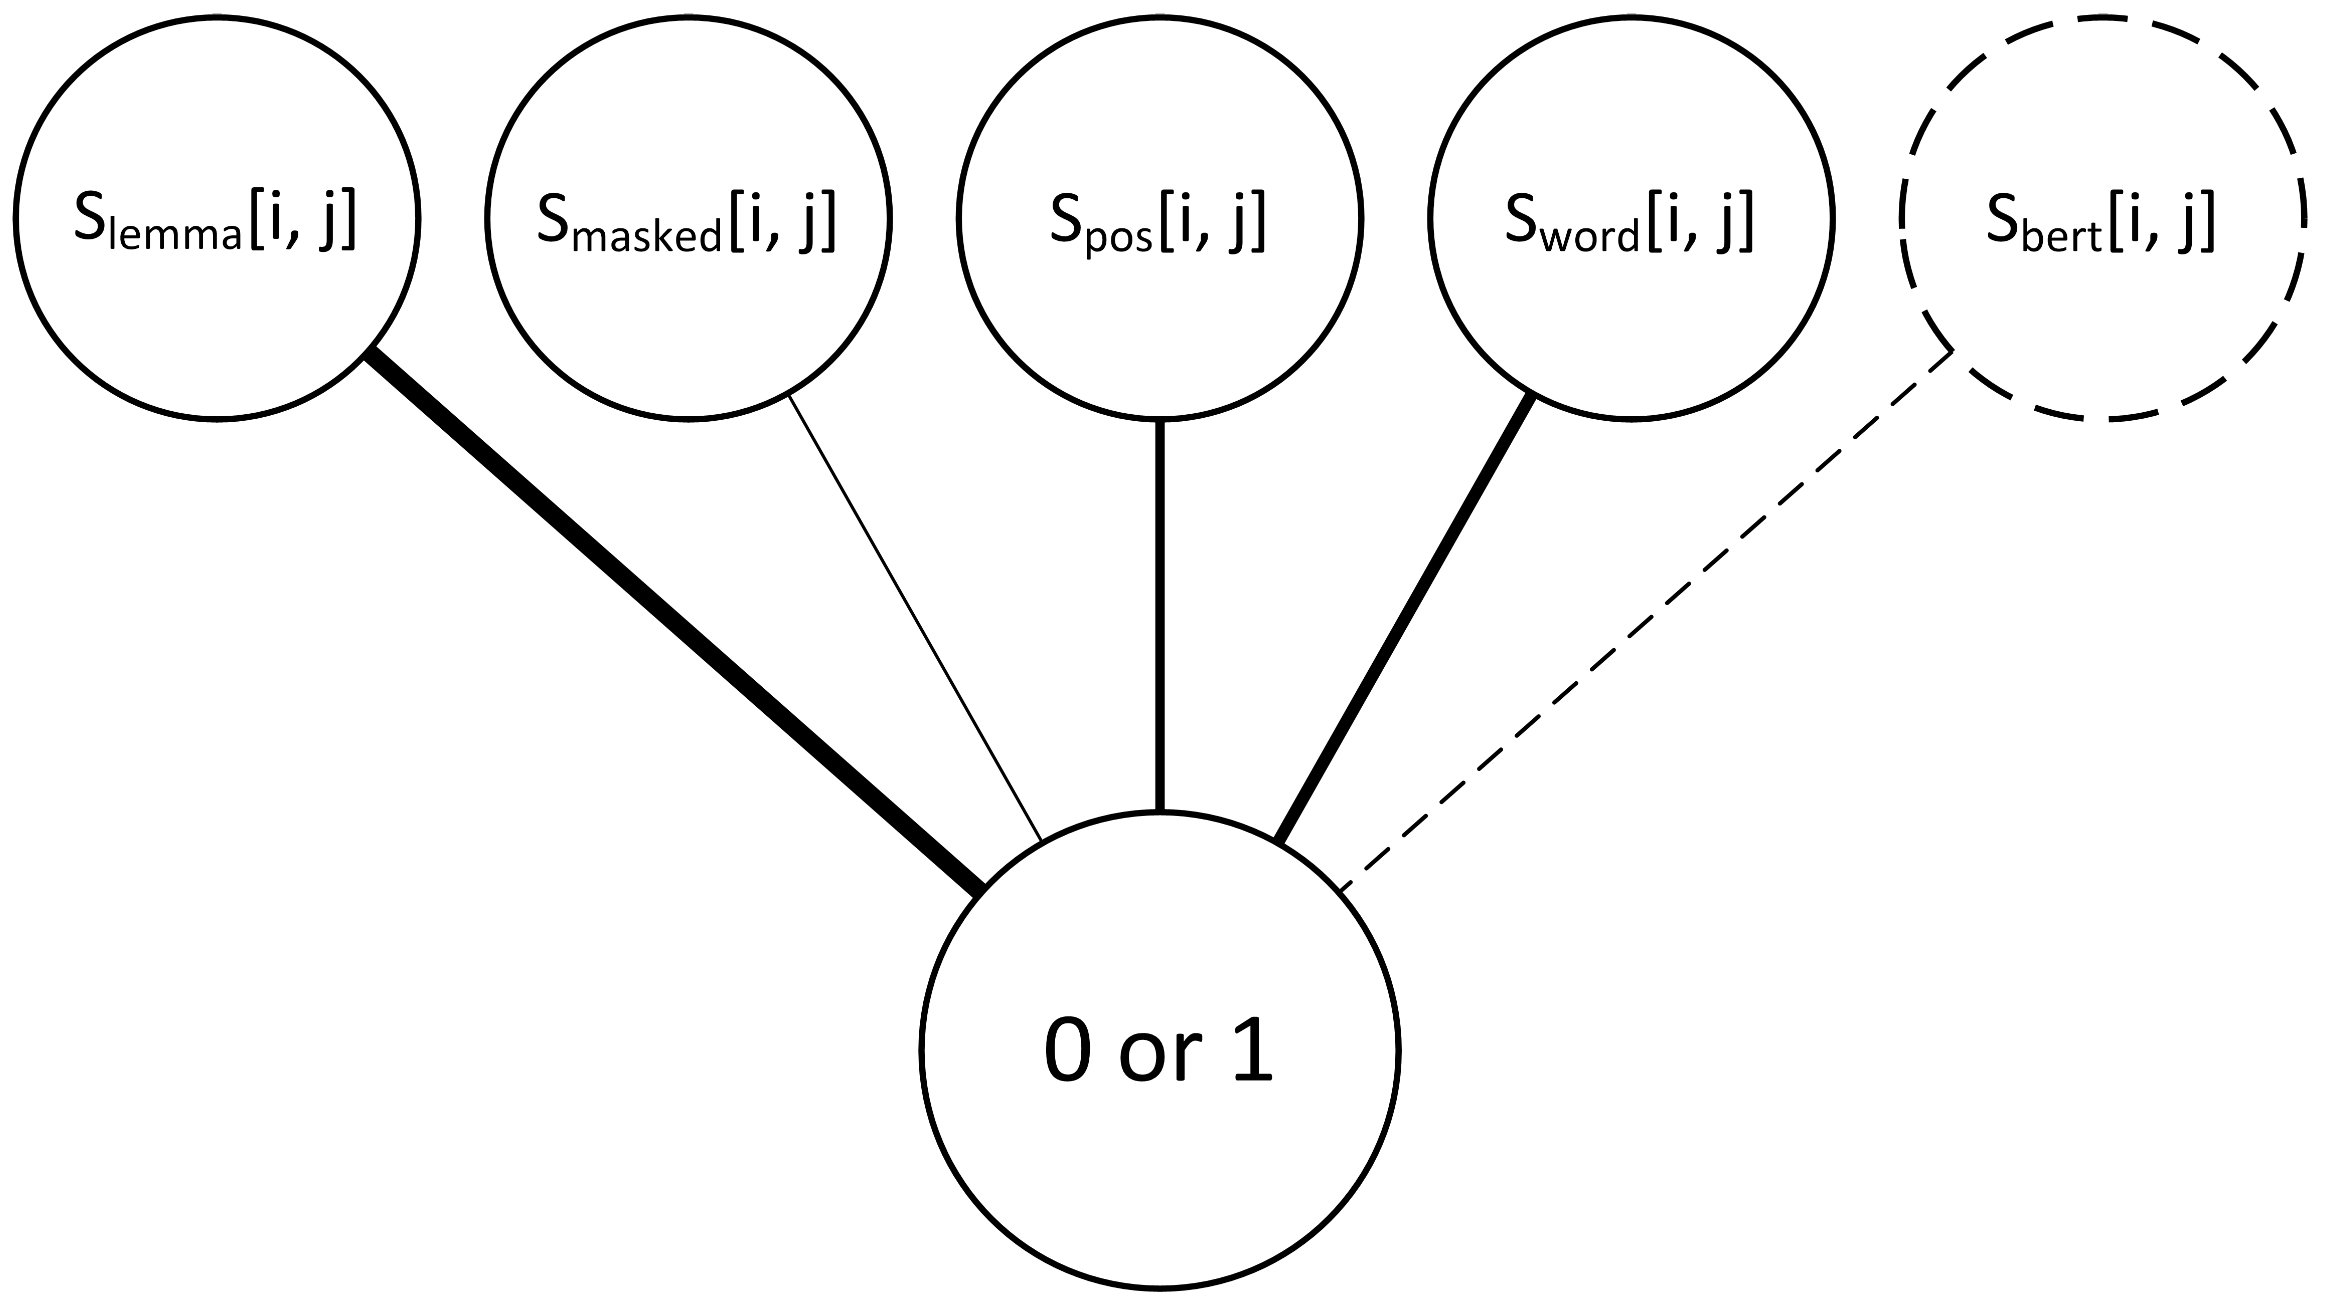
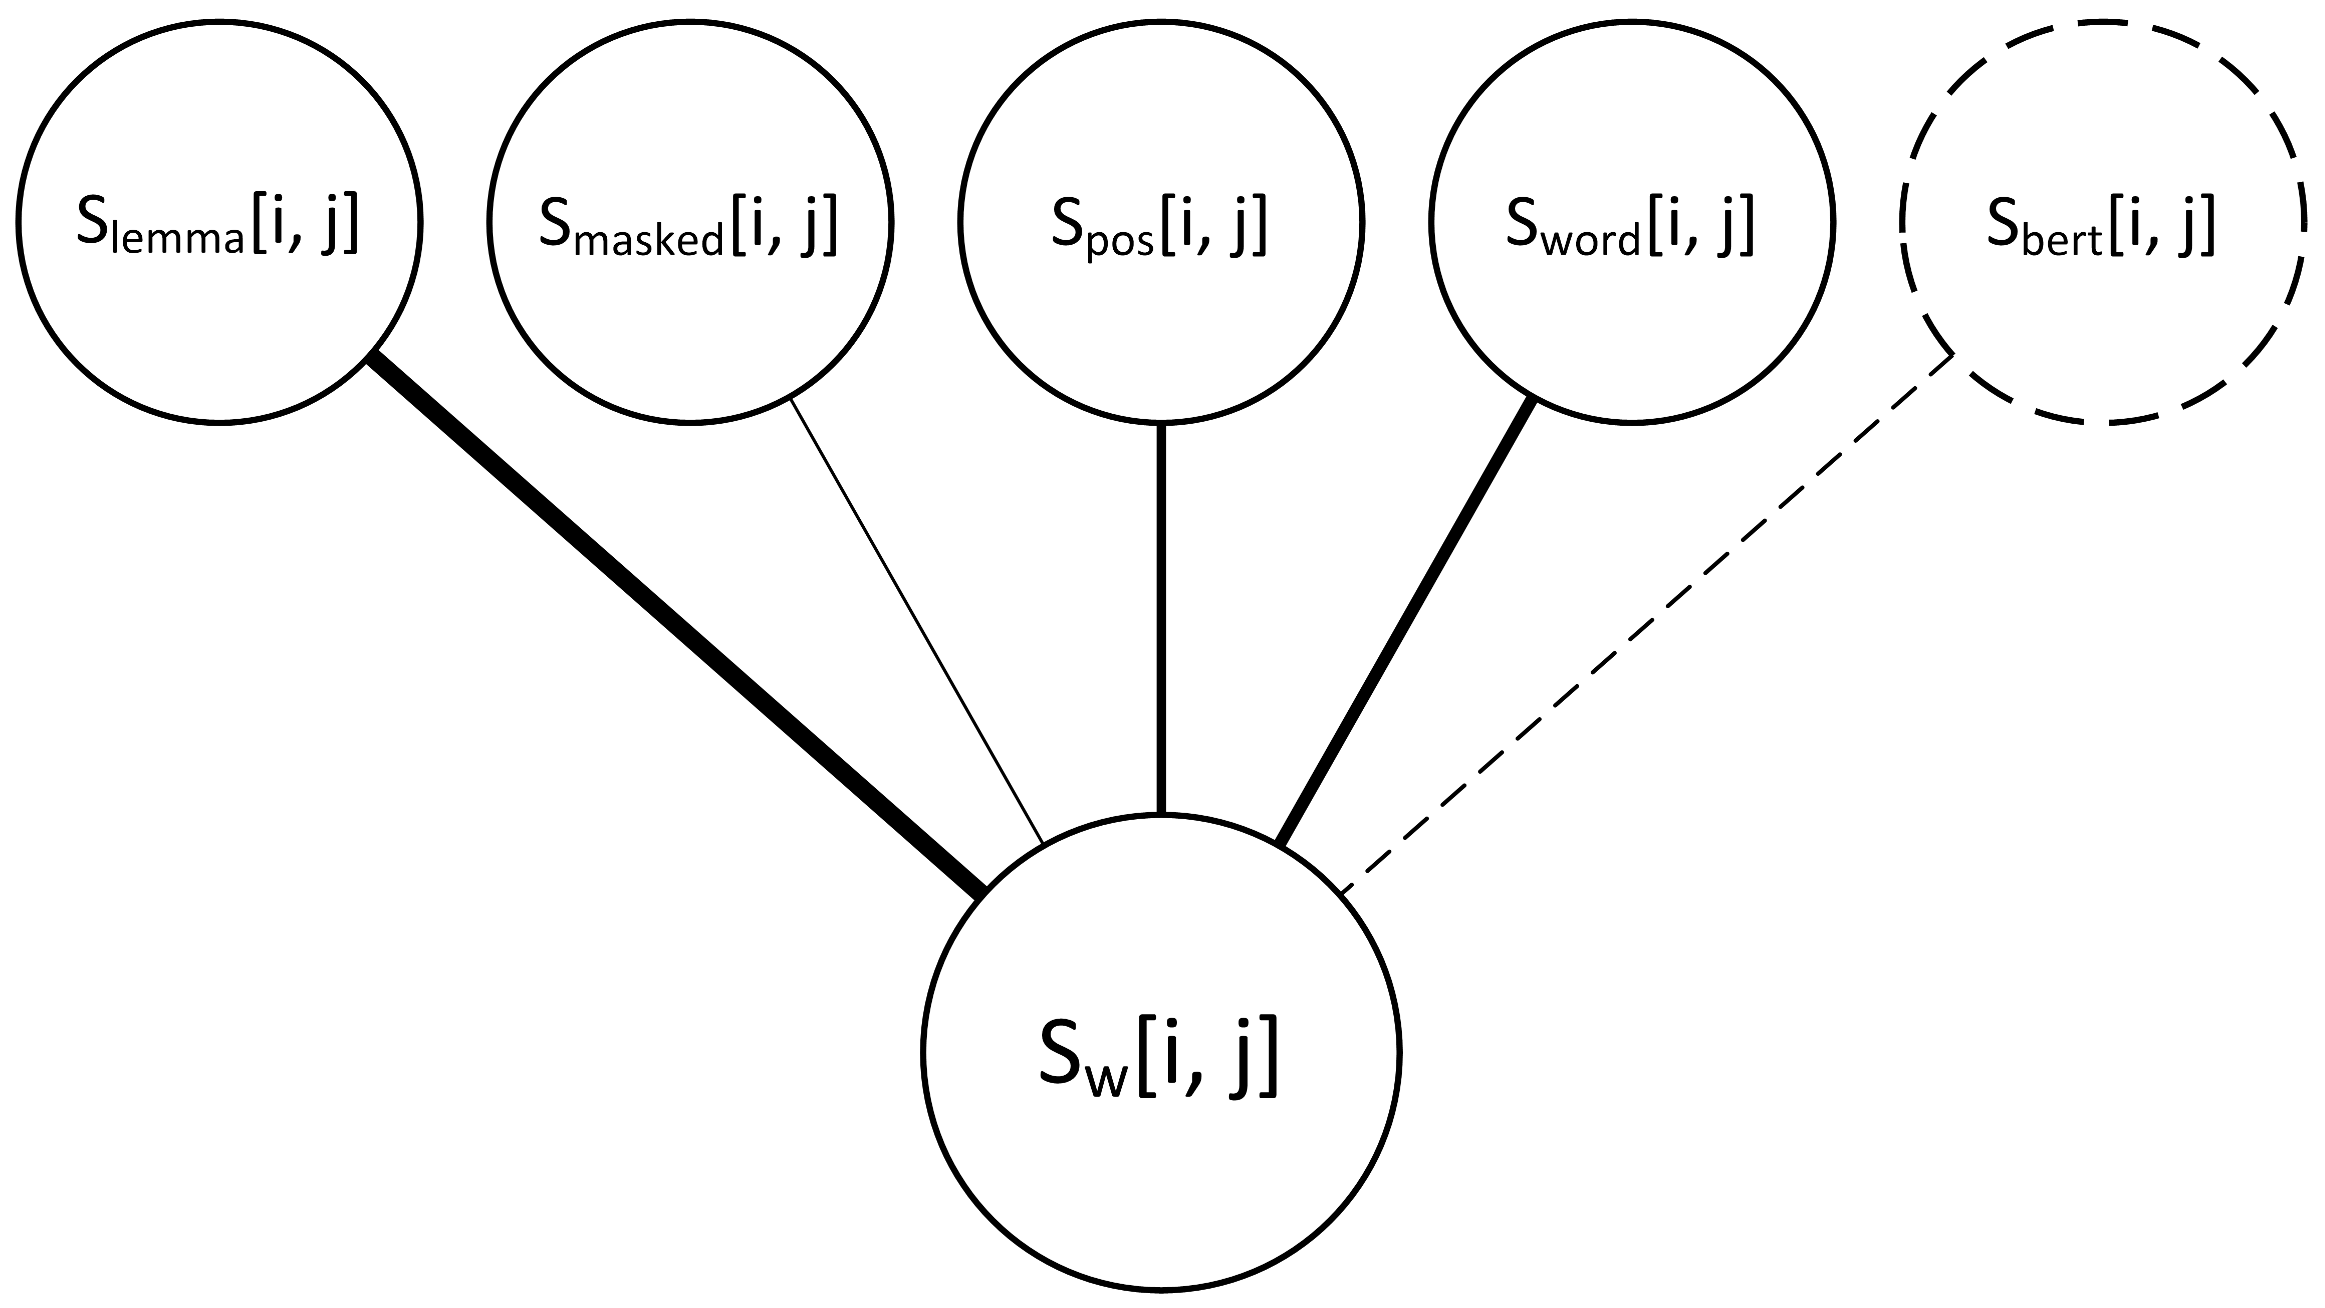
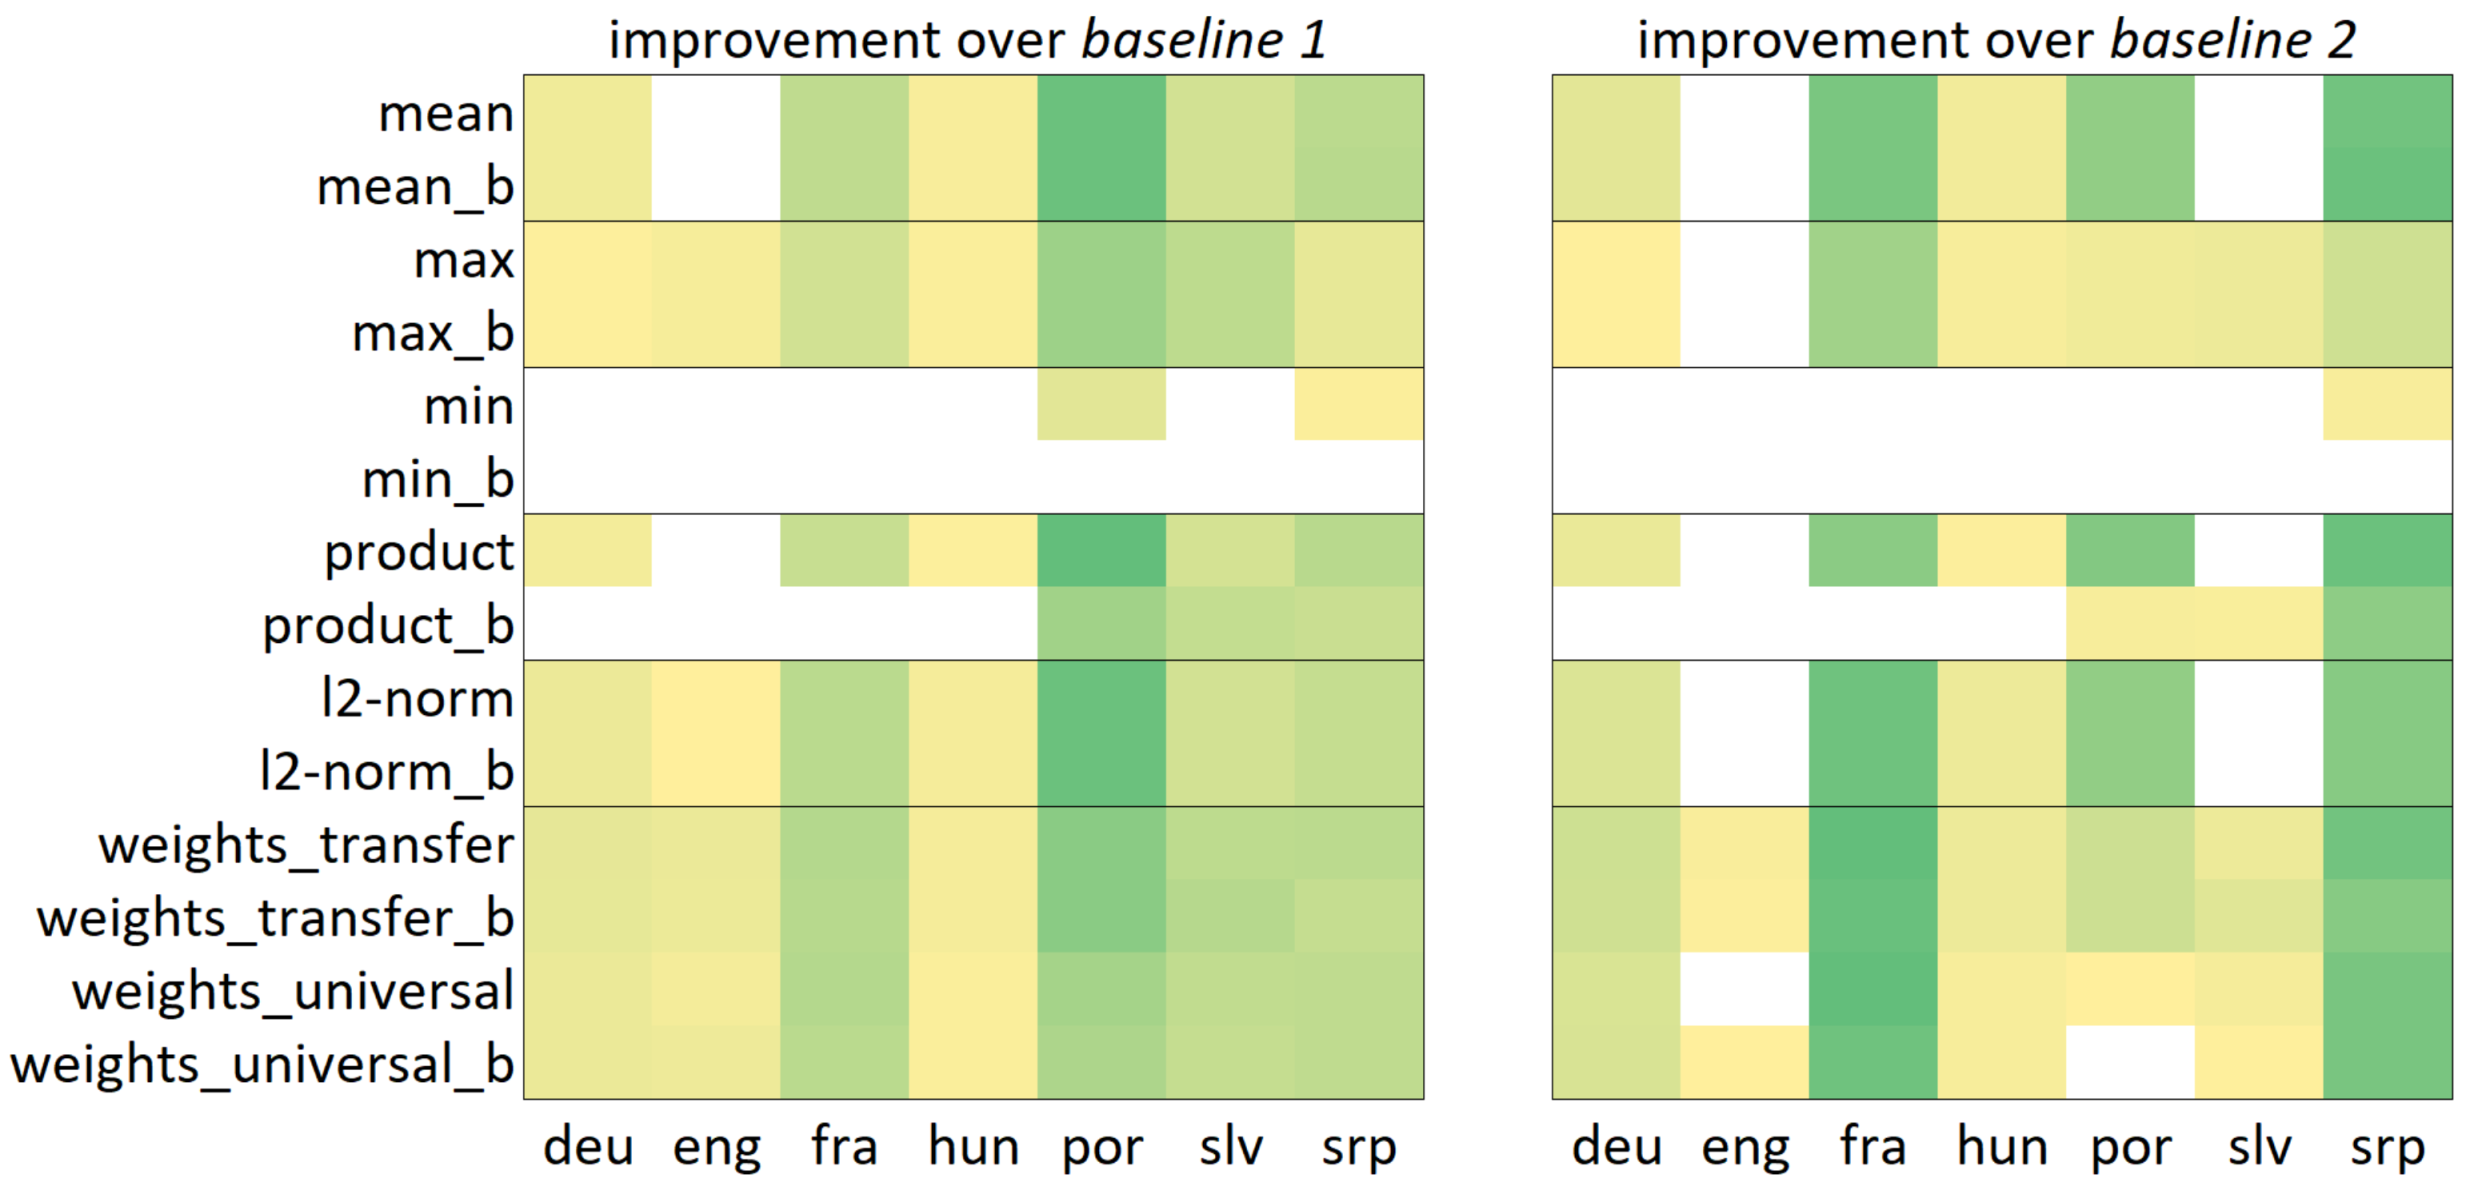
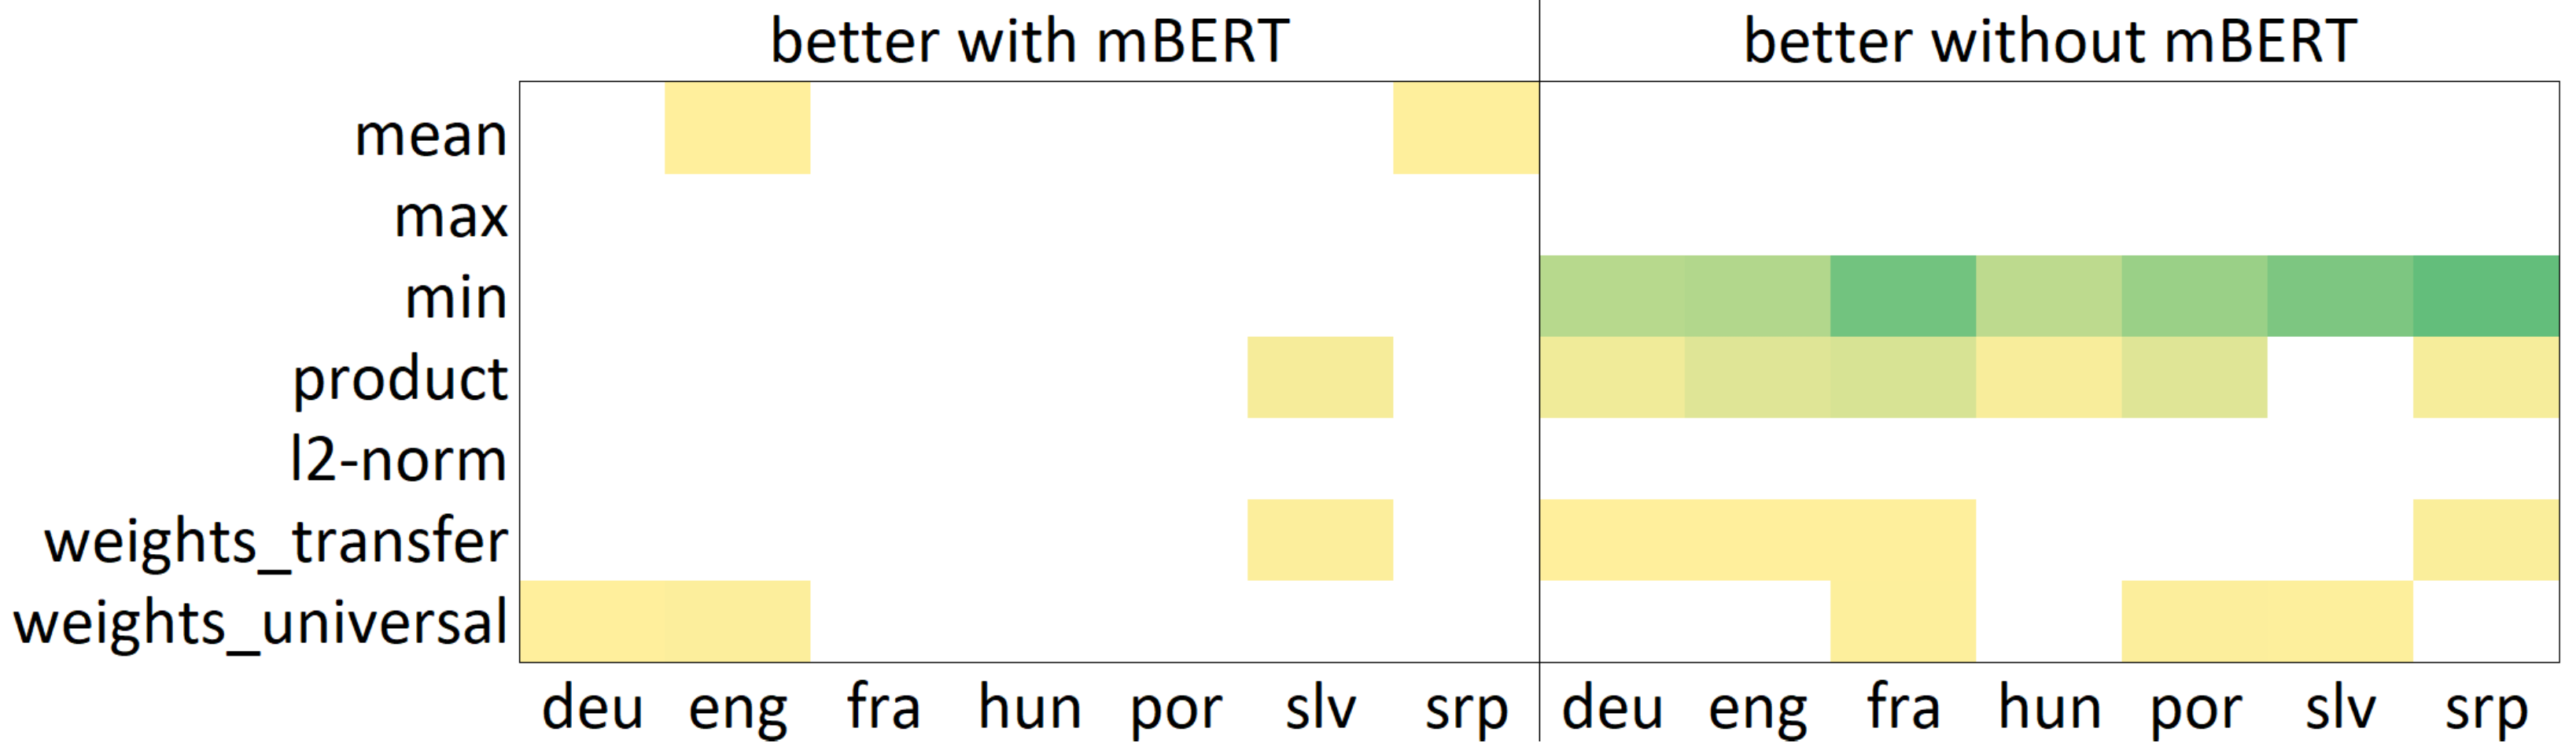
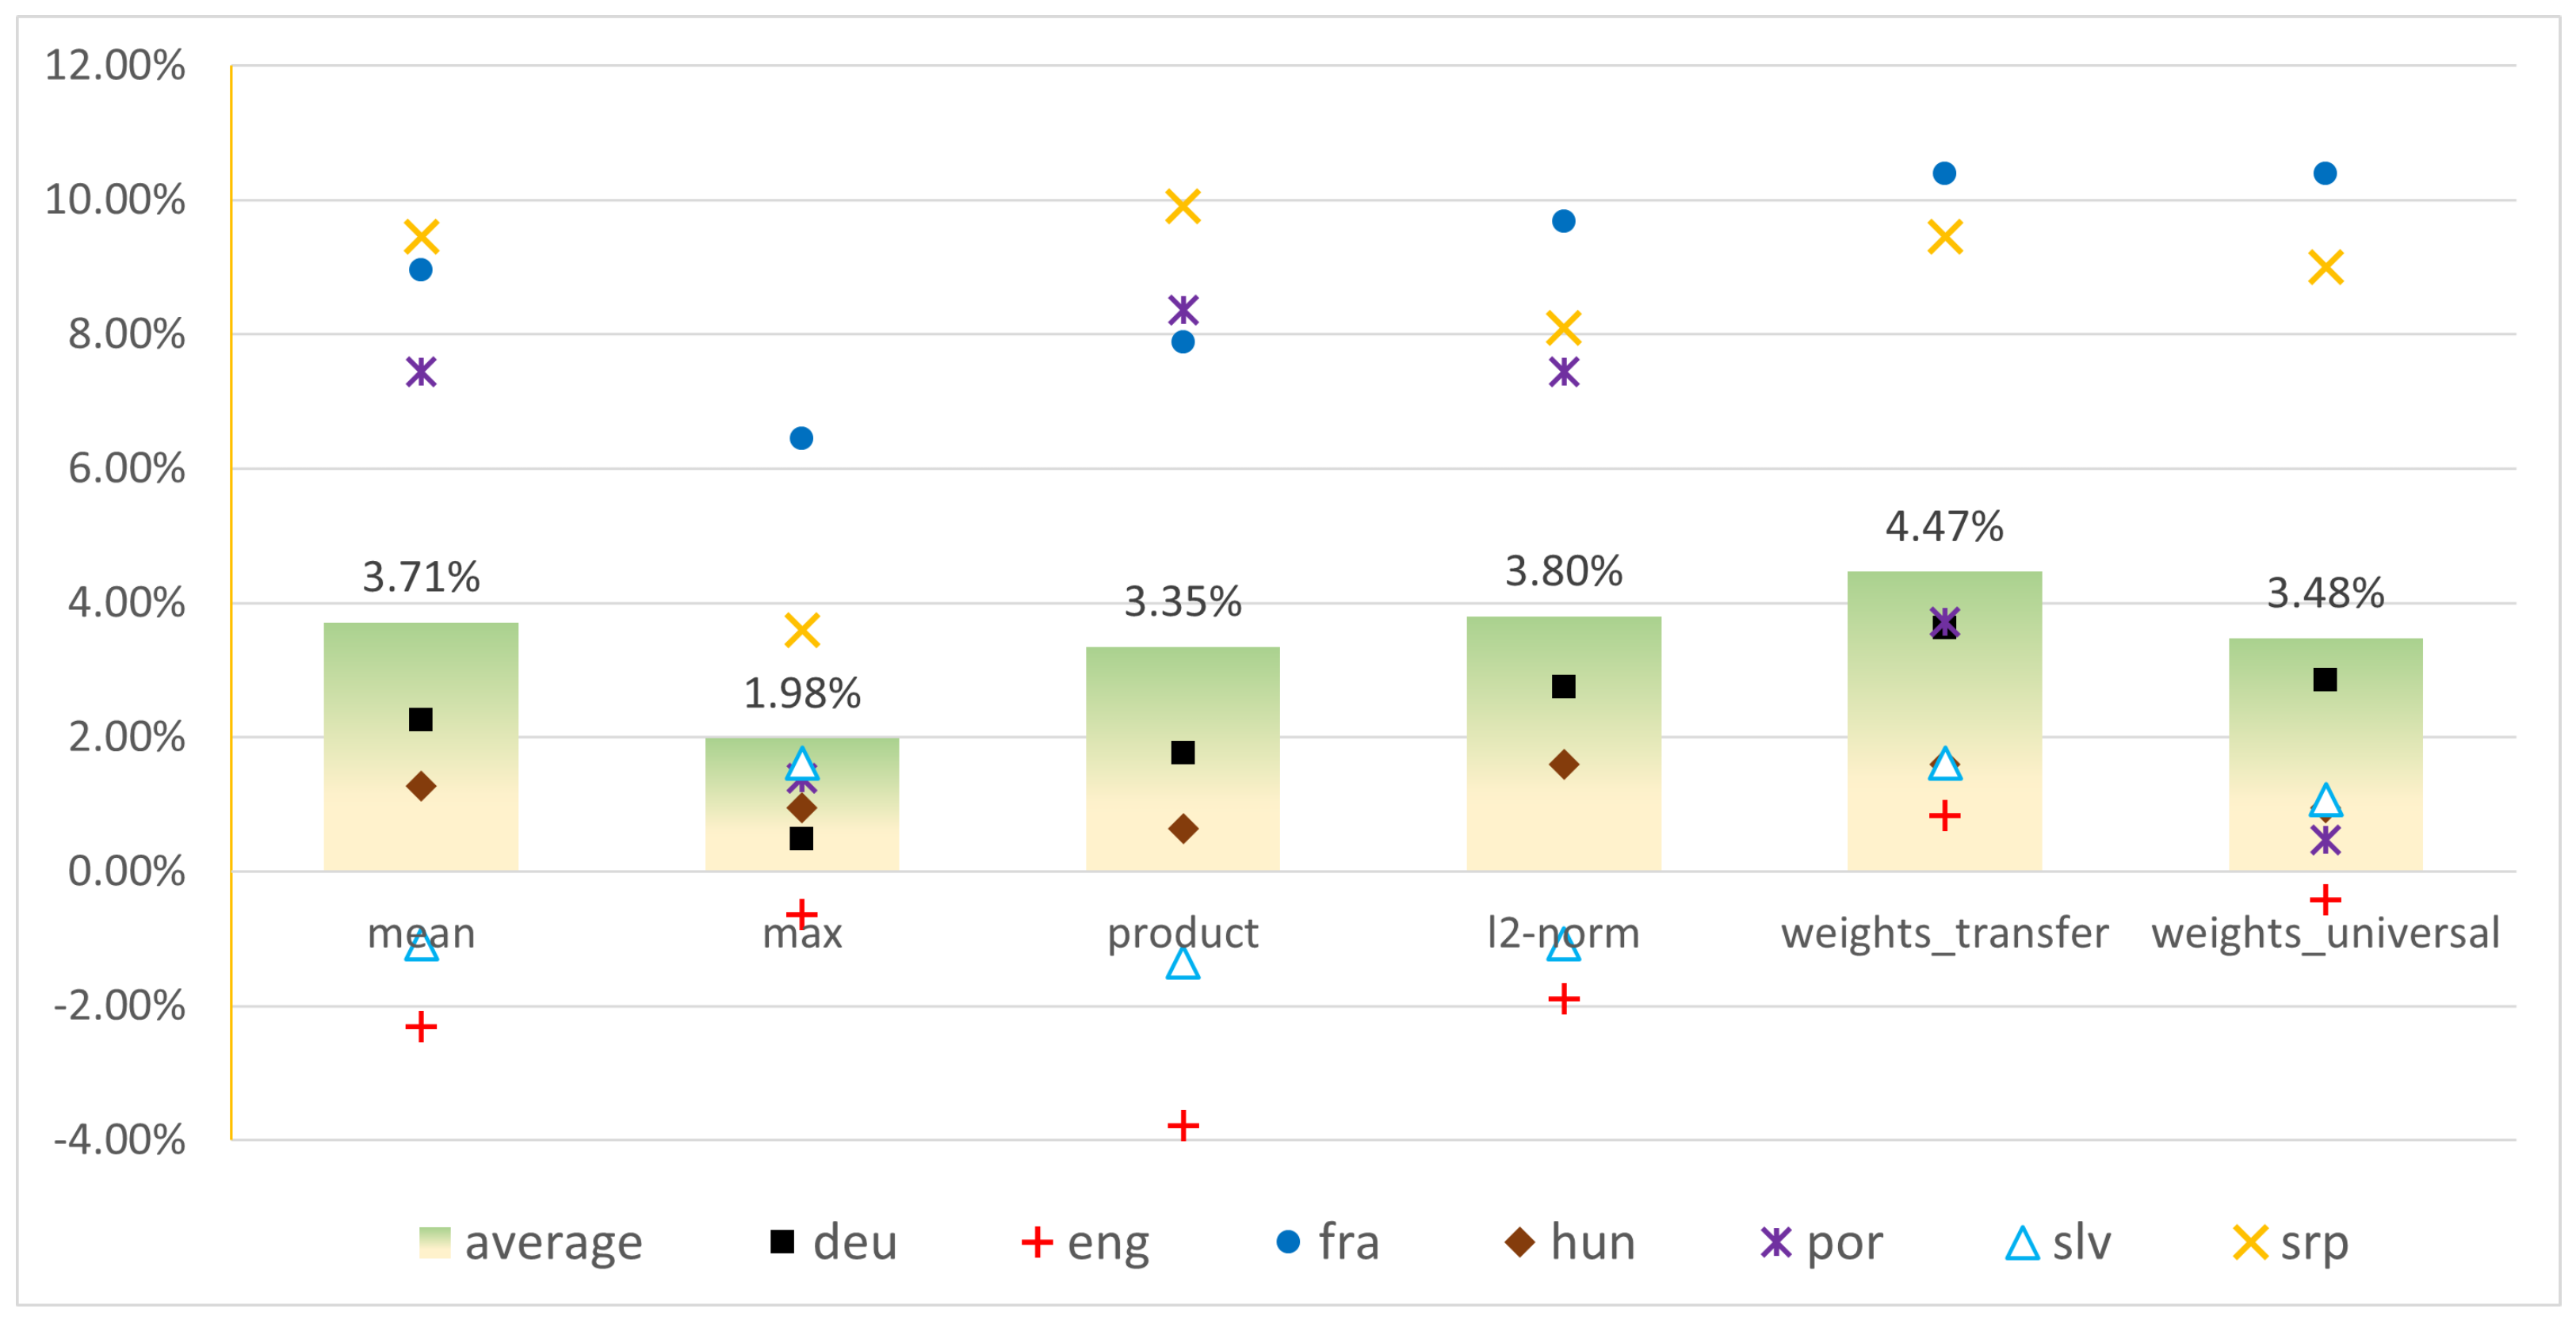


