Article

A Nonparametric Approach for Testing Long Memory in Stock Returns’ Higher Moments

by
Massimiliano Giacalone
1,* and
Demetrio Panarello
2
1
Department of Economics and Statistics, University of Naples “Federico II”, 80126 Naples, Italy
2
Department of Statistical Sciences “Paolo Fortunati”, University of Bologna, 40126 Bologna, Italy
*
Author to whom correspondence should be addressed.
Mathematics 2022, 10(5), 707; https://doi.org/10.3390/math10050707
Submission received: 5 February 2022 / Revised: 18 February 2022 / Accepted: 21 February 2022 / Published: 24 February 2022
(This article belongs to the Special Issue Nonparametric Statistical Methods and Their Applications)

Abstract

:
In this paper, by considering a model-based approach for conditional moment estimation, a nonparametric test was performed to study the long-memory property of higher moments. We considered the daily returns of the stocks included in the S&P500 index in the last ten years (for the period running from the 1st of January 2011 to the 1st of January 2021). We found that mean and skewness were characterized by short memory, while variance and shape had long memory. These results have deep implications in terms of asset allocation, option pricing and market efficiency evaluation.

1. Introduction

The concept of long memory, also known as long-range dependence or self-similarity of a time series, is related to the persistency of the auto-correlation function. Briefly, it describes whether and how much past events influence the future evolution of the time series.
One of the first studies demonstrating the existence of such phenomenon in real time series data was published by [1]. Later on, Ref. [2] developed the Fractional Brownian motion, a type of stochastic process that incorporates the concept of self-similarity.
In econometrics, Ref. [3] was the first to show that economic time series also share long memory. In financial economics, instead, Ref. [4] presented one of the first studies questioning about the presence of long memory in the stock market. The presence of long memory in stock returns has important implications in finance. For instance, portfolio decisions may become extremely sensitive to the investment horizons [5], the pricing of options under standard assumption is not anymore reliable [6] and the same applies to traditional tests of market efficiency that are no longer valid for time series affected by self-similarity.
Since the outstanding work by [4], hundreds of papers have been focusing on testing the long-memory property of stock returns, developing ad hoc econometric methods for more accurate estimation and forecasting (e.g., [7,8]). Starting from [9], researchers began to investigate whether or not the conditional variance of stock returns is affected by long memory.
Overall, the empirical evidence about long memory in stock markets is mixed. This is especially true concerning returns (i.e., first moment) rather than volatility (i.e., second moment). Indeed, Ref. [4] found positive evidence for most of the stocks included in the NYSE. Similarly, Refs. [10,11] found evidence favorable to short-term dependence. However, in a further study that was published shortly later, Ref. [5] provided empirical evidence against the presence of long memory, gained by means of improved test statistics. Later on, Refs. [12,13,14,15,16] found similar evidence. Nevertheless, favorable evidence was provided by [7], as well as by [17,18], concerning the stock market; by [19], for commodities; and by [20], for cryptocurrencies. These examples suggest that there is mixed evidence about the presence of long memory in the first moment, with a strand of literature that claims stock markets to be characterized by long memory and another one that does not. Conversely, on the side of volatility, the academic literature is rich with articles proving the existence of self-similarity; see [8,21,22,23,24,25] for some examples.
Scholars questioned why it is common to find long memory in economic time series. The authors of Ref. [26] investigated whether the observed evidence of long memory is due to nonstationarity in the long period. Nowadays, structural breaks seem to be the most important cause of long memory. In this respect, considering volatility, Ref. [27] discussed the possibility that occasional structural breaks generate long memory in the time series. Similarly, Ref. [28] found that the time series in the sample showing long memory experienced several breaks; moreover, they showed the absence of long memory in the volatility processes after accounting for breaks.
Despite the relevance of higher-order moments in finance is, nowadays, quite well understood (see, e.g., [29,30,31,32]), no scholars, to the best of our knowledge, have studied the long-memory property of conditional skewness and shape yet.
Testing long memory in conditional higher moments is relevant in portfolio selection [31,32,33] and efficient market testing [34]. For example, it is well known that rational investors prefer assets showing high skewness and low shape [35]. If their values change over time, as it usually is [36,37,38,39], investors need to closely monitor their over-time fluctuations to be better off.
Through this paper, we aim at testing the existence of long memory in conditional higher moments, by using all the time series of stocks currently quoted in and delisted from the S&P500 Index. In particular, we consider a nonparametric frequency domain test for long-range dependence [40], focusing on the most relevant higher-order moments in finance, i.e., skewness and shape.
The first step in our analysis consisted in the estimation of the time-varying values of skewness and shape. To this aim, we considered the generalized autoregressive score (GAS) model by [41]. Despite the existence of several statistical methods that can be used for estimating conditional higher moments (e.g., see [38]), the GAS became very popular due to its flexibility (currently, there are more than 250 published papers that use the GAS for modeling conditional moments and/or time-varying distribution parameters (see http://www.gasmodel.com/gaspapers.htm, accessed on 12 February 2022)). Indeed, by using the density score for updating the time variation in the distribution parameters, there is a large set of probability distributions that can be chosen a priori for modeling. Moreover, many well-known processes, such as the GARCH, are special cases of the GAS [41].
Once the variation in higher moments over time is exploited, a statistical procedure for long-memory testing also needs to be defined. In this respect, Ref. [40] recently developed an elegant and simple nonparametric test for long-range dependence by considering the frequency domain representation of the time series. Such test is more robust than alternative tests in terms of size, when the time series are not Gaussian [40]. This is the case of stock returns and market indices, as well as new financial assets such as cryptocurrencies (see, e.g., [42,43,44,45,46,47,48]).
The remainder of this paper is structured as follows: Section 2 describes the methodological framework related to both time-varying moment estimation and long-memory testing procedure. Section 3 contains details about the data used in our analysis, consisting of several time series taken from the S&P500 index. Section 4 provides the main results from the long-memory test. Finally, Section 5 offers some concluding remarks.

2. Methodology

2.1. Conditional Moments Estimation

In order to estimate the time variation in stock returns’ higher moments, we made use of the generalized autoregressive score (GAS) model [41]. The GAS model considers the score of the data density function as the main force behind the variation in the distribution parameters’ values over time.
Let y t be a time series generated by the following observation density function p ( · ) :
y t p ( y t | f t , F t ; θ n ) ,
where θ n is a vector of static parameters, F t is the information set at time t and f t is a vector of length J ( j = 1 , , J ) of time-varying parameters depending on the probability distribution specification. The model’s information set at a given point in time t, denoted as F t , is obtained by the previous realizations of the time series y t and the time-varying parameters f t .
In this context, the role of the time-varying parameters’ vector f t is crucial, as it contains the measures used to proxy the time variation in the distribution’s higher moments.
Let us suppose, for simplicity, that the time series are generated by a Gaussian density Y N μ t , σ t 2 . Therefore, each n-th time series has the following predictive density:
p ( y t | f t , F t ; θ ) = 1 σ t 2 π e y t μ t 2 y t μ t 2 2 σ t 2 2 σ t 2
where the J = 2 time-varying parameters are f t = ( μ t , σ t 2 ) . The G A S ( 1 , 1 ) , for any specification of the density in (1) can be written as
f j , t = ω j + A j , 1 s j , t 1 + B j , 1 f j , t 1
where ω j is a real vector and A j , 1 and B j , 1 are diagonal matrices. All the scalar parameters ω j , A j , 1 and B j , 1 are collected in the vector θ . An appealing feature of the GAS model is that the vector of parameters θ n is estimated by maximum likelihood (for the details, see [41]). Moreover, s j , t is the scaled score of the conditional density (1) at time t with respect to a j-th parameter of the time series.
Clearly, the choice of the underlying probability distribution in (1) is very important, since it changes the kind of score considered in (3), thus the considered GAS model. The scaled score s j , t is given by
s j , t = S j , t · j , t
where j , t is the conditional j-th score at time t for the n-th time series, computed as
j , t = log p ( y t | f t , F t ; θ n ) f t
and S j , t is a scaling matrix of appropriate dimension that is usually given by the inverse of the Fisher information matrix, as follows:
S j , t = E j , t j , t 1
The aforementioned approach is the standard GAS proposed by [41]. However, the identity matrix can also be considered (e.g., see [49]). Moreover, different GAS models can be used, for instance, by assuming a different scaling matrix S j , t .
Considering the Gaussian distribution, the conditional score vector (5) is given by
n , 1 , t = ( y t μ t ) σ t 2 n , 2 , t = ( y t μ t ) 2 2 σ t 4 T 2 σ t 2
with j , t = n , 1 , t , n , 2 , t , where n , 1 , t is the conditional score for the first moment (i.e., the conditional mean) and n , 2 , t is the one for the second moment (i.e., the conditional variance). Therefore, the model’s variables and parameters are given by
f t = μ t σ t 2 , ω = ω 1 ω 2 , A = a 1 0 0 a 2 and B = b 1 0 0 b 2
Once the scores are computed, the parameters in (3) are estimated by maximum likelihood. Then, the conditional moments can be obtained by the in-sample predictions f ^ j , t as in Cerqueti et al. [39], namely,
f ^ j , t = ω ^ j + A ^ j , 1 s j , t 1 + B ^ j , 1 f j , t 1
Nonetheless, assuming a Gaussian distribution in this framework only allows us to study the long memory of the first two distribution moments, while our aim is to study the long-memory property of the first four moments. Therefore, we consider the Skew-t distribution by [50], characterized by the following density:
p ( y t | f t , F t ; θ ) = 2 γ t + 1 γ t Γ ν t + 1 2 Γ ν t 2 ( π ν t ) 1 / 2 σ t 1 × 1 + y t μ t 2 ν t σ t 2 1 γ t 2 I [ 0 , ) y t μ t + γ t 2 I ( , 0 ) y t μ t ( ν t + 1 ) / 2
where μ t is the location, σ t the scale, ν t the degrees of freedom and γ t the skewness. The thickness of the distribution’s tails is determined by the parameter ν t , while γ t determines the amount of mass on both sides of location μ t .
Hence, we use the GAS model to obtain estimates of the time series of the parameters in (8). Then, based on such estimates, we test for long memory.

2.2. Nonparametric Test for Long-Range Dependence

As previously mentioned, a frequency-domain nonparametric approach [40] is considered for testing short versus long memory.
Let us consider a stationary process Y t with a spectral density of some semi-parametric form as follows:
f ( λ ) = | λ | 2 d g ( λ )
where 0 d < 1 / 2 and g is an even, positive, continuous function on λ [ π , π ] . We can affirm that the process Y t does not show long memory, if d = 0 , such that the spectral density is continuous in [ π , π ] . Conversely, we say that the process has long memory if 0 < d < 1 / 2 , such that the spectral density is unbounded at zero.The authors of Ref. [40] start from the well-known fact that, if Y t are weakly dependent stationary processes, the normalized periodogram is asymptotically exponentially distributed.
I n λ j f λ j d E , as n
with I ( λ ) being the periodogram as follows:
I ( λ ) = 1 T t = 1 T Y t e i λ t 2
that is, a consistent estimator for the spectral density of the time series under the absence of long memory. By estimating f λ j as the sample average of the periodograms, the test statistics is given by [40]
Q n , m ( s ) = j = 1 s I λ j 1 m i = 1 m I i λ j
The authors of Ref. [40] showed that the statistics converges in distribution to Gamma with parameters ( s , 1 ) , i.e., Q n , m ( s ) Γ ( s , 1 ) .
Since the procedure involves sample splitting, m represents the number of sub-samples, each of length , and s is the number of frequencies included in the test. Clearly, m and increase along with sample size T, such that m = T / . According to the authors’ suggestion, in what follows, we consider m = T .
Moreover, we note that the choice of s, which is crucial for testing, depends on the sample size T. Indeed, for short time series, it is possible to build sub-samples characterized by very short length , so few frequencies are appropriate for describing whether or not the time series is characterized by long memory. In the case of particularly long time series, Ref. [40] recommends s 5 for T = 5000 and s 10 for T = 10,000.

3. Data and Descriptive Statistics

In order to study the long-memory property of the returns’ higher moments, we collected data about a large set of stocks. Particularly, we considered the daily time series of the 500 constitutes belonging to the S&P500 index in the period going from 1 January 2011 to 1 January 2021.
In order to facilitate the presentation of the results, we grouped the stock returns into 11 industrial sectors. The main descriptive statistics by sector are presented in Table 1.
From Table 1, we can observe that the groups have different characteristics. For example, the cluster related to the Energy sector is the one with the lowest (negative) average return and a relatively high variance. The Utilities and Financial sectors are characterized by a very similar mean and a markedly different volatility. Moreover, the Information Technology (IT) sector is the one with the highest number of stocks (75), as well as the highest average return over the considered period.
Clearly, within each group there is also a certain degree of heterogeneity. Indeed, Table 1 shows the average descriptive statistics by group, that is equivalent to considering the statistics related to an industry portfolio based on equal weighting. However, industry portfolios are only presented for the sake of exposition simplicity.
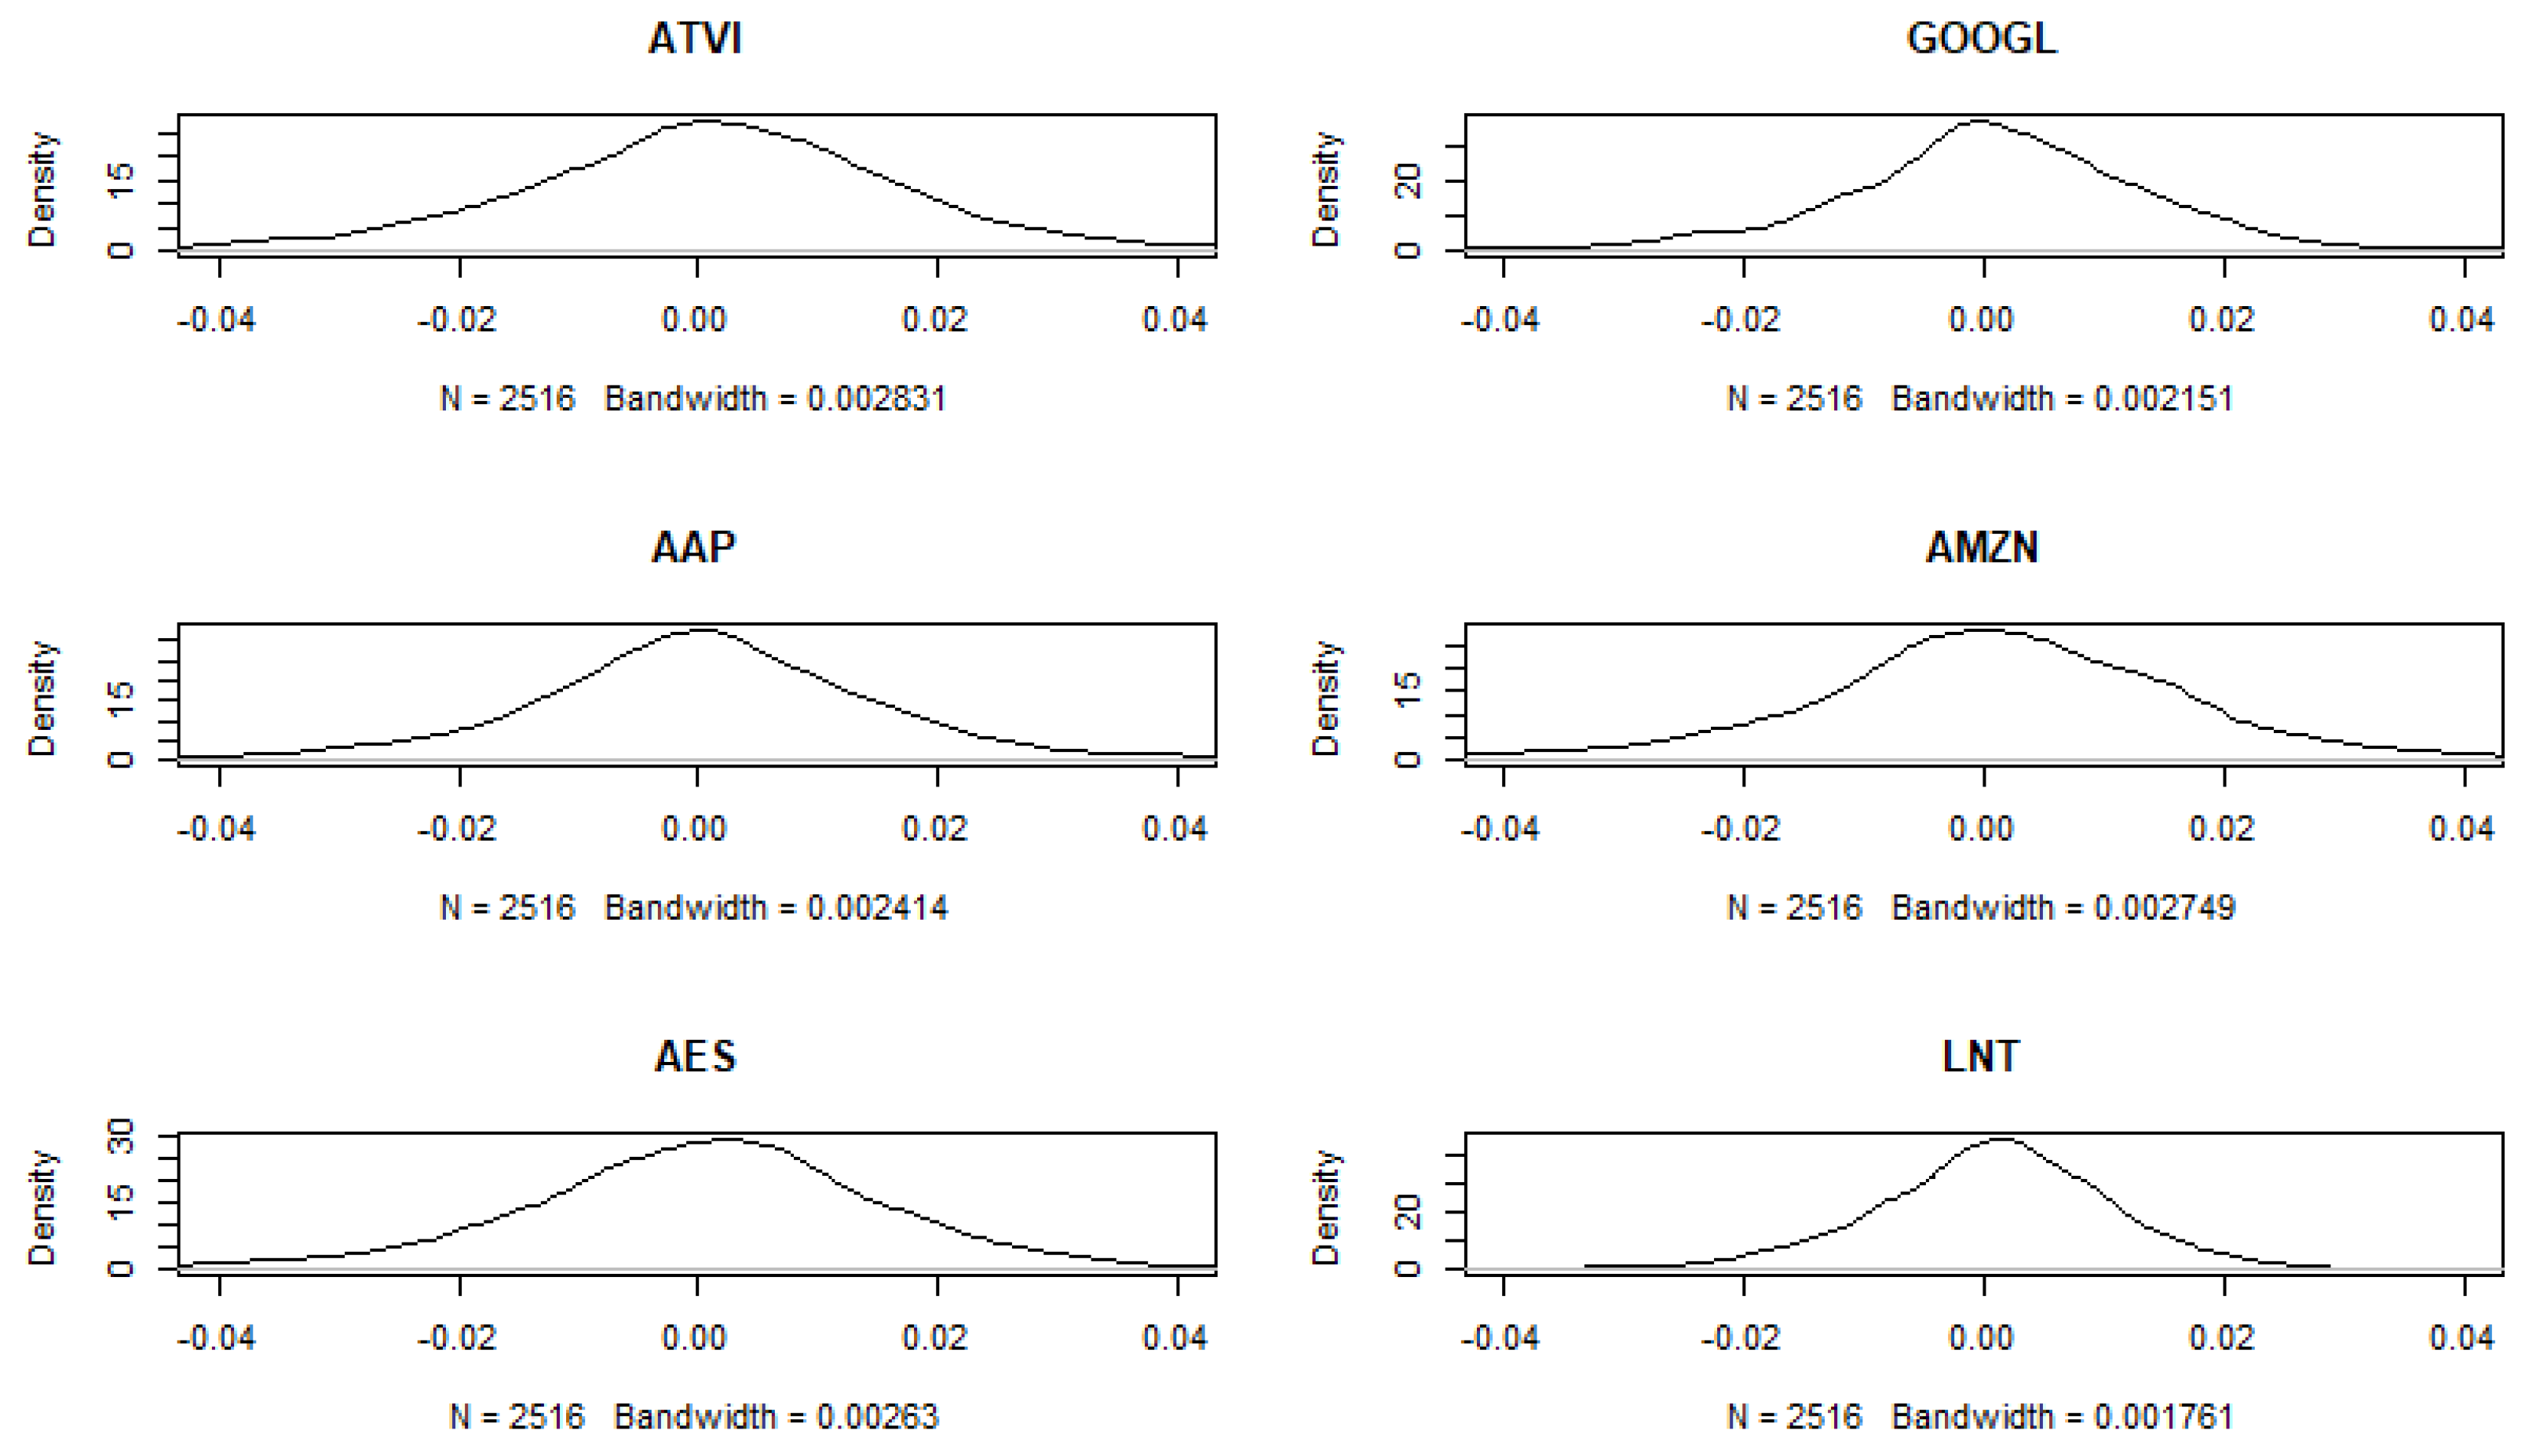
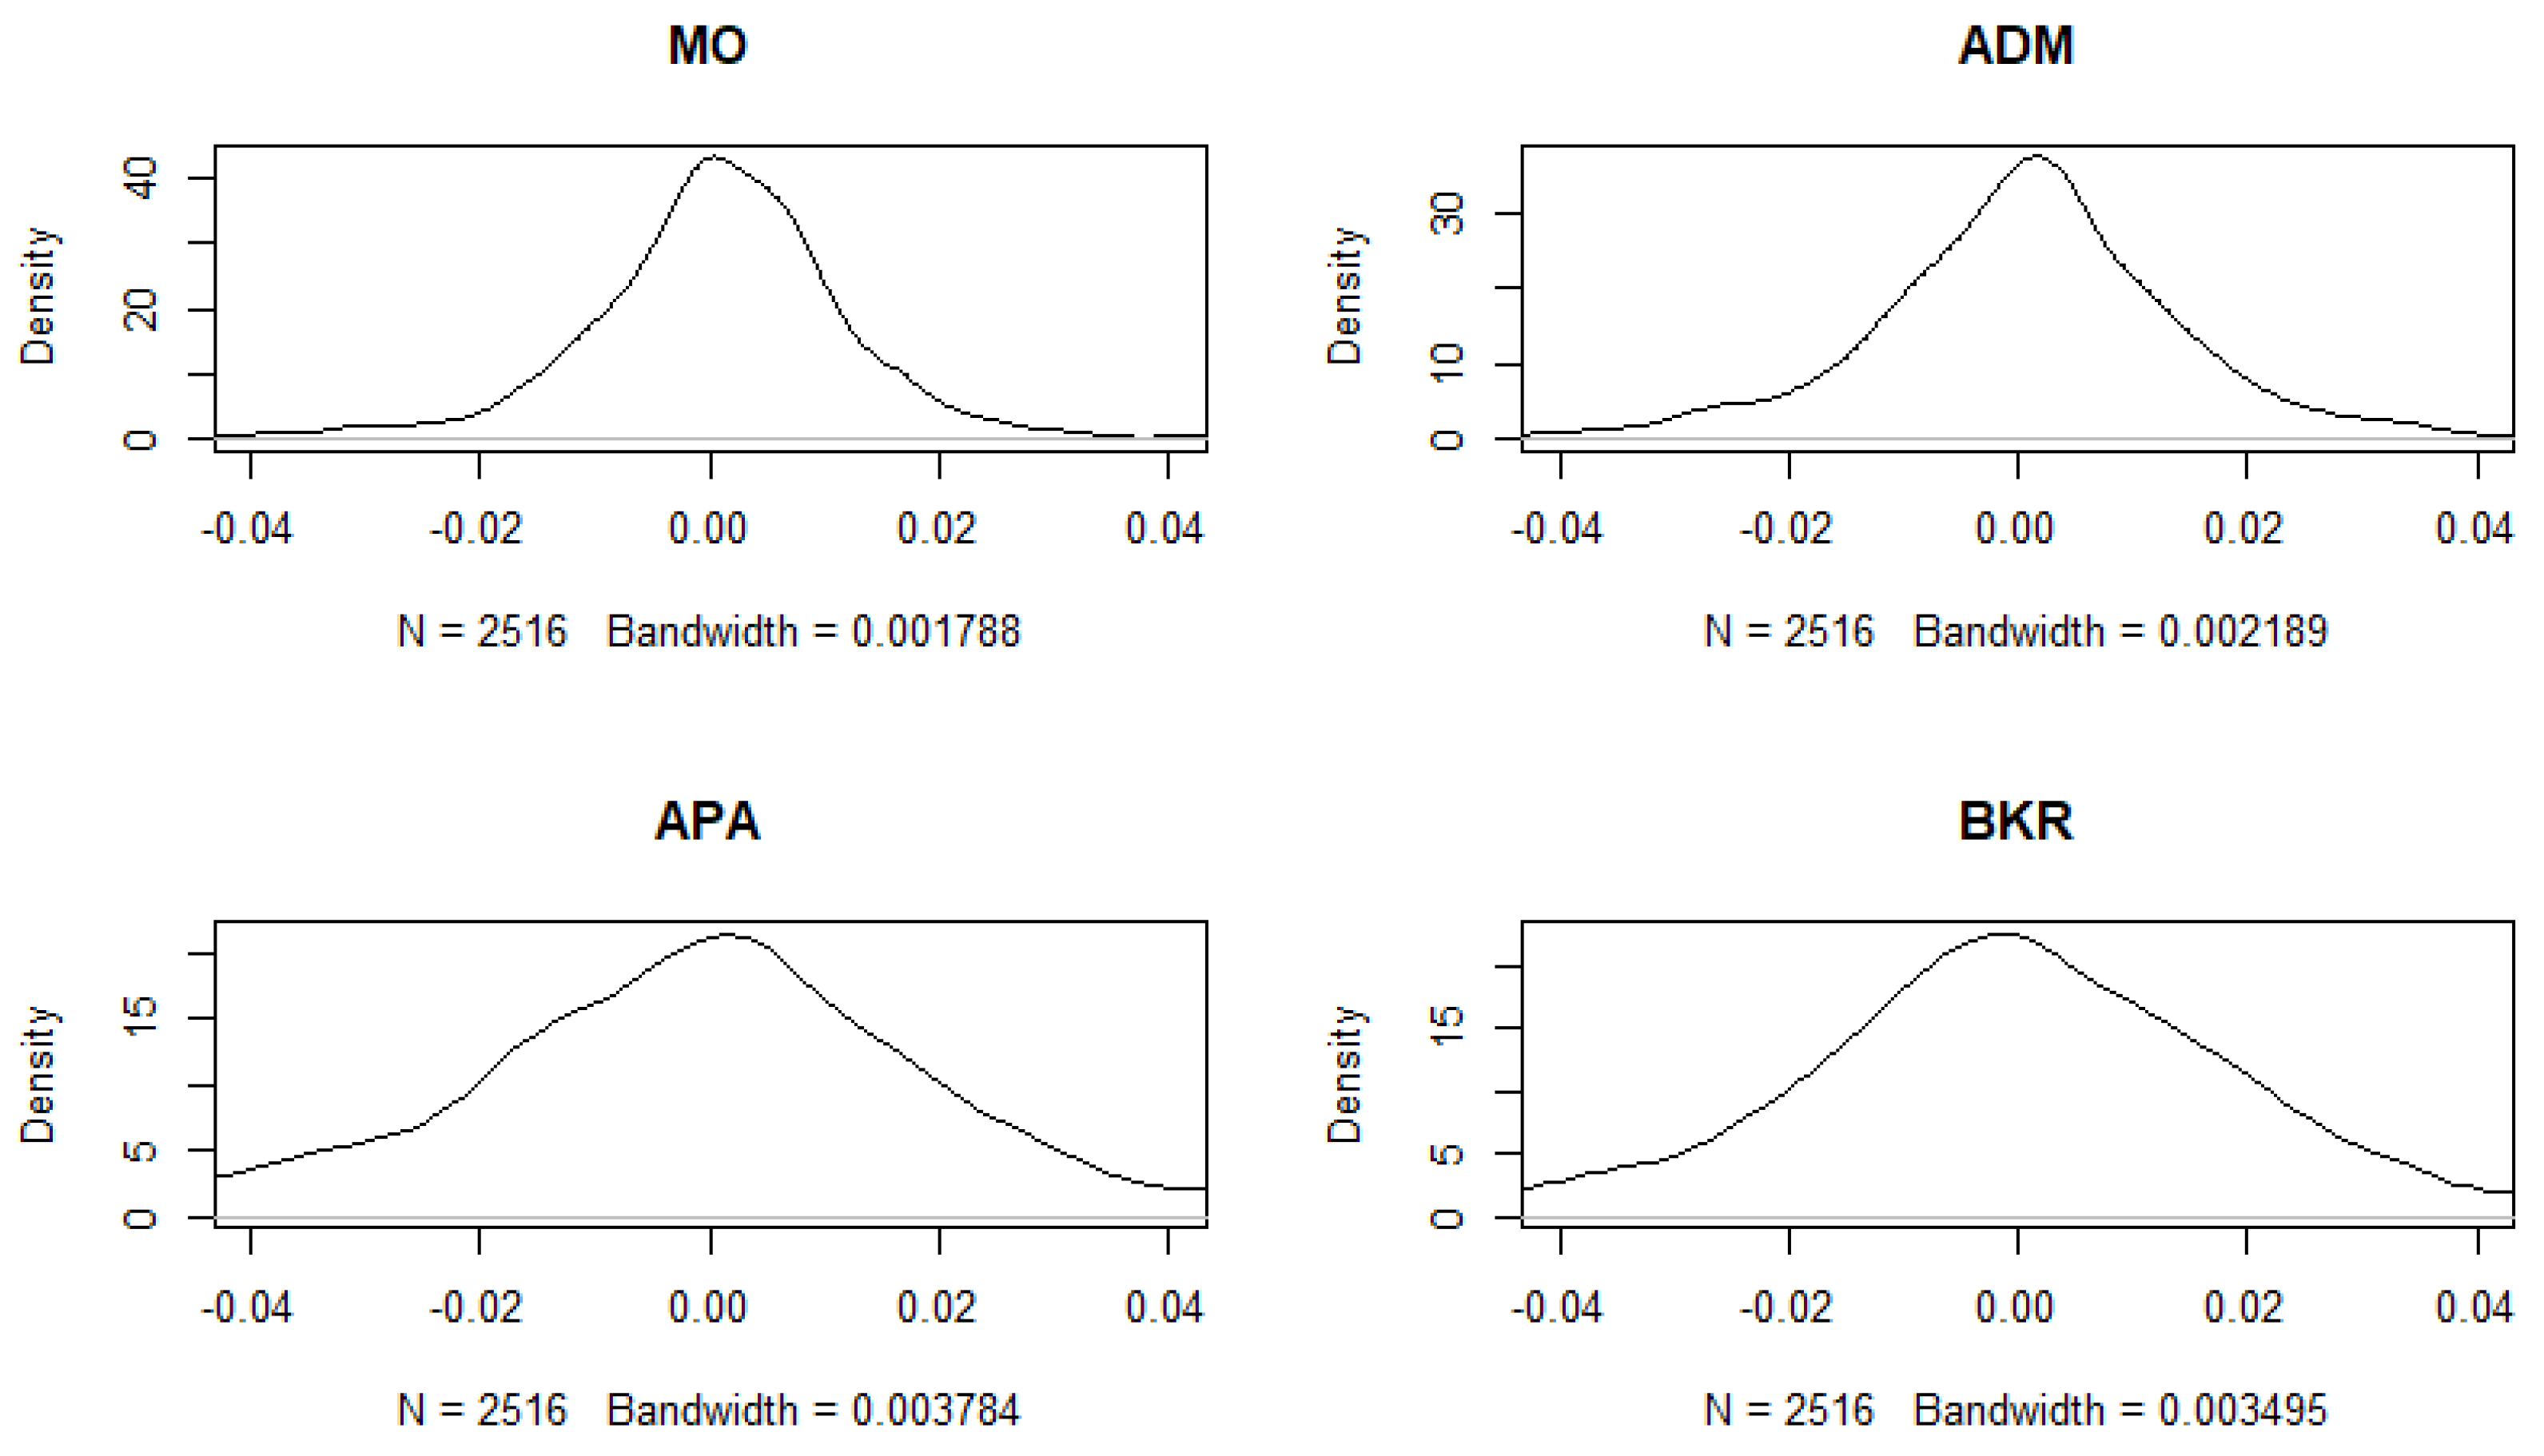
To show the degree of heterogeneity in the stock returns’ distribution, we show the empirical density of N = 2 randomly selected stocks for each group (see Figure 1, Figure 2, Figure 3 and Figure 4).
It is evident that the empirical distributions are not normally distributed, since they are asymmetric and heavy-tailed. This justifies the opportunity of modeling the stock returns according to a probability distribution that accommodates such features [48,51]. In doing so, it is relevant to investigate whether these higher moments, that are time-varying [37], are characterized by short- or long-memory processes.
Hence, as explained in the previous section, we estimated the conditional moments by means of the GAS model. To provide some examples, Figure 5 shows the estimated time-varying moments for the IBM stock (IT sector), while Figure 6 illustrates those for JPM (Financial sector).
It appears clear that, for both stocks, the time-varying skewness evolved over time with a pattern similar to the one of the conditional mean, while shape showed a time variation similar to that of conditional variance. These features hold true for all the stocks in the considered sample; however, we cannot show them all, given the very large sample size.

4. Main Results

As previously stated, in order to facilitate the analysis, in what follows, we describe the results of the long-memory test by sector-based groups of stocks. The tables are reported in the Appendix A.
Table A1 shows the nonparametric long-memory results for mean, variance, skewness and shape time series in the case of the Industrial sector.
Table A1 highlights that most of the stocks belonging to the Industrial sector had short memory in the conditional mean, since only 15% of stocks showed long memory. Therefore, we can argue that the Industrial sector stocks confirmed previous literature findings in terms of absence of long memory. Conversely, in terms of conditional variance, the results are different. Indeed, the majority of stocks (61%) showed long memory in the variance, confirming the findings of a substantial body of research.
The results concerning skewness and shape are the main novelty introduced in the present paper. For the whole set of stocks, skewness showed a time pattern similar to the one of the conditional mean; therefore, we did not expect to find long memory in conditional skewness. By looking at Table A1, we can observe that 51% of the stocks showed short memory in the skewness. Here, the evidence is mixed and it is not straightforward to obtain a conclusion within this group of stocks. On the side of conditional shape, instead, the evidence is clear, with 97% of the stocks showing long memory. This happens because the behavior of the shape time series is similar to the one of conditional variance, making it reasonable to assume a sort of “conditional shape clustering” in the returns’ time series.
Table A2 shows the results for the Health Care sector stocks. In the analysis of the results, we are interested in confirming those of Table A1. For this group of stocks, as expected, we observed similar results in terms of long memory in higher moments.
More in detail, in terms of the conditional mean, we found that 95% of stocks were characterized by short memory. Therefore, the evidence suggesting the absence of long memory for the conditional mean is much stronger for these stocks than for those in Table A1. In addition, in terms of conditional variance, the results do not change; the majority (66%) of the stocks showed long memory in the variance, again confirming the results of earlier research.
Moving on to skewness, instead, the results are different. Indeed, while Table A1 shows mixed evidence, Table A2 suggests that most of the stocks in the Health Care sector (60%) had long memory in conditional skewness. Nevertheless, in terms of conditional shape, only 10% of the stocks showed short memory, hence confirming the idea that the presence of long memory in shape can be explained by the fact that conditional shape and variance behave in a similar manner.
These results show that, despite an overall picture, there is a certain degree of heterogeneity within the groups.
Table A3 shows the results for the Information Technology stocks. For this group, the conclusions highlighted in Table A1 and Table A2 also hold. Indeed, most of the stocks in Table A3 had short memory in the conditional mean (about 83%) and long memory in the conditional variance (65%).
In terms of conditional skewness, there is mixed evidence here as well, with slightly more than half (56%) of the stocks showing long memory. On the contrary, we confirm that most of the stocks (91%) were characterized by long memory in conditional shape.
Table A4 reports the results for the Communication Services stocks. In this case, some results are different than the previous ones.
As regards the conditional mean, most of the stocks (about 85%) showed short memory, while 77% of them were characterized by long memory in variance.
In terms of conditional skewness, we found that 62% of the stocks had long memory. Hence, Communication Services stocks differed from those belonging to the Industrial, Health Care and IT sectors. In terms of conditional shape, however, the results are similar, with 96% of the stocks showing long memory.
We present the results for the Consumer Discretionary sector in Table A5. For this cluster, a larger amount of stocks showed long memory in the conditional mean (22%); nonetheless, as in the aforementioned groups, most stocks appeared to be characterized by short memory. Considering the conditional variance, we found that about 79% of the stocks were characterized by long memory.
The long-memory nonparametric tests for conditional skewness, instead, provided mixed evidence, since 56% of the stocks in this group showed long memory. As regards shape, however, we still found that a huge amount of stocks (95%) had long memory.
Table A6 shows the results concerning the stocks belonging to the Utilities sector. In this case, we have strong evidence suggesting that the considered moments had long memory. Indeed, while only 4% of the stocks showed long-range dependence for the conditional mean, for the majority of stocks, we were led to reject the null hypothesis of short-memory processes for the other conditional moments.
Indeed, according to Table A6, we found that 96% of the stocks showed long memory in the variance, 68% in the skewness and 93% in the shape.
The case of the Financial sector stocks is shown in Table A7. In this group, only 9% of the stocks had long memory in the conditional mean process, while about 89% of them showed long memory in conditional variance. Conditional skewness showed, instead, mixed results, with half of the stocks having been characterized by short memory. The outcomes related to conditional shape show that over 92% of the stocks had long memory.
In light of this evidence, while stock returns were mainly characterized by short (for the mean) and long (for variance and shape) processes, the case of skewness deserved deeper investigation.
The results from Table A8, related to the Materials sector, suggest that skewness did not show long memory for most of the stocks (68%) and the same applies to the mean (86%). On the other hand, conditional variance and shape showed long memory with a proportion of 71% and 100%, respectively.
The conditional skewness results shown in Table A8 are very different from those presented in the previous tables; they suggest that, on average, stocks from the Materials sector showed short memory in the skewness process. This fact highlights the heterogeneity across business sectors.
The following table (Table A9) presents the results for the Real Estate sector.
Overall, Real Estate stocks showed short memory in the mean process (only 7% of them led us to reject the null hypothesis of the presence of long memory). However, as already seen as regards the Utilities sector, the majority of stocks were characterized by long-memory processes for the other higher moments. Indeed, 79% of the stocks placed in the Real Estate group showed long memory in the variance, 72% in the skewness and 86% in the shape.
Hence, for this group, we found that, despite the skewness behaved similarly to the mean process, its time series was, on average, characterized by long memory.
The Consumer Staples stocks are reported in Table A10 below.
Consumer Staples stocks showed, again, short memory in the mean process (87%). However, higher moments were fully characterized by long-memory processes; most stocks showed long memory in the variance (68%), skewness (61%) and shape (97%).
The last group is based on the Energy sector stocks, the results of which are reported in Table A11.
The Energy sector presented some peculiarities. First of all, it is the business sector with the largest amount of stocks with long memory in the mean (around 35%). Still, the majority presented short memory in the conditional mean processes.
As regards the other higher moments, the time series proved to be characterized by long-memory properties, with 87% of the stocks showing long memory in the variance, 74% in the skewness and 96% in the shape.
A summary of the results, in terms of both averages and medians, considering all the business sectors taken into account, is provided in Table 2.
Medians were considered in order to account for possible outlier sectors, such as Materials (low proportion) and Real Estate (high proportion) concerning skewness, or the Energy sector concerning the mean. Averages and medians are, however, not particularly distant from one another.
Table 2 confirms the hypothesis that S&P500 stocks were characterized by a short-memory conditional mean process overall, while most of the stocks showed long memory in the variance. These two results are in line with the previous literature on the topic.
However, the most interesting results are those provided in the last two columns of Table 2. First, nearly all of the stocks showed long memory in the conditional shape. This can be explained by the fact that the shape patterns were similar to those characterizing the variance. Hence, if structural breaks can be seen as the cause of long memory in the variance, this could also hold true for the conditional shape.
Second, more than half of the stocks showed long memory in the skewness. This deserves deeper exploration, as this result is weaker than those concerning variance and shape, whose proportions were indeed much higher.

5. Conclusions

In this paper, we propose the use of the nonparametric test by [40] to study the long-memory property of stock returns’ conditional moments. To this aim, we analyzed the daily returns of the S&P500 constitutes during the last 10 years (from 1 January 2011 to 1 January 2021).
We estimated the conditional moments by means of the GAS model by [41], a model-based approach in which the time variation in the distribution parameters is driven by the score of the specified distribution density function.
In order to account for skewness and tails’ behavior, we considered the generalized Skew-t distribution by [50]. After estimating the moments’ time series, we tested for long memory by using the nonparametric frequency-domain approach proposed by [40].
The results indicate that most of the S&P500 stocks were characterized by a short-memory conditional mean process and long memory in the variance, confirming the findings of earlier research on the topic.
In conclusion, our findings confirm that the nonparametric frequency-domain approach should be used in combination with classical time series methods for testing long memory.
Nevertheless, this paper adds noteworthy evidence with respect to the shape properties, finding that it was characterized by long-memory processes for most of the stock returns. As regards skewness, instead, the evidence is mixed. Therefore, we believe that further studies should be devoted to the analysis of conditional skewness.
Our findings are especially relevant in the context of asset allocation problems. Indeed, as noted by [32], predicting time-varying higher moments is crucial, since it allows for the so-called distribution timing, which is defined as the ability of using forecasts for moments up to the fourth one and is proved to generate significant incremental economic value to investors [32]. In this respect, if higher moments show long memory, it is possible to use appropriate statistical models for their prediction. Moreover, our findings represent a first step for the mathematical modeling of the stochastic behavior of conditional higher moments.

Author Contributions

Conceptualization, M.G. and D.P.; methodology, M.G. and D.P.; software, M.G. and D.P.; validation, M.G. and D.P.; formal analysis, M.G. and D.P.; data curation, M.G. and D.P.; writing—original draft preparation, M.G. and D.P.; writing—review and editing, M.G. and D.P.; visualization, M.G. and D.P. All authors have read and agreed to the published version of the manuscript.

Funding

This research study received no external funding.

Institutional Review Board Statement

Not applicable.

Informed Consent Statement

Not applicable.

Data Availability Statement

Not applicable.

Acknowledgments

The authors would like to thank Guest Editor Stefano Bonnini for his invitation to publish this feature paper in Mathematics. They also thank Raffaele Mattera for his valuable comments on the paper.

Conflicts of Interest

The authors declare no conflict of interest.

Appendix A

Table A1. Long memory nonparametric test: results for stocks belonging to the Industrial sector.
StockMeanVarianceSkewnessShape
IDTickerQ-Statp-ValueQ-Statp-ValueQ-Statp-ValueQ-Statp-Value
2AAL19.390.002.600.52106.720.00834.800.00
25ALK0.380.994.490.171.910.7043.090.00
27ALLE0.051.0017.020.001.790.73280.220.00
32AME0.191.001.950.690.031.00846.440.00
41AOS0.470.9930.050.008.410.01514.980.00
55BA2.630.51341.480.002.170.63122.040.00
76CARR1197.310.000.261.0079.860.0043.250.00
77CAT356.690.00104.170.001.870.7114,056.860.00
90CHRW0.390.998.090.010.420.994,676,493.630.00
100CMI134.920.006.030.064.500.1779.860.00
110CPRT0.700.9739.950.00164.060.00897.750.00
113CSX2.000.682.970.43101.930.00988.160.00
114CTAS0.221.008.750.011.720.759.610.00
123DAL2.230.6216.820.0023.260.002.230.61
125DE0.380.9916.610.00569.780.003,944,620.350.00
137DOV2.880.457.120.032.650.5137,981,286.370.00
152EFX0.131.009.440.003.030.425418.770.00
156EMR0.880.9425.130.001.930.7053.610.00
163ETN0.870.9414.280.002.160.6325,829.630.00
169EXPD0.440.999.160.01164.380.00205.360.00
174FAST0.121.002269.570.0025.300.003,294,249,843,584,581.000.00
176FBHS7.460.026.120.066.330.054847.750.00
178FDX1.600.7810.160.000.340.99153,756,604,383,877,056.000.00
192FTV0.161.00293.620.001.840.7226.710.00
193GD3.860.260.640.970.141.0037.020.00
194GE0.880.9450.910.00209.290.0028.000.00
200GNRC4.340.196.390.053.450.33290,470,898.760.00
208GWW0.041.002.940.440.091.00253,267.410.00
218HII0.720.968.610.019.490.008134.980.00
221HON0.051.002.430.561.840.723589.420.00
229HWM821.510.007.030.0371.740.0038,025.970.00
233IEX1.880.713.950.2542.200.002202.180.00
237INFO0.450.99140.010.0014.800.0095,396.690.00
244IR692.970.0010.590.007.730.028827.310.00
248ITW0.860.9449.750.00479.580.0090.310.00
250J1.800.732.470.556.910.0373,930.540.00
251JBHT0.081.009.620.002.100.654,100,854.840.00
252JCI0.540.981.320.8553.170.0049,691.690.00
268KSU1.500.8140.850.0010.100.0037,086,905.930.00
271LDOS9.300.00428.280.009.560.004078.810.00
275LHX1.240.875.540.090.211.00106.470.00
279LMT3.150.393.340.3567.940.0018,479.570.00
285LUV533.760.004.420.180.051.00607,402.710.00
293MAS1.420.831.870.710.201.009.370.00
307MMM1.270.8617.900.00993.300.00488.300.00
331NLSN5.410.095.990.0649.150.0014,949.030.00
332NOC1.810.730.560.9819.710.0030,549.280.00
336NSC1.530.8024.790.001.820.7319,050,673.080.00
347ODFL1.400.836.860.038.690.0151.170.00
352OTIS4.880.140.111.002.610.5216.140.00
357PCAR0.370.991.850.72222.780.0067,386,429.240.00
366PH7.910.0127.540.000.510.98521.890.00
373PNR1.070.91165.990.00516.890.00195.390.00
384PWR1.140.890.880.940.710.9622.610.00
394RHI52.180.002.970.430.211.0083,337.440.00
398ROK0.910.942.020.670.440.9922.880.00
399ROL0.470.9941.180.0035.740.0037,674,798,980.540.00
400ROP0.251.0016.680.001265.390.004782.850.00
402RSG0.950.931.630.782.280.60293,363,986.160.00
403RTX2.620.5156.570.00137.650.0028,007.850.00
412SNA0.321.007.240.02772.210.001,169,932.210.00
422SWK0.770.96112.950.000.231.0093.820.00
429TDG0.221.00373.460.004.840.14398.920.00
430TDY0.370.9968.680.000.890.94609.310.00
446TT2.200.622.190.6318.730.0051.960.00
450TXT1.240.8714.920.000.131.00403.950.00
454UAL0.390.9929.730.00518.490.0060.790.00
460UNP1.090.9015.960.002.870.4512,243.780.00
461UPS0.560.984.220.218.200.0112,253.660.00
462URI2.840.4623.390.0074.230.0026,727.200.00
470VRSK1.490.8122.060.0016.190.001,922,017.730.00
476WAB2.490.553.570.310.251.001.620.78
485WM0.350.993.620.302.460.5532,050,262,904.220.00
498XYL3.620.306.610.048.270.0122,587.860.00
Table A2. Long-memory nonparametric test: results for stocks belonging to the Health Care sector.
StockMeanVarianceSkewnessShape
IDTickerQ-Statp-ValueQ-Statp-ValueQ-Statp-ValueQ-Statp-Value
1A0.970.936.120.06105.670.00841,079,388.580.00
5ABBV24.860.0043.110.006.530.043682.110.00
6ABC0.520.9810.240.00108.280.008341.980.00
7ABMD0.530.9815.490.00109.000.0025.710.00
8ABT1.670.7660.630.00173.470.00190,949,740.360.00
24ALGN181.940.00251.730.000.780.954,750,3316,609,669.000.00
28ALXN0.111.001004.470.00753.840.0015,279.640.00
33AMGN1.560.798.800.0175.270.00420.890.00
39ANTM2.830.4634.580.000.870.942151.780.00
57BAX2.610.5111.830.0023.200.0010,111.260.00
59BDX0.770.962.580.524.110.229.400.00
61BIIB0.001.004.870.1420.110.001319.210.00
62BIO3.320.3613.660.00123.320.0016,644,212,815,952,544.000.00
68BMY0.241.0013.710.000.700.97642,853,886,634,605.000.00
70BSX0.281.000.001.0025.140.000.241.00
75CAH0.340.997.700.020.380.99135,912,232,695.160.00
86CERN0.011.0014.020.000.880.94140,223,765,921.390.00
92CI0.550.98227.470.002.900.451469.980.00
102CNC0.510.9839.770.003.230.37142,257.200.00
106COO0.291.006.480.041.690.7647,335,590.740.00
115CTLT2.910.4427.190.008.530.01152,172,724.910.00
119CVS2.630.515.630.080.560.981221.330.00
128DGX1.810.734.280.200.900.9496,007,333.510.00
130DHR0.660.9712.230.002.390.5726,723.560.00
144DVA0.001.00120.360.0010.710.00186,548.110.00
147DXCM0.201.003.420.342.350.585442.550.00
167EW1.430.8322.520.001.000.9220,838.720.00
195GILD0.081.0023.890.0030.950.001,055,355.570.00
213HCA0.131.0016.120.00185.600.001.880.71
220HOLX1.930.702.180.631.510.81148.080.00
225HSIC0.750.965.690.0835.080.00114.840.00
228HUM2.920.4417.910.00283.550.0022.550.00
232IDXX1.400.8359.240.0011.880.00997,701.950.00
235ILMN0.171.0048.870.00141.300.0082,783,148,014,973,681,664.000.00
236INCY0.211.00668.290.001.340.85556,364,652.250.00
243IQV2.840.4649.710.0067.130.002215.750.00
246ISRG1.040.910.181.00544.340.000.051.00
254JNJ1.590.782.230.61103.320.001016.690.00
274LH0.700.97345.630.002.090.65130.210.00
278LLY0.221.0063.670.00194.520.00747,225.920.00
296MCK0.610.9845.090.002.690.506831.380.00
299MDT1.790.730.400.99121.330.001,640,410,921.560.00
313MRK0.950.938.500.01168.780.000.131.00
320MTD3.110.405.950.0640.660.009,601,115.420.00
362PFE5.260.104.350.19110.470.00151.170.00
369PKI0.021.006.810.0314.710.0012,416.890.00
378PRGO1.150.893.420.34102.300.0011,780.070.00
392REGN1.060.9159.600.0044.370.000.011.00
397RMD0.660.973.930.251.900.7016,150,481,436.890.00
418STE0.041.0035.830.001.700.761452.730.00
425SYK0.041.0034.840.00150.530.008744.730.00
434TFX0.940.9315.400.002.550.539592.070.00
437TMO0.410.9972.370.000.201.00844.850.00
456UHS0.031.001.240.870.321.000.281.00
458UNH0.730.964.740.15320.080.00437.510.00
472VRTX0.191.003.580.311.250.871,838,838,485,805,622,347,462,806.000.00
474VTRS1.260.8739.470.0012.600.0031,779,637,199.410.00
477WAT0.470.9923.140.007.150.03843,850.130.00
490WST1.150.893.790.272.440.56552.130.00
497XRAY0.460.999.830.00118.460.0017,242,480.930.00
500ZBH6.880.035.700.0840.000.0055,839.610.00
503ZTS5.540.0939.060.0021.860.0029,206.430.00
Table A3. Long-memory nonparametric test: results for stocks belonging to the Information Technology sector.
StockMeanVarianceSkewnessShape
IDTickerQ-Statp-ValueQ-Statp-ValueQ-Statp-ValueQ-Statp-Value
4AAPL0.271.0014.420.002.650.51806,704.860.00
9ACN0.051.004.130.2228.100.0081,229.800.00
10ADBE1.180.886.090.0644.040.002215.620.00
11ADI0.590.9828.090.005.540.093465.600.00
13ADP0.071.0037.670.003.100.40621.400.00
14ADSK1.200.882.470.550.420.99555.460.00
22AKAM0.930.935.650.0817.180.000.001.00
29AMAT14.950.007.840.02158.390.00162.530.00
31AMD235.710.0098.950.007.440.02857,785,903,381,856.000.00
37ANET0.460.9921.050.0029.950.002.490.55
38ANSS0.041.0010.500.000.161.00976.270.00
44APH2.830.463.930.255877.730.00200,425,249,067.640.00
50AVGO1.940.693.220.385.500.093029.970.00
69BR1.450.820.540.985.310.103.730.28
83CDNS32.930.000.820.956.410.05574.110.00
84CDW4.090.2213.500.0034.540.00168.150.00
111CRM1.180.881.880.713.570.31274,433.660.00
112CSCO1.170.8969.560.002.370.5827.530.00
116CTSH1.520.8015.920.00326.220.0094,814.790.00
118CTXS0.450.997.380.020.031.00217,336,217.270.00
146DXC2.620.511113.920.000.101.005938.110.00
157ENPH218.990.00326.290.00337.150.001785.690.00
180FFIV7.170.030.750.9635.920.000.011.00
181FIS0.331.00120.280.002.280.6063.670.00
182FISV0.021.0069.160.001.490.81134.650.00
184FLIR2.060.665.320.102.920.4428,464.510.00
185FLT0.370.9917.820.003.550.31187.630.00
191FTNT4.320.190.710.9612.760.000.011.00
198GLW1.260.8721.970.005.920.0726,897.600.00
204GPN0.121.0035.810.0017.030.0048.400.00
222HPE1.080.9110.280.000.600.9821.890.00
223HPQ3.710.2818.750.00296.600.002770.010.00
230IBM0.740.969.210.012.330.599634.670.00
238INTC0.301.0038.780.000.141.0035,716.060.00
239INTU0.710.9630.640.001.370.841,231,879.280.00
242IPGP685.870.004.550.171.760.740.001.00
247IT0.021.004.470.1882.550.0033.710.00
253JKHY0.051.004.410.18249.090.0015,049.620.00
255JNPR0.700.976.970.03408.450.004.780.14
259KEYS2.750.4837.700.007.500.024594.590.00
262KLAC7.800.021.710.758.900.0112,236,802,372.940.00
283LRCX3.500.320.910.94117.590.004283.250.00
290MA0.271.004.140.221.430.83365,171.120.00
295MCHP3.270.3727.670.0064.600.00371,984.080.00
312MPWR0.350.995.150.11122.820.0084.930.00
317MSFT0.410.9954.360.00225.410.007,082,818.520.00
318MSI0.370.9995.940.0028.330.00201,336,442,869.610.00
321MU950.200.003474.960.0019.310.0024,891.980.00
322MXIM1.760.746.180.05771.230.00458.840.00
330NLOK7.410.0254.260.0013.140.00163,613.060.00
334NOW0.780.960.091.00748.150.00793.380.00
337NTAP0.880.945.500.090.321.005,398,359,121,234.750.00
340NVDA2.150.641.320.854.580.16113.500.00
345NXPI4.350.1910.400.0016.080.00649,872.580.00
350ORCL0.600.9838.600.0047.890.00839,023.770.00
354PAYC0.291.008.830.0146.700.008.860.01
355PAYX0.600.9844.500.004.110.22796.330.00
382PTC25.180.0054.220.0020.360.009823.370.00
386PYPL490.430.00100.240.005.810.0723,985.040.00
387QCOM0.151.0015.870.007.120.0312,228.670.00
388QRVO0.360.9926.330.0076.560.00105,343.950.00
413SNPS0.101.0024.630.008.510.0122,961.410.00
420STX188.360.00271.630.003.260.37216,750,037,595.950.00
423SWKS0.750.9613.350.003.040.4178,373,584,126,967,520.000.00
431TEL1.840.724.380.194.260.20601.720.00
432TER4.850.145.510.09362.280.0057,117.610.00
440TRMB1.820.731.060.912.220.628488.830.00
449TXN4.240.20229.260.0018.110.0085,883.740.00
451TYL0.211.0021.450.0029.170.0082,591.720.00
464V0.141.0023.160.0017.490.00782,385.570.00
471VRSN0.550.9815.450.00124.200.00778,422.220.00
479WDC523.800.009.770.0041.420.0087,334,393.430.00
491WU0.720.966.640.041.210.8816,968,419.060.00
495XLNX2.610.5215.460.005.500.0910,654,035.180.00
501ZBRA0.460.9940.090.001.440.828746.860.00
Table A4. Long-memory nonparametric test: results for stocks belonging to the Communication Services sector.
StockMeanVarianceSkewnessShape
IDTickerQ-Statp-ValueQ-Statp-ValueQ-Statp-ValueQ-Statp-Value
48ATVI0.171.0012.540.005.670.08448,344.090.00
91CHTR1.580.7974.070.0093.260.002,807,626,133.760.00
97CMCSA0.081.0012.870.003.870.269419.820.00
131DIS0.001.006.650.044.140.229.640.00
132DISCA4.210.2123.460.0035.270.001432.350.00
133DISCK4.670.1612.850.0059.460.0014,352.550.00
134DISH2.770.489.380.005.480.0913.040.00
148EA6.350.0517.390.000.211.0091.690.00
175FB0.350.990.231.0010.470.00879,304,248,858,196,049,920.000.00
187FOX12.240.00251.000.0016.340.0048.710.00
188FOXA9.380.00234.260.003.900.2563.240.00
201GOOG0.570.9847.590.007.980.01196.520.00
202GOOGL0.960.9361.390.008.020.01204.770.00
241IPG0.311.000.201.000.181.00833.910.00
284LUMN3.380.344.990.130.620.9721,663.300.00
289LYV1.770.7487.100.0022.530.001,558,205.320.00
327NFLX0.520.9844.820.0033.860.005081.280.00
343NWS2.270.60112.280.00653.990.008,605,918.510.00
344NWSA0.420.9972.510.001728.270.0012,074,042,902.950.00
349OMC0.490.9912.490.000.480.99111.460.00
427T1.460.8215.700.00225.710.003,282,572.270.00
438TMUS6.050.067.730.0214.480.001,393,212.930.00
447TTWO2.460.5525.030.00426.530.00387.810.00
448TWTR64.620.002.650.502.960.430.021.00
466VIAC2.090.653.350.3515.110.00311,799,076,512,593,543,168.000.00
475VZ0.650.970.910.9311.900.00662,223.660.00
Table A5. Long-memory nonparametric test: results for stocks belonging to the Consumer Discretionary sector.
StockMeanVarianceSkewnessShape
IDTickerQ-Statp-ValueQ-Statp-ValueQ-Statp-ValueQ-Statp-Value
3AAP1.690.7616.810.008.400.01922.060.00
36AMZN0.630.978.170.0128.050.00351.680.00
45APTV0.640.9730.940.0027.570.00102,225.660.00
54AZO1.540.8019.220.006.770.04940,373.400.00
58BBY1432.420.0069.710.0088.990.0063,814,528,225.040.00
64BKNG0.390.991.420.834.760.152,378,793,118,270.880.00
71BWA2.880.4546.020.00698.520.0098,806.820.00
82CCL6.790.03145.670.006.730.04646.210.00
99CMG1.100.9014.410.00175.620.0028,421,583.740.00
121CZR152.550.002233.190.000.131.0010,800.240.00
127DG9.420.00495.310.0018.320.00103.840.00
129DHI39.760.0017.040.002.920.44719.230.00
136DLTR6.940.0365.000.00288.240.00302,860,661.730.00
139DPZ6.210.0516.220.008.930.0134,807.520.00
141DRI0.380.9969.630.000.500.9975.820.00
149EBAY0.291.001.910.700.011.0063,267,093.690.00
165ETSY0.520.980.690.970.820.950.061.00
170EXPE0.550.980.790.950.241.00155,780,687,837,237,575,680.000.00
172F1.200.888.490.0118.990.009.250.01
199GM58.120.006.020.06154.470.0018,879.230.00
203GPC0.480.9949.540.000.091.00169.790.00
205GPS62.560.00636.640.007.730.0236.520.00
206GRMN0.770.9631.050.00165.380.002,257,159.820.00
210HAS0.131.0011.840.004.620.16123.550.00
212HBI0.900.947.450.02191.960.00275,707.950.00
214HD0.171.0011.470.003.630.301632.730.00
219HLT0.340.99269.830.001.920.7054.360.00
265KMX13.410.005.070.121.570.79165.340.00
270LB1.170.8982.900.000.690.97564.990.00
272LEG0.101.0021.860.0015.090.008.880.01
273LEN0.091.0036.810.0011.640.006503.770.00
277LKQ0.011.0018.910.001.020.92803.760.00
282LOW1.050.919.590.004.430.1824,755.760.00
286LVS4.240.212.160.63192.080.00384.870.00
292MAR869.230.009.760.000.550.98286.770.00
294MCD0.470.9967.090.0016.640.00829,057.860.00
301MGM1333.200.0044.740.0048.770.00715.340.00
302MHK1.580.79152.140.000.101.004,535,476,500,387,485.000.00
323NCLH0.091.009198.760.00198.220.0031.270.00
329NKE0.680.971.520.8012.340.001.970.69
341NVR0.590.9860.810.000.920.9393,020,233,148,373,296.000.00
342NWL2.840.4613.580.001.210.882,484,344,665,315.430.00
351ORLY1.720.752.230.6292.870.0021,714,590.910.00
360PENN2.890.451466.130.0075.610.00438.730.00
367PHM0.770.9616.300.0042.250.00147.210.00
375POOL2.350.581.020.923.300.36579.530.00
383PVH0.121.0062.900.0031.360.002239.870.00
389RCL1.610.7872.950.0033.390.00303.480.00
396RL361.980.0024.530.00409.190.0011,324.320.00
401ROST1.760.7424.100.0015.370.00275.040.00
405SBUX4.960.1315.010.003.030.424.000.24
435TGT2.150.643.660.2912.990.00502,172,473,158.290.00
436TJX1.580.7912.040.000.580.98739.520.00
439TPR0.590.9880.780.007.530.023,323,250.430.00
443TSCO0.610.98411.840.0046.590.00555,762,781,736.860.00
444TSLA330.770.005.230.111.980.68293.580.00
452UA1.060.9157.250.001.400.8338.910.00
453UAA0.161.001.430.832.260.612517.590.00
457ULTA3.130.3910.290.0022.490.00574,909,833.310.00
465VFC1.870.717.530.023.070.41133,073.090.00
483WHR1.070.9125.710.000.570.988124.450.00
493WYNN835.200.00139.230.00103.230.004,842,660.010.00
499YUM1.140.8966.360.001.340.851,397,654.230.00
Table A6. Long-memory nonparametric test: results for stocks belonging to the Utilities sector.
StockMeanVarianceSkewnessShape
IDTickerQ-Statp-ValueQ-Statp-ValueQ-Statp-ValueQ-Statp-Value
15AEE0.111.0042.830.004.330.194.760.15
16AEP0.271.0059.100.00172.760.002732.800.00
17AES5.600.086.480.0472.730.002813.280.00
47ATO0.101.0052.670.00255.880.00269.790.00
52AWK0.760.9641.180.000.191.008600.550.00
101CMS1.290.8640.460.002.430.566517.930.00
103CNP0.630.978.040.010.171.000.261.00
122D0.091.00233.520.0027.540.00103,706.420.00
142DTE0.051.001197.200.001.960.6918.780.00
143DUK0.790.9528.240.00693.590.00111.110.00
151ED0.340.99123.610.00181.390.00829.470.00
153EIX0.840.959.560.0011.820.00205,368.730.00
161ES0.281.00751.240.00112.470.0037.220.00
164ETR0.011.0038.380.00209.860.00136.070.00
166EVRG1.700.76216.150.008.980.01632.360.00
168EXC0.550.9837.450.00190.160.001693.430.00
179FE1.630.7870.870.00863.970.001,500,106.760.00
281LNT0.011.0027.780.0071.670.0010,822.320.00
325NEE0.021.00104.900.000.940.932696.380.00
328NI0.121.0017.960.000.860.94431.300.00
335NRG189.050.00304.580.00444.610.001,554,966.540.00
359PEG0.760.965.620.081026.240.00274.890.00
374PNW0.261.0061.750.0018.880.00107.960.00
377PPL0.261.0012.510.000.590.9859.270.00
414SO0.610.98201.240.001427.790.00132.940.00
417SRE0.640.97102.470.003.450.33951.220.00
480WEC0.450.9923.660.00458.240.00158.550.00
494XEL0.041.0044.120.00261.500.00109.600.00
Table A7. Long-memory nonparametric test: results for stocks belonging to the Financial sector.
StockMeanVarianceSkewnessShape
IDTickerQ-Statp-ValueQ-Statp-ValueQ-Statp-ValueQ-Statp-Value
18AFL0.101.007.460.020.281.00413.140.00
19AIG22.020.0018.390.000.990.9244.490.00
20AIZ5.690.0828.760.0016.240.0030,825,589.730.00
21AJG2.070.6655.110.009.960.005370.540.00
26ALL1.380.841.430.83195.990.000.031.00
34AMP10.210.0046.940.002.290.60432.260.00
40AON0.450.991.520.800.650.97401.820.00
53AXP0.031.0095.260.00431.930.001,201,746,531,403,824,896.000.00
56BAC0.640.9782.530.000.380.99373.490.00
60BEN2.000.6866.810.0088.360.0033.250.00
63BK0.271.0010.470.000.081.001451.150.00
66BLK2.570.538.830.014.560.1715.950.00
73C0.311.0097.490.000.231.0065.830.00
78CB0.121.0027.940.000.780.95127.580.00
79CBOE1.570.792.060.664.760.1515.230.00
88CFG0.261.003682.070.003.010.42111.330.00
93CINF4.320.19177.990.0072.550.00138,326.800.00
96CMA0.680.97255.010.0010.000.0088.860.00
98CME0.251.006.610.042177.290.005808.240.00
104COF1.170.89351.820.0018.210.00387,608.070.00
126DFS0.570.98106.230.0014.740.002131.940.00
183FITB0.720.9681.800.0031.180.00201.830.00
189FRC0.780.9614.640.006.830.033,955,982.640.00
197GL1.240.87434.800.00349.220.001213.730.00
207GS3.710.2875.170.002.890.453915.390.00
211HBAN0.111.0023.490.008.660.011971.270.00
217HIG0.281.007.320.021.590.794260.020.00
231ICE1.170.890.051.0020.080.0010,837.070.00
249IVZ4.450.1898.270.0013.240.00361,567,880.950.00
256JPM0.081.007.990.010.640.9753.590.00
258KEY0.880.94193.850.001.210.882359.860.00
269L2.970.43141.240.004.000.2480.910.00
280LNC1.550.80136.500.000.051.00145.250.00
297MCO2.170.6324.900.005.920.07627,170.280.00
300MET0.121.0013.340.00506.480.0011,324.090.00
304MKTX288.880.003.530.3232.090.0026,536.350.00
306MMC0.560.980.171.000.460.996.020.06
315MS30.110.0072.030.000.740.96110.900.00
316MSCI0.261.0017.330.00525.900.0031,422,615,411.730.00
319MTB0.081.00124.240.00153.780.008913.730.00
324NDAQ0.420.990.350.991.040.910.800.95
338NTRS1.170.8931.540.000.321.0030.900.00
356PBCT1.550.80238.250.002558.810.006255.710.00
363PFG3.470.3325.390.00126.030.0012,093.150.00
365PGR0.760.9619.710.00323.520.0064,294.760.00
372PNC0.141.00137.220.001.950.691199.570.00
379PRU0.301.0099.700.0016.010.0020,748,890,009.280.00
390RE1.740.7512.290.00572.820.000.011.00
393RF0.600.9825.740.006.470.04680.500.00
395RJF0.420.9924.430.000.031.0053.720.00
406SCHW2.140.6434.520.000.021.00532.190.00
409SIVB0.560.9882.250.001.270.8619,650.780.00
416SPGI6.130.068.240.015.460.09905.360.00
419STT2.330.5950.810.007.830.02658.050.00
424SYF10.090.002632.830.0010.760.001337.480.00
433TFC0.201.00163.440.002.490.550.400.99
441TROW1013.250.0014.750.002.310.59407.780.00
442TRV0.930.93107.180.000.380.994663.980.00
459UNM1.760.74242.950.006.060.0610,564.730.00
463USB0.051.0087.100.00202.190.00477.280.00
482WFC0.011.0025.700.005.140.11574.500.00
484WLTW1.750.747.410.0212.330.00210.720.00
488WRB0.061.0058.690.0070.090.00354.540.00
502ZION1.710.759.460.0017.120.001213.460.00
Table A8. Long-memory nonparametric test: results for stocks belonging to the Materials sector.
StockMeanVarianceSkewnessShape
IDTickerQ-Statp-ValueQ-Statp-ValueQ-Statp-ValueQ-Statp-Value
23ALB1.040.9123.580.0042.900.0050.530.00
30AMCR19.240.00158749.170.000.311.0015.430.00
43APD0.830.954.470.181.040.91387.640.00
51AVY0.211.0010.230.000.061.002,282,202,533.610.00
67BLL0.410.9948.500.00203.700.00134.490.00
85CE0.291.006.000.06137.500.00155,026.650.00
87CF2.210.6219.380.003.540.314724.430.00
117CTVA0.820.956.710.041135.990.001571.970.00
124DD0.720.9621.970.0012.710.00171,927.860.00
138DOW2.860.46105.600.005.360.10172.940.00
150ECL0.031.003.010.420.171.00207.260.00
155EMN1.410.8374.640.0026.980.0032,498.790.00
177FCX468.690.00156.780.0018.300.007587.420.00
186FMC1.070.9127.930.001.970.6970,699.930.00
234IFF0.980.9215.370.000.470.9930,824.920.00
240IP3.550.319.180.011.220.874870.790.00
276LIN1.700.7623.520.002.880.4521,444.770.00
288LYB840.240.005.410.094.960.133011.290.00
305MLM1.510.812.810.470.101.00132,421,508.700.00
310MOS0.550.98105.000.000.191.002623.760.00
326NEM72.630.005.280.100.151.0033.990.00
339NUE0.480.99840.430.003.520.32401,742,062.490.00
368PKG2.400.573.500.3277.310.0019,504.280.00
376PPG0.101.0023.300.000.141.001555.030.00
407SEE0.161.0058.500.000.500.9912,707.180.00
408SHW0.001.00197.590.003.470.33689,594.110.00
468VMC6.110.062.140.644.940.13191.930.00
489WRK1.740.75164.380.009.280.0013.100.00
Table A9. Long-memory nonparametric test: results for stocks belonging to the Real Estate sector.
StockMeanVarianceSkewnessShape
IDTickerQ-Statp-ValueQ-Statp-ValueQ-Statp-ValueQ-Statp-Value
35AMT0.580.982.900.451.860.710.071.00
46ARE0.071.001.920.7086.330.00362.030.00
49AVB1.600.7813.190.001392.960.001852.410.00
72BXP0.051.00195.250.000.011.00687.960.00
80CBRE1.040.9111.000.0056.400.001,075,058,567.140.00
81CCI1.890.7111.400.0018.790.004765.860.00
135DLR0.400.99184.570.00111.930.001,996,169.040.00
140DRE1.920.701.370.845.070.12114.050.00
159EQIX0.500.9915.590.000.331.00513.910.00
160EQR0.450.9913.340.002135.070.002673.210.00
162ESS0.291.0010.450.0011.080.001.280.86
171EXR0.281.002.730.491.010.92249.220.00
190FRT0.251.0090.680.000.790.95185.830.00
226HST1.290.869.560.00185.190.001618.230.00
245IRM2.710.493.780.27402.350.00153,389.740.00
261KIM101.660.0072.410.007.600.02366.480.00
291MAA0.061.0024.870.00121.520.00331.690.00
346O0.780.95725.340.0014.550.0037.770.00
358PEAK0.900.94137.870.00183.600.00100.410.00
370PLD1.840.722.820.4646.410.00707.180.00
380PSA0.261.0044.840.0013.880.002020.360.00
391REG0.161.0084.560.001.420.834.420.18
404SBAC0.141.0020.170.0041.750.000.031.00
415SPG0.410.99464.660.0025.800.0053.200.00
455UDR0.390.9952.330.0062.970.002895.680.00
469VNO0.251.0074.770.000.580.98431.730.00
473VTR2.420.56117.140.0067.700.001,462,488.270.00
481WELL0.201.00258.050.00121.190.007311.740.00
492WY9.290.00134.500.0015.740.0038.150.00
Table A10. Long-memory nonparametric test: results for stocks belonging to the Consumer Staples sector.
StockMeanVarianceSkewnessShape
IDTickerQ-Statp-ValueQ-Statp-ValueQ-Statp-ValueQ-Statp-Value
12ADM1.660.7711.450.0016.890.0015.160.00
74CAG0.171.0035.570.00196.120.00552,087.570.00
89CHD3.460.335.780.0713.870.0030.360.00
94CL1.130.89115.070.002.290.6041.630.00
95CLX1.470.821.210.8848.100.001.110.90
108COST1.340.850.930.93155.150.00923.190.00
109CPB2.460.5518.840.0013.100.0014,191,017.320.00
154EL0.211.009.280.000.181.0012.260.00
196GIS1.980.682.160.630.750.96869,261,422,467.770.00
224HRL0.620.982.970.4341.360.00266,212.510.00
227HSY3.200.381.580.794.390.1913,408.110.00
257K1.330.8519.700.004.060.2320,494,513.990.00
260KHC0.131.0038.440.002.230.617734.060.00
263KMB1.860.7122.930.0011.990.0087.970.00
266KO0.131.0041.310.00102.340.008656.050.00
267KR1.810.730.091.00185.450.00206,368.100.00
287LW0.271.00844.200.00316.080.001898.220.00
298MDLZ0.990.92270.910.002.800.47232.490.00
303MKC3.390.3415.030.0010.650.0078,669,023,663,671,856.000.00
308MNST212.710.007.370.021.270.86415.850.00
309MO6.860.0316.160.0099.860.0063.680.00
361PEP0.101.007.880.025.490.091127.600.00
364PG4.830.1455.270.00163.600.0065.110.00
371PM0.301.0015.440.001.690.76154,030,094,291.820.00
410SJM57.290.000.780.95509.020.007280.620.00
421STZ1.460.8257.670.0036.100.0010,475,104.790.00
426SYY0.011.00291.700.000.271.0018.410.00
428TAP0.970.9233.640.0054.260.00264,885,029,611.890.00
445TSN333.930.008.460.011100.990.0024,018.100.00
478WBA0.111.000.051.0022.780.00171.480.00
487WMT0.231.001.780.745.420.094337.340.00
Table A11. Long-memory nonparametric test: results for stocks belonging to the Energy sector.
StockMeanVarianceSkewnessShape
IDTickerQ-Statp-ValueQ-Statp-ValueQ-Statp-ValueQ-Statp-Value
42APA18.440.00108.430.0025.190.001041.360.00
65BKR0.241.004.570.170.211.002113.110.00
105COG0.780.965.240.11540.210.000.171.00
107COP127.060.0069.030.00249.340.00485.460.00
120CVX0.081.0011.100.0011.400.00408,723.100.00
145DVN73.890.00179.590.004.450.18341.660.00
158EOG0.141.0013.090.001763.580.00737.630.00
173FANG0.101.00876.440.0030.680.00103.990.00
209HAL5.120.1138.160.004.060.2376.400.00
215HES68.380.0044.800.0017.570.00154.140.00
216HFC434.330.006.870.0328.830.00482.160.00
264KMI0.690.97343.000.0027.280.00582.490.00
311MPC1.290.864.130.22522.030.008650.360.00
314MRO92.630.00265.390.0030.260.0040.330.00
333NOV121.130.0072.490.008.350.0199,678.310.00
348OKE3.960.24612.810.00997.010.00606.720.00
353OXY4.150.22134.080.00566.340.00184,685.220.00
381PSX16.350.009.510.005.500.0911,185,126.830.00
385PXD1.320.856.690.047.560.02590.970.00
411SLB3.930.2522.630.0037.130.003167.170.00
467VLO3.170.3917.300.0079.050.00925,056,523.490.00
486WMB0.231.00242.480.000.410.99873.350.00
496XOM0.011.007.760.022.090.6577.500.00

References

  1. Hurst, H.E. Long-term storage capacity of reservoirs. Trans. Am. Soc. Civ. Eng. 1951, 116, 770–799. [Google Scholar] [CrossRef]
  2. Mandelbrot, B.B.; Van Ness, J.W. Fractional Brownian motions, fractional noises and applications. SIAM Rev. 1968, 10, 422–437. [Google Scholar] [CrossRef]
  3. Granger, C.W. The typical spectral shape of an economic variable. Econom. J. Econom. Soc. 1966, 34, 150–161. [Google Scholar] [CrossRef]
  4. Greene, M.T.; Fielitz, B.D. Long-term dependence in common stock returns. J. Financ. Econ. 1977, 4, 339–349. [Google Scholar] [CrossRef]
  5. Lo, A.W. Long-term memory in stock market prices. Econom. J. Econom. Soc. 1991, 59, 1279–1313. [Google Scholar] [CrossRef]
  6. Mattera, R.; Sciorio, F.D. Option Pricing Under Multifractional Process and Long-Range Dependence. Fluct. Noise Lett. 2021, 20, 2150008. [Google Scholar] [CrossRef]
  7. Ding, Z.; Granger, C.; Engle, R. A long memory property of stock market returns and a new model. J. Empir. Financ. 1993, 1, 83–106. [Google Scholar] [CrossRef]
  8. Ding, Z.; Granger, C. Modeling volatility persistence of speculative returns: A new approach. J. Econom. 1996, 73, 185–215. [Google Scholar] [CrossRef]
  9. Crato, N.; de Lima, P. Long-range dependence in the conditional variance of stock returns. Econ. Lett. 1994, 45, 281–285. [Google Scholar] [CrossRef]
  10. Lo, A.W.; MacKinlay, A.C. Stock market prices do not follow random walks: Evidence from a simple specification test. Rev. Financ. Stud. 1988, 1, 41–66. [Google Scholar] [CrossRef]
  11. Lo, A.W.; MacKinlay, A.C. When are contrarian profits due to stock market overreaction? Rev. Financ. Stud. 1990, 3, 175–205. [Google Scholar] [CrossRef]
  12. Mills, T. Is there long-term memory in UK stock returns? Appl. Financ. Econ. 1993, 3, 303–306. [Google Scholar] [CrossRef]
  13. Cheung, Y.W.; Lai, K. A search for long memory in international stock market returns. J. Int. Money Financ. 1995, 14, 597–615. [Google Scholar] [CrossRef]
  14. Resende, M.; Teixeira, N. Permanent structural changes in the Brazilian economy and long memory: A stock market perspective. Appl. Econ. Lett. 2002, 9, 373–375. [Google Scholar] [CrossRef]
  15. Jefferis, K.; Thupayagale, P. Long memory in Southern African stock markets. S. Afr. J. Econ. 2008, 76, 384–398. [Google Scholar] [CrossRef]
  16. Bhattacharya, S.N.; Bhattacharya, M.; Guhathakurta, K. The Comparative Dynamics of Developed and Emerging Stock Markets: A Long Memory Perspective. Theor. Econ. Lett. 2018, 8, 1493–1509. [Google Scholar] [CrossRef] [Green Version]
  17. Lillo, F.; Farmer, J.D. The long memory of the efficient market. Stud. Nonlinear Dyn. Econom. 2004, 8, 1. [Google Scholar] [CrossRef]
  18. Kang, S.H.; Yoon, S.M. Long memory properties in return and volatility: Evidence from the Korean stock market. Phys. A Stat. Mech. Its Appl. 2007, 385, 591–600. [Google Scholar] [CrossRef]
  19. Arouri, M.E.H.; Hammoudeh, S.; Lahiani, A.; Nguyen, D.K. Long memory and structural breaks in modeling the return and volatility dynamics of precious metals. Q. Rev. Econ. Financ. 2012, 52, 207–218. [Google Scholar] [CrossRef] [Green Version]
  20. Al-Yahyaee, K.H.; Mensi, W.; Yoon, S.M. Efficiency, multifractality, and the long-memory property of the Bitcoin market: A comparative analysis with stock, currency, and gold markets. Financ. Res. Lett. 2018, 27, 228–234. [Google Scholar] [CrossRef]
  21. Ray, B.; Tsay, R. Long-range dependence in daily stock volatilities. J. Bus. Econ. Stat. 2000, 18, 254–262. [Google Scholar] [CrossRef]
  22. Christensen, B.; Nielsen, M. The effect of long memory in volatility on stock market fluctuations. Rev. Econ. Stat. 2007, 89, 684–700. [Google Scholar] [CrossRef]
  23. Granero, M.S.; Segovia, J.T.; Pérez, J.G. Some comments on Hurst exponent and the long memory processes on capital markets. Phys. A Stat. Mech. Its Appl. 2008, 387, 5543–5551. [Google Scholar] [CrossRef]
  24. Perron, P.; Qu, Z. Long-memory and level shifts in the volatility of stock market return indices. J. Bus. Econ. Stat. 2010, 28, 275–290. [Google Scholar] [CrossRef]
  25. Nguyen, D.B.B.; Prokopczuk, M.; Sibbertsen, P. The memory of stock return volatility: Asset pricing implications. J. Financ. Mark. 2020, 47, 100487. [Google Scholar] [CrossRef]
  26. Lobato, I.; Savin, N. Real and spurious long-memory properties of stock-market data. J. Bus. Econ. Stat. 1998, 16, 261–268. [Google Scholar] [CrossRef]
  27. Granger, C.; Hyung, N. Occasional structural breaks and long memory with an application to the S&P 500 absolute stock returns. J. Empir. Financ. 2004, 11, 399–421. [Google Scholar] [CrossRef]
  28. Chatzikonstanti, V.; Venetis, I. Long memory in log-range series: Do structural breaks matter? J. Empir. Financ. 2015, 33, 104–113. [Google Scholar] [CrossRef]
  29. Patton, A.J. On the out-of-sample importance of skewness and asymmetric dependence for asset allocation. J. Financ. Econom. 2004, 2, 130–168. [Google Scholar] [CrossRef] [Green Version]
  30. Jondeau, E.; Rockinger, M. Optimal portfolio allocation under higher moments. Eur. Financ. Manag. 2006, 12, 29–55. [Google Scholar] [CrossRef] [Green Version]
  31. Harvey, C.R.; Liechty, J.C.; Liechty, M.W.; Müller, P. Portfolio selection with higher moments. Quant. Financ. 2010, 10, 469–485. [Google Scholar] [CrossRef]
  32. Jondeau, E.; Rockinger, M. On the importance of time variability in higher moments for asset allocation. J. Financ. Econom. 2012, 10, 84–123. [Google Scholar] [CrossRef] [Green Version]
  33. Mattera, R.; Giacalone, M.; Gibert, K. Distribution-Based Entropy Weighting Clustering of Skewed and Heavy Tailed Time Series. Symmetry 2021, 13, 959. [Google Scholar] [CrossRef]
  34. Harvey, C.R.; Siddique, A. Conditional skewness in asset pricing tests. J. Financ. 2000, 55, 1263–1295. [Google Scholar] [CrossRef]
  35. Scott, R.C.; Horvath, P.A. On the direction of preference for moments of higher order than the variance. J. Financ. 1980, 35, 915–919. [Google Scholar] [CrossRef]
  36. Harvey, C.R.; Siddique, A. Autoregressive conditional skewness. J. Financ. Quant. Anal. 1999, 34, 465–487. [Google Scholar] [CrossRef]
  37. Jondeau, E.; Rockinger, M. Conditional volatility, skewness, and kurtosis: Existence, persistence, and comovements. J. Econ. Dyn. Control 2003, 27, 1699–1737. [Google Scholar] [CrossRef] [Green Version]
  38. León, Á.; Rubio, G.; Serna, G. Autoregresive conditional volatility, skewness and kurtosis. Q. Rev. Econ. Financ. 2005, 45, 599–618. [Google Scholar] [CrossRef]
  39. Cerqueti, R.; Giacalone, M.; Mattera, R. Model-based fuzzy time series clustering of conditional higher moments. Int. J. Approx. Reason. 2021, 134, 34–52. [Google Scholar] [CrossRef]
  40. Gromykov, G.; Haye, M.O.; Philippe, A. A Frequency-domain test for long range dependence. Stat. Inference Stoch. Process. 2018, 21, 513–526. [Google Scholar] [CrossRef] [Green Version]
  41. Creal, D.; Koopman, S.J.; Lucas, A. Generalized autoregressive score models with applications. J. Appl. Econom. 2013, 28, 777–795. [Google Scholar] [CrossRef] [Green Version]
  42. Adcock, C.; Eling, M.; Loperfido, N. Skewed distributions in finance and actuarial science: A review. Eur. J. Financ. 2015, 21, 1253–1281. [Google Scholar] [CrossRef]
  43. Cerqueti, R.; Giacalone, M.; Mattera, R. Skewed non-Gaussian GARCH models for cryptocurrencies volatility modelling. Inf. Sci. 2020, 527, 1–26. [Google Scholar] [CrossRef]
  44. Cont, R. Empirical properties of asset returns: Stylized facts and statistical issues. Quant. Financ. 2001, 1, 223. [Google Scholar] [CrossRef]
  45. Mattera, R.; Giacalone, M. Alternative distribution based GARCH models for bitcoin volatility estimation. Empir. Econ. Lett. 2018, 17, 1283–1288. [Google Scholar]
  46. Zhu, D.; Galbraith, J.W. A generalized asymmetric Student-t distribution with application to financial econometrics. J. Econom. 2010, 157, 297–305. [Google Scholar] [CrossRef]
  47. Theodossiou, P. Financial data and the skewed generalized t distribution. Manag. Sci. 1998, 44, 1650–1661. [Google Scholar] [CrossRef]
  48. Giacalone, M.; Panarello, D.; Mattera, R. Multicollinearity in regression: An efficiency comparison between L p-norm and least squares estimators. Qual. Quant. 2018, 52, 1831–1859. [Google Scholar] [CrossRef] [Green Version]
  49. Mattera, R.; Giacalone, M. Forecasting macroeconomic volatility with score-driven models. Stat. Appl. 2020, 18, 177–196. [Google Scholar]
  50. Fernández, C.; Steel, M.F. On Bayesian modeling of fat tails and skewness. J. Am. Stat. Assoc. 1998, 93, 359–371. [Google Scholar]
  51. Cerqueti, R.; Giacalone, M.; Panarello, D. A Generalized Error Distribution Copula-based method for portfolios risk assessment. Phys. A Stat. Mech. Its Appl. 2019, 524, 687–695. [Google Scholar] [CrossRef]
Figure 1. Randomly selected stocks for Industrial, Health Care and IT sectors.
Mathematics 10 00707 g001
Figure 2. Randomly selected stocks for Communication Services, Consumer Discretionary and Utilities sectors.
Mathematics 10 00707 g002
Figure 3. Randomly selected stocks for Financial, Materials and Real Estate sectors.
Mathematics 10 00707 g003
Figure 4. Randomly selected stocks for Consumer Staples and Energy sectors.
Mathematics 10 00707 g004
Figure 5. Estimated moments for IBM stock.
Mathematics 10 00707 g005
Figure 6. Estimated moments for JPM stock.
Mathematics 10 00707 g006
Table 1. Descriptive statistics for group-based stock returns.
SectorLengthMeanVarianceMinMax
Industrial740.0006500.004728−0.3608290.344278
Health Care620.0006520.004545−0.3952900.481849
Information Technology750.0007370.006036−0.4678550.420617
Communication Services260.0004340.005322−0.4555230.352230
Consumer Discretionary630.0005490.006017−0.5941420.365733
Utilities280.0004440.002341−0.2345220.257634
Financial640.0004420.003358−0.3124580.275358
Materials280.0004090.005236−0.3216900.259935
Real Estate290.0003790.002496−0.3367720.299941
Consumer Staples310.0004660.003077−0.3210260.316513
Energy23−0.0000280.004668−0.7735930.295550
Table 2. Long-memory nonparametric tests: summary of the results for all the business sectors.
MeanVarianceSkewnessShape
Industrials14.86%60.81%51.35%97.30%
Health Care4.84%66.13%59.68%90.32%
Information Technology17.33%65.33%56.00%90.67%
Communication Services15.38%76.92%61.54%96.15%
Consumer Discretionary22.22%79.37%55.56%95.24%
Utilities3.57%96.43%67.86%92.86%
Financials9.38%89.06%50.00%92.19%
Materials14.29%71.43%32.14%100.00%
Real Estate6.90%79.31%72.41%86.21%
Consumer Staples12.90%67.74%61.29%96.77%
Energy34.78%86.96%73.91%95.65%
Average14.22%76.31%58.34%93.94%
Median14.28%76.92%59.67%95.23%
Publisher’s Note: MDPI stays neutral with regard to jurisdictional claims in published maps and institutional affiliations.

