Article

Utilize Fuzzy Delphi and Analytic Network Process to Construct Consumer Product Design Evaluation Indicators

1
Department of Industrial Education and Technology, National Changhua University of Education, Changhua 50007, Taiwan
2
Graduate School of Design, National Yunlin University of Science and Technology, Yunlin 64002, Taiwan
*
Authors to whom correspondence should be addressed.
Mathematics 2022, 10(3), 397; https://doi.org/10.3390/math10030397
Submission received: 27 December 2021 / Revised: 21 January 2022 / Accepted: 26 January 2022 / Published: 27 January 2022
(This article belongs to the Special Issue Fuzzy Applications in Industrial Engineering)

Abstract

:
In the face of an ever-changing global market, companies able to launch new products meeting consumer needs faster than their competitors may not only gain a larger market share, but also shorten the development cycle to reduce costs. However, there are currently no universal design strategies and tools for evaluating the design of consumer products. Therefore, the purpose of this study is mainly to formulate a systematic and innovative product design strategy and evaluation tool, so that designers can use them to select the key factors when designing consumer products and design products that meet customer needs in the shortest development cycle. First of all, this study was designed to sort out general design methods and influencing factors in consumer product design based on theoretical analysis and expert interviews. Next, a questionnaire survey of 15 design-related experts and scholars was conducted, and the most important design methods and design factors were selected using the Fuzzy Delphi Method (FDM). After that, the analytical network process (ANP) method was used to obtain the priority weight of each design factor, and select the optimal product design strategy, QTPCP, and the deciding elements that affect consumer demand for products, including 2 dimensions, 11 design elements, and 38 design factors, making theoretical contributions to product design management. The design strategies and evaluation tools developed according to the conclusions are helpful in comprehensive planning and design selection for products of different natures, and make practical contributions, enabling product developers or designers to efficiently select the optimal product design when faced with different new product designs.

1. Introduction

Consumer products refer to products provided for end consumers to use. In recent years, they have been widely used in daily life, from household cleaning and sanitary products, personal products and other general consumer products related to people’s livelihood, to quality goods, clothing, and consumer electronics, with a very wide range, and the output value is even more difficult to estimate [1].
Facing the ever-changing global market, companies able to shorten the development cycle and launch new consumer products faster than their competitors gain a larger market share. Fan Miao et al. (2005) [2] believed that the implementation of the rapid R&D strategy can not only give the company an advantage in operation, but also make the company a competitor with the ability to respond quickly. As respondents’ preferences are relatively abstract, their judgments are subjective and vague. In order to avoid the influence of the limit value produced by the traditional Delphi method, the Fuzzy Delphi Method (FDM) was adopted in this study, and the group’s preference relationship was utilized to select the optimal solution, so as to formulate a set of thoughtful design strategies. Then, while designing consumer products, designers can use this set of design strategies, with the aid of the latest software and hardware tools, to effectively manage the quality of each item in the shortest development cycle, and design innovative products that meet the needs of consumers.
The selection from innovative product design alternatives is a multi-criteria decision-making issue. In the past, designers often relied on personal experience or intuition to deal with the issue, and could not model or quantify the theme. Based on the Analytic Hierarchy Process (AHP), the Analytic Network Process (ANP), in which the influence between adjacent layers is taken into consideration and the mixed weights are comprehensively analyzed by using the super-matrix, is an effective tool for solving complex problems and making decisions. The research methods adopted in this study include: (1) an expert questionnaire survey: related researches on product design were reviewed and analyzed and the opinions of experts in this field were collected through interviews, to develop relevant evaluation factors; (2) the Fuzzy Delphi (FDM) was used to screen out the important evaluation criteria based on the expert questionnaire survey; (3) the Analytical Network Process (ANP): first, a hierarchical structure was established for the selection mode of product design alternatives, and the interdependence between alternatives and criteria was considered, and the Analytical Network Process was used to obtain the priority weight of each alternative as the basis for selecting the optimal solution in the future, allowing the company to reduce cost considerably and make greater profits in the future.
This innovative product design strategy and selection mechanism can allow future designers to organize thinking behind more diverse product designs, and finally provide the industry with the ability to focus on the more important design factors when formulating future marketing plans and product designs, create products that meet the needs of consumers in the shortest period, and achieve the goal of sustainable business operation.

2. Theoretical Background

2.1. Innovative Product Design Methods

Product design is the process designers use to discover the needs of consumers, generate ideas or solutions, and use them as the guideline on new product development work, so that the product can meet the potential needs of consumers. The creation originates from designing and planning to meet consumer needs, so it is very important to obtain and interpret the information of consumer needs [3]. Understanding consumer expectations tests the company’s early analysis capabilities, and allows managers to carefully check their own views and pursue future innovations centered on consumer satisfaction [4]. These include the ability to “use, manage, understand and evaluate technology” and the ability to “solve problems” using “innovation and design” methods [5]. From customer needs, creative thinking about product innovation and invention, and finally to patent analysis, layout, and application, companies can systematically and quickly find innovation points [6]. The process of product innovation and design is complex, and quality function deployment (QFD) can be used to incorporate the voices of customers into the R&D of product technologies and requirements of specification customization, to ensure that products achieve customer satisfaction [7]. Then, TRIZ, an innovative tool, is used to create new products and apply for patents. Using TRIZ combined with designing is helpful for the designer to use patent knowledge to find innovative solutions [8]. The design thinking process consists of five stages: “empathize, define, idea, prototype, and test”. With the advancement of science and technology, designers, in the stage of ideating, use a 3D modeling system to design the details of all the components of the product. In the design process, the computer-aided design (CAD) system is considered to be an important tool conveying innovative product design [9]. Finally, the “prototype” is completed using the processing machine for test feedback, to improve professional core competence, problem solving and clinical decision making [10].

2.2. Consumer Product Design Factors

Nowadays, customers have increasingly higher requirements for products as the consumer awareness has been growing gradually, and products with a purely functional design can no longer meet customer needs. Therefore, it is very important to grasp the needs of customers in the early stage of product development. Among them, the shape of the product gives people a visual perception, which is enough to affect consumers’ buying behavior. The appearance characteristics of the product exhibited through induction include streamline, refinedness, technology, stability, liveliness, cordial, flexibility, elegance, conciseness, innovation, beauty or all-in-one. The shape image will be more conducive to the shaping of the product image [11].
There are many factors that affect willingness to buy. In addition to the above-mentioned appearance, there are also user satisfaction (usability) and ergonomic factors (shape, color, maintenance, safety, interaction, material, function and durability). It is very important to let the designer know which factors affect customers’ willingness to buy in the initial design process, making consumers happy and satisfied is the deciding factor in making a positive purchase decision. Transforming these attributes into design elements can change the perception of buyers and make them willing to buy [12,13]. Discovering factors that affect consumer needs by conducting market research, analysing existing products and developing a product design strategy according is the focal point of most scholars’ research [14].
In recent years, the concept of “sustainable design” has become all the rage. In a modern society full of goods, coupled with the consumer trend of seeking innovation and change, many non-essential things have been consumed in daily life. Designers can make a valuable contribution to environmental protection through careful planning, good use of creativity and the selection of appropriate materials [15]. In addition, if they base their design on quantitative and objective investigation and analysis, they can find out the key considerations that consumers need for the decision process of buying green products, such as durability, safety and non-toxicity, reasonable appearance, applicability of environmentally friendly materials, reasonable price, etc.; green design elements essential for green product development [16].
The functions of consumer products and services have become more diversified as the digital technology has evolved over time [17], as has the user interface design of digital products. After the high-resolution color screens became popular, more and more details of the image have been be displayed. Therefore, the visual performance and operation methods of the operating interface vary according to brands and systems, and there are many options. As a result, designers can, based on observation and experiment, understand the operating applications that users adopt, the impact of users’ mental models and knowledge use on the operating interface of smart products, and use the hierarchical approach to explore the optimal hierarchical layout and arrangement as the important factors that affect the operation [18].
This study is designed to use the theory of consumer behavior and literature reviews to find out the factors that make consumers choose consumer products [19], and use the Fuzzy Delphi Method (FDM) [20], based on the opinions of group decisions to make a selection, objectively, in a quantitative manner, to develop design strategies and key design indicators of consumer products [21,22]. The use of selection allows designers to focus on important design indicators when carrying out product design. Finally, the Analytical Network Process (ANP) is used to analyze the subordination and hierarchical relationship between the design indicators, and draw and interpret the structured hierarchical diagram to help the designer understand the correlation between and the sequence of the indicators [23].

3. Research Methods

This study is divided into three stages. In the first stage, general product design methods and design factors that consumers value are sorted out based on domestic and foreign literature reviews and related theories. In the second stage, a survey of expert questionnaire is conducted and the Fuzzy Delphi Method (FDM) is used to screen the preliminary indicators. In the third stage, the selected indicators are again subjected to a survey of expert questionnaire and the analytical network process (ANP) method is used to obtain the weight of each indicator. Finally, an innovative product design selection model is built to provide a quantitative basis for companies that want to evaluate new product designs. The research methods used in this study are described. As shown in Figure 1.

3.1. Establishment of Product Innovation Design Methods

Based on relevant researches by experts and scholars, the researchers have learned that creative product design is not a process, but a dynamic activity based on creative design clusters. There are four types of clusters of innovative product design activities: scope, idea, prototype and product [24]. To meet the requirement of product design activities, we have developed a set of innovative product design strategies “QTPCP” based on the theoretical background, as shown in Table 1, forming a complete thinking behind the design stages of “requirement, conception, realization”, as the basis for subsequent FDM analysis.

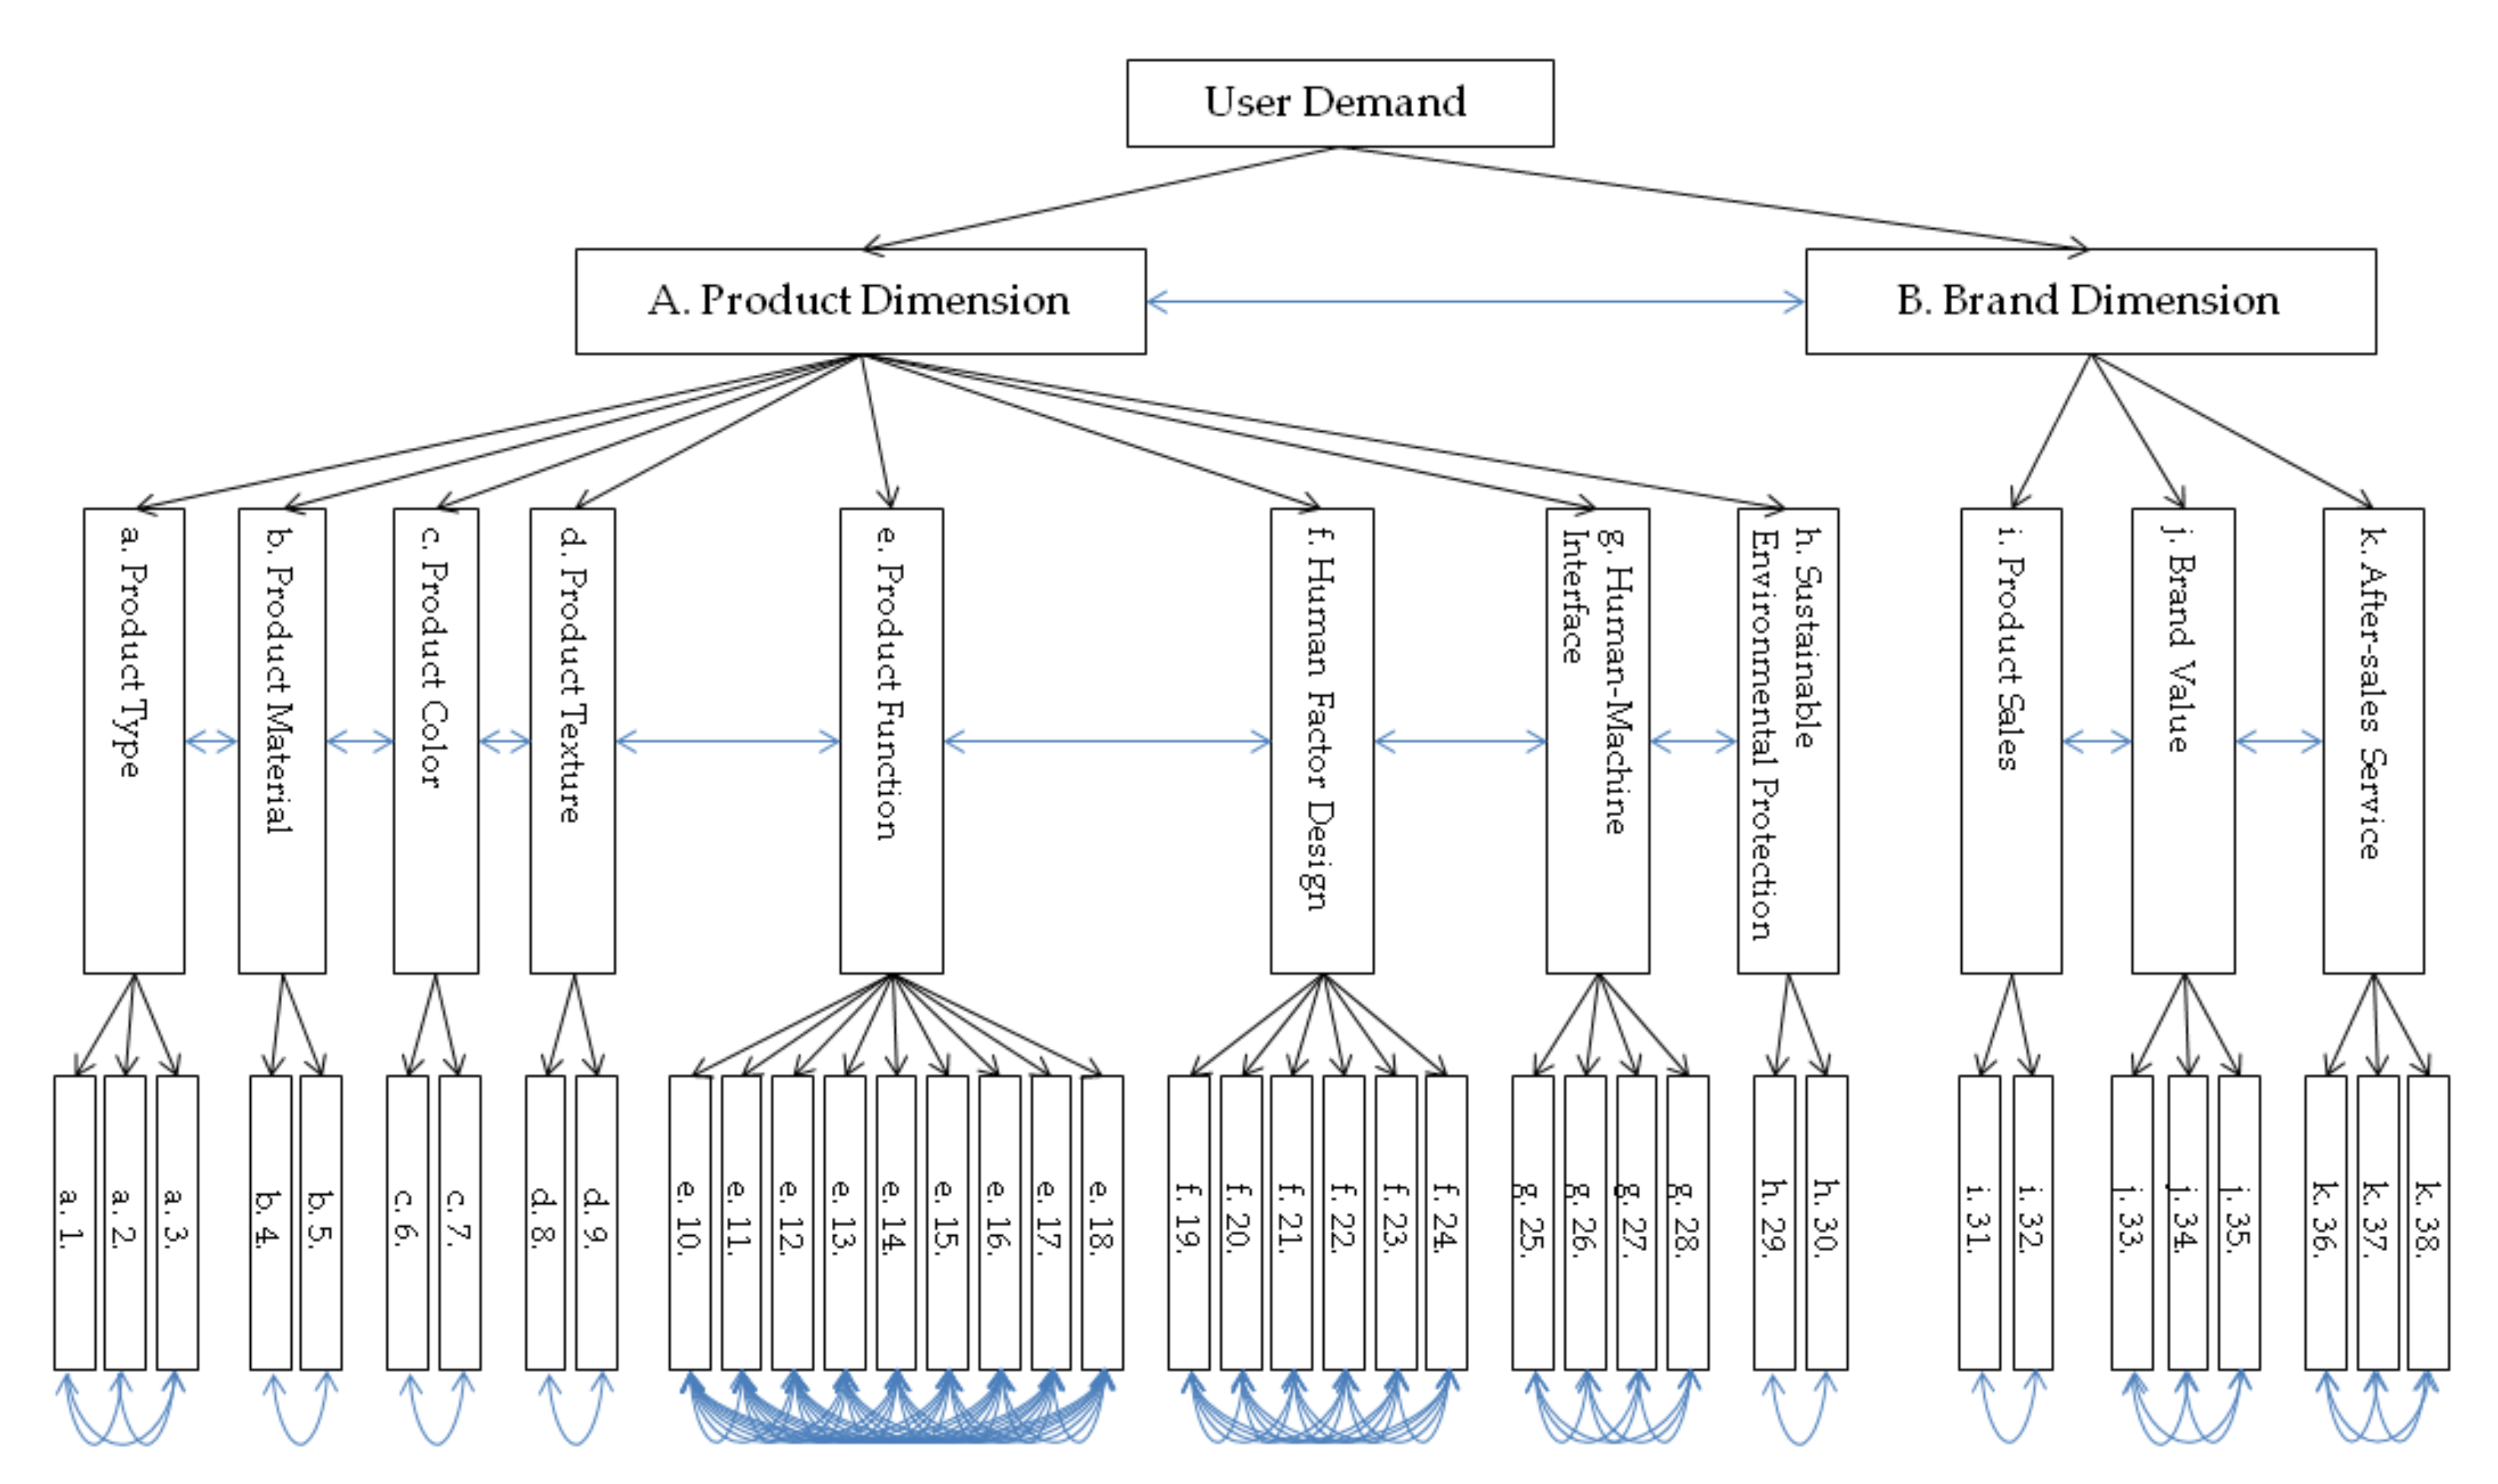
3.2. Establishment of Design Factors That Meet Consumer Needs

Based on the results of domestic and foreign literature reviews and expert interviews, the researcher has preliminarily decided to begin with the elements in determining decisions of purchase, “product” and “brand”, and sort out the design evaluation factors and design factors that must be considered when “consumer products” are designed, including product type, product material, product color, product texture, product function, human factors design, human–machine interface, sustainability, product sales, brand value and after-sales service, eleven design elements and 56 design factors, as shown in Table 2. The design factors of different products were sorted out for the following questionnaire survey and selection of the optimal product design factors:

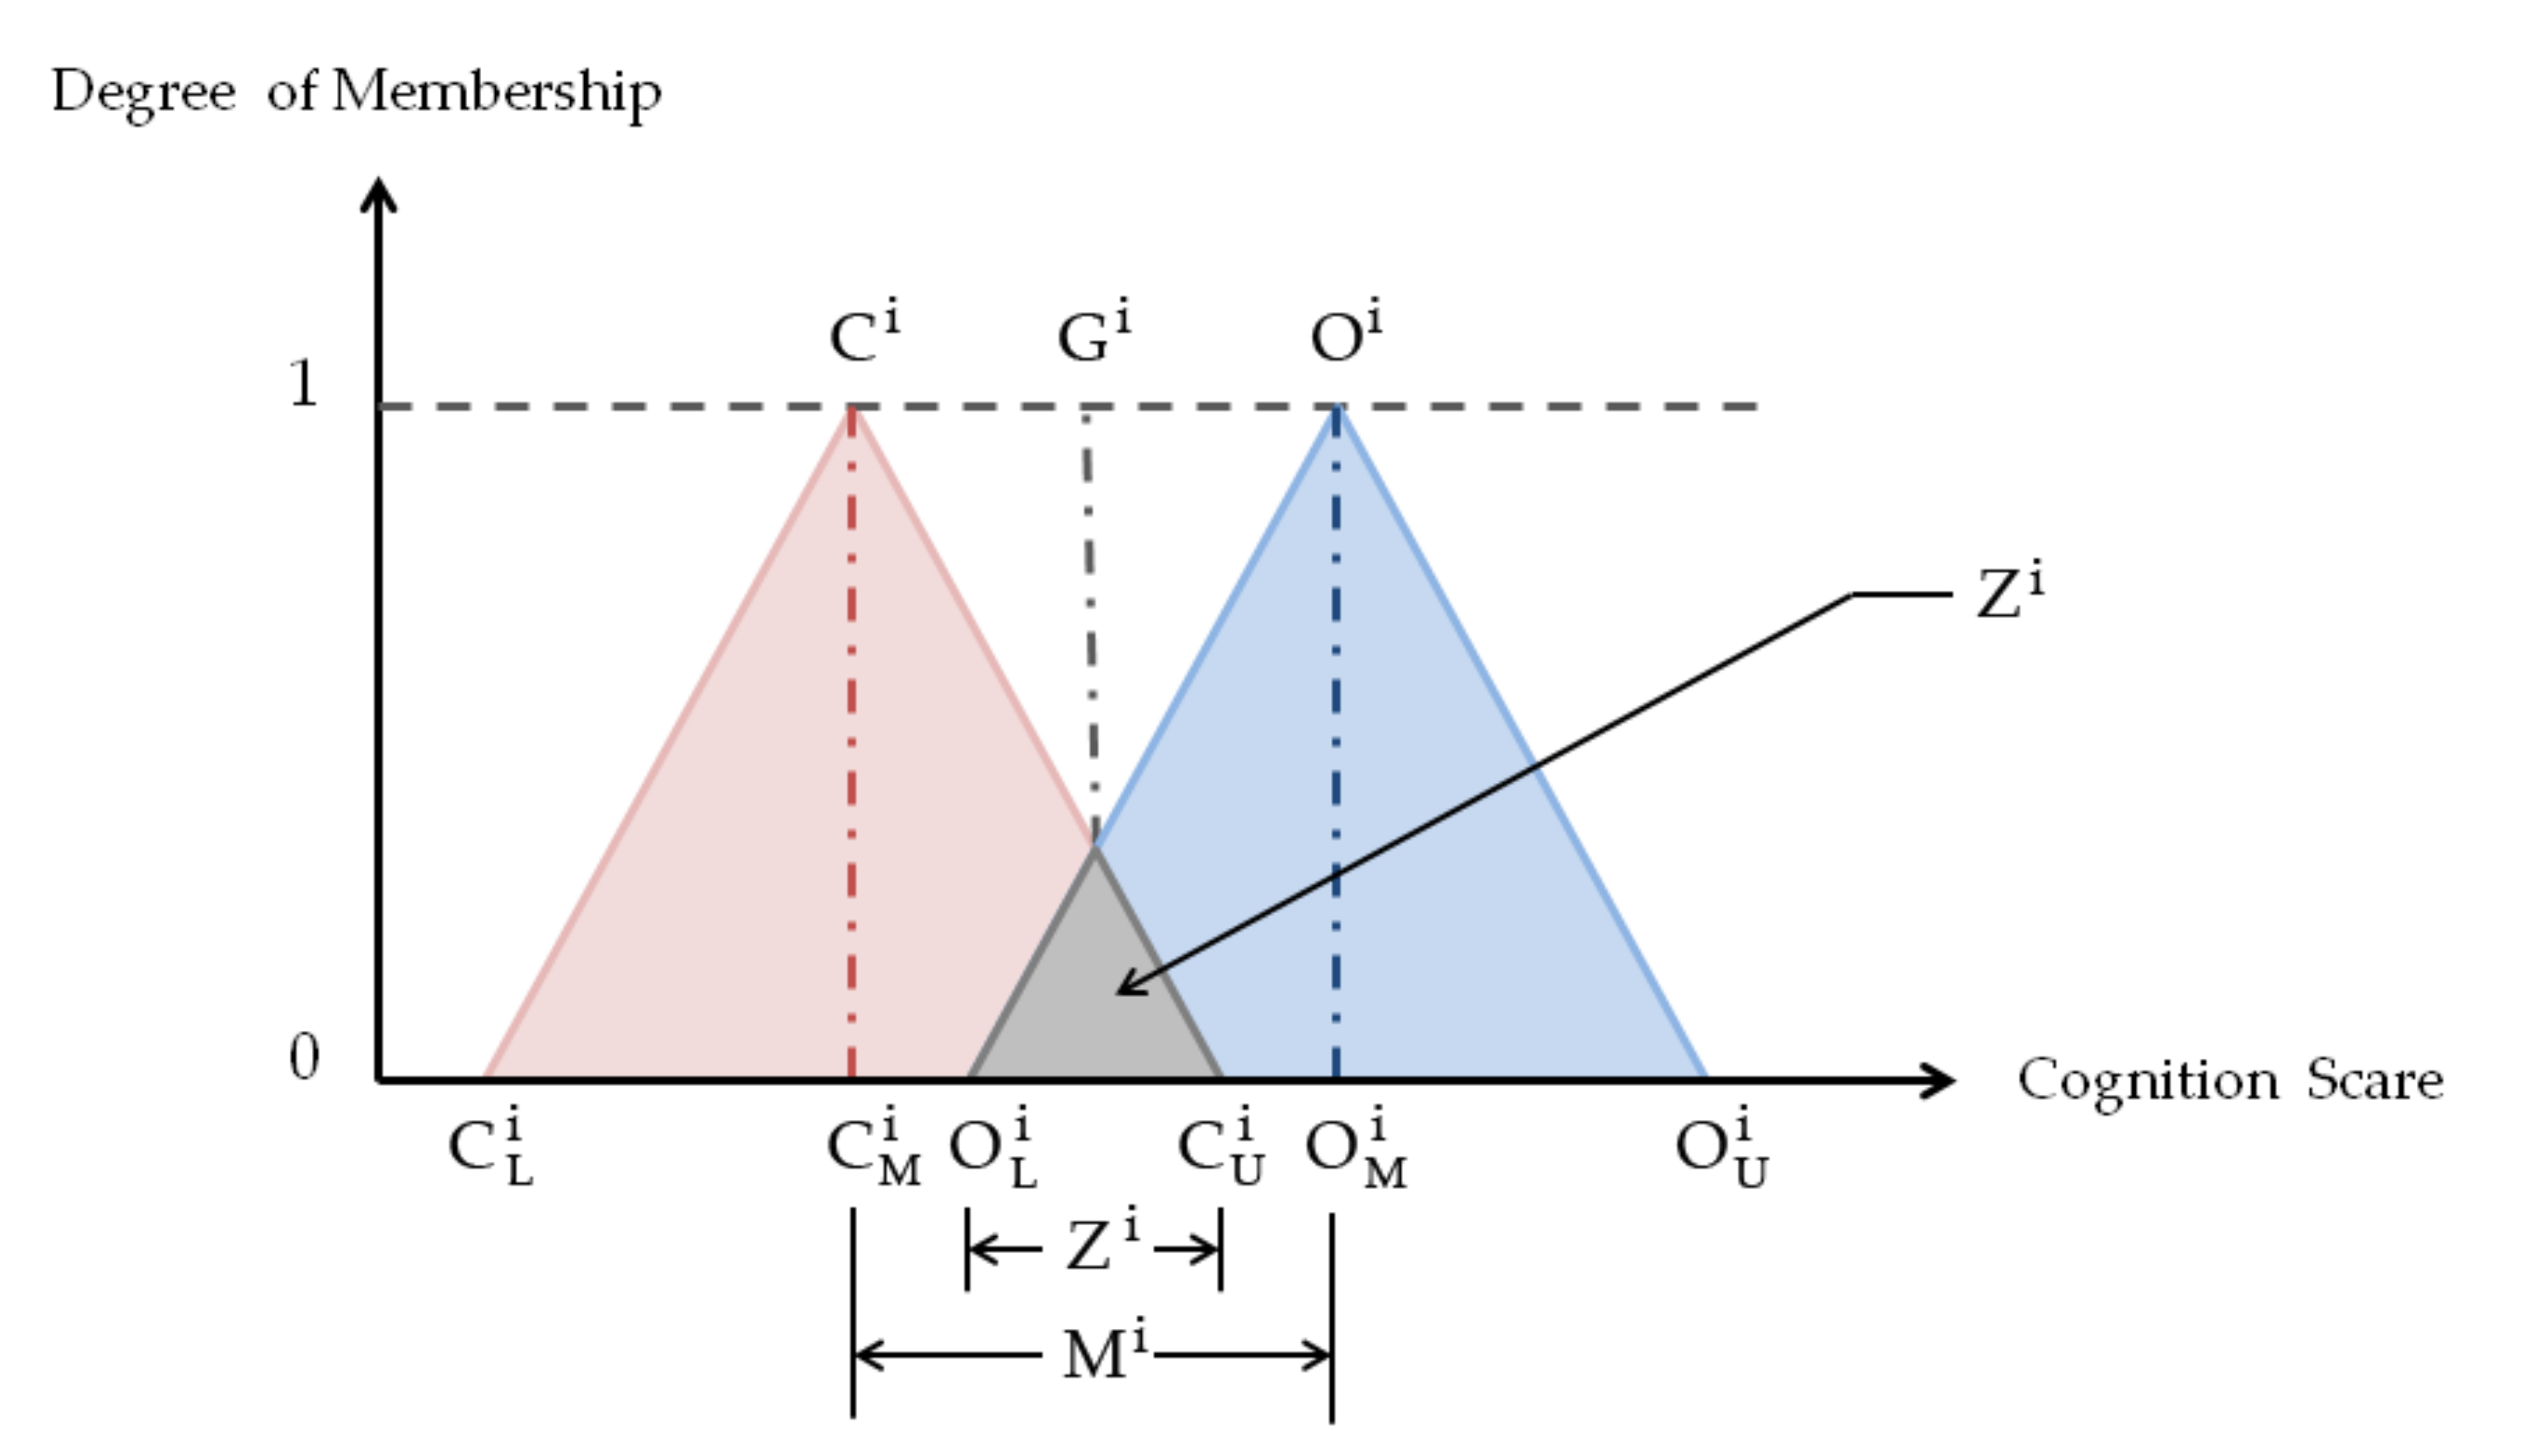
3.3. Fuzzy Delphi Method (FDM)

The Delphi Method (FDM) was proposed by Dalkey and Helmer in 1960 as a systematic process used to arrive at a group opinion or decision by surveying a panel of experts. Murray, Pipino and Gigch (1985) first applied Fuzzy theory to the Delphi Method. This is called Fuzzy Delphi Method (FDM). The Fuzzy Delphi Method is a method for screening factors. Compared with the traditional Delphi method, it has the following advantages: 1. Fuzzy Delphi Method can reduce the number of surveys. 2. The opinions of experts can be expressed more completely. 3. The knowledge of experts can be made more rational and meet the requirement through Fuzzy theory. 4. It is more economical in terms of time and cost [38,39]. Therefore, this study adopts the Fuzzy Delphi Method to select important design factors.
Generally, the Fuzzy Delphi Method can be used for the following three steps: 1. establish a set of impact factors; 2. collect opinions from the decision group; and 3. use the Fuzzy Delphi Method to calculate the evaluation value. Fuzzy Delphi Method is used for screening factors to achieve the goals set during the research. In this study, the research method of Chen Wenliang (2020) [21] was adopted, the “double-triangle fuzzy numbers” were used to integrate experts’ opinions, and the “grey zone test method” was used to test whether experts’ opinions are consistently convergent [40].
In the first stage, the experts fill out the questionnaire based on their professional competencies, subjectively, for the purpose of rating the items listed in the table and scoring the individual items on a scale ranging from 0 to 10. The higher the item is scored, the more important it is [21]. There is a column on the first page of the questionnaire, in which the experts can write their opinions if necessary to make the questionnaire more consistent with the meaning of the Fuzzy Delphi questionnaire. For the selection of innovative product design factors, the Fuzzy Delphi Method is a very useful tool for preliminary evaluation of factors rated by experts, so as to make the selection of the obtained alternative evaluation factors more objective and practical. The application and steps of the tests are described in detail as follows [41]:
Step 1: Questionnaire design and survey
First, according to the related literature reviews and inspiration, various product design factors are initially drawn up as the basis for designing a fuzzy rating scale-based questionnaire and survey selection, as shown in Table 2. A fuzzy questionnaire is designed for experts to answer all the evaluation items considered and form an appropriate expert group, asking each expert to give a possible interval value for each evaluation item. The minimum of this interval value is used to represent the expert’s “conservatively perceived value (C)” for the quantitative score of the assessment item, and the maximum of this interval value is used to represent the expert’s “optimistically perceived value (O)” for the quantitative score of the assessment item.
Step 2: Data collection and calculation
Count the “most conservatively perceived value and the most optimistically perceived value” given by all experts to each item (i), and exclude extreme values that fall outside the “double standard deviation”, and then calculate the minimum value C L i , geometric mean value C M i , and maximum value C U i of the remaining “most conservatively perceived values”, as well as the minimum value O L i , geometric mean value O M i , and maximum value O M i of the remaining “most optimistically perceived value”.
Step 3: Find the double triangular fuzzy numbers
Based on the results of step 2 above, the triangular fuzzy number C i = ( C L i ,   C M i ,   C U i ) of the “most conservatively perceived value” and the triangular fuzzy number O i = ( O L i ,   O M i ,   O U i ) of the “optimistically perceived value” of each item (i) can be found by some calculations, to obtain the double triangular fuzzy numbers, as shown in Figure 2.
Step 4: Check the degree of consensus reached by selected experts
This step is to check whether the degree of consensus reached by selected experts is acceptable, which can be judged by how the two triangular fuzzy numbers overlap:
1. There is no overlap (no gray zone area), i.e., ( C U i O L i ) . This means that opinion interval value of each expert has a consensus section and the opinions approach to the consensus section of (i). Therefore, let the “consensus importance value” G i of this evaluation item (i) be equal to the arithmetic mean of C M i and O M i , it is expressed as:
G i = C M i + O M i / 2
2. There is overlap (there is a gray zone area), i.e., ( C U i > O L i ) , and the fuzzy relationship gray zone Z i = C U i O L i is smaller than the interval range M i = O M i C M i between the “geometric average of conservatively perceived value” and the “geometric average of optimistically perceived value”. This means that although there is no area of consensus among the opinions of experts, the two experts who give extreme opinion values (the most conservative in the optimistic perception and the most optimistic in the conservative perception) do not differ too much from other experts, without resulting in divergent opinions. Therefore, let the “consensus importance value” G i of the item (i) be equal to the fuzzy set obtained by the intersection operation of the fuzzy relationship of the two triangular fuzzy numbers, and then find the quantized fraction of fuzzy set with the largest membership value [43].
F i X j = x min C i X j , O i X j
G i = { { X j   | max μ p 1
3. There is overlap (there is a gray zone area), i.e., ( C U i > O L i ) , and the fuzzy relationship gray zone Z i = C U i O L i is larger than the interval range M i = O M i C M i between the “geometric average of conservatively perceived value” and the “geometric average of optimistically perceived value”. This means that there is no area of consensus among the opinions of experts and the two experts who give extreme opinion values (the most conservative in the optimistic perception and the most optimistic in the conservative perception) differ too much from other experts, resulting in divergent opinions. Then, another round of questionnaire survey will be conducted for these items of which the opinions are divergent, and steps 1 to 4 are repeated until all opinions of all items are convergent and the consensus importance value G i is obtained.

3.4. Analytical Network Process (ANP)

TL Saaty proposed the analytic network process (ANP) [44] in the form of a network and a non-linear structure in 1996, which is mainly based on the original self-created linear structured analytic hierarchy process (AHP) by adding a feedback mechanism. Among the methods of studying multi-criteria decision problems, traditional AHP is one of the effective solutions to deal with many evaluation criteria problems that need to be considered. It constructs complex multi-criteria decision problems into a hierarchy, of which each layer is composed of different elements forming a group with nodes, which processes many qualitative factors through systematic matrix operations, and provides objectively obtained quantitative results to decision makers as a reference. However, in recent years, many social science studies have found that issues related to decision cannot be expressed simply in a hierarchical manner. There is a high degree of internal correlation: the upper and lower levels have a certain degree of mutual influence. In addition, the elements at the lower level also have interdependence with the elements at the higher level. Therefore, the analytical network process (ANP) is proposed to solve such problems [28].
In this study, the Saaty scale was adopted and the pairwise comparisons [28,45] were used to find out the importance of evaluating consumer product design indicators based on consumer needs. This questionnaire is designed to divide the evaluation scale into five levels, namely equally important (1), slightly important (3), quite important (5), very important (7), and absolutely important (9). Each of them is given a weighing value of 1, 3, 5, 7, and 9, respectively. There are also four levels between the five basic scales, and each of them is given a weighing value of 2, 4, 6, and 8, respectively. The ANP was used for the evaluation of decision problems, mainly including five steps [23], which are described in detail as follows:
Step 1: Establish a network hierarchical structure for evaluation
First, it is necessary to confirm the goal of the problem, and find the relationship between groups and the interaction between groups, which is called external dependence, and the interaction between the criteria within each group, which is called internal dependence, and draw an evaluation model architecture diagram of network hierarchy accordingly.
Step 2: Create a pairwise comparison matrix
Saaty’s scale of relative importance is one of 1 to 9, representing nine levels from equal importance to extreme importance. Decision makers must make pairwise comparisons between two groups and those between criteria. The pairwise comparison between criteria is further divided into pairwise comparison between criteria of the same group and pairwise comparison between criteria of different groups. Then, the comparisons are organized to form a pairwise comparison matrix, as shown in (4). Finally, the expert preferences are collated based on the differences of problems perceived by each decision maker, to obtain the weight of each level and find out the eigenvectors and eigenvalues.
A = a 11 a 1 j a 1 n a il a ij a in a nl a nj a nm
Step 3: Carry out consistency test
In order to judge whether the decision maker is consistent when making pairwise comparisons, the consistency ratio (CR) is calculated by dividing the consistency index for the set of judgments by the index for the corresponding random matrix (RI). When CI = 0, it means that the pairwise comparison matrix is completely consistent, when CI > 0, it means that the pairwise comparison matrix is not consistent, and when CI < 0.1, it means that the pairwise comparison matrix is consistent. Saaty (1980) suggested that CI < 0.1 is better, and when CR < 0.1, it means that the consistency of the pairwise comparison matrix is satisfactory. The test formula is as follows:
CR = CI RI
CI = λ max n n 1
Step 4: Super matrix operation
Combine the sub-matrices formed by all eigenvectors into a super matrix. If there is a blank or 0 in the matrix, it means that the decision groups or criteria are independent of each other and have no dependencies [46].
C 1 e 11 e 12 C 1 C 2 C n e 11 e 1 m 1 e 21 e 2 m 2 e n 1 e nm n e 1 m 1 W = C 2 e 21 e 22 e 2 m 2 W 11 W 12 W 1 n W 12 a 22 W 2 n W nl a n 2 W nm C n e n 1 e n 2 e nm n
Step 5: Select the optimal alternative
The overall weight of each alternative is calculated according to the weight of each feasible alternative and the relative weight between criteria in the super-matrix formation, and the optimal alternative can be selected according to the overall weight.
In 1977, Saaty [44] proposed when CI < 0.1, satisfactory consistency can be achieved, but the maximum allowable error is CI < 0.2. The RI value is determined by the order of the pairwise comparison matrix, and determined by the number (n) of the elements for pairwise comparison. Details are shown in Table 3. When CR < 0.1, the consistency of the pairwise comparison judgment matrix is satisfactory.

3.5. Selection of Experts for Questionnaire Survey

Consider those who accept this type of questionnaire, have sufficient knowledge of the research questions, and can fully cooperate during the survey period to be the experts to fill in the questionnaire. According to Zhong Zhengwei et al. (2017) [39], an expert group consisting of more than 10 members and less than 30 members makes the fewest group attribution errors and establishes the greatest credibility. For the sake of objectivity, and based on Chen Wenliang (2020) [20], 15 expert questionnaires were distributed by judgment sampling, and all the questionnaires sent out were valid. The experts were selected from those who have industrial design education background and more than 11 years of relevant work experience in consumer product design, including 4 scholars in innovative design field, 6 development designers working for relevant companies, and 5 designers working for design companies. As shown in Table 4.

4. Data Analysis and Results

4.1. FDM Analysis Results

Based on the results of the expert questionnaire and the operation steps of the Fuzzy Delphi Method by Zhang Yuquan et al. (2014) [47], Microsoft Excel was used to obtain the minimum value C m i (the most conservatively perceived value), the maximum value O m i (the most optimistically perceived value), the geometric mean, the Min value and Max value, and the difference between the optimistically perceived value and the conservatively perceived value M i , the gray zone test value Z i , and the expert consensus value G i of the evaluation factors evaluated and listed by the experts in the questionnaire, as shown in Table 5.
Among them, all the gray zone test values of Z i in this study are greater than 0, indicating that the gray zone exists. As for the difference between the optimistically perceived value and the conservatively perceived value M i , because whether the indicator is convergent depends on the relationship between the value of M i and the value of Z i , if M i > Z i , it means that the opinions of experts tend to be consistent and the indicator is convergent. If   M i > Z i , it means that the opinions of experts are too divergent, and the indicator is not convergent. Then, a second questionnaire survey must be conducted for the indicator that is convergent. For the convenience of calculation, if the difference between   M i and Z i is greater than 0, the indicator is convergent, and if the value is less than 0, the indicator is not convergent and will be excluded.
The expert consensus value G i is an important factor for screening indicators and the intersection of the minimum value C m i ’s Max value, and the maximum value O m i ’s Min value, where the two lines meet. The higher the intersection is, the higher the consensus of experts on the indicator and the greater its importance. As for the screening indicators, they are set by the decision threshold S. The value of the threshold will directly affect the number of selection criteria.
As for how to determine the appropriate threshold S, it has been mostly determined by the decision makers’ subjective judgments. Zhang Yuquan et al. (2014) believed that the threshold can be set to 6, and any G i with a value below 6 can be excluded [47]. Chen Wenliang (2021) used the arithmetic mean of the G i values of all indicators as the threshold value, and any G i with a value below the arithmetic mean can be excluded [21]. The arithmetic mean of the G i values of the indicators in this study is 6.69. If this is used as the threshold, too many indicators will be excluded and that will affect the hierarchical structure of this study, so the value 6 is used as the threshold for this study. The QTPCP design methods devised in this study, as shown in Table 4, include “QFD customer needs”, “TRIZ (Creative invention development)”, “Patent (Design trends and obstacles)”, “CAD (Actualization of design ideas)” and “Prototype (Realization of design”. When the differences between M i   and   Z i of the 5 indicators are greater than 0, the indicators are convergent. The expert consensus values of G i are 8.15, 7.23, 7.32, 7.32, 7.31, and 7.37, all greater than the threshold 6 set for this study, so they are retained. As shown in Table 5.
Table 6 shows the analysis results of the decision elements in the evaluation of customer demand for “consumer products” summarized in this study. When the differences between M i and Z i of the two indicators of “A. Product Dimension” and “B. Brand Dimension” are greater than 0, the indicators are convergent, and the expert consensus values G i are 7.35 and 7.34, which are greater than the threshold value 6 set in this study, so they are retained. As shown in Table 6.
Table 7 shows the design elements in the evaluation of customer demand for “consumer products” summarized in this study, including “a. Product type”, “b. Product material”, “c. Product color”, “d. Product texture”, “e. Product function”, “f. Human factors design”, “g. Human–machine interface”, “h. Sustainable environmental protection”, “i. Product sales”, “j. Brand value” and “k. After-sales service”. When the differences between M i and Z i of the 11 indicators are greater than 0, the indicators are convergent, and the expert consensus values of G i are 7.48, 7.33, 6.68, 7.34, 7, 8, 7.43, 6.68, 6.64, 7.28, and 6.49, respectively, all greater than the threshold 6 set in this study, so they are retained, as shown in Table 7.
Table 8 shows the design factors in the evaluation of customer demand for “consumer products” summarized in this study. Among them, the differences between M i and Z i of the 5 indicators, including “4. conveying the emotion of the story”, “16. craftsmanship is exquisite and valuable”, “40. reproducible and reusable”, “42. lengthening life cycle” and “46. brand promotion activities”, are less than 0, the indicators are not convergent. As for the other 13 indicators, including “5. modeling organic and bionics”, “6. modeling geometrically symmetrical”, “7. modeling cute and streamlined”, “9. less processing and easy to obtain”, “12. color matching natural and environmentally friendly”, “13. color harmony and bright”, “27. educational”, “28. additional functions”, “43. energy saving, carbon reduction and low consumption”, “44. material/packaging reduction”, “50. high brand awareness”, “51. manufacturing location” and “52. commodities are serial”, the expert consensus values G i are less than the threshold value 6 set in this study, so the aforementioned 18 indicators are excluded. As indicated by the “X” in the far right column of Table 8, the design factor has been excluded, as shown in Table 8.
The Fuzzy Delphi Method was used to screen out the design elements and design factors considered important, and the representative selection criteria that experts consider consumer needs when consumer products are designed. As a result, 11 design elements and 38 design factors were recognized by experts, as shown in Table 9.

4.2. Analysis Results by Analytical Network Process

As mentioned above, in the previous stage, the Fuzzy Delphi Method (FDM) was used to screen out the design elements and design factors considered important by the experts in evaluating consumer needs, and confirm their interdependence. After the analysis, the results were obtained, and 11 design elements were selected, including product type, product material, product color, product texture, product function, human factors design, human–machine interface, sustainable environmental protection, product sales, brand value and after-sales service. After the questionnaire survey and the pairwise comparison between the criteria were conducted, the data was input into the limit super-matrix of the Super Decisions, and the relative weights between the indicators were obtained [44]. Among the returned questionnaires, the pairwise comparison matrix meets the standard of C.I. ≤ 0.1, and the weight analysis of these questionnaire items that have passed the consistency check that was conducted to obtain the system network architecture of the evaluation criteria, as shown in Figure 3.
When there is only one decision maker, the result of the judgment does not involve the integration of preferences. However, if the decision group is used for evaluation, experts’ preferences must be integrated, because experts who fill in the questionnaires perceive issues differently from each other, the pairwise comparison judgment values obtained are different, and the levels of importance of the final operational performance evaluation indexes are also different. There are many methods of preferences integration. Based on the consideration of ease of judgment and simple calculation, in this study the average value of the data of the decision group is used to integrate the preferences of experts. The calculation methods of the average include the arithmetic mean and geometric mean. According to Saaty’s suggestion [44], using the geometric mean is better. In this step, the pairwise comparison matrices of experts were integrated and normalized to create an integrated pairwise comparison matrix. Table 10 is the pairwise comparison matrix of the “decision elements”, and Table 11, Table 12, Table 13, Table 14, Table 15, Table 16, Table 17, Table 18, Table 19, Table 20, Table 21, Table 22 and Table 23 are the pairwise comparison matrices of the “design elements” and the “design factors”.
After creating the super matrix, we can sort out the priority weights and overall priority weights in each dimension of the decision criteria from the super matrix, as shown in Table 24 below. As CR < 0.1, the consistency of the pairwise comparison judgment matrix of each design element is achieved. Among them, the overall priority weight is the weight value of each criterion in the limit super matrix, and the shaded part represents the most important criteria in the dimension. It can be seen from Table 24 that the “product dimension” is better than the “brand dimension”. However, experts have suggested that the “brand dimension” should belong to marketing category, so the design elements are divided into two dimensions for comparison. In this study, “e. Product function”, “f. Human factors design”, “g. Human-machine interface”, “h. Sustainable environmental protection”, “a. Product form” are the top 5 important criteria in product dimensions. The first 6 criteria for design factors are “g27. The interface is intuitive and easy to learn”, “h30. The material is non-toxic and pro-environmental”, “g26. The control feedback is fast”, “h29. Easy to disassemble and recycle”, “e18. Meet safety standards”, and “f21. Reliable, safety, and protective”. This means that consumers pay more attention to whether the product is easy to operate, made of safe and non-toxic materials, and complies with safety regulations. As for the brand dimension, consumers pay more attention to factors such as “j35. Excellent brand evaluation”, “k37. Product warranty”, and “j34. Good quality and value”.
The above data is provided to the industry as a consideration of various dimensions before designing new products. According to the method devised in this study, companies can find out the criteria considered in their current design from the relevant dimension and calculate the weight, and observe the most critical and important criteria and overall ranking in each dimension. As shown in Table 24.
The results of this study showed that the consumer product design process “QTPCP” is the optimal design strategy that the experts and scholars agreed about unanimously. In the design of consumer products, human-oriented design is the most important indicator. Among them, “e. Product function”, “f. Human factors design”, “g. Human-machine interface”, “h. Sustainable environmental protection”, and “a. Product form” are the top 5 important criteria in product dimensions. The first 6 criteria for design factors are “g27. The interface is intuitive and easy to learn”, “h30. The material is non-toxic and pro-environmental”, “g26. The control feedback is fast”, “h29. Easy to disassemble and recycle”, “e18. Meet safety standards”, and “f21. Reliable, safety, and protective”. This means that consumers pay more attention to whether the product is easy to operate, made of safe and non-toxic materials, and complies with safety regulations. As for the brand dimension, consumers pay more attention to factors such as “j35. Excellent brand evaluation”, “k37. Product warranty”, and “j34. Good quality and value”. Finally, the hierarchical relationship between the design indicators was built using the analytical network process (ANP), and the design indicators were used to interpret the structured hierarchical model, which can effectively clarify the complex interdependence between the design indicators, so that the designer can better understand the influence among the design indicators and prioritize development indicators, helpful for designers in making effective design decisions.

5. Conclusions and Suggestion

To operate sustainably, companies need to produce excellent products, understand customer needs, examine consumer psychology, and develop next-generation products in advance. Therefore, designers need to design consumer-oriented products in consumers’ position, use efficient design strategies and the selection mechanism in the design process to shape the consumer-oriented product image, and make the product that meets the market demand. The selection from design alternatives of consumer products has the characteristics of interdependence among the criteria. Therefore, it is very important to propose quantitative analyses and objective references that meet the various practical conditions, so that the company’s decision makers can accurately select the new product development and design plan that bring the greatest benefits to the company. The results and conclusions of this study are described as follows:
1. A Delphi survey was conducted to screen out five design methods (QTPCP) for evaluating product design strategies, which are QFD, TRIZ, Patent, CAD and Prototype. The analysis of the results of the questionnaire showed that experts from industry and academia have had reached a general consensus about these design strategies, the consensus value obtained is high (the threshold value is above 7.23, and the importance score is 0 to 10 points), and they all agreed that the design strategies can be widely used for the design of other products.
2. In order to simplify the complexity and difficulty of the analysis process, many previous studies on the selection of product design alternatives did not cover all the impact dimensions that should be considered. In this study, design elements of different products were collected and collated, the evaluation criteria were selected using the Fuzzy Delphi Method (FDM), used as the basis for the Delphi survey, and the priority value of the interdependence and design factors were obtained through the comprehensive calculation of the super matrix, which can be used to select the optimal product design.
3. The results of this study, the “key design factor indicators”, will be provided as a reference for subsequent consumer product related companies to design and develop new products and examine the output results of each stage, one by one, according to the indicators and factors, to ensure that they meet consumer needs. Understanding the voices of consumers based on the results of this study and considering design conditions based on consumer demand will provide companies and designers with new thinking in product design, thereby enhancing product competitiveness and creating new opportunities for the industry.
As for the research on the selection of product design factors, the following suggestions and future research directions are also put forward:
1. When the Fuzzy Delphi Method is used to select the evaluation criteria of product design factors, because the selection is determined based on the subjective cognition of experts and scholars, the careful selection of experts and scholars directly affects the correctness of the selection of the product design factors’ evaluation criteria.
2. There are quite a lot of factors in the analytical network process used for this study, and it is necessary to make pairwise comparisons of the interdependence between factors. The procedure is quite complicated, so that experts need to do the interdependence analysis of factors when conducting the questionnaire survey. Therefore, it requires considerable patience, so it is suggested that other weighted comparison methods can be used to replace the complicated questionnaire survey procedure and the weight calculation process after conducting the questionnaire survey.
3. This study was not designed to verify the case of new product design. It is suggested that this evaluation model be applied to different types of product design alternatives in the future, to compare and analyze the results of different empirical studies, and then make more specific contributions to the design field.

Author Contributions

Conceptualization, K.-C.Y. and J.-Y.L.; formal analysis, J.-Y.L.; funding acquisition, K.-C.Y.; methodology, K.-C.Y. and J.-Y.L.; software, J.-Y.L.; supervision, K.-C.Y., W.-T.H. and J.-C.T.; writing—original draft, J.-Y.L.; writing—review and editing, K.-C.Y. and and J.-Y.L. All authors have read and agreed to the published version of the manuscript.

Funding

The research was funded by the Ministry of Science and Technology of Taiwan, Republic of China, grant number MOST 110-2622-H-018-001.

Conflicts of Interest

The authors declare no conflict of interest.

References

  1. Chang, J.-C.; Lin, W.-C. Using Innovation Diffusion Theory to Examine Persona Design-A Case Study in Table PC. J. Cult. Creat. Ind. Res. 2013, 3, 85–96. [Google Scholar] [CrossRef]
  2. Fan, M.; Chiou, M.-H. A study of the factors effecting the time-to- market of new product development. In Proceedings of the 2005 9th Conference on Interdisciplinary and Multifunctional Business Management, Taipei, Taiwan, 28 May 2005; pp. 577–592. [Google Scholar]
  3. Chou, C.-C. Research of Product Designing Using the Working standard Process. J. Lan Yang Inst. Technol. 2015, 14, 43–51. [Google Scholar] [CrossRef]
  4. Wu, C.-H.; Luh, D.-B. Myths Surrounding Innovation Design in the Industry 4.0 Era. Manag. Rev. 2018, 37, 35–51. [Google Scholar] [CrossRef]
  5. Hsu, Y.-T. A Study on the Pedagogical Content Knowledge of Technology Education. Technol. Hum. Educ. Q. 2015, 2, 16–29. [Google Scholar] [CrossRef]
  6. Sung, M.-H.; Wang, B.-J.; Yang, K.-L. Constructing a Theory-driven and Practice-based Intelligent Innovation Model: A Case Study on Foot Pedals. J. Sci. Eng. Technol. 2012, 8, 1–8. [Google Scholar] [CrossRef]
  7. Hung, K.-C.; Wang, C.-H.; Nien, S.-H.; Tu, C.-P.; Wang, P.-K.; Chen, P.; Chang, W.-F. Establishment of Quality Function Deployment Model Based on an Intuitionistic Fuzzy Approach: Optical Lens Development and Design. J. Qual. 2012, 19, 581–601. [Google Scholar] [CrossRef]
  8. Li, X.M.M.; Zheng, M.; Xu, Z.; He, L. A framework of product innovative design process based on TRIZ and Patent Circumvention. J. Eng. Des. 2013, 24, 830–848. [Google Scholar] [CrossRef]
  9. Huang, H.-F.; Hsieh, M.-H.; Hsieh, Y.-W. Comparison of Usability in the Different Design Drawing Tools for Industrial Design Students. J. Ergon. Study 2019, 21, 27–39. [Google Scholar] [CrossRef]
  10. Kuo, Y.-M.; Lin, Z.-C.; Tan, A.Y.K. Applying Design Thinking to the Research and Development of Innovative Nursing Devices. J. Nurs. Res. 2021, 68, 13–18. [Google Scholar] [CrossRef]
  11. Chang, W.C.; Lin, M.H. A Comparison Study between the Product Form Image and Product Form Feature. J. Des. 2004, 9, 59–70. [Google Scholar] [CrossRef]
  12. Chávez, F.C.; Chaurand, R.A.; Ávila, I.C.L. Effect of Subjective Evaluation Factors on the Buying Decision of Residential Furniture. Procedia Manuf. 2015, 3, 6467–6474. [Google Scholar] [CrossRef] [Green Version]
  13. Huang, H.-F.; Hsieh, M.-H.; You, J.-W. The Investigation of 3C Product’s Value in the Perception—The Case of Surface Materials and Shapes. J. Ergon. Study 2020, 22, 1–15. [Google Scholar] [CrossRef]
  14. Chen, W.-L.; Chiang, Y.-M.; Hsh, M.-Y. A Study on the Product Design Impact Factors of the Dehumidifier. J. SHU-TE Univ. 2014, 16, 39–51. [Google Scholar]
  15. Chou, W.-R. Product Design under the Green Thinking: Case Studies. Praxes 2014, 8, 114–131. [Google Scholar]
  16. Tu, J.-C.; Wu, C.-N. Impact of Awareness and Attitude of Environmental Protection and Green Consumption Behavior on Green Furniture Design. J. Des. 2005, 10, 21–35. [Google Scholar] [CrossRef]
  17. Chou, S.-H.; Chu, H.-M.; Chiou, C.-Y.; Zhang, B.-K. Exploring the Relationship between Importance and Satisfaction on Product Attributes for GPS Sport Watch Users. J. Tour. Leis. Manag. 2016, 4, 89–99. [Google Scholar] [CrossRef]
  18. Prati, E.; Villani, V.; Peruzzini, M.; Sabattini, L. An Approach Based on VR to Design Industrial Human-Robot Collaborative Workstations. Appl. Sci. 2021, 11, 11773. [Google Scholar] [CrossRef]
  19. Chen, Z.-J.; Chen, J.-X. Evaluation of the usability of the smartphone operating interface. Ind. Des. 2011, 124, 52–57. [Google Scholar] [CrossRef]
  20. Lim, Y.R.; Ariffin, A.S.; Ali, M.; Chang, K.-L. A Hybrid MCDM Model for Live-Streamer Selection via the Fuzzy Delphi Method, AHP, and TOPSIS. Appl. Sci. 2021, 11, 9322. [Google Scholar] [CrossRef]
  21. Chen, W.-L. Integrating FDM and ISM to Analyze the Key Design Indicators of Children Furniture. J. SHU-TE Univ. 2020, 22, 49–66. [Google Scholar]
  22. Lai, W.-T. Constructing Performance Indicators for the Total Quality Teaching Method Using the Fuzzy Delphi Method. Int. J. Intell. Technol. Appl. Stat. 2021, 14, 19–31. [Google Scholar] [CrossRef]
  23. Li, W.-X.; Chang, Y.-Y.; Zhu, J.-W. Using ANP Model to Explore the Factors Considered by Consumers in Purchasing Sports Equipment. J. Leis. Tour. Sport Health 2010, 15, 49–61. [Google Scholar] [CrossRef]
  24. Ibrahim, M.; Bassford, M.; Ackerley, H.; Cornelius, V. Creative design dynamics and creative systems. IEEE Aerosp. Electron. Syst. Mag. 2010, 25, 30–34. [Google Scholar] [CrossRef]
  25. Chaung, Y.-J.; Wang, C.-T.; Lee, Y.-J.; Wang, T.-H.; Lin, C.-B. Research on R & D and Innovation of Multi-functional Creative Building Block Series. Tajen J. 2020, 54, 21–45. [Google Scholar]
  26. Chang, P.-T.; Sung, Y.-C.; You, J.-G. Relationship among Nike’s Brand Image, Value, and Satisfaction. Taiwan Hosp. Tour. J. 2015, 10, 39–52. [Google Scholar]
  27. Chen, W.-L.; Su, Y.-L.; Chang, S.-M. Application of Customer-Oriented to Explore Toy Product Design Demand Quality and Planning Matrix. J. Prof. Mech. Eng. 2011, 4, 6–11. [Google Scholar] [CrossRef]
  28. Wei, W.-L.; Chang, W.-C. A Study on Selecting Optimal Product Design Solution Using Fuzzy Delphi Method and Analytic. J. Des. 2005, 10, 59–77. [Google Scholar] [CrossRef]
  29. Wu, C.-F.; Lin, K.-C.; Yang, C.-Y.; Liao, S.-F. The Influence of Relationship between Distinct Hand Tools and Universal Design Scales with Screwdriver. J. Des. 2016, 21, 25–43. [Google Scholar]
  30. Yang, C.-M.; Liu, Z.-H.; Kao, C.-H.; Wang, X.-G. A Preliminary Study on DFX Based Green Product Assessment. Ind. Des. 2008, 119, 201–205. [Google Scholar] [CrossRef]
  31. Hsiao, S.-W.; Zheng, J.-L. Application Research of Synchronous Design Strategy in Thermos Design. Ind. Des. 2010, 122, 1–6. [Google Scholar] [CrossRef]
  32. Chien, C.-W. How Form of Products can Affect Users’ Functional and Emotional Cognition: Case Study on Cell Phone and Fan. J. Des. Sci. 2019, 22, 85–110. [Google Scholar] [CrossRef]
  33. Su, C.-H.; Wang, S.-H.; Tsai, T.-L. Applying Kano Two-Dimensional Quality Model to Explore FPS Games the Customer Demand of Desktop Computers. Takming Univ. J. 2015, 39, 59–74. [Google Scholar]
  34. Wu, H.-L.; Chen, J.-H. Survey the Tactic Performed Fashion Color by the Viewpoint of Marketing Communication. J. Des. Res. 2004, 4, 53–59. [Google Scholar] [CrossRef]
  35. Wang, Y.; Liu, S. Ergonomic design of handheld products. Chin. J. Ergon. 2011, 17, 52–55. [Google Scholar]
  36. Fang, C.-W.; Chang, P.-Y.; Ning, H.-C.; Huang, C.-H.; Lo, M.-F.; Hung, C.-C.; Lin, H.-L.; Chu, T.-L.; Tsao, K.-C. Application of an Innovative Quality Assessment Form for Medical Technology E-learning Materials: A Practical Design Facilitating Positive Learning Experiences. J. Biomed. Lab. Sci. 2020, 32, 117–135. [Google Scholar]
  37. Huang, S.-Y.; Wang, C.-Y. Product Design Investigation of Mobile Phone VR Headset. J. Qual. 2021, 28, 33–53. [Google Scholar] [CrossRef]
  38. Noorderhuben, N. Strategic Decision Making; Addison-Wesley: Boston, MA, USA, 1995. [Google Scholar]
  39. Chung, C.-W.; Xu, Y.-J.; Chen, Y.-A.; Hsin, J.-C. Study on the Construction of Development Indicators of Recreational Fisheries by the Fuzzy Delphi Method. Kaohsiung Norm. Univ. J. Educ. Soc. Sci. 2017, 43, 85–98. [Google Scholar]
  40. Wang, W.-M.; Peng, H.-H. A Fuzzy Multi-Criteria Evaluation Framework for Urban Sustainable Development. Mathematics 2020, 8, 330. [Google Scholar] [CrossRef] [Green Version]
  41. Hsu, H.-M.; Wey, W.-M.; Tsai, P.-J. The Applications of Analytic Network Process to the Priorities of Interdependent Housing Projects Selection. J. Archit. 2007, 62, 49–74. [Google Scholar]
  42. Jeng, T.-B. Fuzzy Assessment Model for Maturity of Software Organization in Improving its Staff’s Capability. Master’s Thesis, National Taiwan University of Science and Technology, Taipei, Taiwan, 1996. [Google Scholar]
  43. Chiu, Y.-H.; Jheng, Y.-M.; Hsieh, T.-Y. Using Fuzzy Delphi Method and Analytic Network Process in the Development Assessment of the Cultural and Creative Industries Park. J. Archit. 2012, 80, 85–109. [Google Scholar] [CrossRef]
  44. Saaty, T.L. The Analytic Hierarchy Process: Planning, Priority Setting, Resource Allocation; McGraw-Hill: New York, NY, USA, 1980. [Google Scholar]
  45. Rodrigues, D.; Godina, R.; da Cruz, P.E. Key Performance Indicators Selection through an Analytic Network Process Model for Tooling and Die Industry. Sustainability 2021, 13, 13777. [Google Scholar] [CrossRef]
  46. Lin, C.-T.; Chiang, C.-Y. Developing and Applying a Selection Model for Corrugated Box Precision Printing Machine Suppliers. Mathematics 2021, 9, 68. Available online: https://www.mdpi.com/2227-7390/9/1/68 (accessed on 5 December 2021). [CrossRef]
  47. Chang, S.-S. Fuzzy Multi-Criteria Decision Making For. Evaluation Method; Wu-Nan Culture Enterprise: Taipei, Taiwan, 2012. [Google Scholar]
Figure 1. Research Framework (compiled by this research).
Mathematics 10 00397 g001
Figure 2. Double Triangular Fuzzy Numbers [42].
Mathematics 10 00397 g002
Figure 3. The system network structure of the evaluation standard (compiled by this research).
Mathematics 10 00397 g003
Table 1. Establishment of product innovation design strategy QTPCP (compiled by the researcher).
Design Stage [24]Design MethodsDefinition Description
ScopeQFD (User needs) [7]Starting from clarifying the “user needs”, the design factors are summarized and transformed into the system requirements and functions the product.
IdeaTRIZ (Creative invention development) [8]Use creative imagination and make a breakthrough based on the “TRIZ” innovation principles. Find out the problem of different aspects of the product and propose an innovative design process for the product.
Patent (Design trends and obstacles) [6,8]Conduct the “patent analysis” and sort out the innovative countermeasures, to create feasible designs and avoid patent infringement.
CAD (Actualization of design ideas) [9]Use “CAD” drawing tools to design ID and MD of product to actualize and digitize the concept.
PrototypePrototype (Realization of designs) [10]Use a digital processing machine (3D Print, CNC, etc.) to make a “prototype” to verify that it meets user needs.
Table 2. Establishment of consumer product innovation design factors (compiled by this research).
Design IndicatorDecision ElementsDesign ElementsDesign FactorsLiterature Review (Scholar/Year)
W. R., Chou, (2014) [15]C., Tu, et al. (2005) [16]Y. J., Chaung, et al. (2020) [25]W. C., Chang et al. (2004) [11]P. T., Chang, et al. (2019) [26]S. H., Chou, et al. (2016) [17]W. L., Chen, (2020) [21]W. L., Chen, et al. (2014) [14]W. L., Chen, et al. (2011) [27]W. L., Wei, et al. (2005) [28]C. F., Wu, et al. (2016) [29]C. M., Yang, et al. (2008) [30]S. W., Xiao, et al. (2010) [31]C. W., Chien, et al. (2018) [32]C. H., Su, et al. (2015) [33]H. L., Wu, et al. (2004) [34]C. C., Chen, et al. (2011) [19]W. H., Li, et al. (2010) [23]Y. Wang, (2011) [35]C.F., Cortés, et al. (2015) [12]F. Chunhua. et al. (2020) [36]S. Y., Huang, et al. (2021) [37]
User DemandA. Product Aspectsa. Product Type1. Moderate size O OO O
2. Reasonable body weight O OO
3. Unique style OOOOO O OO O
4. Convey the emotion of the story OO O
5. Modeling organic bionics O O
6. The shape is geometrically symmetrical O
7. The shape is cute and streamlined O
b. Product Material8. Meet functional requirements OO O
9. Less processing and easy access O
10. Easy to clean and maintain O O
c. Product Color11. Sense of the trend O O
12. Natural color and environmental friendly O O
13. Harmonious and bright color O O O
14. Unique personality O O
d. Product Texture15. Anti-slip and comfortable touch O O
16. Delicate craft value O
17. Unique texture O
e. Product Function18. Convenient and friendly control O O OO O O
19. Unique and innovative functions O OOO O O
20. Storage is light and easy O O
21. The structure is stable and durable O O O OO OO
22. Easy to carry and transport O O O
23. Easy to assemble and adjust O
24. Easy to disassemble and repair OO O O O O
25. Modularization and easy replacement O OOO O O
26. Comply with safety regulations OO O
27. With education and learning O O
28. Additional functions O O O O
f. Human Factor Design29. Comfortable to operate and wear O O O O
30. Energy-saving, labor-saving and low-consumption O
31. Reliable safety protection O O
32. The size can be adjusted O
33. Detailed operating instructions O O
34. No burrs and sharp corners O
g. Human–Machine interface35. Good icon recognition O
36. Fast control feedback O O O
37. The interface is intuitive and easy to learn O O
38. High extension compatibility O O
h. Sustainable Environmental Protection39. Easy to disassemble and recycleOO O O O
40. Reproduction and reuseOO O O O
41. The material is non-toxic and friendlyOO OO O O
42. Longer life cycle O O O
43. Energy saving, carbon reduction and low consumptionO O O O OO
44. Material/packaging reductionO O
B. Brand Aspectsi. Product Sales45. Real price level O O O
46. Brand Promotions O O O
47. Experience physical access O
j. Brand Value48. Personal style and taste O O O
49. Good quality and value O O O
50. High brand awareness O O O
51. Manufacturing location O
52. Commodities are serial O
53. Excellent brand evaluation O O
k. After-sales Service54. Good repair service O O O O O
55. With product warranty O
56. Professional and friendly customer service O
Table 3. Random index (RI).
Steps123456789101112131415
R.I0.000.000.580.901.121.241.321.411.451.491.511.481.561.571.59
Table 4. Statistical analysis table of basic data of research object (compiled by this research).
TypeItemEffective Number of SamplesPercentage (%)
IdentityInnovative design research scholars
Enterprise development designer
Design company designer
4
6
5
27
40
33
EducationCollege
University
Master
PhD
1
2
11
1
7
13
73
7
Working Experience5–10 years
11–15 years
16–20 years
More than 20 years
0
5
6
4
0
33
40
27
Job & DutySenior Executives
(Chairman, General Manager, Chief Executive Officer)
Supervisor (associate, manager, director, section chief)
Staff (engineers, designers)
6

5
4
40

33
27
Table 5. The QTPCP design methods devised in this study (compiled by this research).
Aspects & IndicatorGrey Zone Certified ValueDifference between Optimistic and Conservative Cognition ValueMi-Zi Show ConvergedConsensus ImportanceDel or Not
Z i = C U i O L i M i = O M i C M i M i Z i G i
QFD (User needs)14.163.168.15
TRIZ (Creative invention development)14.213.217.23
Patent (Design trends and obstacles)13.82.87.32
CAD (Actualization of design ideas)13.562.567.31
Prototype (Realization of designs)13.482.487.37
Table 6. This research has summarized the results of the analysis of the decision-making elements of the customer demand (compiled by this research).
Aspects & IndicatorGrey Zone Certified ValueDifference between Optimistic and Conservative Cognition ValueMi-Zi Show ConvergedConsensus ImportanceDel or Not
Z i = C U i O L i M i = O M i C M i M i Z i G i
A. Product Dimension13.552.557.35
B. Brand Dimension14.13.17.34
Table 7. Design elements of customer demand (compiled by this research).
Aspects & IndicatorGrey Zone Certified ValueDifference between Optimistic and Conservative Cognition ValueMi-Zi Show ConvergedConsensus ImportanceDel or Not
Z i = C U i O L i M i = O M i C M i M i Z i G i
a. Product Type23.491.497.48
b. Product Material13.682.687.33
c. Product Color23.71.76.68
d. Product Texture13.722.727.34
e. Product Function23.41.47
f. Human Factor Design03.393.398
g. Human–Machine Interface13.532.537.43
h. Sustainable Environmental Protection23.751.536.68
i. Product Sales24.452.456.64
j. Brand Value14.333.337.28
k. After-sales Service34.021.026.49
Table 8. This research has summarized the design factors of customer demand (compiled by this research).
Aspects & IndicatorGrey Zone Certified ValueDifference between Optimistic and Conservative Cognition ValueMi-Zi Show ConvergedConsensus ImportanceDel or Not
Z i = C U i O L i M i = O M i C M i M i Z i G i
1. Moderate size03.83.87
2. Reasonable body weight03.93.97
3. Unique style34.21.26.21
4. Convey the emotion of the story43.6−0.44.42X
5. Modeling organic bionics1434.54X
6. The shape is geometrically symmetrical13.72.75.38X
7. The shape is cute and streamlined23.81.84.15X
8. Meet functional requirements13.92.97.33
9. Less processing and easy access33.70.75.67X
10. Easy to clean and maintain33.40.46.31
11. Sense of the trend24.12.16.54
12. Natural color and environmental friendly2425.11X
13. Harmonious and bright color23.61.65.78X
14. Unique personality34.11.16X
15. Anti-slip and comfortable touch13.62.66.43
16. Delicate craft value43.3−0.76.73X
17. Unique texture13.62.66.1
18. Convenient and friendly control13.62.67.4
19. Unique and innovative functions23.71.76.7
20. Storage is light and easy23.61.66.8
21. The structure is stable and durable13.52.57.3
22. Easy to carry and transport13.62.66.5
23.Easy to assemble and adjust23.61.66.9
24. Easy to disassemble and repair13.72.76.5
25. Modularization and easy replacement23.51.56.9
26. Comply with safety regulations13.62.67.4
27. With education and learning13.92.95.4X
28. Additional functions14.23.25.4X
29. Comfortable to operate and wear03.23.28
30. Energy-saving, labor-saving and low-consumption23.11.16.9
31. Reliable safety protection03.43.48
32. The size can be adjusted23.31.36.8
33. Detailed operating instructions33.50.56.8
34. No burrs and sharp corners23.71.77.5
35. Good icon recognition03.43.48
36. Fast control feedback23.31.37
37. The interface is intuitive and easy to learn13.32.38.3
38. High extension compatibility33.40.46.4
39. Easy to disassemble and recycle33.90.96.2
40. Reproduction and reuse43.8−0.25.5X
41. The material is non-toxic and friendly33.60.66.3
42. Longer life cycle53−25.9X
43. Energy saving, carbon reduction and low consumption23.31.35.2X
44. Material/packaging reduction4405.7X
45. Real price level23.31.36.8
46. Brand Promotions63.4−2.45.3X
47. Experience physical access13.72.77.3
48. Personal style and taste23.71.76.6
49. Good quality and value13.62.67.3
50. High brand awareness33.60.65.8X
51. Manufacturing location33.40.45.5X
52. Commodities are serial33.60.65.5X
53. Excellent brand evaluation03.93.98
54. Good repair service13.52.57.4
55. With product warranty13.62.67.4
56. Professional and friendly customer service03.33.38
Table 9. Results of screening design factors for customer needs assessment (compiled by this research).
Design IndicatorDecision ElementsDesign ElementsDesign Factors
User DemandA. Product Dimensiona. Product Typea1. Moderate size
a2. Reasonable body weight
a3. Unique style
b. Product Materialb4. Meet functional requirements
b5. Easy to clean and maintain
c. Product Colorc6. Sense of the trend
c7. Unique personality
d. Product Textured8. Anti-slip and comfortable touch
d9. Unique texture
e. Product Functione10. Convenient and friendly control
e11. Unique and innovative functions
e12. Storage is light and easy
e13. The structure is stable and durable
e14. Easy to carry and transport
e15. Easy to assemble and adjust
e16. Easy to disassemble and repair
e17. Modularization and easy replacement
e18. Comply with safety regulations
f. Human Factor Designf19. Comfortable to operate and wear
f20. Energy-saving, labor-saving and low-consumption
f21. Reliable safety protection
f22. The size can be adjusted
f23. Detailed operating instructions
f24. No burrs and sharp corners
g. Human–Machine Interfaceg25. Good icon recognition
g26. Fast control feedback
g27. The interface is intuitive and easy to learn
g28. High extension compatibility
h. Sustainable Environmental Protectionh29. Easy to disassemble and recycle
h30.The material is non-toxic and friendly
B. Brand Dimensioni. Product Salesi31. Real price level
i32. Experience physical access
j. Brand Valuej33. Personal style and taste
j34. Good quality and value
j35. Excellent brand evaluation
k. After-sales Servicek36. Good repair service
k37. With product warranty
k38. Professional and friendly customer service
Table 10. Pairwise comparison matrix between “Decision Elements” dimensions.
Aspects & IndicatorAB
A. Product Dimension11.2889
B. Brand Dimension0.77591
Table 11. Pairwise comparison matrix between “Design Elements” of product A dimensions.
Design Elementsa.b.c.d.e.f.g.h.
a. Product Type11.91341.87301.05330.44090.61700.56911.2620
b. Product Material0.522611.19400.45510.34950.33930.31450.5450
c. Product Color0.53390.837510.38360.29330.24240.28180.5645
d. Product Texture0.94942.19732.606910.29180.33480.46820.5799
e. Product Function2.26812.86123.40953.427010.78840.63630.7619
f. Human Factor Design1.62072.94724.12542.98691.268410.47140.8621
g. Human–Machine interface1.75723.17973.54862.13581.57162.121311.0043
h. Sustainable Environmental Protection0.79241.83491.77151.72441.31251.16000.99571
Table 12. Pairwise comparison matrix between “Decision Elements” of brand B dimensions.
Design Elementsi.j.k.
i. Product Sales10.35610.5209
j. Brand Value2.808210.9665
k. After-sales Service1.91981.03471
Table 13. Pairwise comparison matrix between “Design Factors” of product A dimensions.
Design Factorsa.1.a.2.a.3.
a.1. Moderate size1 1.3498 1.4986
a.2. Reasonable body weight0.7409 1 1.2550
a.3. Unique style0.6673 0.7968 1
Table 14. Pairwise comparison matrix between “Design Factors” of product material B dimensions.
Design Factorsb.4. b.5.
b.4. Meet functional requirements1 1.6336
b.5. Easy to clean and maintain0.6121 1
Table 15. Pairwise comparison matrix between “Design Factors” of product color C dimensions.
Design Factorsc.6. c.7.
c.6. Sense of the trend10.7141
c.7. Unique personality1.40041
Table 16. Pairwise comparison matrix between “Design Factors” of product texture D dimensions.
Design Factorsd.8. d.9.
d.8. Anti-slip and comfortable touch1 1.0601
d.9. Unique texture0.9433 1
Table 17. Pairwise comparison matrix between “Design Factors” of product function E dimensions.
Design Factorse.10. e.11.e.12. e.13. e.14. e.15. e.16. e.17.e.18.
e.10. Convenient and friendly control1 0.9968 1.1780.77991.17191.52111.94681.93680.6153
e.11. Unique and innovative functions1.0032 1 0.83510.60210.87831.08560.9711.31380.4953
e.12. Storage is light and easy0.8489 1.1975 1 0.33450.47660.44110.52280.73390.3818
e.13. The structure is stable and durable1.2822 1.6609 2.9895 1 1.48741.17231.24811.08450.2757
e.14. Easy to carry and transport0.8533 1.1386 2.0982 0.6723 1 0.67980.46070.49180.3274
e.15. Easy to assemble and adjust0.6574 0.9211 2.2671 0.8530 1.4710 1 0.95350.93850.3099
e.16. Easy to disassemble and repair0.8533 1.0299 1.9128 0.8012 2.1706 1.0488 1 1.08710.3437
e.17. Modularization and easy replacement0.5163 0.9211 1.3626 0.9221 2.0333 1.0655 0.9199 1 0.4066
e.18. Comply with safety regulations1.6252 2.0190 1.9128 3.6271 3.0544 3.2268 2.9095 2.4594 1
Table 18. Pairwise comparison matrix between “Design Factors” of human factors design F dimensions.
Design Factorsf.19. f.20. f.21. f.22. f.23. f.24.
f.19. Comfortable to operate and wear1 2.0638 0.51731.2252.01970.8027
f.20. Energy-saving, labor-saving and low-consumption0.4845 1 0.50750.94771.62130.8677
f.21. Reliable safety protection1.9331 1.9704 1 2.14632.87691.2001
f.22. The size can be adjusted0.8163 1.0552 0.4659 1 1.86341.0164
f.23. Detailed operating instructions0.4951 0.6168 0.3476 0.5367 1 0.5206
f.24. No burrs and sharp corners1.2458 1.1525 0.8333 0.9839 1.9209 1
Table 19. Pairwise comparison matrix between “Design Factors” of human–machine interface G dimensions.
Design Factorsg.25. g.26. g.27. g.28.
g.25. Good icon recognition1 0.7740 0.31751.0527
g.26. Fast control feedback1.2920 1 0.46351.4805
g.27. The interface is intuitive and easy to learn3.1496 2.1575 1 1.9542
g.28. High extension compatibility0.9499 0.6754 0.5117 1
Table 20. Pairwise comparison matrix between “Design Factors” of sustainable environmental protection H dimensions.
Design Factorsh.29. h.30.
h.29. Easy to disassemble and recycle1 0.5837
h.30. The material is non-toxic and friendly1.7132 1
Table 21. Pairwise comparison matrix between “Design Factors” of product sales I dimensions.
Design Factorsi.31. i.32.
i.31. Real price level1 1.5879
i.32. Experience physical access0.6298 1
Table 22. Pairwise comparison matrix between “Design Factors” of brand value J dimensions.
Design Factorsj.33. j.34.jj.35.j
j.33. Personal style and taste1 0.5110 0.3075
j.34. Good quality and value1.9569 1 1.0679
j.35. Excellent brand evaluation3.2520 0.9364 1
Table 23. Pairwise comparison matrix between “Design Factors” of brand value K dimensions.
Design Factorsk.36. k.37.k.38
k.36. Good repair service1 1.0521 1.2119
k.37. With product warranty0.9505 1 1.828
k.38. Professional and friendly customer service0.8252 0.5470 1
Table 24. Overall weighting (compiled by this research).
Design IndicatorDecision ElementsDecision WeightingDesign ElementsElements WeightingDesign FactorsFactors WeightingOverall WeightingSortingCR
DemandA. Product Dimension0.563 g. Human–Machine interface0.208g25. Good icon recognition0.1990.0414110.013
g26. Fast control feedback0.2700.05623
g27. The interface is intuitive and easy to learn0.5310.11041
g28. High extension compatibility0.2110.04399
f. Human Factor Design0.172 f19. Comfortable to operate and wear0.1780.0306150.012
f20. Energy-saving, labor-saving and low-consumption0.1300.022423
f21. Reliable safety protection0.2740.04716
f22. The size can be adjusted0.1500.025820
f23. Detailed operating instructions0.0870.015029
f24. No burrs and sharp corners0.1800.031014
e. Product Function0.171e10. Convenient and friendly control0.1560.0267190.029
e11. Unique and innovative functions0.1180.020227
e12. Storage is light and easy0.0810.013930
e13. The structure is stable and durable0.1580.027018
e14. Easy to carry and transport0.1000.017128
e15. Easy to assemble and adjust0.1240.021225
e16. Easy to disassemble and repair0.1370.023421
e17. Modularization and easy replacement0.1240.021226
e18. Comply with safety regulations0.3060.05235
h. Sustainable Environmental Protection0.142h29. Easy to disassemble and recycle0.3690.052440.000
h30.The material is non-toxic and friendly0.6310.08962
a. Product Type0.108a1. Moderate size0.4150.044880.001
a2. Reasonable body weight0.3200.034613
a3. Unique style0.2660.028717
d. Product Texture0.088d8. Anti-slip and comfortable touch0.5150.045370.000
d9. Unique texture0.4850.042710
b. Product Material0.059b4. Meet functional requirements0.6200.0366120.000
b5. Easy to clean and maintain0.3800.022422
c. Product Color0.051 c6. Sense of the trend0.4170.0213240.000
c7. Unique personality0.5830.029716
B. Brand Dimension0.437 k. After-sales Service0.390 k36. Good repair service0.3550.138540.020
k37. With product warranty0.3940.15372
k38. Professional and friendly customer service0.2510.09796
j. Brand Value0.433 j33. Personal style and taste0.1650.071470.032
j34. Good quality and value0.3910.16933
j35. Excellent brand evaluation0.4440.19231
i. Product Sales0.177 i31. Real price level0.6140.108750.000
i32. Experience physical access0.3860.06838
Publisher’s Note: MDPI stays neutral with regard to jurisdictional claims in published maps and institutional affiliations.

