1. Introduction
Human immunodeficiency virus (HIV) is a member of the lentivirus genus of the retrovirus family. As a lentivirus, it is associated with immune suppression, a long incubation period prior to the development of disease, specificity to the host species, and a cone-shaped nucleocapsid, among other traits [
1]. This cone-shaped protein core is located within a larger protein matrix, which is enclosed in an envelope of a phospholipid bilayer derived from host cell membranes, that is “spiked” with envelope proteins used in binding and fusion of the virus with host cells. Within the nucleocapsid are the components characteristic of a retrovirus—two copies of the positive-sense, single-stranded RNA (ssRNA) genome attached to each other at the 5’ ends, and the proteins reverse transcriptase and integrase—along with a protease and other proteins necessary in early infection.
In general, viral binding and entry into the cell are believed to proceed by a system of interactions between the cell’s CD4 receptor and co-receptors and viral envelope proteins such as gp120 and gp141 [
2]. To begin the binding process, the virus traverses the cell’s surface, dissociating and re-associating with the low-affinity receptor, heparan sulfate, until it comes into contact with a CD4 receptor embedded in the outer membrane. When this contact occurs, the primary binding site on the viral protein gp120 binds to the CD4 receptor of the host cell in a high-affinity interaction. This interaction in turn, causes a further conformational change within gp120 that exposes a second binding site that binds to a co-receptor such as CCR5 or CXCR4. Once the binding has occurred, the coiled-up gp41 protein acts as a harpoon and pierces the cell membrane to allow fusion between the respective membranes of the virion and the host cell.
After the fusion of the viral envelope with the host cell’s membrane, the protein capsid uncoats, and reverse transcriptase translates the ssRNA genome into a circular double-stranded DNA (dsDNA) copy in the cytoplasm. Next, this copy is transported to the nucleus as part of a pre-integration complex, including integrase, which catalyzes integration at an apparently random position into the host’s DNA [
3,
4,
5]. Following integration, the virus’ genome is transcribed and translated using the host’s cellular machinery, relying upon host RNA polymerases and transcription factors to produce its mRNAs [
1]. Enzyme complexes known as spliceosomes remove sections called introns of the virion-mRNAs before they are transported into the cytoplasm and translated by host ribosomes, tRNAs, and translation factors. The expression of these proteins leads, in a way that will be discussed in further detail shortly, to the expression of the remainder of the viral proteins, which self-assemble in the cytoplasm to produce new virions. Finally, these progeny virions obtain their envelopes by fusing with the host cell’s outer membrane and “bud” off, exiting the cell in search of new targets to infect.
The viral regulatory proteins that control the rate of HIV replication include the transcriptional activator, Tat, the negative regulatory factor, Nef, and the regulator of viral protein expression, Rev [
6]. Tat appears to upregulate transcription and thus speed the production of virions. At the same time, Nef seems to be active in a variety of regulatory roles, from the enhancement of virion production to the down-modulation of host CD4 expression to viral latency, which enables the virus to evade host immune responses by undergoing a period of relative inactivity [
2]. Finally and most importantly to this investigation, Rev participates in viral replication and perhaps in viral latency by mediating the expression of incompletely spliced mRNAs.
Rev appears to confer various advantages upon the HIV virus, including the economic coding of genes, the evasion of the host immune response, and the extension of the host’s lifespan [
7], while HIV has a relatively small genome of less than 10,000 base pairs, it still manages to express nine different gene products and, ultimately, fourteen distinct proteins with the help of Rev functions. This efficient coding allows HIV to retain a dynamic range of cellular controls while remaining small enough to make infection easy and detection by the immune system difficult. It is accomplished in part by using various splicing events and overlapping reading frames [
7]. The translation apparatus reads the mRNA sequence in groups of three-nucleotide codons required to code for a single amino acid. Thus, unique splicing events that remove portions of code that differ by a multiple of a number other than three “shift” the reading frame of the translation apparatus and can cause the expression of different amino acids and, consequently, different proteins. Essentially, the efficient coding of HIV genes is achieved by expressing incompletely spliced mRNAs, a phenomenon common in retroviruses but rare in eukaryotes. Rev accomplishes the expression of incompletely spliced mRNAs by shuttling them from the nucleus, where they would otherwise be spliced, to the cytoplasm, where they can be translated, allowing the expression of multiple distinct proteins from the same sequence of genetic information. By mediating the expression of incompletely spliced mRNAs, Rev controls the expression of the cytotoxic structural products of the HIV virus, hence controlling the speed of the destruction of host cells.
Further, because Rev delays the expression of cytotoxic proteins and is believed to play a role in latency, it enables HIV to “hide” from the immune system during the initial immune response to infection [
8]. As with all viruses, HIV relies upon its host to produce its progeny and to present it with new opportunities for infection. Thus, as viruses and hosts evolve their relationships over time via mutation and recombination of genetic material, the most successful members of both species tend to acquire mutations that prolong the host’s life [
9]. As a result, it has been proposed that viruses such as HIV that significantly hasten their hosts’ death have yet to evolve their relationship with their hosts and are consequently relatively “young”.
In
Section 2 and
Section 3, through a combination of Michaelis-Menten theory and already-published experiments, we propose a basic mathematical model of the self-regulation of Rev and its effects on the splicing of mRNA in the HIV-infected cell. In
Section 4, we estimate parameter values using experimental data. We consider a numerical analysis and suggest modifications to the minimal model in
Section 5. In
Section 6, we consider a final discussion.
2. Modeling HIV-1 Rev Protein Regulatory Role
One factor that makes the action of the Rev protein a good candidate for mathematical modeling is the apparent complexity of changes in its concentration within the cell [
10]. There is substantial evidence that Rev is only effective in mediating the transport of mRNAs at a certain threshold concentration [
7,
11]. This behavior is thought to result from a negative feedback loop, in which Rev regulates its own expression and the expression of other viral proteins [
7]. Since Rev is not one of the proteins contained within the virus core, it is thus absent in the initial infection period and must be transcribed and translated before it can be expressed. Moreover, because it is necessary to express genes that rely upon incompletely spliced mRNA, Rev must be derived from completely spliced mRNA. Thus, owing to the time it takes to splice and express a sufficient amount of Rev, there is a time lapse between the integration of HIV’s genome into the host’s DNA and the expression of incompletely spliced mRNAs. As a result of this time lag, researchers have separated the gene products of HIV into what they call “early and “late” genes.
It has been proposed that high levels of Rev expression result in rates of incompletely spliced mRNA export that outpace the ability of the splicing apparatus to splice any significant numbers of mRNAs [
12,
13,
14]. It is believed that Rev, along with other early gene products, ceases to be expressed, and the Rev concentration in the cell drops dramatically. However, once Rev’s concentration has fallen beneath a threshold value, incompletely spliced mRNAs can no longer be transported out of the nucleus, and the early genes begin to be expressed again. Rev is thus believed to regulate its own expression dynamically. Before explaining the minimal model, it is necessary to briefly justify the essential components of Rev’s function and life cycle within the cell. This aspect will be presented here with proper justification and in accordance with their necessity and implementation in the minimal model. These initial arguments are little contested and form the foundation for those that follow.
The genome of HIV-1 was mapped soon after concurrent announcements of the isolation of the virus by groups led by Luc Montagnier and Robert Gallo in 1983. However, clear indications of Rev’s function were lacking until as late as 1986, when Feinberg, et al. asserted it to be a “gene that controls viral gene expression through regulation of the relative proportions of various viral RNA transcripts and is required for viral replication.” They observed that Rev controls splicing of HIV-1 mRNA to produce a preponderance of either structural viral proteins, such as the Gag, Pol, and Env products, or non-structural products, such as Rev itself and other regulatory proteins. Feinberg, et al. demonstrated that when the hypothesized region of the Rev protein was mutated to either delete a splice acceptor or include a frameshift mutation, only the smallest class of viral mRNAs of approximately 2 kb were expressed and that the viral proteins, Gag and Env, corresponding to larger mRNAs, were not. Because of this evidence, it was determined that Rev somehow permits the expression of viral proteins from the incompletely spliced mRNAs that are associated with them in the cytoplasm.
In 1989, Chang and Sharp [
15] hypothesized that Rev acted by directly inhibiting splicing and that incompletely spliced mRNAs were transported into the cytoplasm for eventual translation through normal cellular export pathways. Although some still hypothesize that Rev inhibits splicing, it is now generally believed that Rev essentially mediates the export of incompletely spliced mRNAs from the nucleus to the cytoplasm [
7,
16,
17,
18]. This result was confirmed when it was demonstrated that a synthetic RNA lacking recognizable introns or splice sites, a poor substrate for nuclear export, was rendered export-competent in the presence of Rev by a sequence believed to bind to it [
19].
Based on the nuclear export function of Rev, some of the major features of the proposed mechanism for the minimal model can be established. First, incompletely spliced mRNA, fully spliced mRNA, and Rev can be distinguished as critical and recurrent species requiring attention in a kinetic model. These species are made the focus of initial modeling efforts to reflect what is thought to be the primary outcome of Rev’s action within the cell: the generation of protein products from incompletely spliced mRNA in the cytoplasm [
20]. Further, as completely spliced mRNAs are conceptually distinguishable as the source of Rev and because the cycle revolves around a competition between splicing and Rev-mediated export, it is necessary to attempt to model their cycles. This mechanism thus tries to comprehend the factors of most significant importance in the life cycle of both incompletely spliced mRNA and Rev. The following mechanism is considered for a minimal model:
where incompletely spliced mRNA is represented by the symbol
, fully spliced mRNA is represented by the symbol
, and the symbol
R represents the regulatory Rev protein. Species in the nucleus have the subscript “
N”, and species in the cytoplasm have the subscript “
C”.
Although the justification for this mechanism will require a more substantial consideration, its basic outline is as follows. As Equation (1) suggests, we need A viral DNA’s source of all three major species of interest. Viral DNA is transcribed into incompletely spliced mRNA in the nucleus, which is, in Equation (2), spliced to produce fully spliced mRNA. In Equation (3), the fully spliced mRNA is transported by means of normal nuclear export into the cytoplasm like fully spliced cellular mRNA. In the cytoplasm, as Equation (4) suggests, the fully spliced mRNA is translated into the “early” regulatory proteins, including, notably, Rev. Rev, as can be seen in Equation (5), is then transported back into the nucleus, where, in Equation (6) it combines with incompletely spliced mRNA in a process resulting in the transport of both back into the cytoplasm. After dissociating from the mRNA complex, Rev can then cycle back into the nucleus according to Equation (5), while the incompletely spliced mRNA, as Equations (7) and (9) indicate, remains in the cytoplasm where it is translated into the “late” structural proteins and is eventually degraded. Finally, Equations (8) and (10) account for the degradation of Rev and fully spliced mRNA in the cytoplasm.
Equations (1)–(3) are simplified representations of well-established functions of a cell infected by a virus and the only known means by which these functions can be accomplished. Although they are not done justice by the simple rates presented here and will require more complex representations to be fully accurate, they are adequate to symbolize the underlying logic of this portion of the Rev mechanism. Likewise, Equations (8)–(10) merely indicate the natural degradation of protein and nucleic acid products in the cytoplasm by lysosomes, proteolytic enzymes, and other agents of normal cellular digestion. In this case, the assumption is made that this degradation occurs primarily in the cytoplasm and not in the nucleus. Although the assumption can be amended later to allow for greater sensitivity to the complexity of the Rev pathway, it is reasonable for now, given that the cytoplasm is home to most of the instruments mentioned above for cellular degradation and is the traditional locus of degradation for mRNAs. Kubota et al. [
21] further demonstrate that most Rev degradation occurs in the cytoplasm. The details of this work will be examined further in conjunction with the estimation of rate constants. Equations (4) and (7), the derivation of “early” and “late” proteins from completely and incompletely spliced mRNAs, respectively, follow from the basics of Rev already introduced. Equations (5) and (6), however, bear some further justification before proceeding.
To understand the biochemical basis for these nuclear import and export steps, it may be helpful to engage in a short digression into what is known about the pathways of nuclear import and export in general. It is hoped that such an endeavor will provide greater insight into the process of standard nuclear export already described in Equation (3) as well as a groundwork for understanding the Rev import and export cycle that lies at the heart of this work. It is believed that for most molecules and macromolecular complexes incapable of simple diffusion into and out of the nucleus, transport is mediated by nuclear pore complexes (NPCs) [
19]. Although NPCs are large structures containing a minimum of 50 different proteins called nucleoporins, they mediate transport by a reasonably consistent mechanism.
Species requiring importation are bound at the Nuclear Localization Sequence (NLS) by one of an emerging family of transport receptors, such as importin-
[
22,
23,
24]. Importin-
interacts directly with NPCs and may interact further with other factors, such as importin-
, which connects primary substrates to importin-
. The receptor-substrate complex then docks at the cytoplasmic filaments of the NPC, and translocation occurs. The latter phenomenon is poorly understood but is believed to be facilitated by sequential, direct interactions between the import receptor and various nucleoporins. Some factors deemed essential to nuclear import include the NTF-2 protein and the GTPase Ran, which in its GDP-bound form, facilitates translocation [
19]. Ran is believed to have at least two primary functions in nuclear transport. First, it has been hypothesized to provide energy for translocation via the hydrolysis of GTP to GDP.
Additionally, Ran provides directionality to the transport process by creating a Ran-GTP/Ran-GDP gradient across the nuclear membrane, with an excess of Ran-GDP in the cytoplasm and Ran-GTP in the nucleus. Once the importation complex is inside the nucleus, the phosphorylation of the bound Ran-GDP to Ran-GTP causes dissociation and consequent release. However, the data from Love et al. [
25] suggest that it is, in fact, the hydrolysis of ATP that supplies energy, at least in the Rev nuclear export pathway, while GTP hydrolysis mediates the regulatory effects of Ran. The requirement of ATP in the path also implies the necessity of ATPase for export [
25].
Similarly, the nuclear export of mRNAs requires the formation of protein complexes called ribonucleoprotein (RNP) complexes [
19,
26]. These complexes undergo translocation via the NPCs and are dissociated in the cytoplasm by the hydrolysis of Ran-GTP to Ran-GDP. The Ran-GTPase cycle has also been shown to be particularly important to the Rev pathway [
27]. A given substrate, like Rev, will have a Nuclear Export Signal (NES) that interacts with one of a family of receptors, such as CRM1/exportin 1 and Ran-GTP.
As evident from the preceding discussion, many nuclear import and export details remain vague. It is unclear exactly how the nucleoporins interact with RNP complexes and to what extent the model described here applies to all substrates of nuclear import and export. Indeed, it is worth noting that the study of Rev has led to the elucidation of normal nuclear transport mechanisms.
3. Rev-Mediated Nuclear Transport
After being translated into the cytoplasm, Rev must be imported into the nucleus to begin shuttling out incompletely spliced mRNAs, as shown in Equations (5) and (6). For Rev to return to the nucleus, it binds directly to importin-
, which mediates docking with nuclear pore complexes at its arginine-rich NLS in a highly specific interaction [
28]. Rev has been repeatedly demonstrated to bind to importin-
even in the absence of the common necessary bridging factor importin-
[
19]. In fact, it has actually been shown that the binding of importin-
to importin-
blocks the interactions between Rev and importin-
, indicating that the importin-
and Rev binding sites on importin-
at least partially overlap [
28]. Henderson and Percipalle [
28] also found that binding does not occur between importin-
and the RNA-bound form of Rev; this characteristic ensures that Rev releases its RNA cargo before re-importation into the nucleus. Multiple sources have also identified nucleolar phosphoprotein, B23, as a factor that stimulates Rev import [
28,
29]. The Rev-importin-complex, which has been shown to interact also with Ran-GDP, then undergoes translocation into the nucleus, where phosphorylation of Ran-GDP to Ran-GTP by the chromatin-bound exchange factor, RCC1, dissociates the complex and leaves Rev free to find an incompletely spliced mRNA to export to the cytoplasm [
28,
30].
The binding of Rev initiates the export of incompletely spliced mRNAs to a 234 nucleotide stem and loop structure called the Rev Response Element (RRE) present in the Env region of incompletely spliced mRNAs [
19]. Several sources, including footprinting studies, have born out this conclusion, like nuclear magnetic resonance studies of the Rev-RRE complex and repeated demonstrations that the transference of the RRE to heterologous RNA is sufficient to enable Rev-mediated transport regardless of the localization of the RRE [
7,
15,
27,
31,
32,
33]. The motif of the Rev protein that binds the RRE also acts as the NLS mentioned above [
30] (Strebel. Thus, the binding between Rev and the RRE masks the NLS, which further ensures that an RNA-bound form of Rev is not imported into the nucleus. Once bound to the RRE, the first Rev monomer has been shown to be joined by up to twelve extra Rev monomers in vitro. However, Van Ryk [
34] and others have suggested that in vivo multimerization may only involve around 4 molecules. Discoveries made by Pond et al. [
35] demonstrate that adding extra Rev monomers on the viral mRNA occurs one by one rather than by a preformed multimer that interacts directly with the RRE. Then, Rev binds other cellular factors within the nucleus that lead to the export of the complex into the cytoplasm, where it dissociates and leaves the incompletely spliced mRNA to be translated into protein, while Rev cycles back into the nucleus in Equation (5) [
36,
37].
It is generally agreed that Rev has a leucine-rich NES toward the C-terminus that interacts with the host cell proteins CRM1/exportin 1 and Ran-GTP, which typically work in nuclear export [
27]. CRM1, the chromosome region maintenance gene 1, was first linked to Rev circuitously by studies indicating that the antibiotic leptomycin B (LMB) inhibited Rev export in HeLa cells [
38]. This was significant as it was previously shown that point mutations in CRM1 confer leptomycin B resistance and that LMB targets the CRM1 protein [
39]. In response to this data, several groups undertook assays for CRM1 function, including demonstrations of nuclear shuttling obtained by assaying a fusion protein carrying Rev-like nuclear export and import signals and structural demonstrations that CRM1 binds to Rev [
40]. During these studies, it was noted that CRM1 could bind to Rev only in the presence of the GTP-bound form of the cellular factor, Ran. Further studies have also shown that CRM1 and Ran-GTP bind in the presence of an NES-containing substrate such as Rev, revealing an interdependent relationship between the three species in the formation of the exportation complex [
25].
Rev must interact with several nucleoporins. Though no direct interaction between Rev and nucleoporins has been observed, CRM1 has been found to act as a bridging factor between the two [
29] and Fornerod et al. [
41,
42] found CRM1 in a complex with nuclear pore proteins Nup88 and CAN/Nup214 after it localized to the nuclear envelope. Within the cytoplasm, an essential factor, RanBP1, associates with Ran-GTP of the CRM1-Rev-Ran-GTP complex, and a Ran-GTPase activating protein called RanGAP1 promotes the dephosphorylation of Ran-GTP to Ran-GDP, just as it does for other typical export products [
10,
29,
30]. This event prevents CRM1 from binding to Ran and triggers the dissociation of the complex of transporting factors, leaving the mRNA free to undergo translation and Rev free to be cycled back to the nucleus [
7,
30]. Thus, the cycle begins again.
Multiple sources have also proposed eukaryotic initiation factor (eIF-5A) and Src-associated protein (SAM68) as players in Rev-mediated nuclear export [
29,
30]. At the nucleoplasmic face of the NPC, eIF-5A has been found in interactions with CAN/Nup214, Nup153, Nup98, and Nup62, nuclear pore proteins involved in nuclear export; SAM68 has been observed to stimulate Rev export in astrocytes [
29,
30]. However, the exact roles of these factors in the Rev transport pathway have yet to be determined.
4. Minimal Model
The nuclear import and export models, particularly for the import and export of Rev, have been synthesized in the initial minimal mechanism into the basic steps presented above. Given these steps and the rest of the minimal mechanism, it is possible to formulate a mathematical model by transforming the mechanism into a series of differential equations. In this case, the simplest model that contains all of the components necessary for the overall mechanism is the following minimal model:
where the variables have been defined after Equation (10).
With this minimal model as a starting point, it is possible to scrutinize the individual terms in more detail. The first term in the first equation represents the transcription of incompletely spliced mRNAs in the nucleus. It is the only one not modeled using a Michaelis-Menten expression, a standard form of mathematic modeling. Transcription is accomplished using the regular transcription factors present within host cells [
2]. Although transcription is an extremely sensitive and complicated process, it is represented in the minimal model by a simple, constant rate. The decision to describe this process has been made as an initial assumption to be developed as the model evolves in future studies. The assumption renders broader dynamic behaviors underlying the feedback mechanism.
Consequently, the rate constant for transcription was isolated within a few orders of magnitude by comparison with literature values for transcription. In this case, the kinetic analysis of Audibert, et al. [
43] on the LT-
and
-globin genes was used to estimate relative orders of magnitude for transcription, splicing, mRNA degradation, and nuclear export rates. Because kinetic data on Rev transcription, splicing, and regular nuclear export were wanting within the available literature, it was deemed desirable that consistent data be used to estimate potential relative speeds of the various processes. Utilizing several techniques, Audibert et al. [
43] found that it took seven minutes for mRNAs to appear in the cytoplasm. Because they measured nuclear dwelling time to be four minutes in the case of
-globin, and splicing, as will be seen briefly, was found to be a relatively rapid process, transcription was estimated to take roughly around three minutes or 0.05 h. A broad first estimation for
was then calculated by taking the inverse of this number to get 20.0 h
. Although this number is far from an exact estimation of HIV-1 transcription for Rev in vivo, it suffices for an initial number with which to experiment in the minimal model.
The next term in the first equation,
, models the splicing of incompletely spliced mRNAs in the nucleus to produce fully spliced mRNAs. The form of the term is simply that of a basic Michaelis-Menten enzyme-catalyzed reaction. Although the kinetic analysis of Audibert, et al. [
43] was based on the modeling of each splicing event individually, it was deemed that this degree of detail would, in this initial modeling phase, only obfuscate the underlying feedback mechanism. Additionally, it should be noted that much of the disparity between the form of this model and the individual modeling of each splicing step may be subsumed within the choice of different rate constants for the overall process.
Having thus explained the form of the splicing term, we can consider the rate constant for splicing,
. As in the case of transcription, the approximate order of magnitude of splicing and the relative magnitudes of transcription, splicing, mRNA degradation, and regular nuclear export will be estimated using the work of Audibert, et al. [
43]. The two genes that this group used were the LT-
and
-globin genes, which contain three and two introns, respectively. Because the overall rate used for the minimal model is dependent upon the rate-limiting step, the slower steps calculated for both genes will be of the most significant interest. Equations were derived for each processing step by balancing the various mRNA species’ corresponding incoming and outgoing fluxes. Finally, these equations were used to estimate half-lives between 0.4 and 7.5 min for the individual splicing reactions.
Initial rate constants for the minimal model, which are to serve only as approximations within a few orders of magnitude, were then calculated by taking the inverse of these half-lives. Because the calculation of these half-lives is derived from measurements of the concentrations of the various mRNA species, they may have limited applicability outside the range of those concentrations. Thus, rate constants of 48, 31, and 5.6 h for LT- and 33 and 90 h for -globin were calculated for the individual splicing events of each. As the slower values were 31, 33, and 5.6 h, a range of values with this order of magnitude, in general, appears to be appropriate. Specifically, the second slowest splicing event, in either case, was around 30 h, so this value will be used initially.
The final term in the first equation of the minimal model represents the Rev-mediated nuclear export of incompletely spliced mRNA. It has already been discussed that Rev binds to the RRE and enables the formation of a complex of several factors and other Rev monomers before completing its task of export. For the minimal model, these subsequent factors will be grouped into one term, here called F, and their re-import into the nucleus, where necessary, will be ignored. Although the literature did not yield any reliable, specific estimates for the rate constant of Rev-mediated export, the approximate order of magnitude for the process may be estimated by the rate constant derived for normal nuclear export, which will be discussed in association with Equation (3) of the minimal mechanism and is equal to 4.5 h.
The first term of the minimal model’s second equation produces incompletely spliced mRNA in the cytoplasm at a rate equal to the positive rate of Rev-mediated export discussed above. In the second term, incompletely spliced mRNA is degraded by what is assumed to operate as an enzyme-catalyzed mechanism conforming to Michaelis-Menten kinetics. As such, it might be supposed to have a mechanism like the following where
represents incompletely spliced mRNA in the cytoplasm,
represents cellular factors of degradation,
represents a complex of them both,
and
are the forward and reverse rate constants of the first reaction, and
is the forward rate constant of the second reaction:
Thus, we can utilize a Michaelis-Menten expression using either the rapid equilibrium assumption for the first reaction or the steady state approximation for
. In this case, the rate constants for the degradation of the mRNAs produced from the LT-
and
-globin genes calculated by Audibert, et al. [
43] in their previously discussed study were 0.47 and 0.35 h
for LT-
-derived mRNAs and 0.054 h
for
-globin-derived mRNAs. These values thus provide an approximate range within which we can estimate initial values for degradation constants.
The third equation of the minimal model, which models the changing concentration of fully spliced mRNA in the nucleus, begins with the splicing term depicted in Equation (11a). The fully spliced mRNA that accumulates in the nucleus is then transported into the cytoplasm by normal nuclear export, which is presumed to proceed according to basic Michaelis-Menten kinetics. This assertion can be justified by assuming that nuclear export proceeds via a mechanism similar to Rev-mediated export without the intervention of a species analogous to Rev. This assumption is borne out by the preceding discussion of nuclear export and posits a mechanism resembling the following:
where
is fully spliced mRNA in the nucleus, F is a complex of export factors,
is an intermediate combining the export factors, and
,
and
are the reaction rates. It is worth noting, though, that the mechanism posited above is ultimately an oversimplification and should eventually be replaced as the model grows in sophistication. The rate constant for normal nuclear export,
, can be roughly approximated by invoking the work of Audibert, et al. [
43] yet again, in which the nuclear dwelling time of fully spliced mRNA transcripts was found to be 4 min or 0.0667 h. It follows that
= 1 / (0.0667 h) = 15 h
.
The terms of the fourth equation of the minimal model, which measures the time-dependent change in the concentration of fully spliced mRNA in the cytoplasm, follow the earlier terms. The rate of accumulation of fully spliced mRNA in the cytoplasm is simply the positive rate of nuclear export. Likewise, due to its similar chemical composition, the degradation of fully spliced mRNA in the cytoplasm corresponds to the degradation of incompletely spliced mRNA in the cytoplasm. It can be initially estimated to have a similar rate constant.
Turning to the fifth equation of the minimal model, which tracks the concentration of Rev in the nucleus in time, it is necessary to consider the process of importing Rev into the nucleus. Considering the exposition of nuclear import presented above and for this initial model, it suffices to consider the process of the import of Rev as proceeding according to the following mechanism:
Here,
,
,
, and
represent Rev in the cytoplasm, Rev in the nucleus, a complex of all necessary import factors, and a Rev-import factor intermediate complex, respectively. As before,
,
, and
represent the respective rates involved in the two reactions. To estimate the rate constant for the nuclear import of Rev,
, data was adopted from kinetic studies of the nuclear import of vitamin D receptors, which are imported by an analogous, multi-part, protein-mediated pathway. Specifically, we use the data of Prufer and Barsony [
44] to estimate half-lives of nuclear protein import. Fitting their data to modeling equations, they estimated the half-lives of nuclear import to be between 15 and 30 min. For the purposes of approximation to a few orders of magnitude, the average value of this range, 22.5 min or 0.375 h, was used to estimate a rate constant for Rev import. This was accomplished, again, by taking the inverse of the half-life, and the rate constant for Rev import was initially estimated to be 2.67 h
.
Finally, Rev in the nucleus is considered to be depleted solely by Rev-mediated export into the cytoplasm, which has already been discussed. Eventually, it will be necessary to supplement this term with a nuclear degradation term for both Rev and the species of nuclear mRNA. However, the work of Kubota et al. [
21] supports the initial neglect of these terms. This group utilized radiolabeled Cos-1 cells transfected with Rev in pulse-chase analysis experiments to measure Rev’s half-life. They measured the signals of the radiolabeled Rev at 0, 4, and 16 h after chasing and then quantified the relative signal intensities using a phosphoimager. Next, they repeated their experiments using a nucleus-bound mutant form of Rev unable to undergo export into the cytoplasm and a cytoplasm-bound Rev mutant unable to undergo nuclear import. They thus determined that 71% and 45% of wild-type Rev remained after 4 and 16 h, respectively, whereas below 25% and barely detectable amounts of the Rev relegated to the cytoplasm remained at those same intervals. Finally, they noted that almost 100% and 71% of the Rev relegated to the nucleus remained at 4 and 16 h, respectively. A comparison of the observations mentioned above reveals that nuclear degradation operates at a much slower rate than cytoplasmic degradation and consequently supports both the assertion that most degradation occurs in the cytoplasm and the concomitant decision initially to model only the degradation therein.
The sixth and final equation of the minimal model tracks the concentration of Rev in the cytoplasm over time. Rev in the cytoplasm is accumulated both from the process of Rev-mediated export and from the translation of cytoplasmic fully spliced mRNA. The translation was modeled using the following basic Michaelis-Menten mechanism:
where
,
,
,
, and
, respectively, represent fully spliced mRNA in the cytoplasm, a combination of enzymes necessary for translation, a complex of both of the former, the “early” proteins other than Rev—which will, for the minimal model be ignored—and Rev in the cytoplasm. The symbols
,
, and
again represent the rate constants associated with the two reactions. Using this mechanism, as before, we can derive the term’s form using several assumptions. Again, because little data detailing the rate of HIV-1 “early” protein translation was available, the rate was assumed to share an order of magnitude similar to that of the analogous process of transcription. The rate constant for translation,
, was initially assumed to be about 20 h
.
Depletion of Rev in the cytoplasm in the minimal model was assumed to be affected by the importation of Rev into the nucleus and by the process of normal cellular degradation analogous to the one for mRNA degradation shown above. The former term has already been examined, and the latter term can be derived by making the same basic assumptions that were made in the inspection of mRNA degradation terms. The rate constant for this Rev degradation term,
, can be derived from the aforementioned work of Kubota, et al. [
21], in which 71% and 45% of Rev were found to be present after 4 and 16 h, respectively. From the latter of the two data points, it is possible to estimate the half-life of Rev at around 15 h. Thus, by taking the inverse of this value, the rate constant for Rev degradation is calculated to be approximately 0.067 h
.
It may have been noted by this point that the K values have, as of yet, been unassigned. It is possible that at least some of these values could be estimated from the literature. However, as they are commonly held to be comparable to the rate constants involved, they have been modeled at various values from around 0.1 to 10 units of concentration, usually with little effect owing to their variation [
45].
The underlying logic of the system being modeled can be examined in an effort to discover likely kinetic behaviors. Such a method may take the form of an induction time prior to significant growth in the concentration of incompletely spliced mRNAs, oscillations in the concentrations of viral products that would limit the accumulation of budding virions, or any other behavior from which a selective advantage for the virus could be inferred. Thus, it is believed that Rev functions fundamentally to limit viral growth and prolong the host cell’s life, which suggests a strategy for keeping the host cell alive.
One of the factors that made the Rev system a good choice for mathematical modeling is its proposed ability to dynamically regulate its own activity, which makes oscillations also likely. Specifically, it has been proposed that Rev downregulates its activity by shuttling incompletely spliced mRNA out of the nucleus so efficiently that fully spliced mRNA, which Rev is derived from, is only rarely exported [
12]. This phenomenon is hypothesized to occur for two reasons. First, every expression of an incompletely spliced mRNA transcript precludes the expression of the products of its fully spliced counterpart. This assertion follows from the simple observation that, at any given time, the total quantity of mRNAs produced by transcription is limited. Secondly, according to the biochemical model upon which the calculations are based, Rev-mediated export and regular nuclear export rely on many of the same export factors, such as CRM1 and Ran-GTP, and must pass through the same nuclear pore complexes.
An excess of Rev likely leads to a lack of fully spliced mRNA in the cytoplasm. In such a case, Rev itself is rarely produced, and the concentration of Rev drops. As a result, the concentration of Rev is expected to oscillate. Consequently, there is a strong possibility of competition for both export factors and available nuclear pores.
In 1989, Felber et al. [
17] presented a compelling hypothesis on the ability of Rev to downregulate its own expression at the mRNA level. To garner evidence for their argument, they monitored the levels of the mRNAs corresponding to Tat, Rev, and Nef in the presence of mutants deficient for Rev and in the presence of Rev in human HeLa cells. Through this procedure, they observed that Rev caused a decrease in its own concentration as well as in the concentrations of Tat and Nef over the course of two hours. It should be noted, though, that the ability of Rev to downregulate itself is far from certain. Indeed, Pollard and Malim have argued that, contrary to the initial transient transfection studies used to support the downregulation of Rev, other experiments utilizing full-length proviruses have shown that spliced RNA is actually more abundant when Rev is present [
19]. All of the techniques employed thus far, however, only measure relatively slow, broad shifts in the regulation of Rev. It appears that while the underlying logic of the feedback loop presented above allows for a strong possibility of oscillations in Rev concentration, it by no means guarantees that they are large enough to be measured without the use of an extremely accurate assay. Basing broad conclusions on experiments that gather only a few data points and rely upon measurements on a large time scale seems to depend on the assumption that more sensitive oscillations do not exist. Therefore, without offering decisive evidence on the question of Rev’s ability to downregulate itself, the discovery of oscillations represents at least a likely confirmation of plausible modeling.
Given these criteria, it is possible to search for probable solutions by beginning with the values estimated for rate constants and then varying them until the solutions match the above specifications. Setting the initial concentrations relatively low or to zero and entering the rate constants estimated above give us a dynamic behavior within the first 50 h. This time scale has been chosen to reflect the average generation time of HIV-1, which has been hypothesized to be about 2.2 days, and the average lifespan of an active, infected T4 Cell, which has been suggested to be about two days [
46]. The concentrations of Rev in the cytoplasm, fully spliced mRNA in the cytoplasm, and incompletely spliced mRNA in the nucleus, after some slight variation in their initial behavior, appear to grow linearly without bound. In contrast, the concentrations of the other three species never grow to noticeable proportions. This model can be rejected as unlikely for a variety of reasons, including the lack of expression of incompletely spliced mRNAs in the cytoplasm and the apparently unphysical behavior of several species.
Next, the rate constants are varied in response to the apparent behavior of the model. Hence, because Rev in the cytoplasm seems to be growing without control, it is possible that the rate of Rev import must be increased, the rate of translation should be decreased, or the rate of cytoplasmic Rev degradation should be increased. Of course, these are not the only possibilities but represent reasonable, testable trials. However, a further variation of the rate constants within several orders of magnitudes yields similarly unphysical results. Therefore, it is necessary to extend the model to find more plausible results. Fortunately, many relatively simple options are available for improving this basic model.
5. Numerical Analysis
The set of ordinary differential Equations (ODEs) describing the minimal model are nonlinear, which are able to show from simple steady states, oscillations, complex oscillations as well as aperiodic oscillations. These dynamic behaviors depend on the set of parameters that are embedded in the parameter space. The space is large, and in many cases, in particular, for stable biochemical systems, the chaotic subspaces are not accessible by the biochemical system.
As an introductory presentation of a minimal model, we are interested in the initial phase of the dynamic behavior with long transient before stable oscillations. Therefore, we concentrate on simple oscillations, given that no chaotic behavior has been reported for this initial phase of the process. However, future analyses using bifurcation diagrams or Poincare maps to determine the parameter region where aperiodic oscillations are possible will follow the present report.
For the numerical analysis of the ODEs, we have used at least three software packages. The numerical integration of the three packages are consistent with each other. For example, the ODEs show no stiffness, so default integration using a 4th Runge–Kutta can be used, as in the case of the XPP package [
47]. We have used the package INSITE [
48], which used both a fourth-order single-step algorithm with error control, and the BOSODE, which is a variable-order multi-step with an error control algorithm coded in C. For the figures, based on the numerical integrations, we have used MATHEMATICA [
49].
One of the most problematic aspects of the minimal model is the simplification of Rev-mediated export into a single, simple rate. After all, control over the export of incompletely spliced mRNAs into the cytoplasm is a complex process and the ultimate end of the Rev pathway, as it is understood. As a result, one of the priorities in increasing the complexity of the minimal model must be to increase its sensitivity to this export process. This goal was accomplished by modeling an intermediate species,
, formed between Rev and incompletely spliced mRNA in the nucleus, allowing the derived Michaelis-Menten term for export to reflect only the transport itself. To model this new species, we introduce a seventh differential equation. In this case, its pertinence that we represent the Rev pathway by three mechanistic steps:
The first two steps model the binding of Rev and incompletely spliced mRNA in the nucleus to form the intermediate and the dissociation of the intermediate back into its constituent parts, respectively. The term for the formation of the intermediate is a relatively simple one and is represented by a rate constant for binding, , multiplied by the concentrations of the substrates for binding, and Is . The complete term is thus . Similarly, the rate of intermediate dissociation is represented by a dissociation rate constant, , multiplied by the concentration of the intermediate, or , where represents the intermediate.
The final step is the transport of intermediate into the cytoplasm. As noted earlier, many of the same factors are necessary for regular and Rev-mediated export. Thus, in improving the minimal model, it was deemed essential to attempt to reflect the competition for these factors within the regular and Rev-mediated export terms. Therefore we assume that intermediate translocation to the cytoplasm could be expressed by the following mechanism:
In this scheme,
F represents the various transport factors essential to both Rev-mediated and regular nuclear export,
and
define the binding and dissociation rate constants for the formation of a transport intermediate,
, and
represents the rate constant for transport into the cytoplasm. Because competition from regular nuclear export must also be considered, it is necessary to derive that as well simultaneously:
The transport factors that appear in the mechanisms for normal and Rev-mediated export are the same; thus, the total concentration of transport factors is represented by the following equation: .
Assuming that the rate-limiting step is the generation of final products and using the steady-state approximation for
and
, the expressions for the velocities of the transport reactions become:
for Rev-mediated export and
for normal nuclear export.
Another modification, less fundamental but easier to implement, is the addition of nuclear degradation terms. The form for these terms is the same as that for the cytoplasmic degradation terms derived earlier, although the rate constants would be expected to be significantly smaller. It is worth observing that no degradation term is incorporated into intermediate modeling. This omission reflects the assumption that the depletion of the intermediate is essentially dependent upon its rapid dissociation or transport and not upon a relatively slow nuclear degradation rate. Such an assumption simplifies the model for the present but in no way precludes the simple addition of a nuclear degradation term in future formulations. The following set of differential equations represents the modified minimal model:
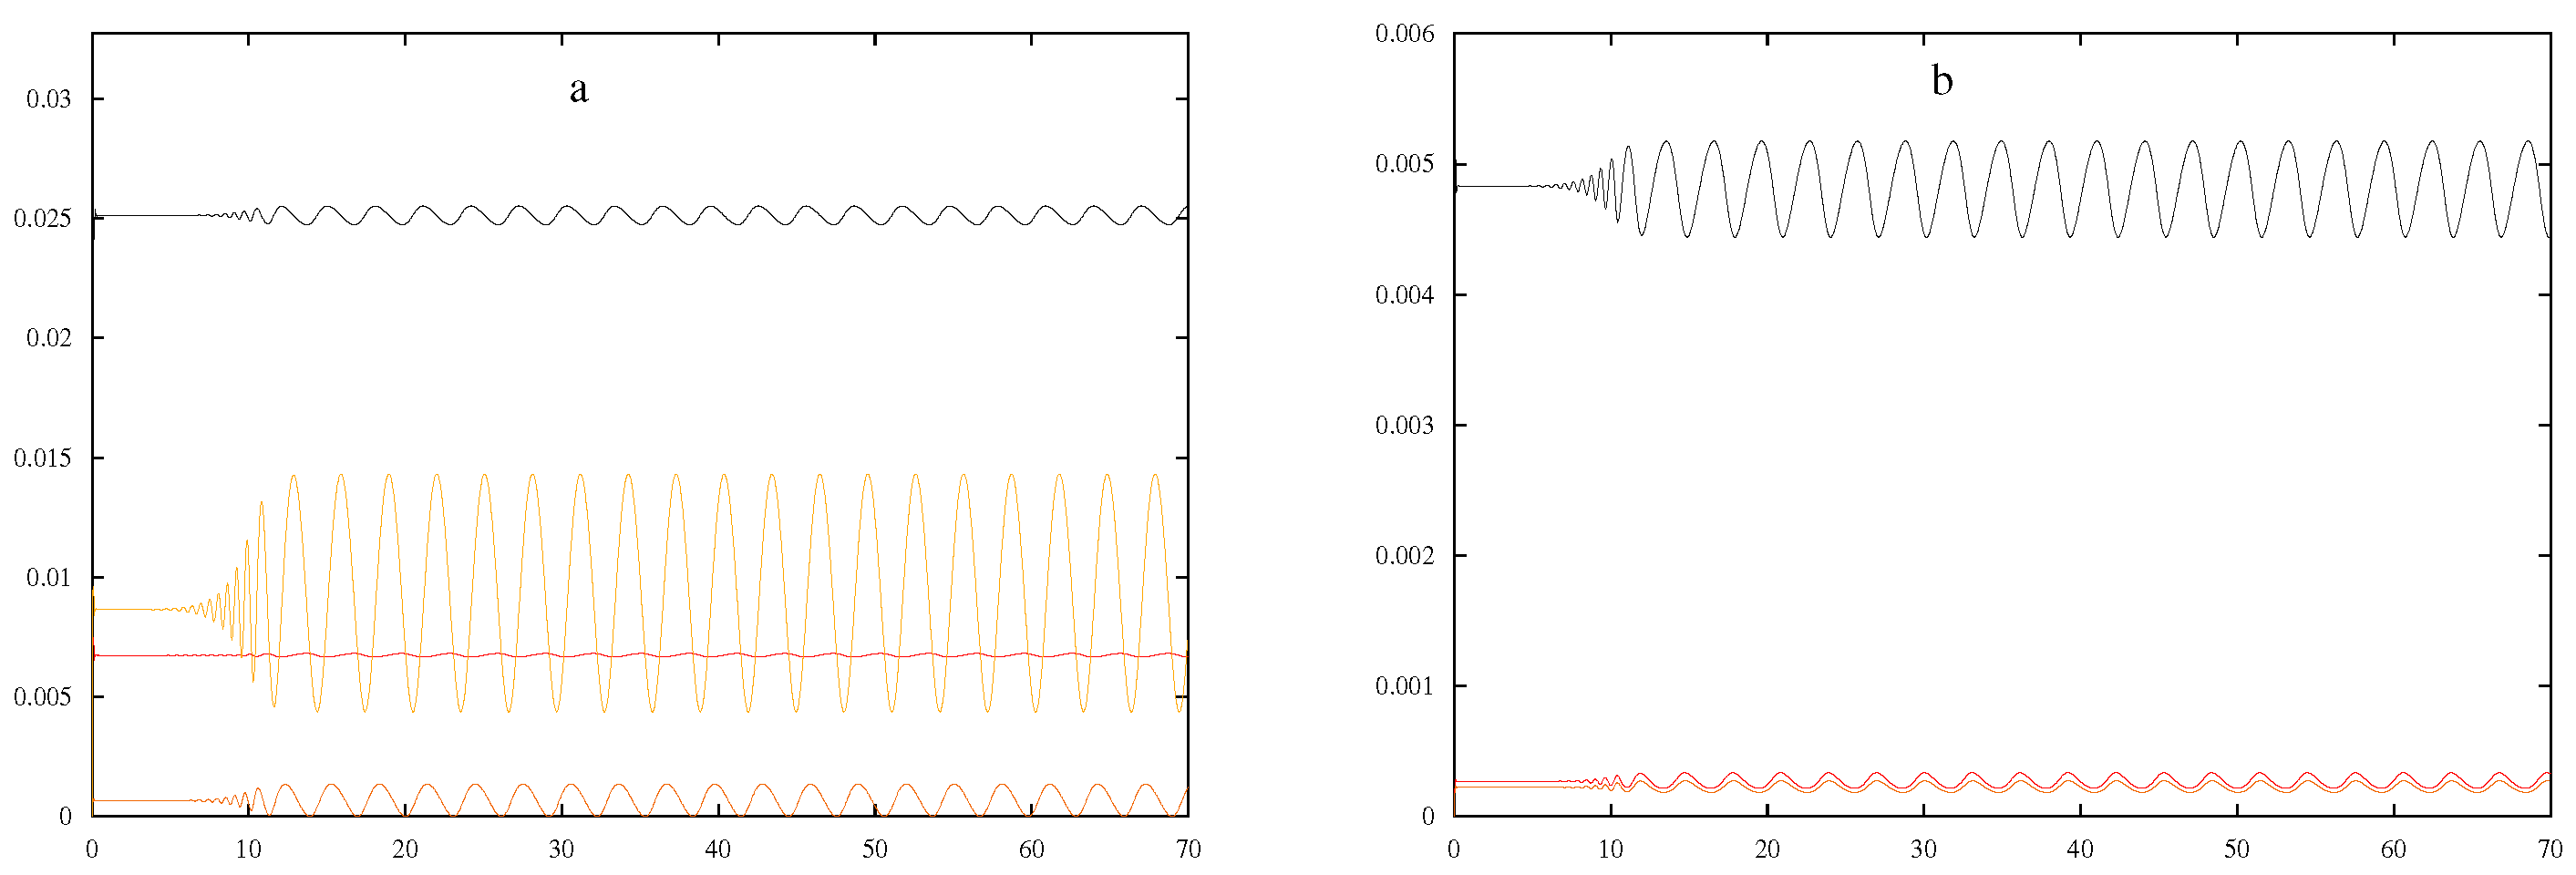
More interesting dynamic behaviors are observed using rate constants estimated above, including the previous estimates for
and
. For example, simple oscillations are shown in
Figure 1 using the parameters in
Table 1. With this initial set of parameters, the values of the four central processes in the system were varied one at a time to determine a set of ranges that produced oscillations. Holding all other variables constant with those in
Table 1,
was determined to have the range: 149.894–151.100. A similar procedure was used to vary values for
,
, and
, and their approximate ranges were determined to be 24,950–25,400, 2.9915–3.0009, and 21.845–23.700, respectively.
As shown in
Figure 2, smaller
values appeared to result in longer periods with little effect on the induction times. Larger
values seemed to produce smaller oscillations and periods but longer induction times, as shown in
Figure 3.
Smaller
values showed little change from the originals, while larger
values appeared to shrink the amplitude and lengthen the induction time. An increase in induction time and shorter period were observed as
decreased, while a shorter induction time and broader period were observed as
got larger. Finally, the variations in
did not have a significant influence on the graphs produced compared to those produced by the parameters in
Table 1.
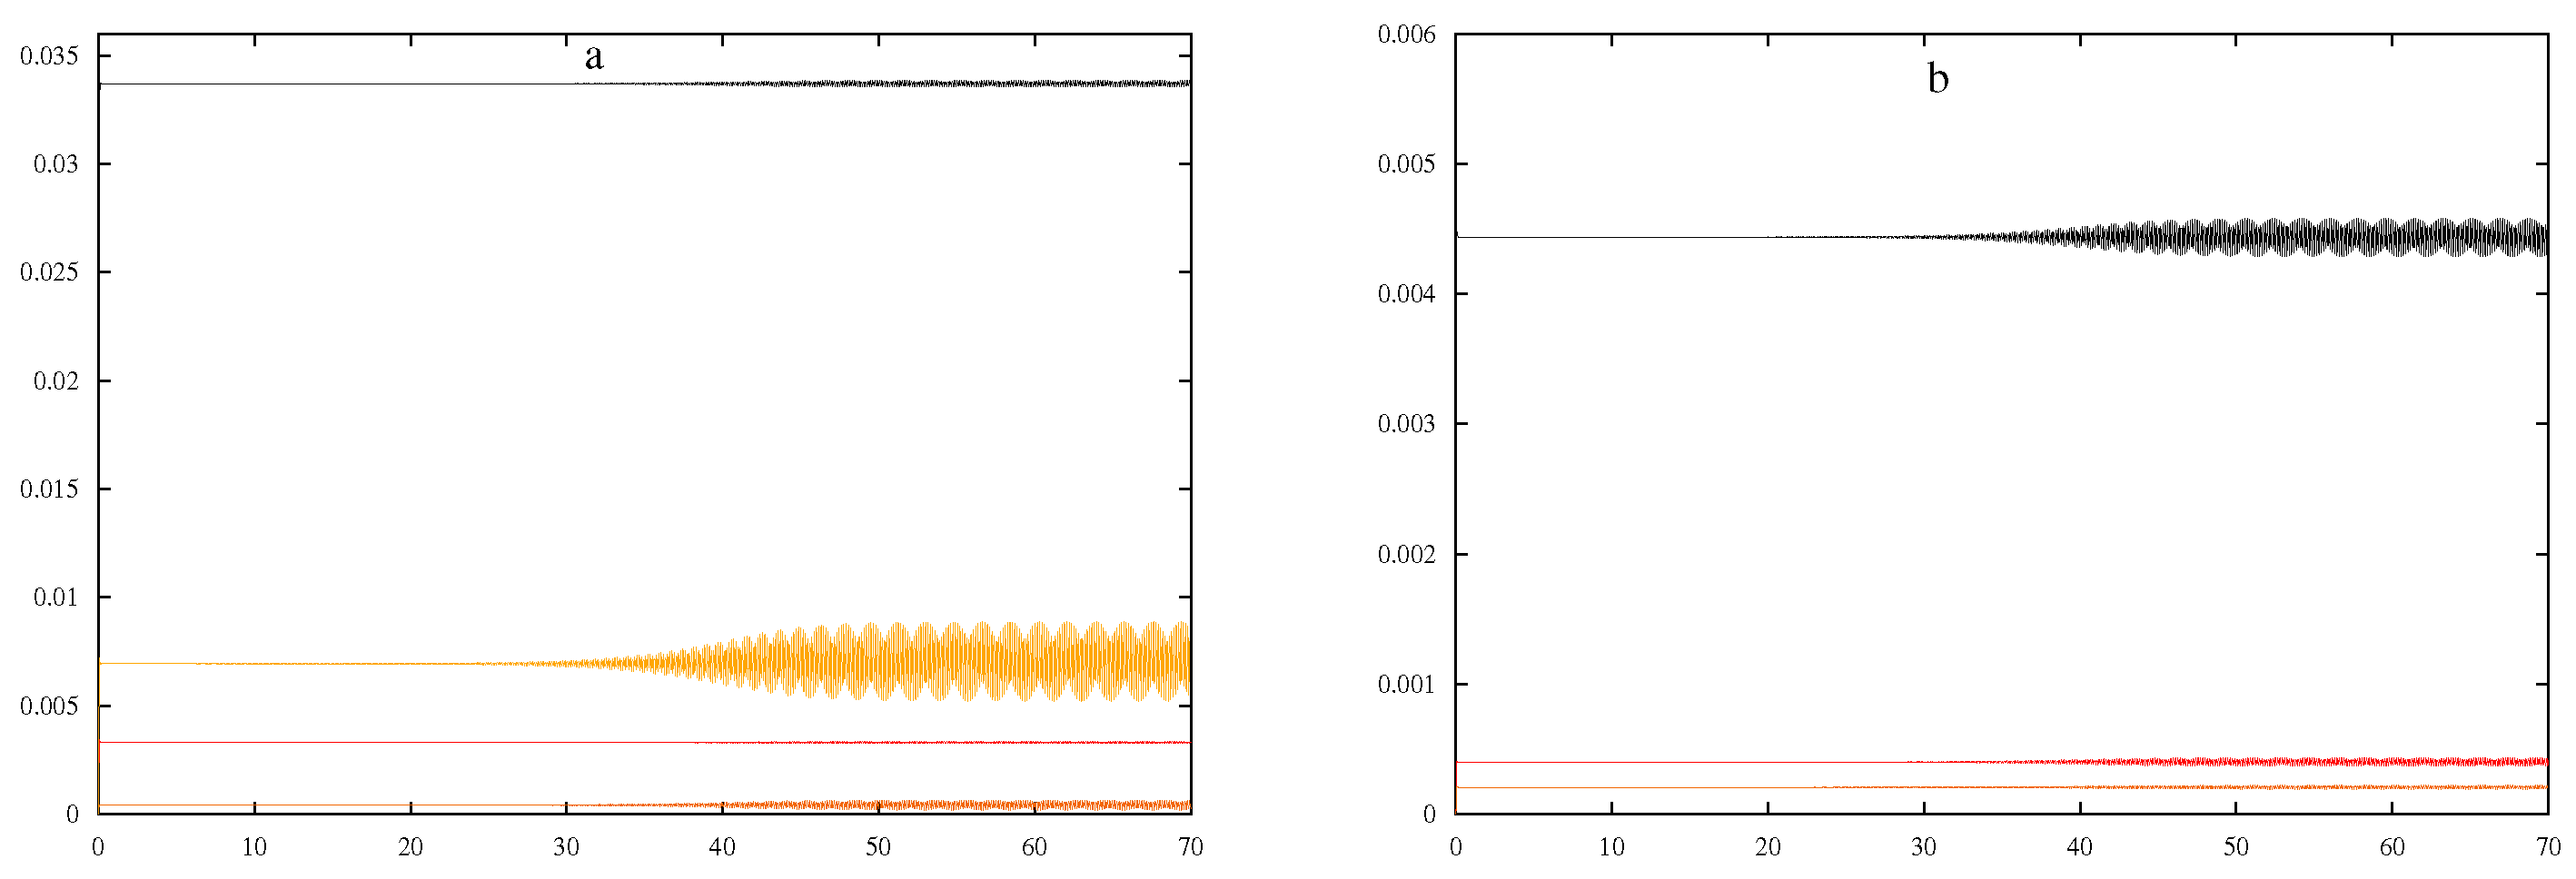
Besides the solutions that grow to infinity or decline quickly to zero and the simple oscillations depicted above, solutions that oscillate with two separate periods were also observed for the system. The following analysis demonstrates more complex dynamics, where
,
15,000, and other parameters from
Table 1 are used. In this case, oscillations are observed and depicted in
Figure 4.
As done with the previous set of parameters, the four variables:
,
,
, and
were varied one by one in isolation holding all other variables constant according to the values described for
Figure 4. The approximate ranges were determined to be 149.76–150.15, 14,450–15,950, 2.9990–3.0029, and 56.55–58.70 for
,
,
, and
, respectively. Induction time increased or decreased with the value of
, as presented in
Figure 5.
Compared to
Figure 4, the periods of the oscillations appeared to be different when
was varied in either direction, as shown in
Figure 6.
A decrease in
appeared to lengthen induction time and decrease amplitude a little, while shorter induction times were observed with an increased
, as illustrated in
Figure 7.
Lastly, a larger amplitude and decreased induction time were observed for smaller values and smaller amplitude and increased induction time for larger values.
Notice that we have explored a small subspace of parameter space, where we find simple steady states and period-two oscillations. In doing so, we are interested in the initial phase of the infection, showing transients and simple oscillations. In this first phase, we do not know any reported aperiodic oscillations. Therefore, we have not extended our analysis to include bifurcation diagrams with the aim of finding chaotic oscillations, which, if they exist in the biological system, have not been reported. Although any set of nonlinear ordinary differential equations may sustain chaotic oscillation, such oscillation may not have a biochemical relevance because they may be in a region of parameter space far from the actual conditions of the biochemical oscillations.
6. Discussion
Although no plausible model has yet been introduced, much has been accomplished. A general method of approach to the formulation of a model and for estimating rate constants has been established. Further, the biochemical basis for the Rev cycle has been presented, along with a stepwise simplification, from which a mathematical model can be derived. The modified minimal model was derived by formulating rate expressions based both upon the minimal mechanism and upon Michaelis-Menten kinetics, thus paving the way for formulations more sensitive, more complex, and, ultimately, more reflective of the in vivo dynamics of the Rev pathway.
In evaluating these results, it should first be noted that the system undergoes both simple and complex oscillations and appears to result in physically plausible solutions. It predicts fairly consistent relative concentrations of different nuclei and cytoplasm species and thus would presumably be testable by biochemical assay. Further, it has a characteristic induction time of about 10–70 h preceding the oscillations of all species within the determined parameter ranges. The time frame is compatible with the previously mentioned average lifespan of an active infected T4 cell, which is suggested to be approximately two days [
46]. This feature is sensitive to slight variations in the rate of transcription and seems to be consistent with the idea that part of Rev’s function is to prolong the life of the host cell to allow for more viral replication [
34].
However, it should be noted that, in several cases, the rate constants vary from their estimates by many orders of magnitude. Because few kinetic studies of the Rev system have been made to date, the evaluation of a model like the one presented here is somewhat difficult. On the one hand, the simplification that was necessary in order to produce a manageable set of equations renders some deviation from the estimates. Further, estimations were sometimes carried out by reference to analogous processes and cannot always be expected to be completely accurate. Nevertheless, much of the data that was available on the kinetics of the Rev pathway has been incorporated into the estimates for rate constants, and deviation by many orders of magnitude consequently draws the accuracy of the solutions into question.
Finally, it should be observed that in this model, the concentrations of all species make an initial leap to an approximate steady state and then oscillate around that state. Because the oscillations grow, it is plausible that they help prolong the host cell’s life. However, the leap in the structural, cytotoxic products generated by the initial burst of incompletely spliced mRNAs could potentially be great enough to cause significant or fatal damage to the cell before the inception of oscillations. Although this interpretation must now be relegated to the status of conjecture, the large initial jump preceding oscillations can be taken as one more factor indicating the potential necessity of improvement.
In considering the future direction of this project, it should be recalled that many simplifying assumptions have been made in the pursuit of a manageable model in its most economical form. It is inevitable then that a great deal of sensitivity to surrounding biological processes was lost, and this inadequacy was manifested in deviations from predicted rate constants. These shortcomings, however, can hopefully be amended as the literature evolves to provide more data on this pathway and in iterative analytic adjustments of the type demonstrated in the previous section using current literature.
Eventually, modeling the factors crucial to nuclear import and export, such as the GTPase Ran, CRM1, and importin-, could also be hoped for. The allowance for greater complexity in the processes of translation and splicing, such as the representation of individual splicing events or the reflection of the available quantities of amino acids, tRNA, or various proteins necessary for translation, could also be helpful. Additionally, transcription was modeled by a constant throughout the work presented here, while this is somewhat sensible as it allows the isolation of the behavior of the Rev system from a great deal of background “noise”, which adds complication, it also renders the model insensitive to a variety of cellular events that might adversely affect the Rev pathway in vivo. Further, the neglect of this “noise" obfuscates biochemical testing. Indeed, the present model requires some adjustment to apply to any cell actively engaged in one of the transitions in transcription rates associated with division or subject to adverse effects of regulatory factors other than Rev. The model proposed here would most likely apply to a non-dividing macrophage or a quiescent T cell. An attempt to alter the model to reflect these factors might begin by mapping the natural oscillations in transcription rate onto the oscillations of the Rev system or modeling the effects of HIV regulatory factors such as Tat or Nef.
In conjunction with the proposals modeling the rate of transcription and cell growth, further adjustments could be made for cellular degradation. Whereas the destruction of the cell is either implicitly assumed to conform to a particular time scale or to connect with the production of incompletely spliced mRNAs in the cytoplasm, the spectrum of factors pernicious to an HIV-infected cell could be modeled. Such an endeavor could offer insight into the components of cellular degradation, as well as enable more physical modeling. Handy for initiating this enterprise is the summary of the half-lives of various HIV-infected cells and the effects of current HAART therapy presented in the 2003 review of HIV-1 pathogenesis by Stevenson [
50].
By implementing the proposals above, the model presented here could agree more precisely with estimations for rate constants. In addition to the variation to be expected from processes of simplification, analogous processes were used to estimate rate constants in many cases. Consequently, wherever the analogies failed, deviation from estimations was expected. Nevertheless, improvements in the procedures associated with estimating rate constants may be possible. Such developments could begin by focusing on the process of taking the inverses of half-lives without reference to concentrations. Another possibility is to return to the data of Kubota, et al. [
21] on the degradation of the Rev protein and constrain the nuclear and cytoplasmic degradation rates to values that would produce the predicted overall degradation of wild-type Rev in their study. Although these suggestions represent only the first step towards a complete understanding of the kinetics of an HIV-infected cell, they present a substantial challenge, while it was necessary for this model to experiment with rate constants, it is hoped that rate constants will be limited to a smaller range of possible values as the model increases in accuracy.
The model presented here displays adjustable behavior and, in some cases, can be tuned to give a set of desired results. However, the ultimate objective of this study is predictive accuracy. Thus, once a model can be relied upon to conform to various estimations and biochemical assays, it can be helpful for settling disputes concerning, for example, nuclear diffusion, pathogenesis, or HIV splicing. As predictive accuracy remains elusive, this model aspect has largely been neglected here but provides another direction for future endeavors.
This model may be used to identify crucial times during infection when treatments should be administered. Various anti-Rev treatment strategies have been tested in clinical trials, including introducing defective mutant versions of Rev into patients and using aminoglycoside antibiotics [
10]. Ideally, an accurate model for Rev action might be used to reveal target thresholds for drug efficacy that could aid in this treatment development process. However, the implications of the kinetic modeling of pathogenesis in HIV and other diseases span far beyond this project and provide a framework for its interpretation.
Finally, we comment on potential implementation to the minimal model. For example, our mean-field approach using ODEs assumes a homogeneous space structure; while for a first-order approximation is acceptable, the medium may be fractal. The relevance of fractal geometries in physiology has been studied in general by West [
51] using fractional calculus. The kinetics on fractal lattices may be a way to extend the model. This approach has been reported by Gadomski [
52] and Kurzynski [
53], where we could extend the analysis to include fractal-like Michaelis-Menten kinetics.


