
Application of Image Processing and 3D Printing Technique to Development of Computer Tomography System for Automatic Segmentation and Quantitative Analysis of Pulmonary Bronchus

Abstract
:1. Introduction
1.1. Lung Segmentation
1.2. Pulmonary Airway Detection
1.3. Bronchial Identification
- The research problem has been clearly defined and the motivation has been clearly presented according to the development of a computer tomography system for the segmentation and quantitative analysis of pulmonary bronchus;
- The literature review was discussed, including lung segmentation, pulmonary airway detection, and bronchial recognition;
- This article has been based on the technical bottlenecks to be overcome and the corresponding key technologies to be developed;
- The aims of the manuscript, which are to develop an objective and accurate system from image processing techniques successfully to analyze the lung structure and provide the position information for clinicians based on the intrapulmonary bronchi, will be shown. Meanwhile, 3D printing verification for the measurement of airway parameters have been processed.
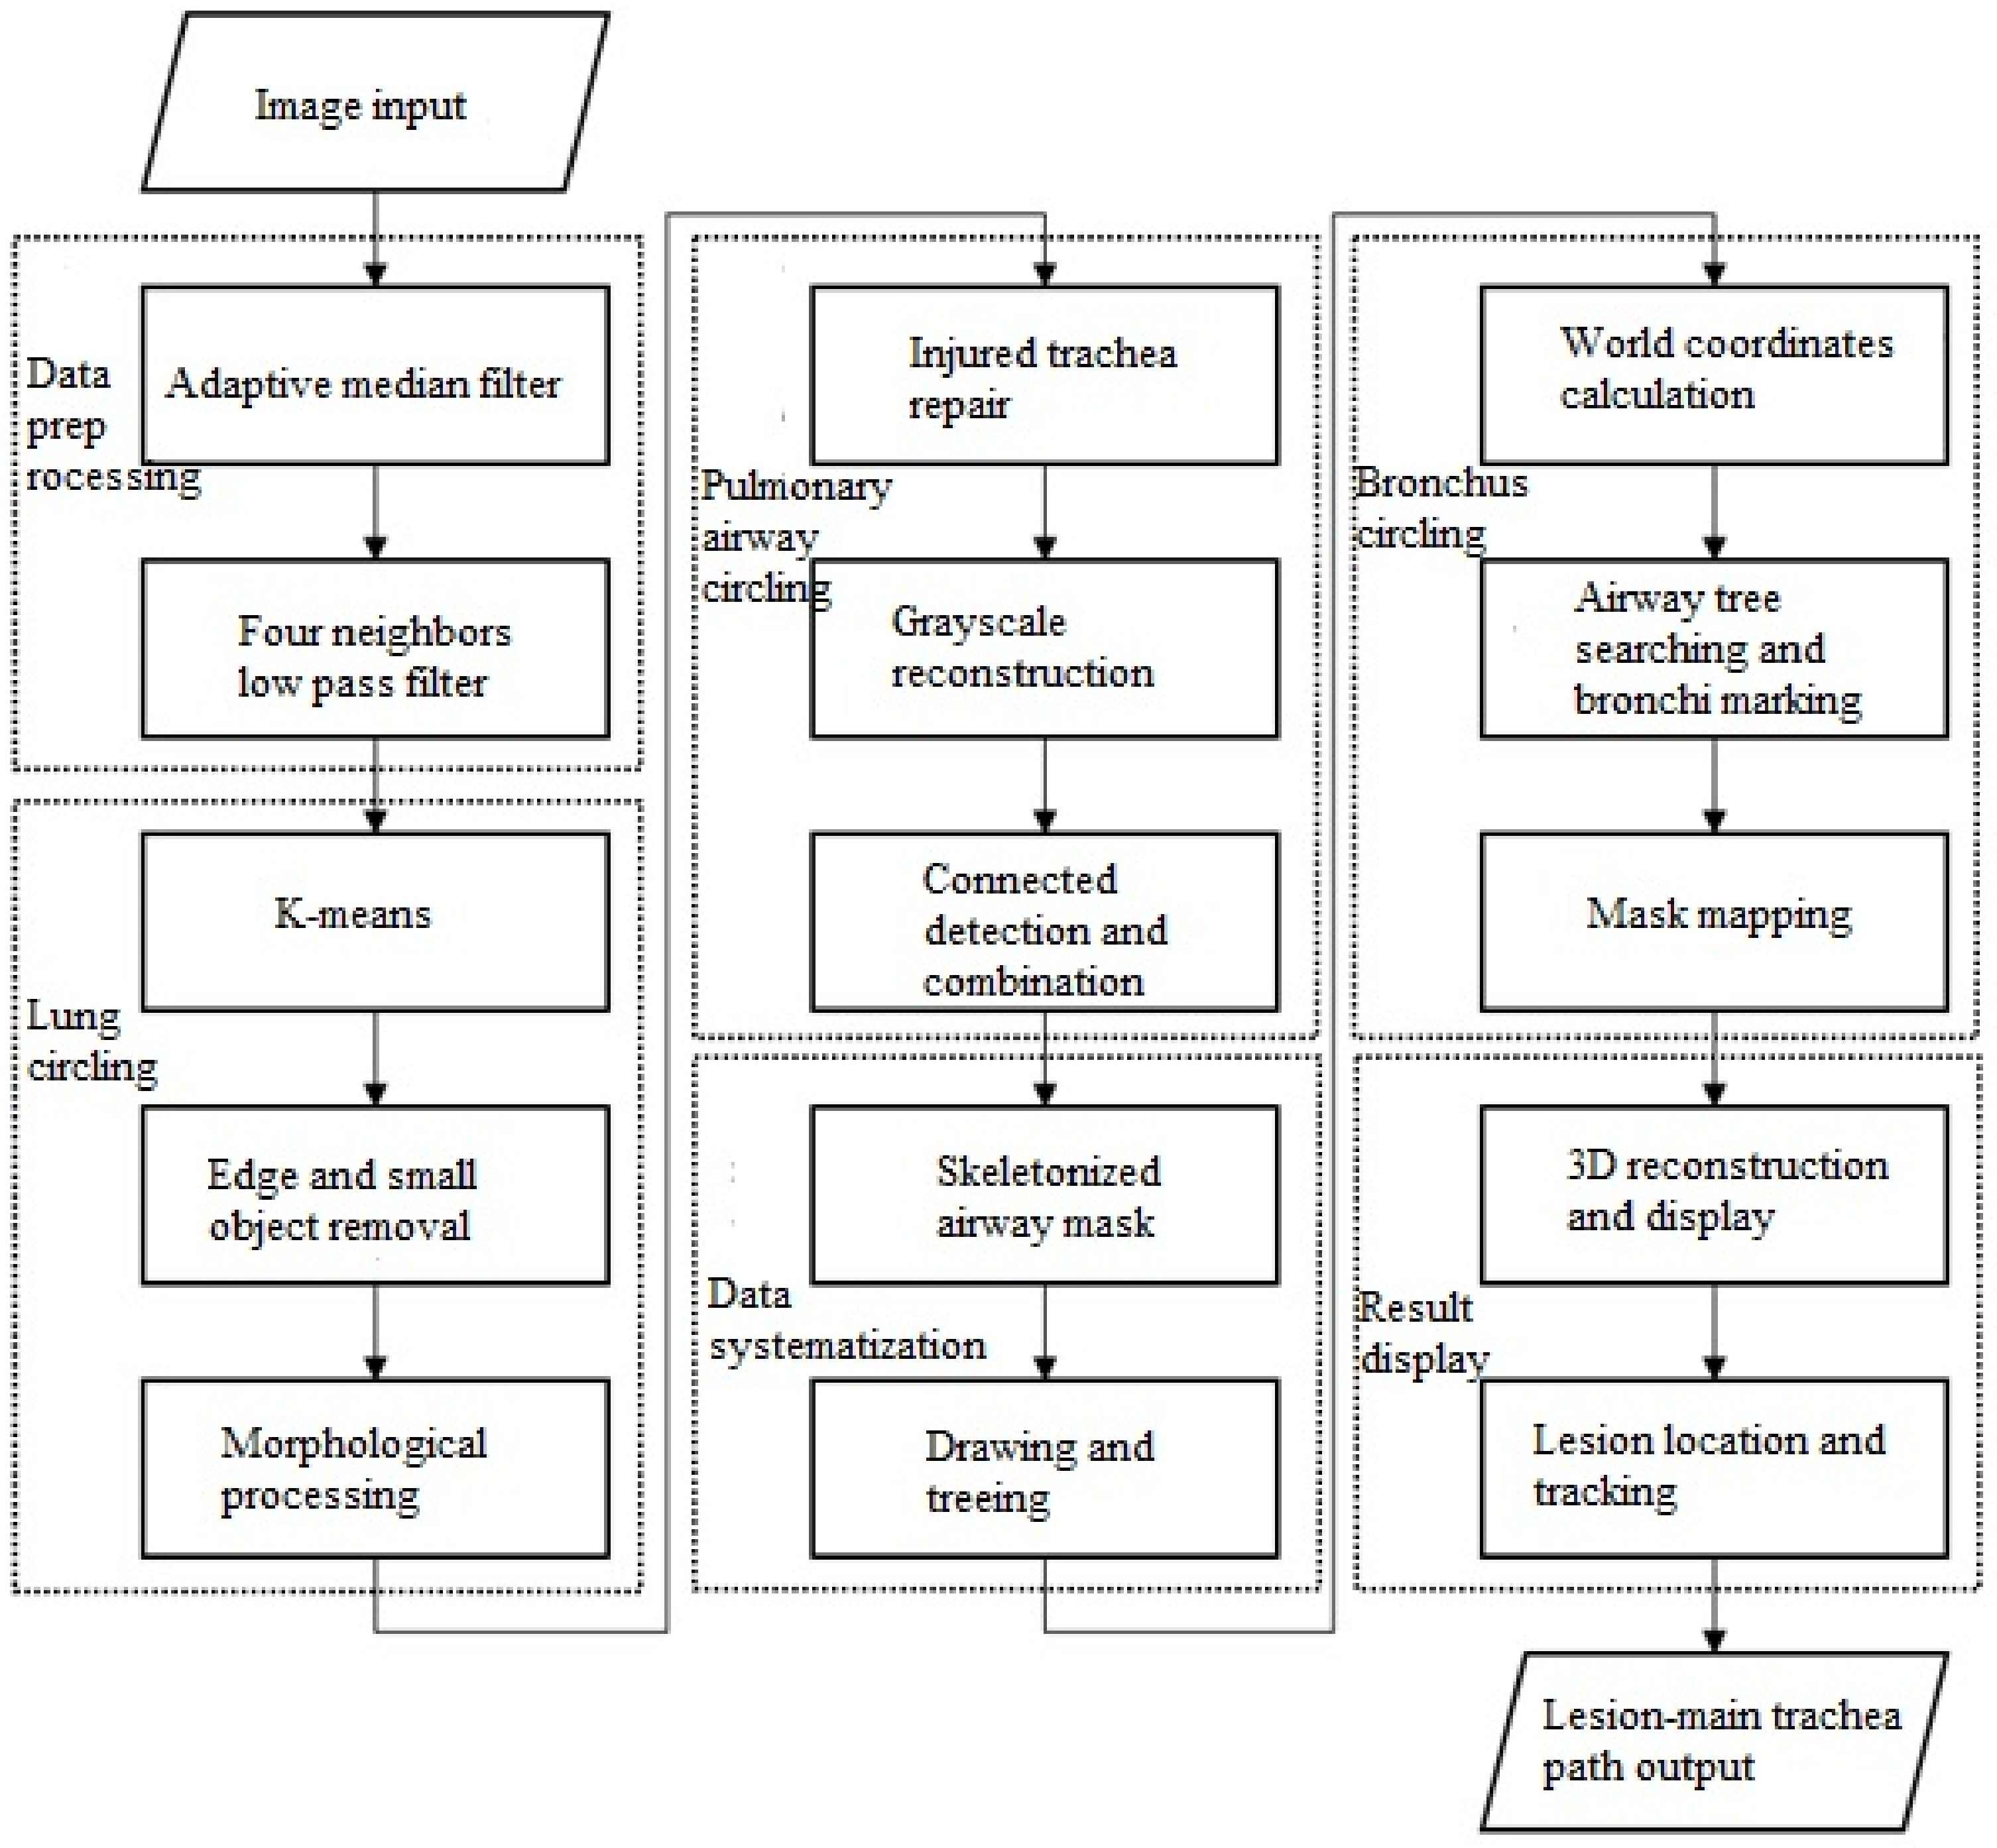
2. Methods
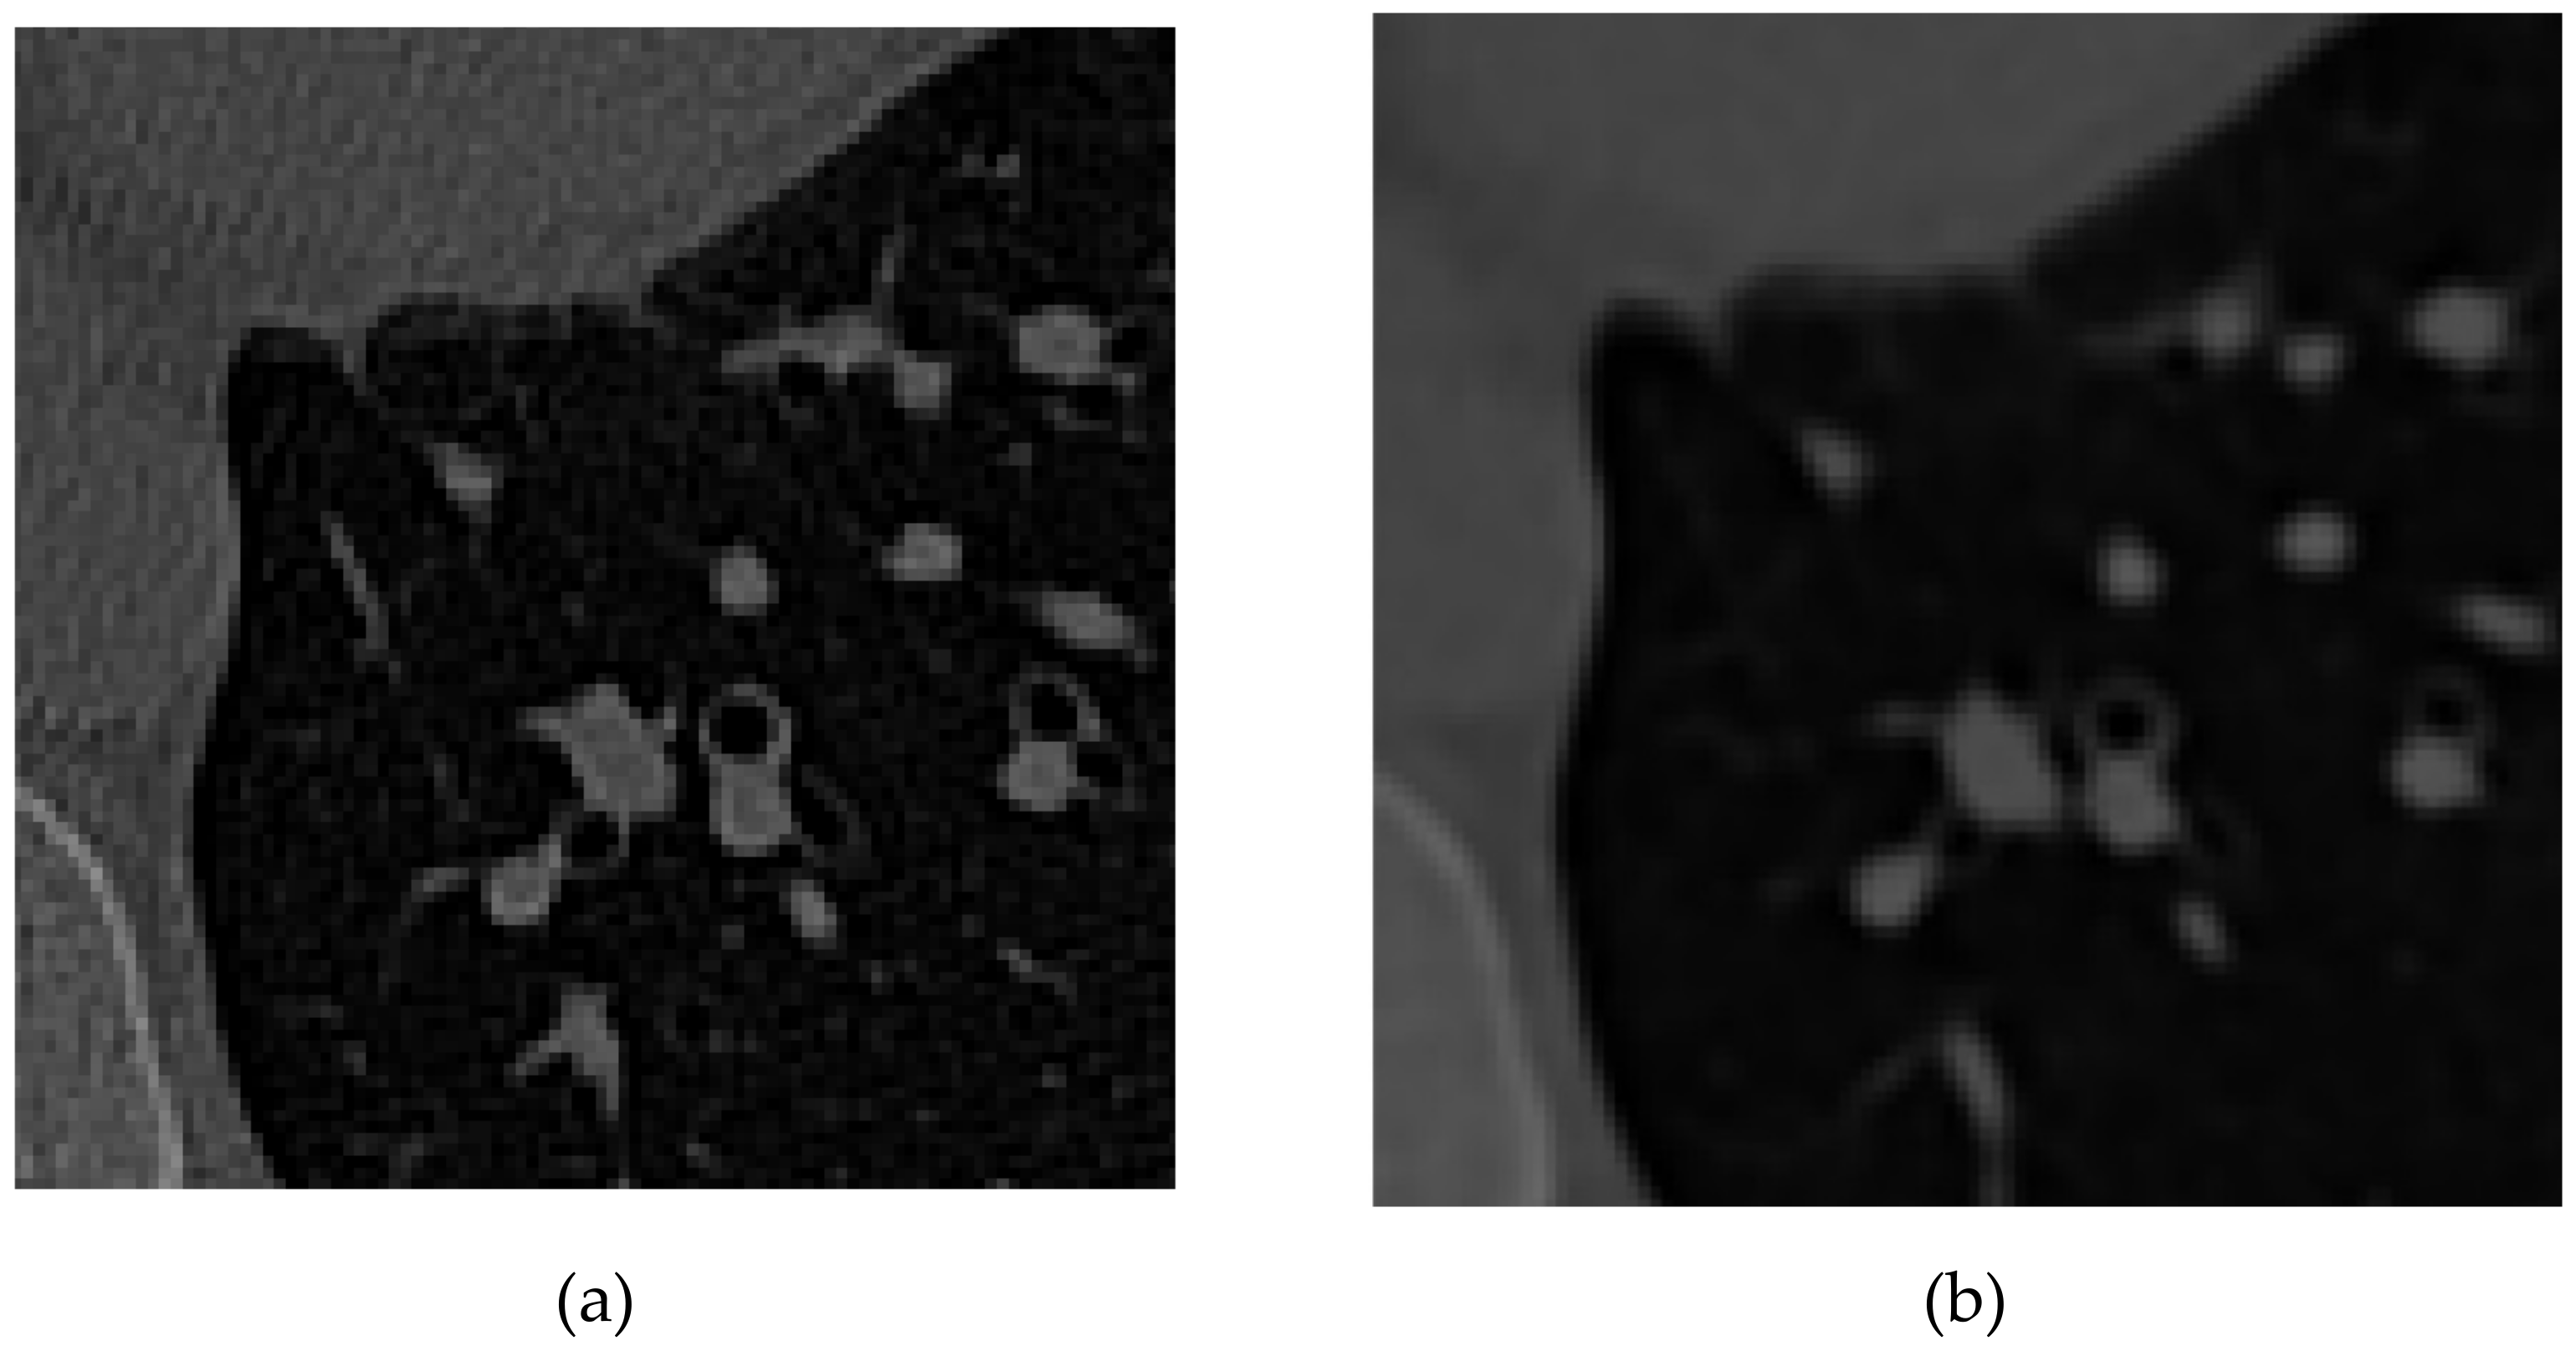
2.1. Data Preprocessing
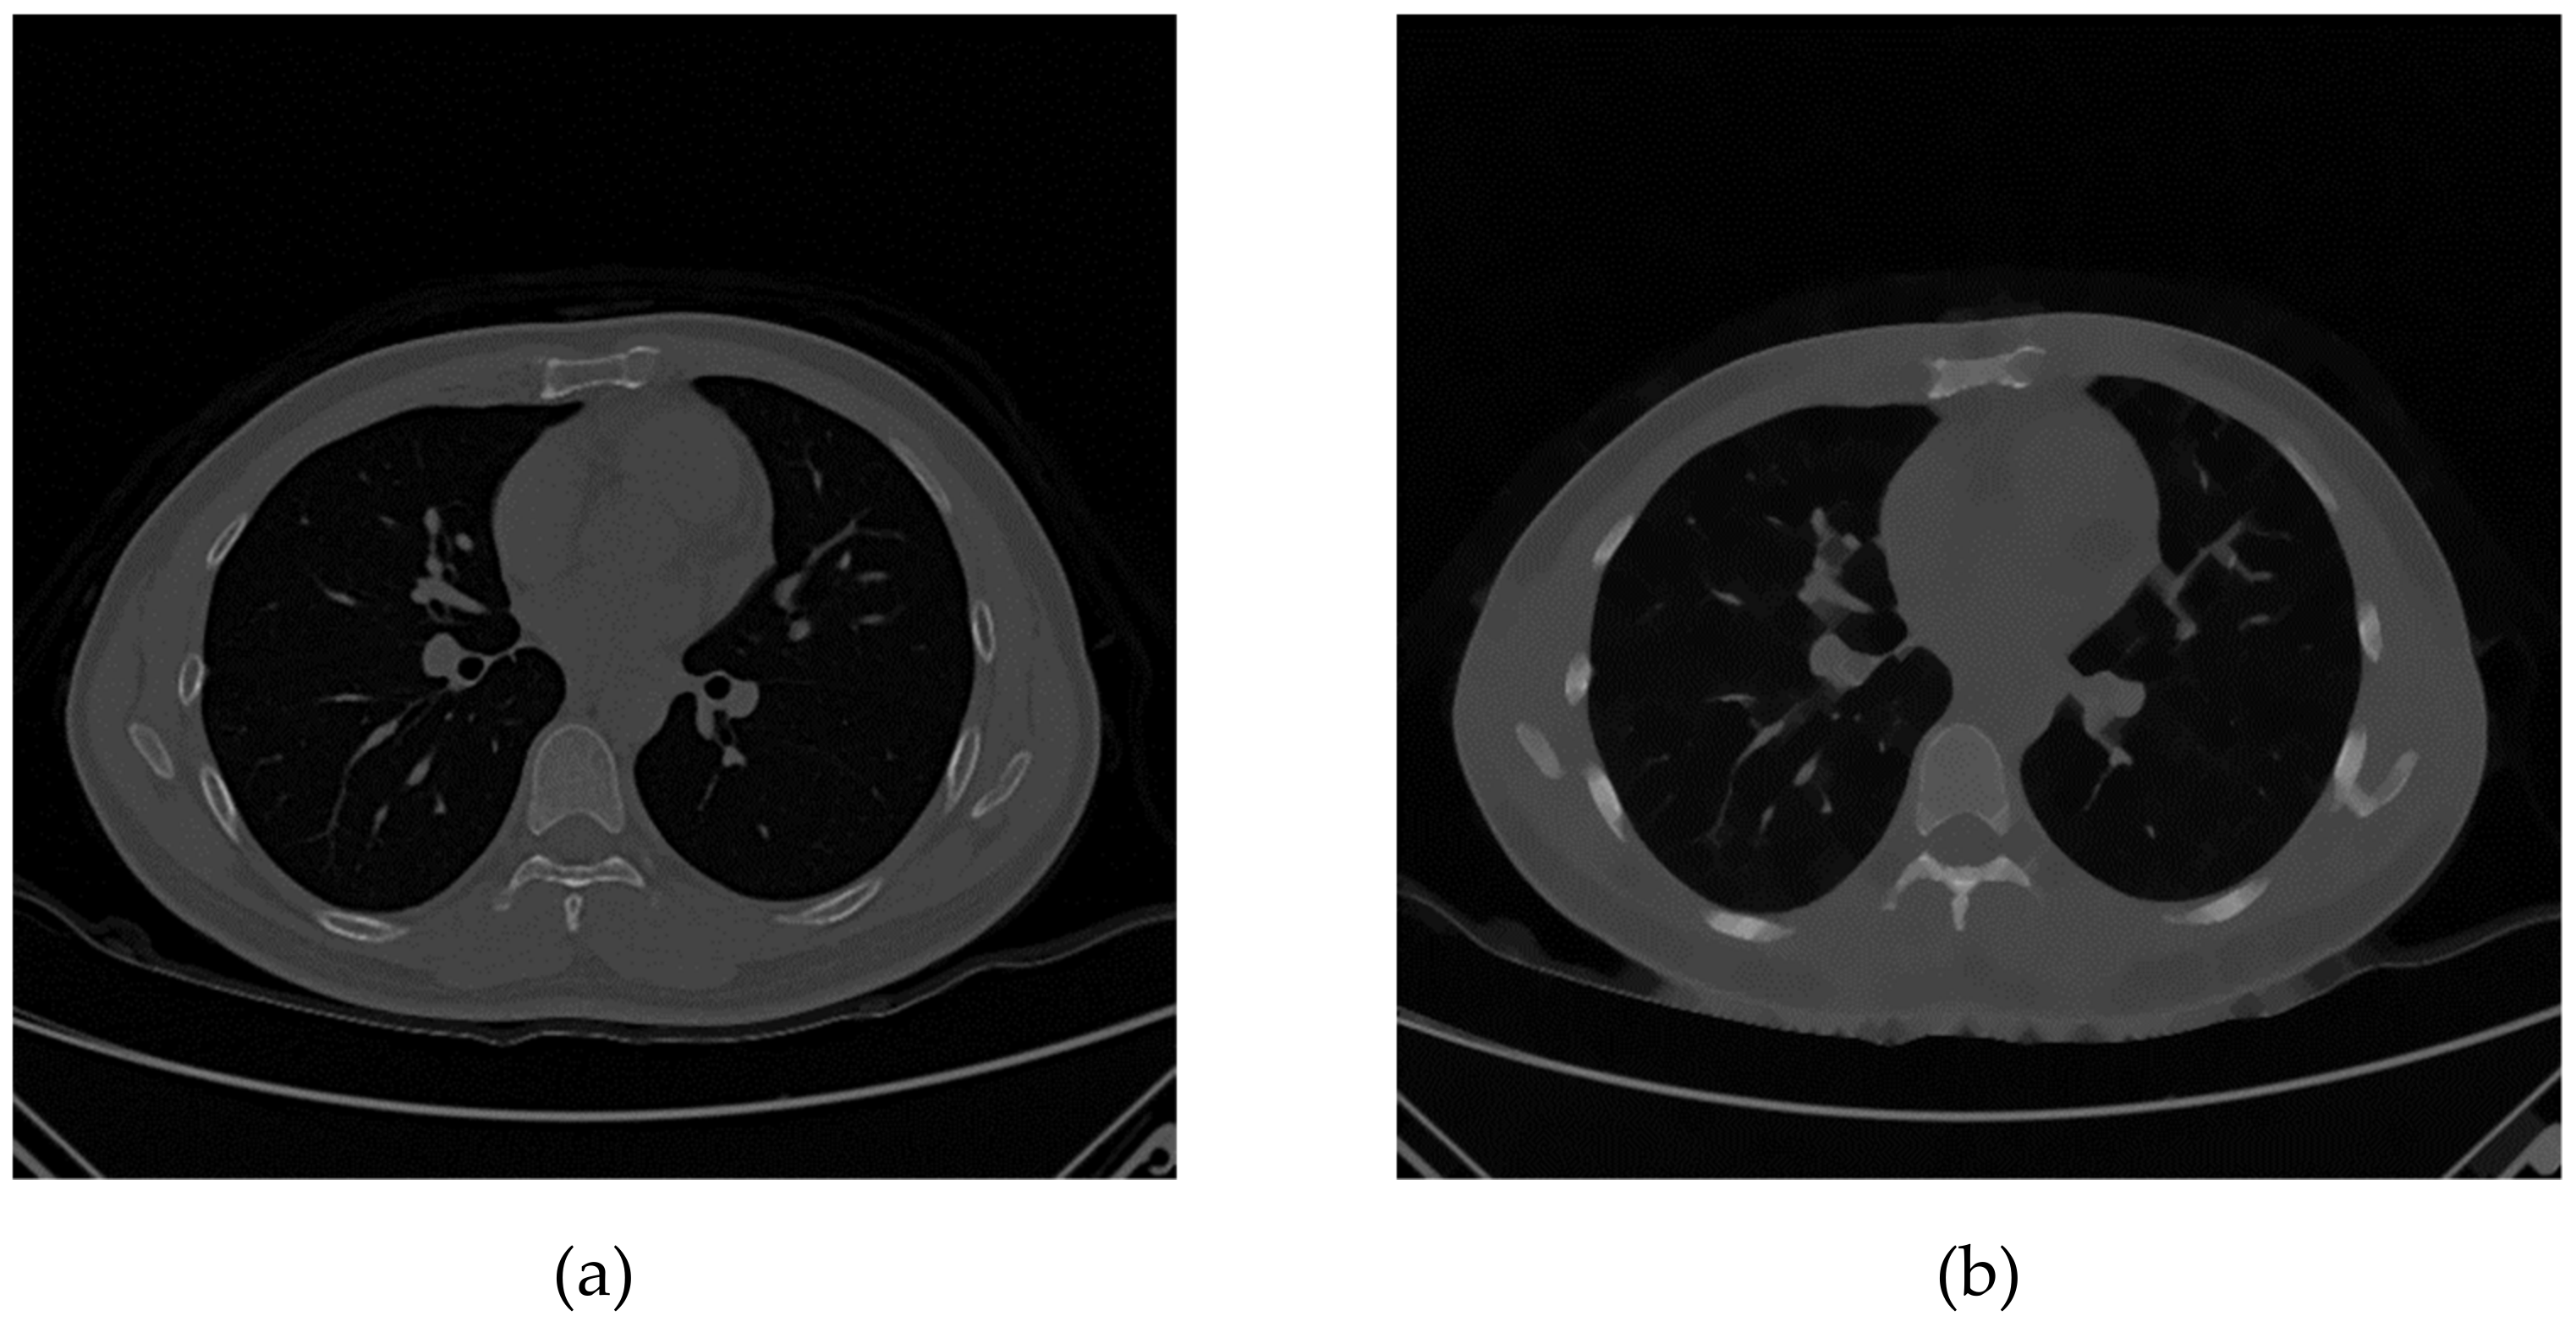
2.1.1. Adaptive Median Filter
2.1.2. Four Neighbors Low Pass Filter
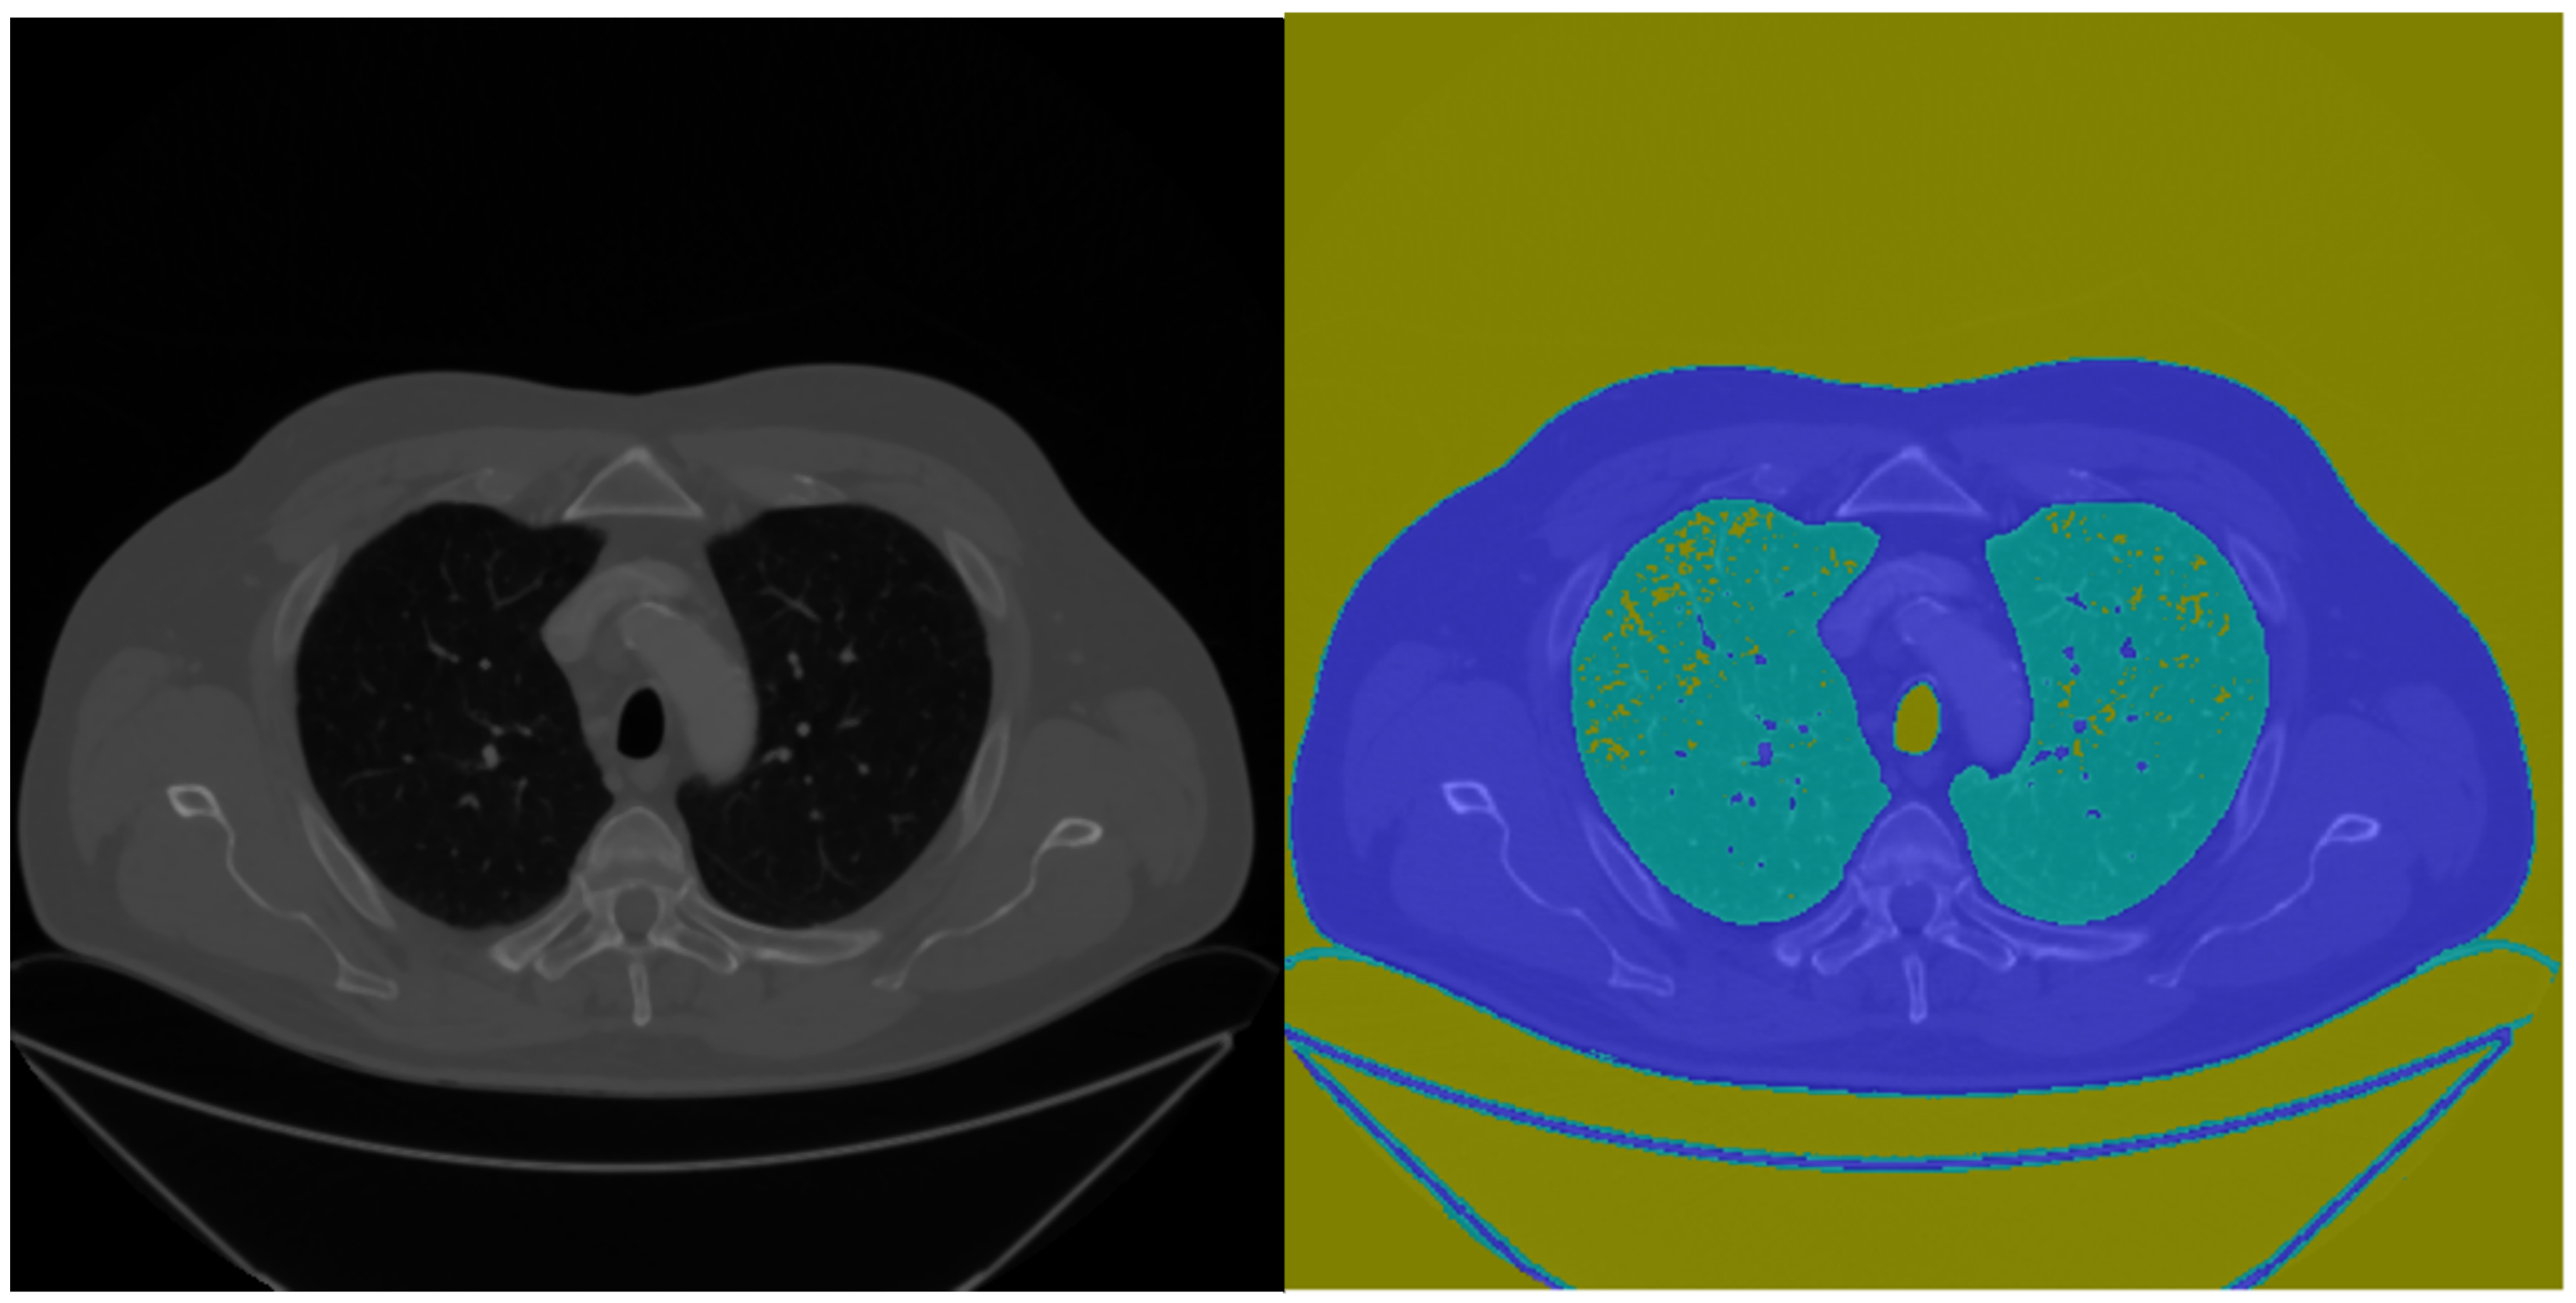
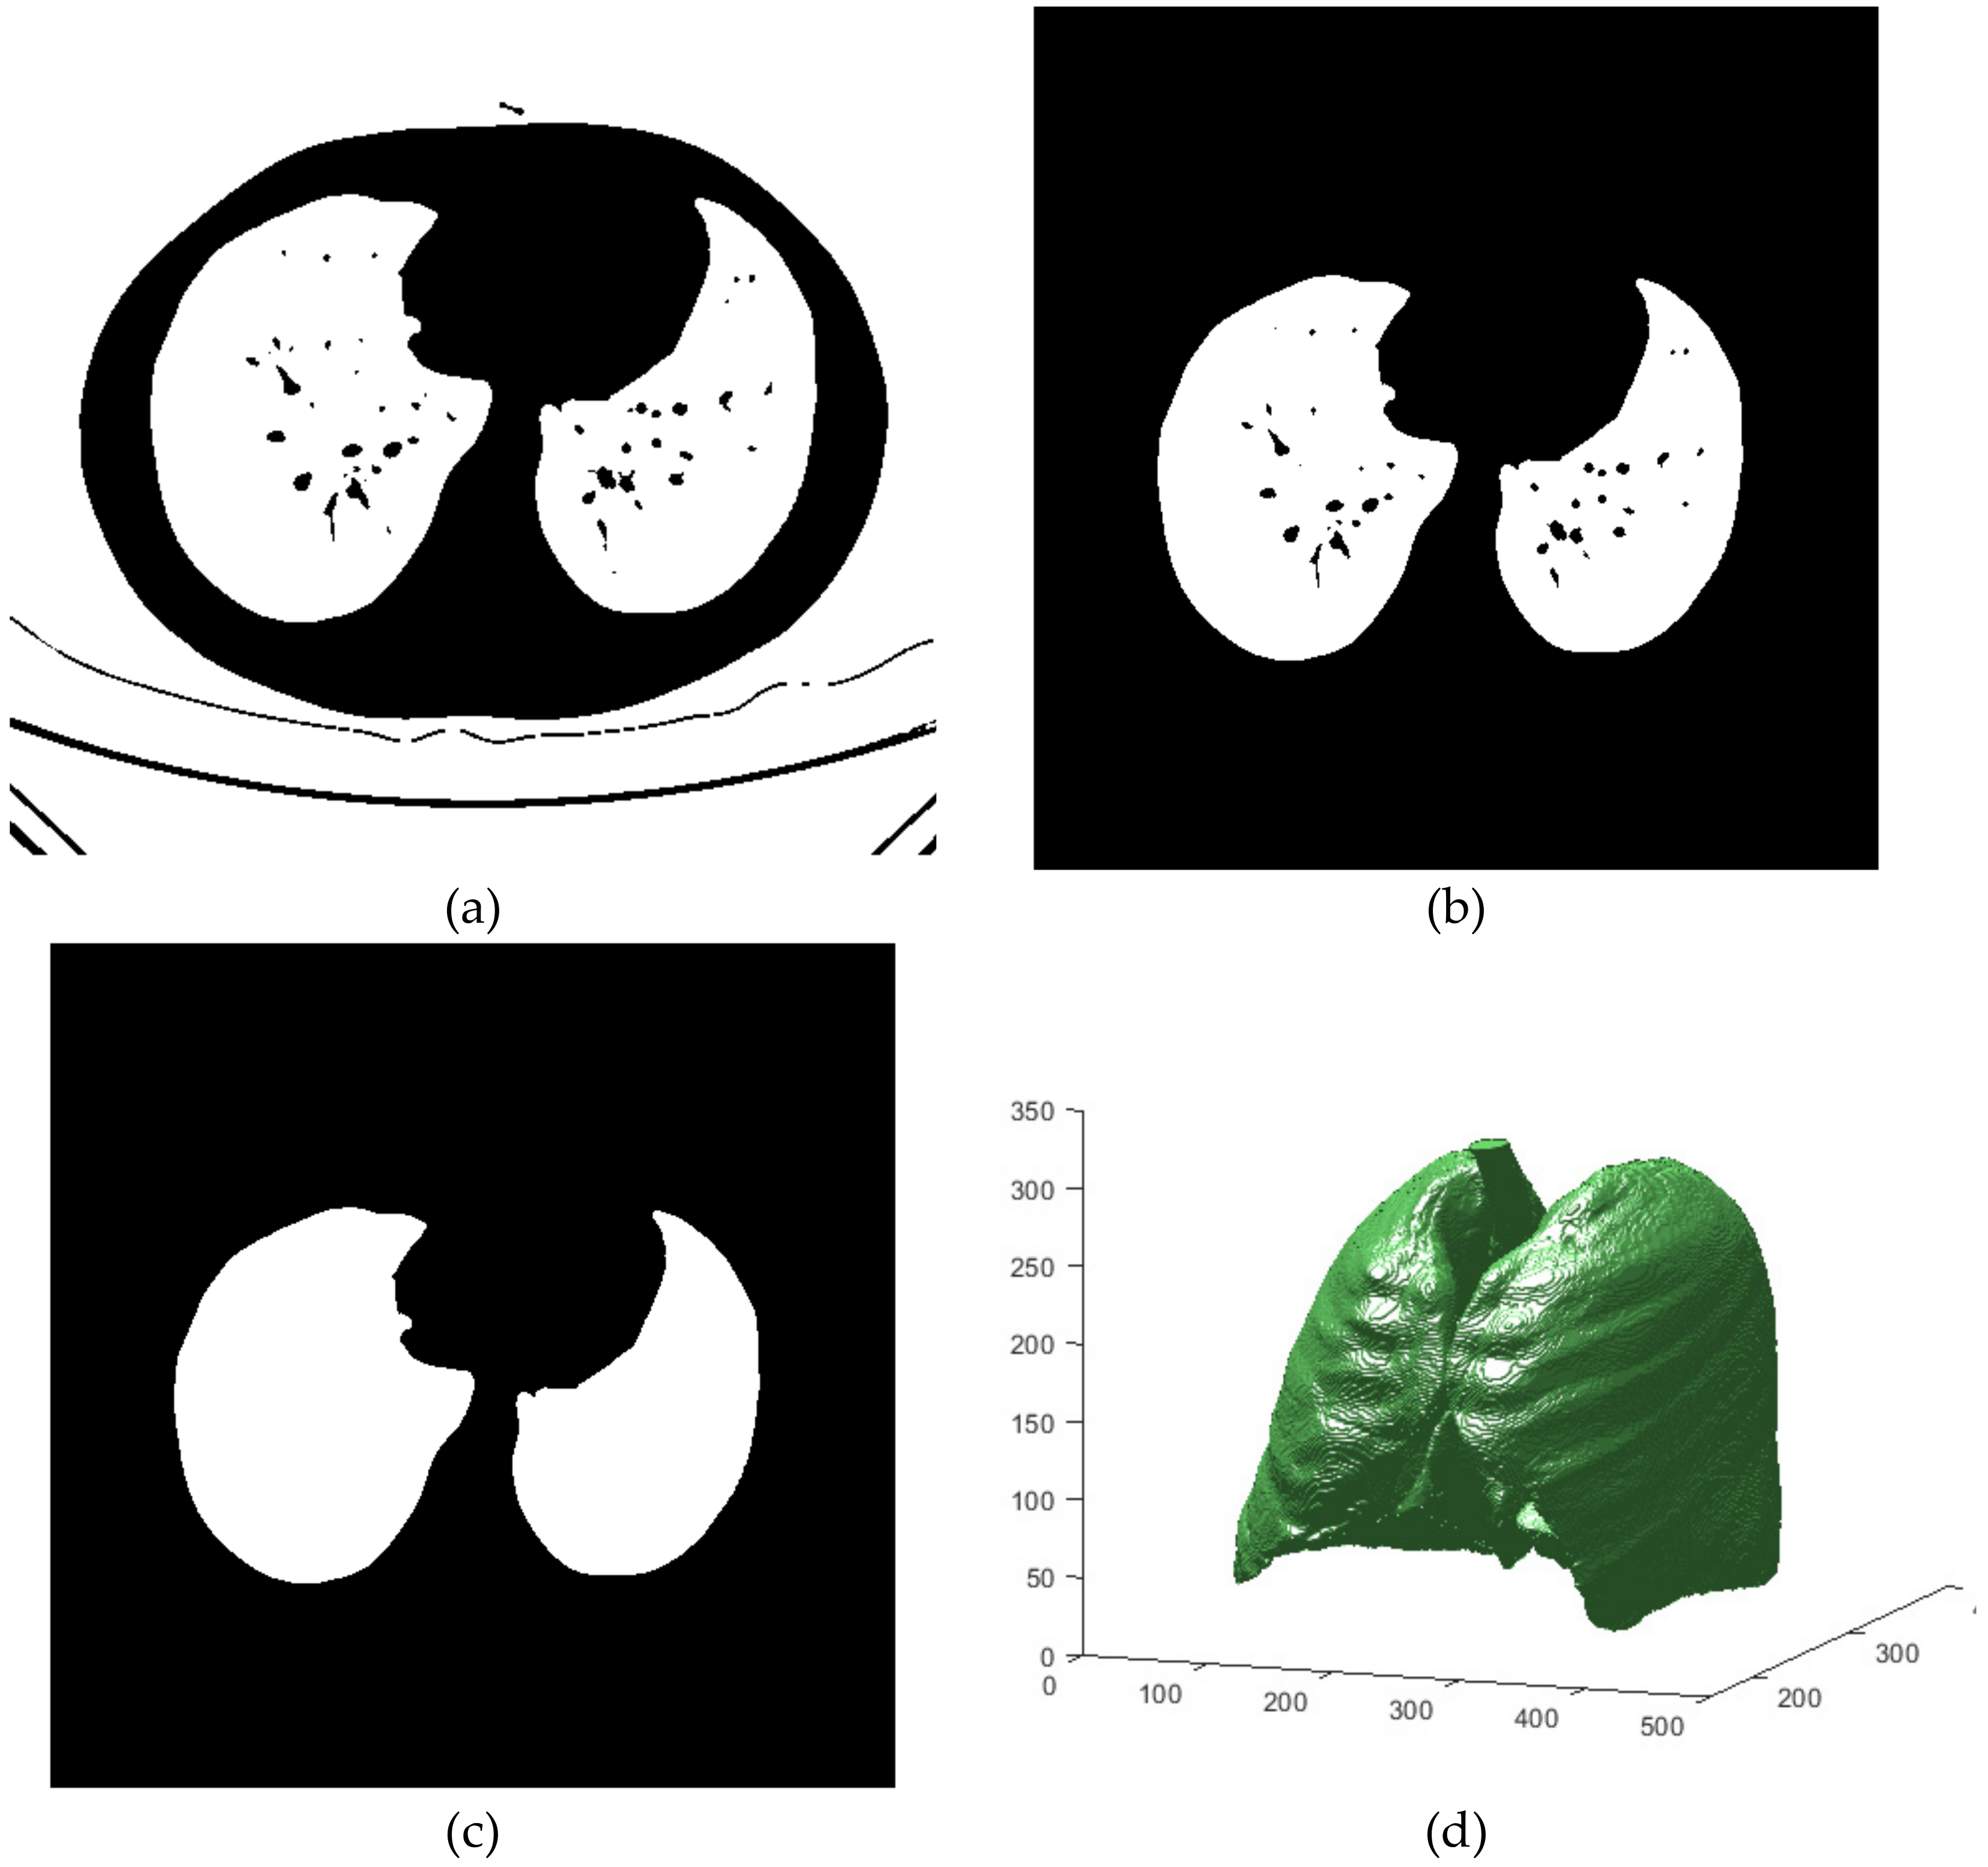
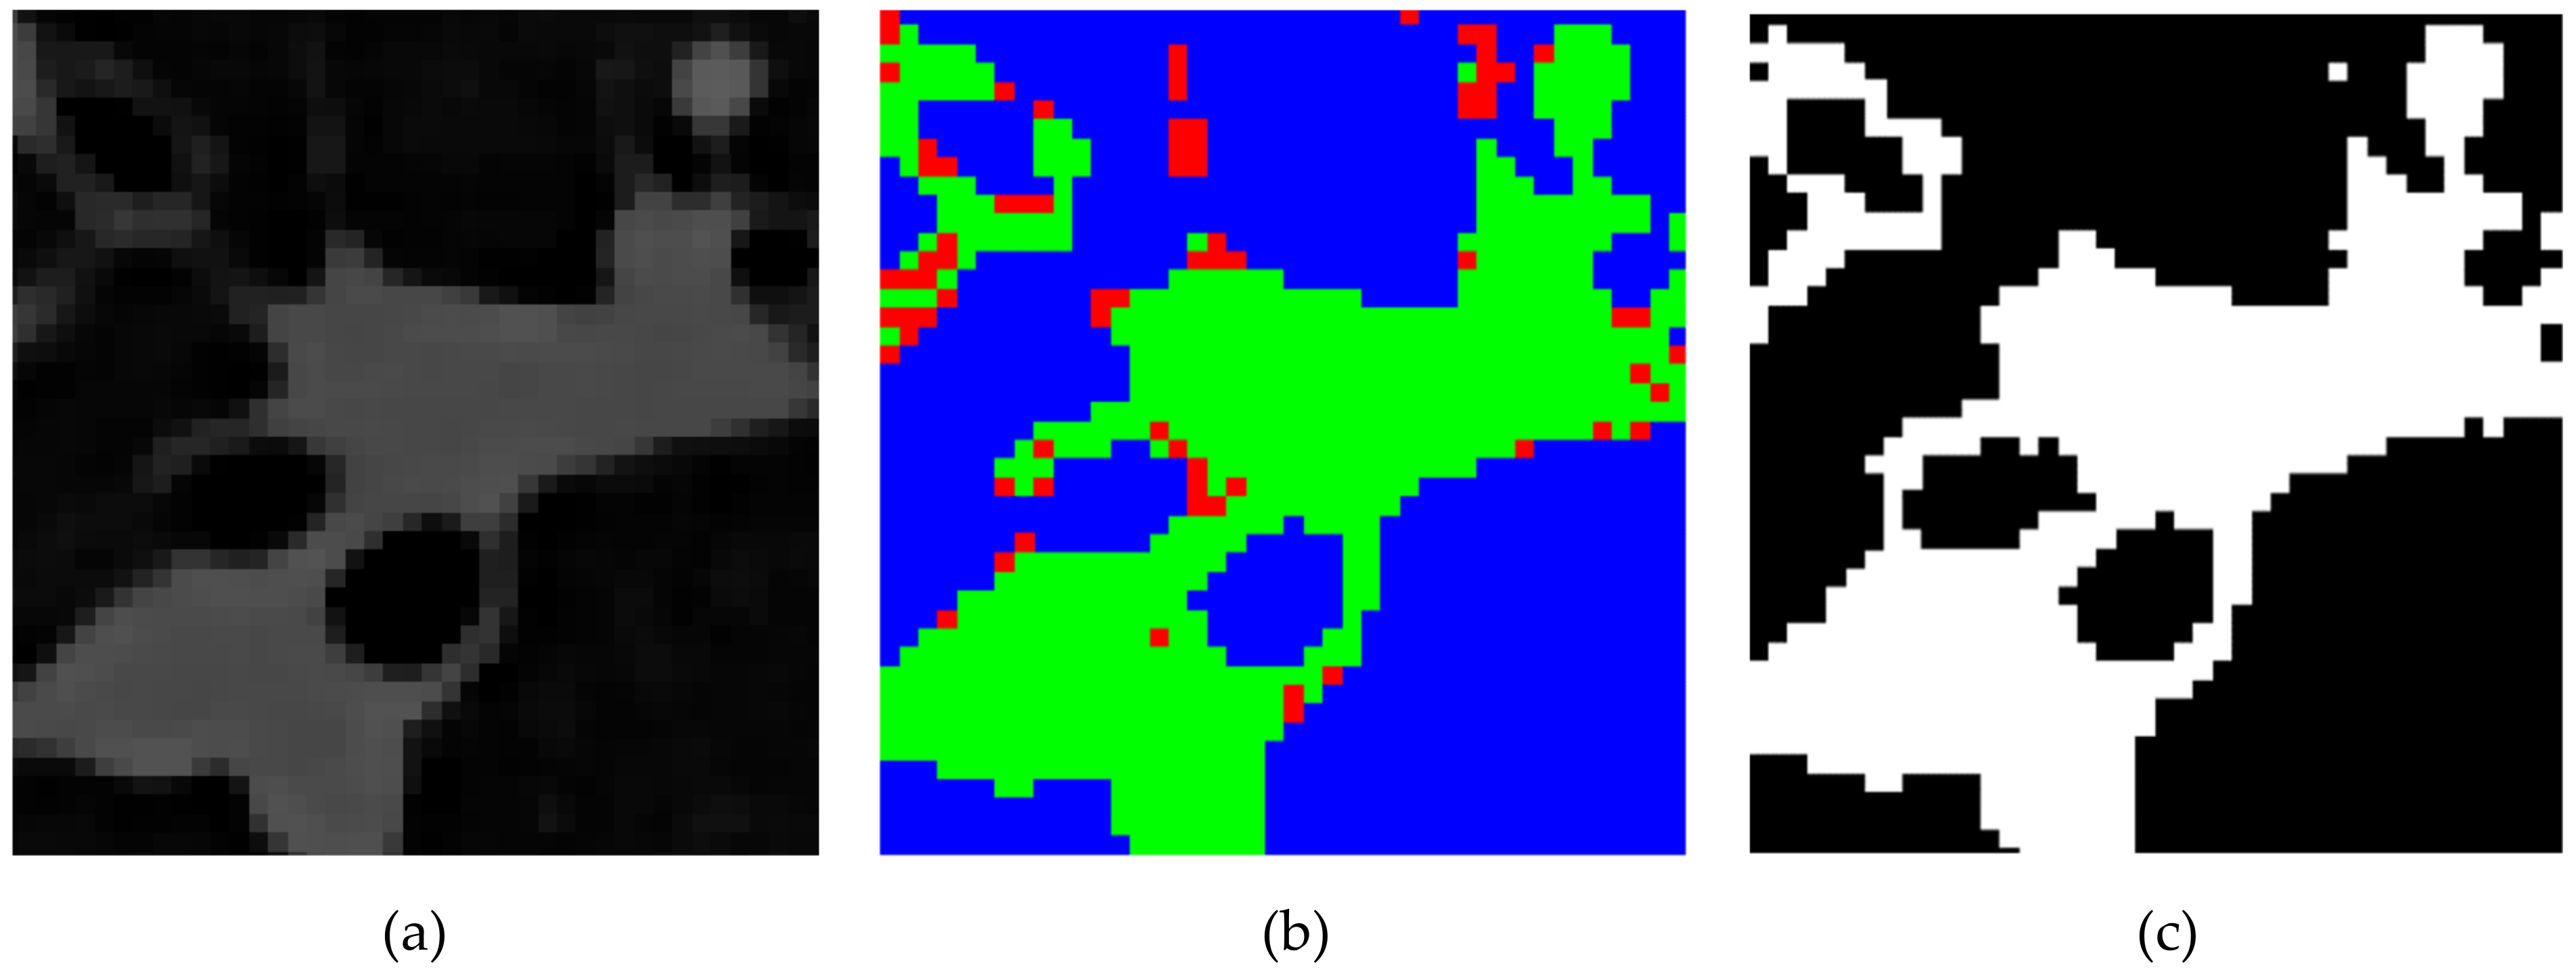
2.2. Lung Circling
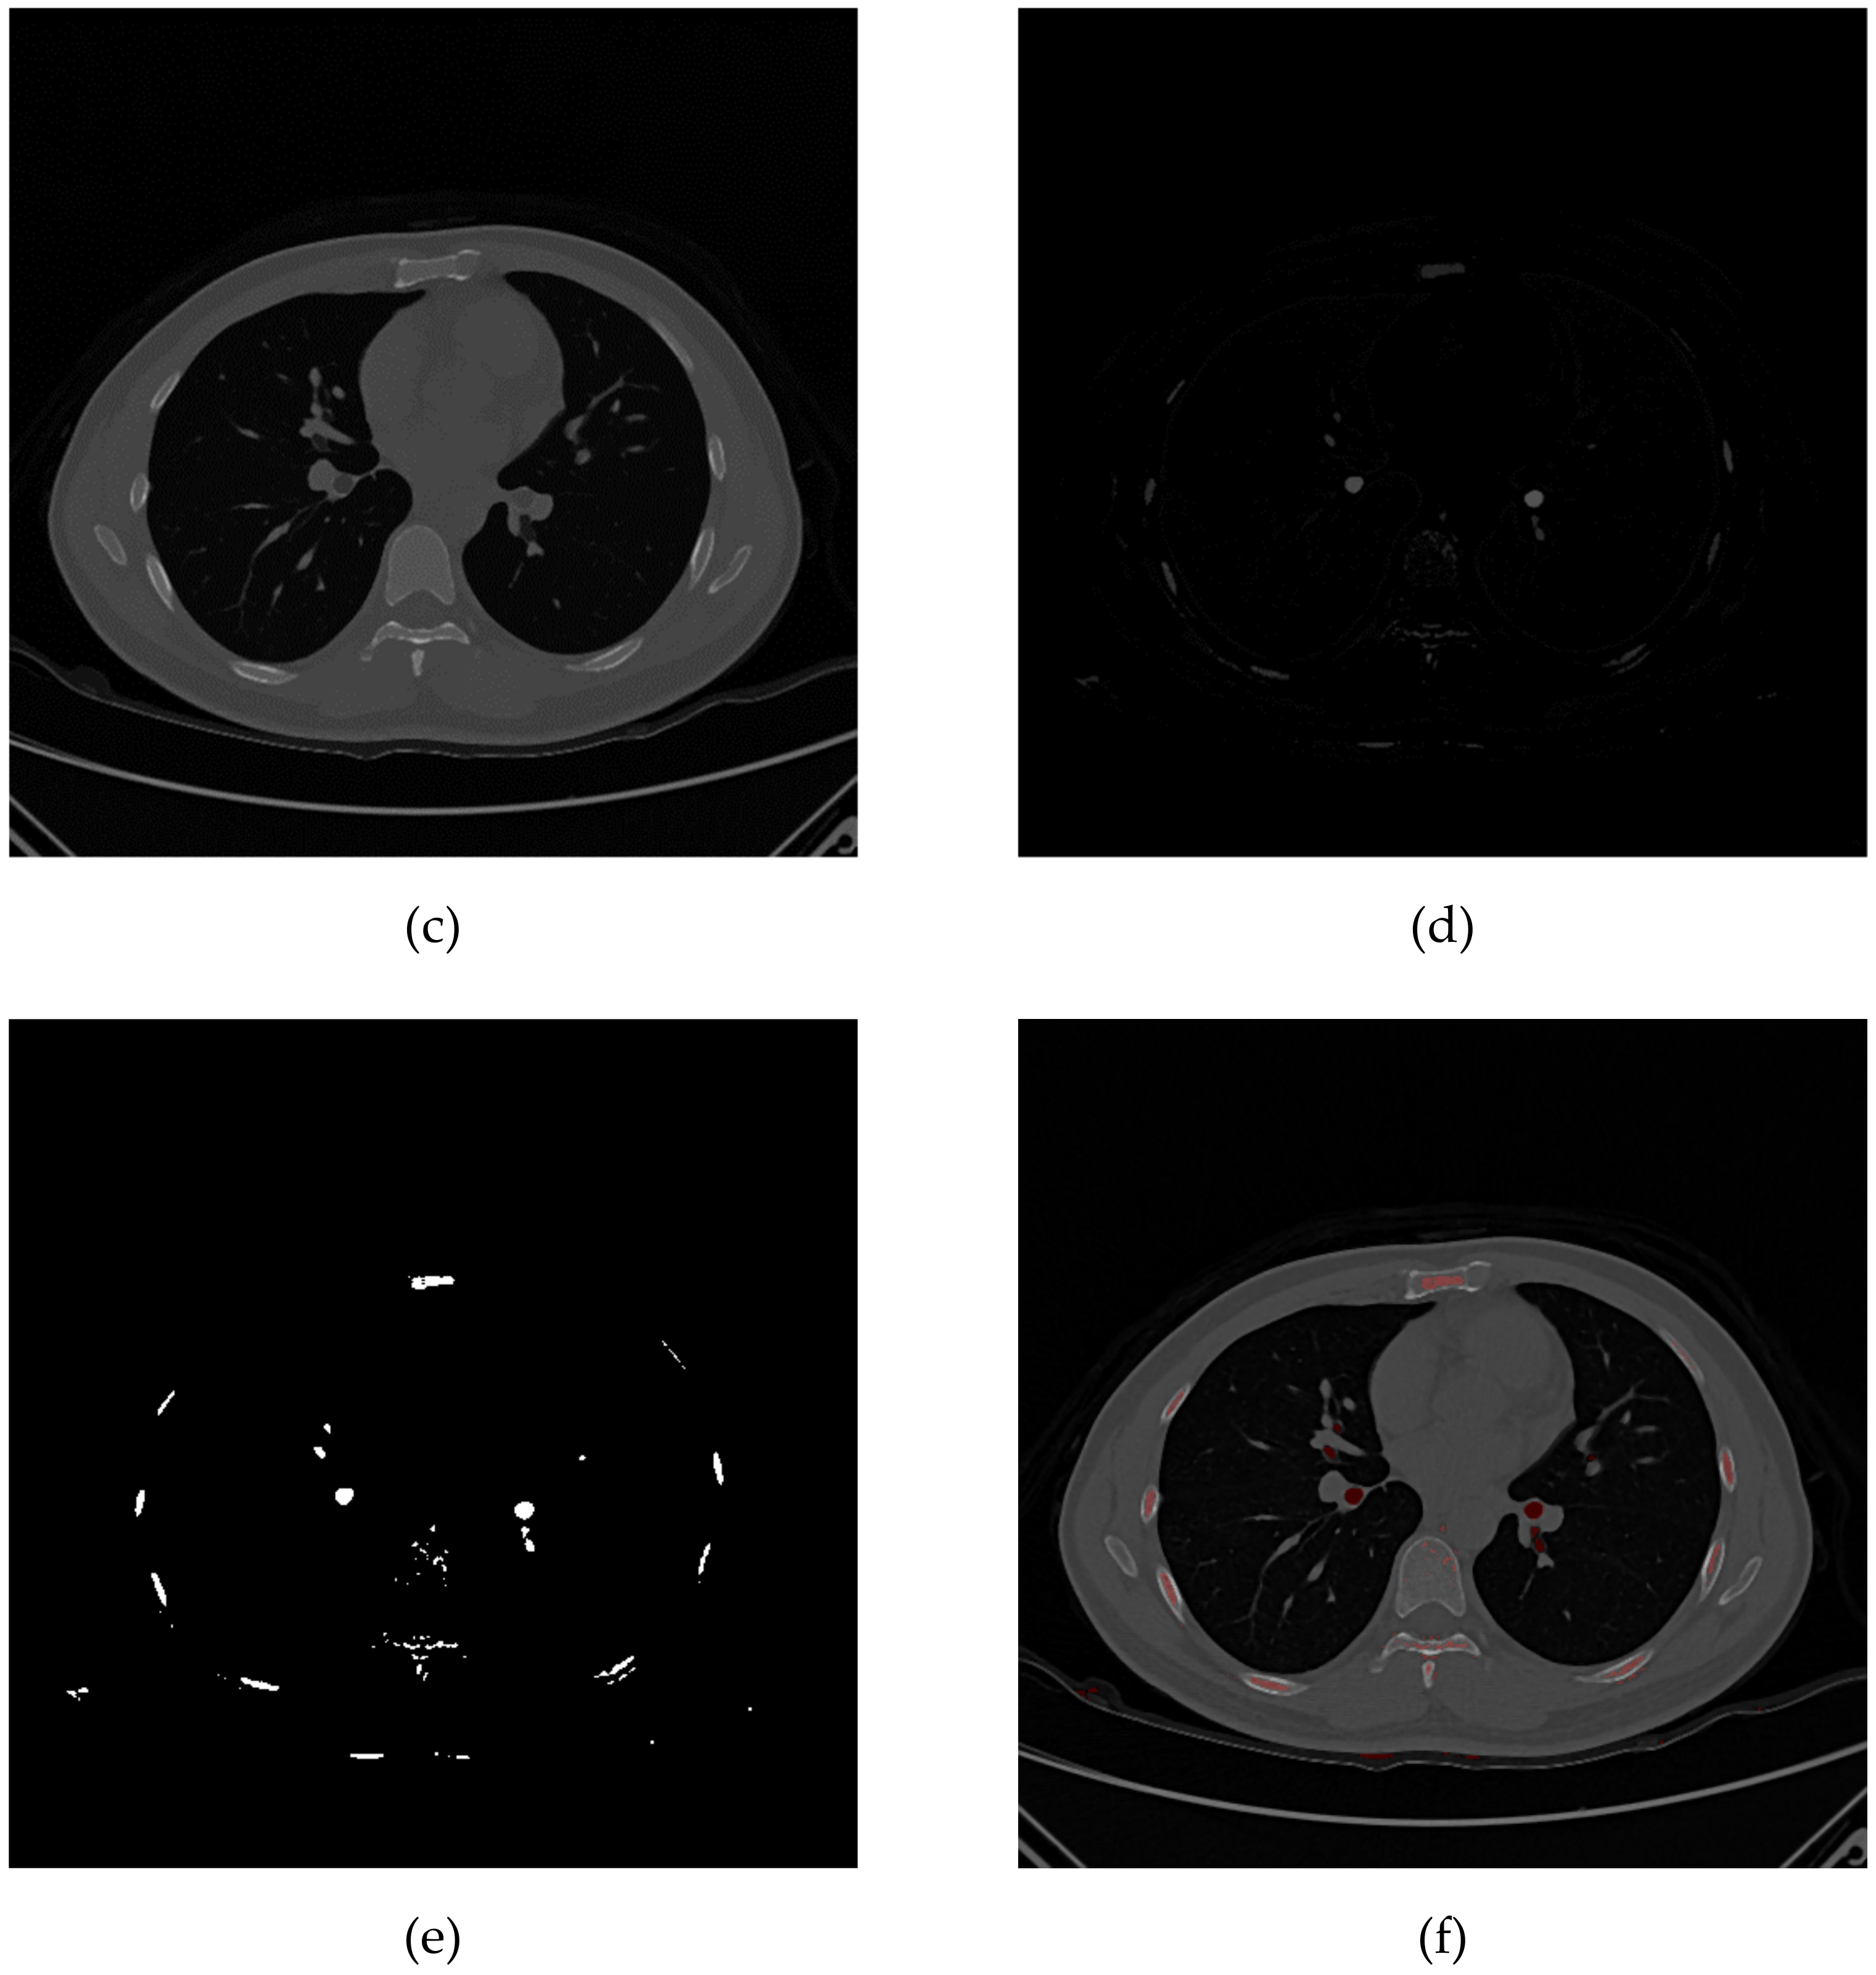
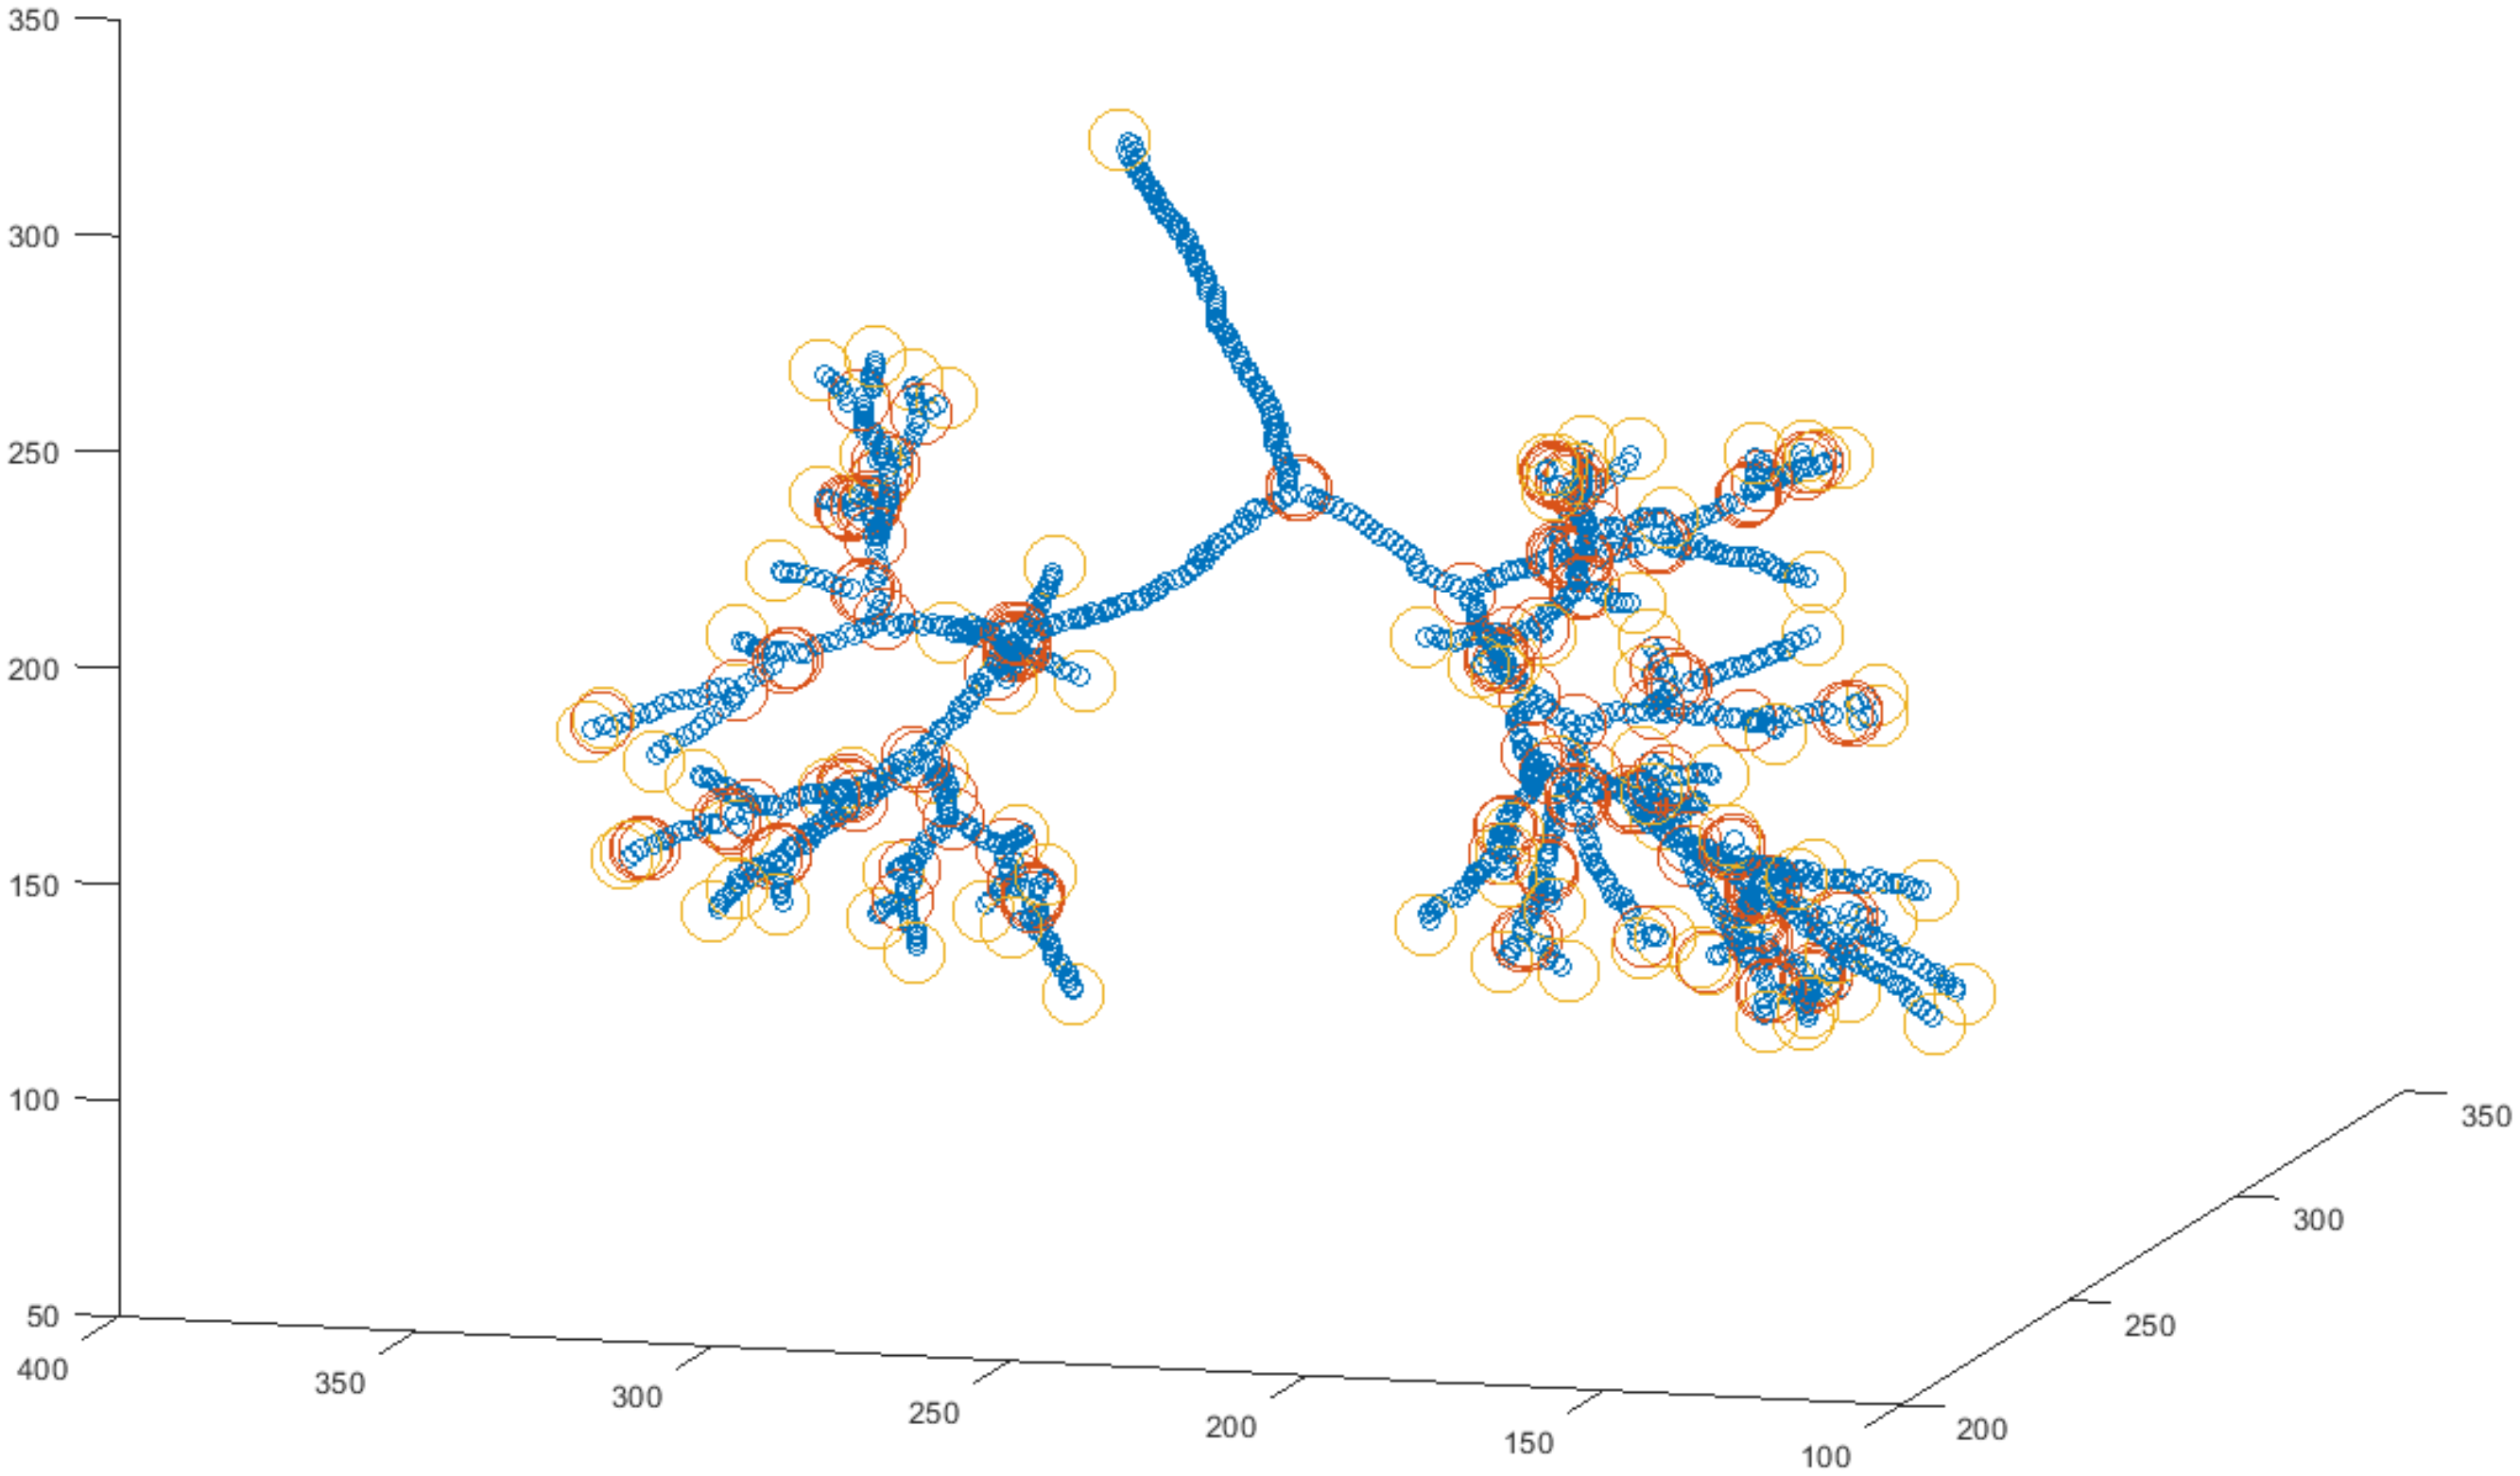
2.3. Pulmonary Airway Circling
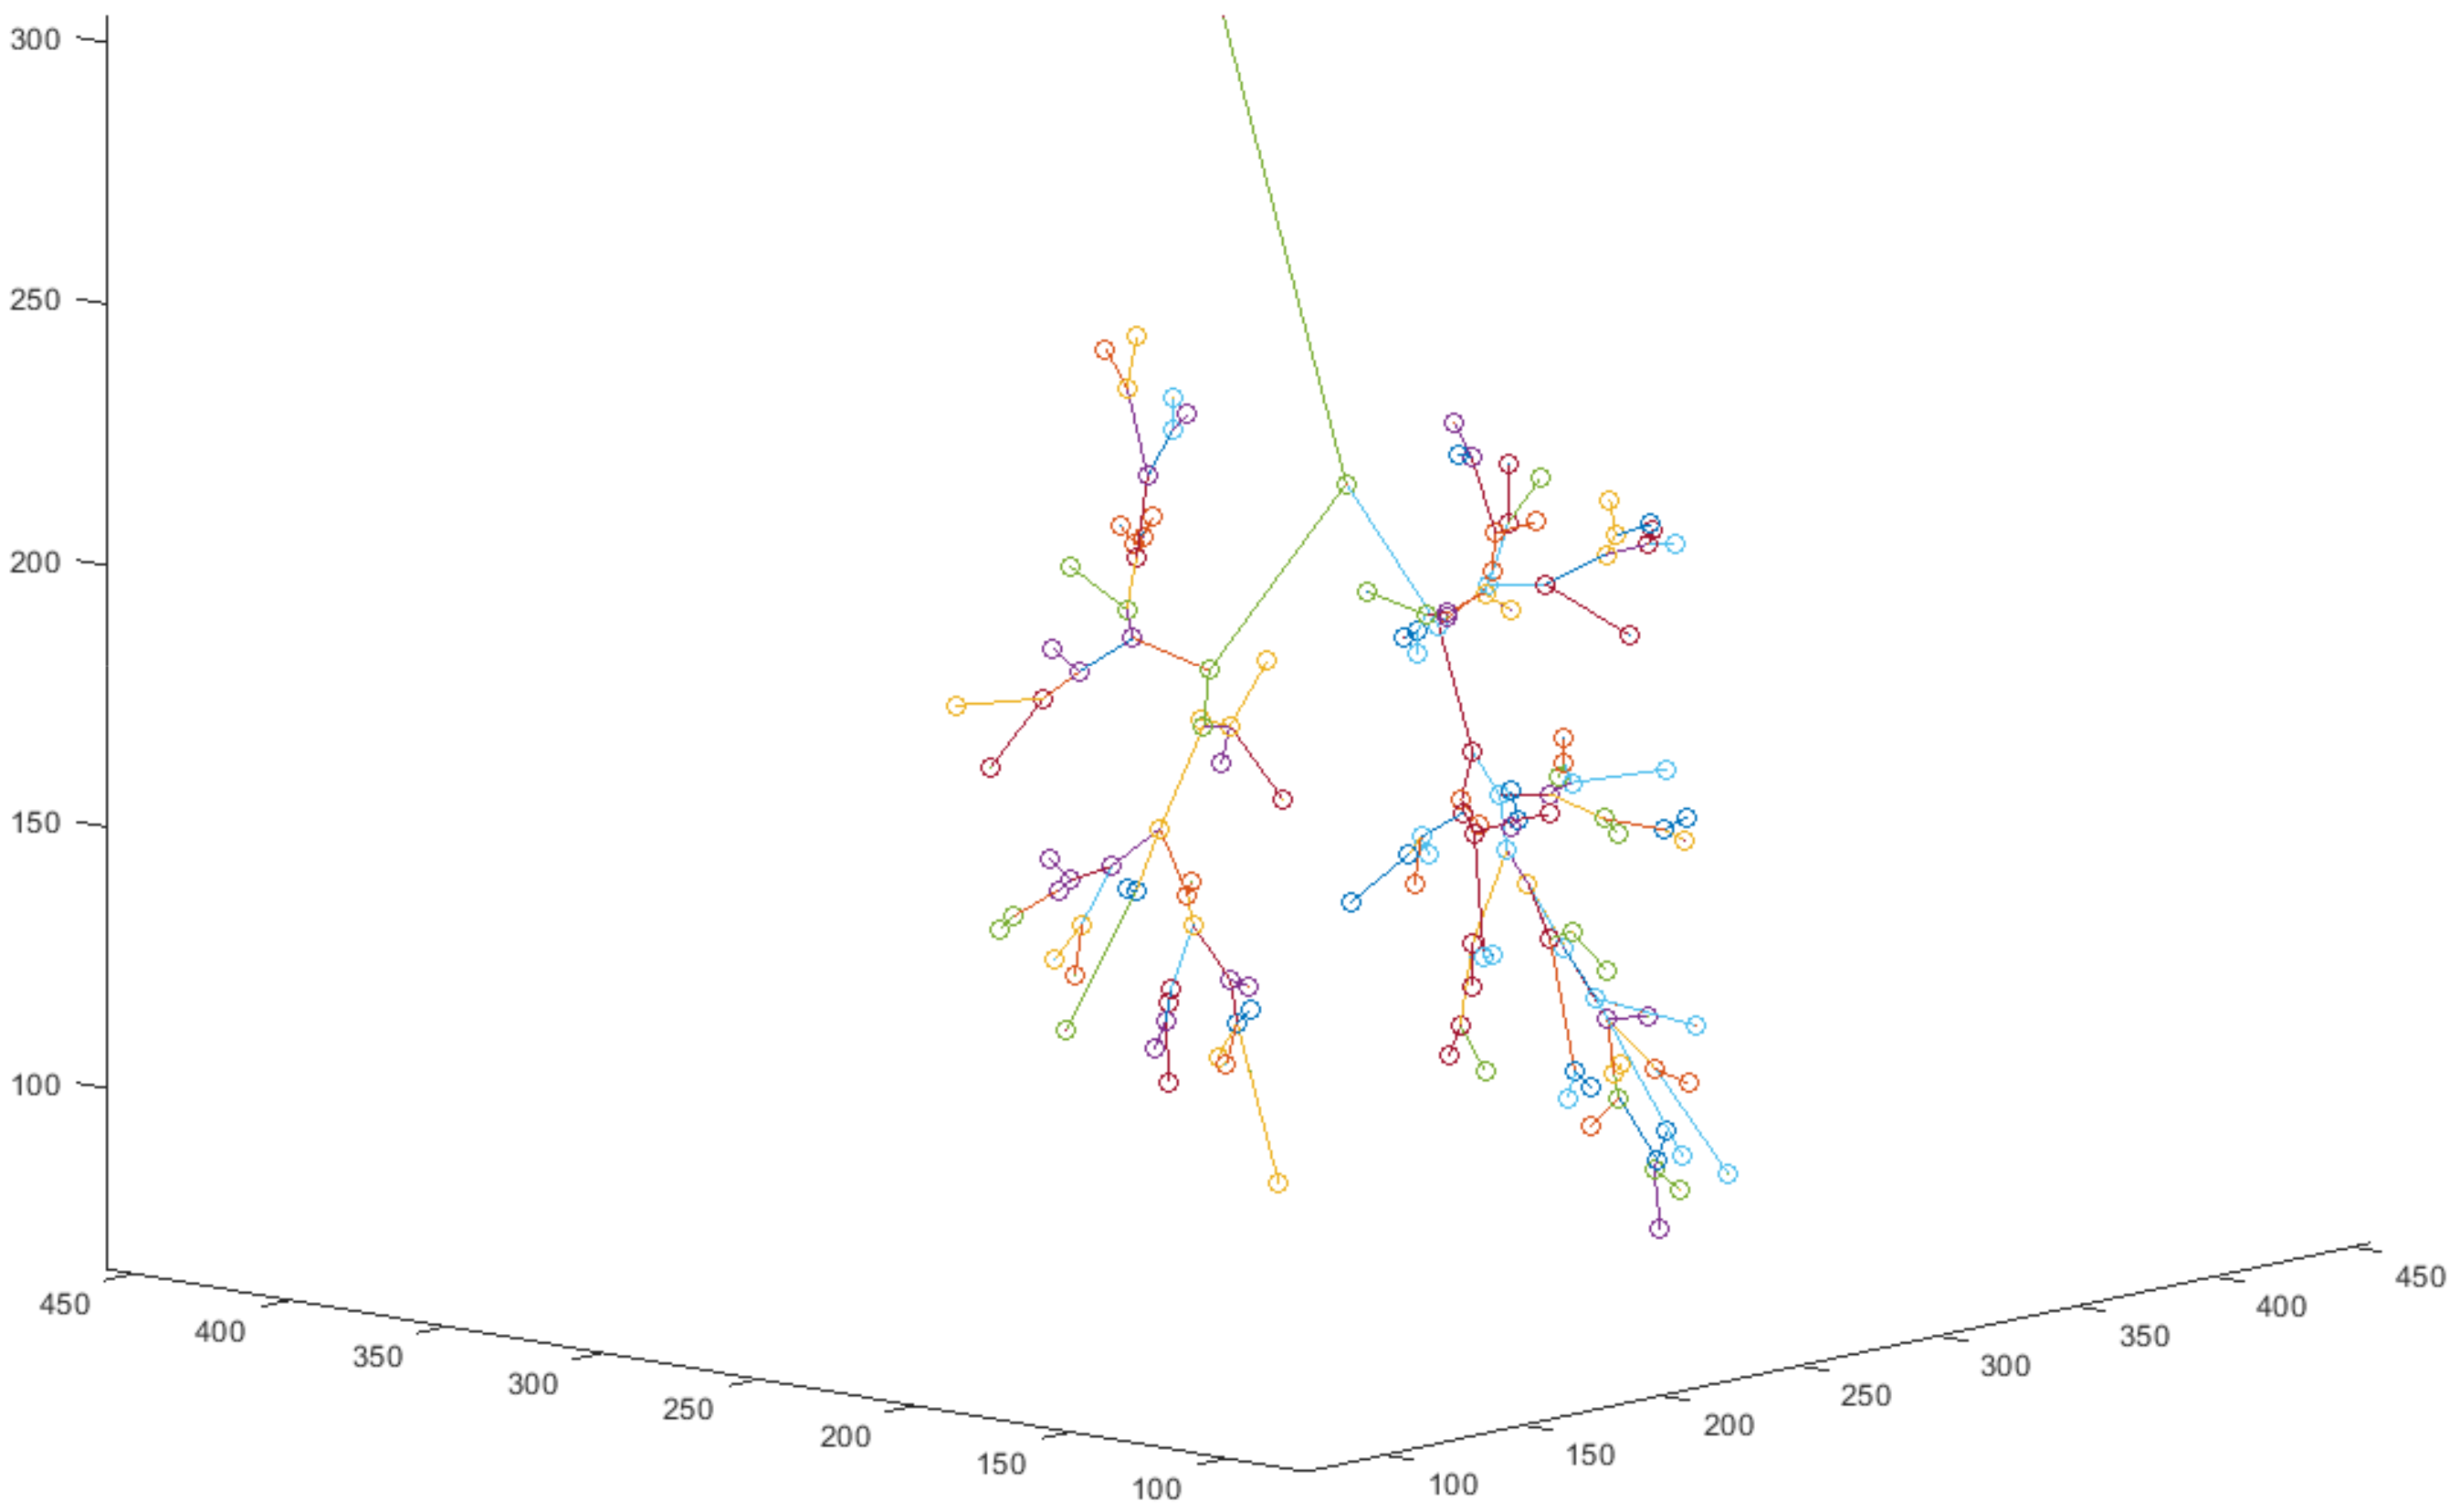
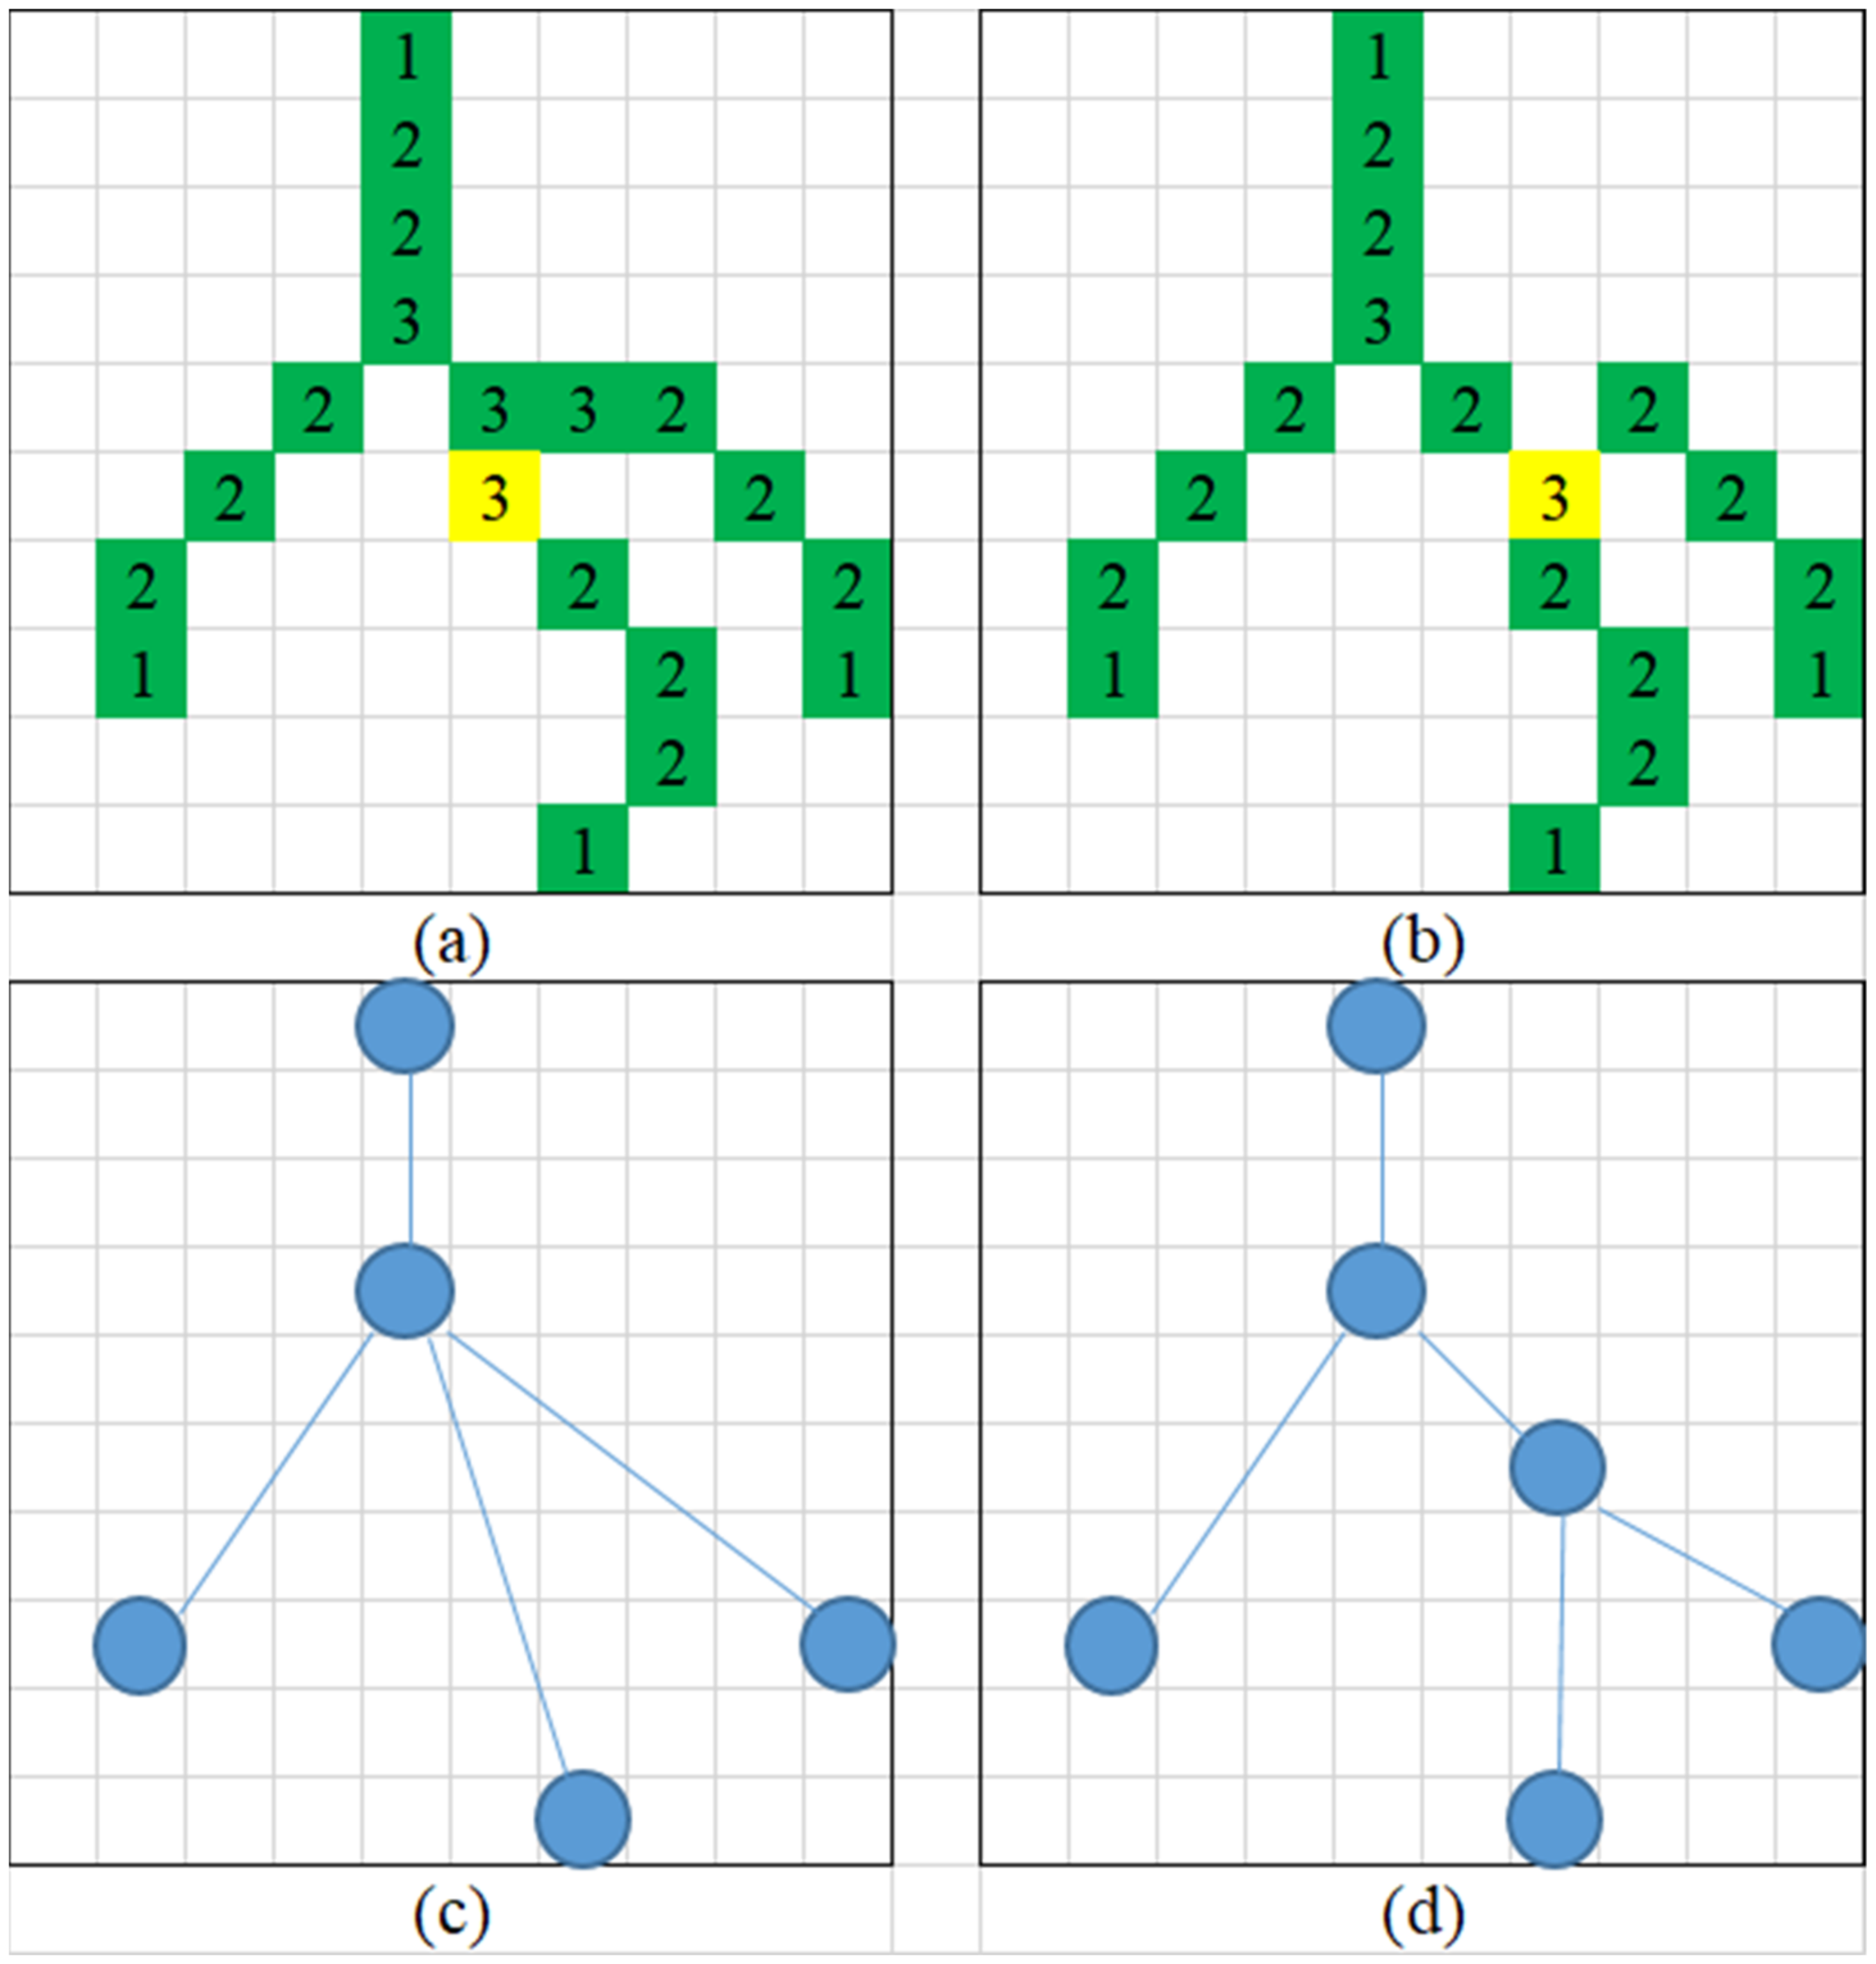
2.4. Data Systematization
- (1)
- Father node—any node iterated father node in the tree that can point at the tree root to represent the airway source;
- (2)
- Child node—any node iterated child node in the tree that can point at a tree bottom to represent the branch and link of the airway;
- (3)
- Coordinate—marking the coordinates of the point in the space;
- (4)
- Father distance—the distance to the father node, derived from the graph line cost of this node to the father node;
- (5)
- Child distance—the distance to the child node, derived from the graph line cost of this node to the father node;
- (6)
- Father vector—the direction of the father node, subtracting the coordinates of the father node from the coordinates of this node;
- (7)
- Child vector—the direction of the child node, subtracting the coordinates of this node from the coordinates of a child node.
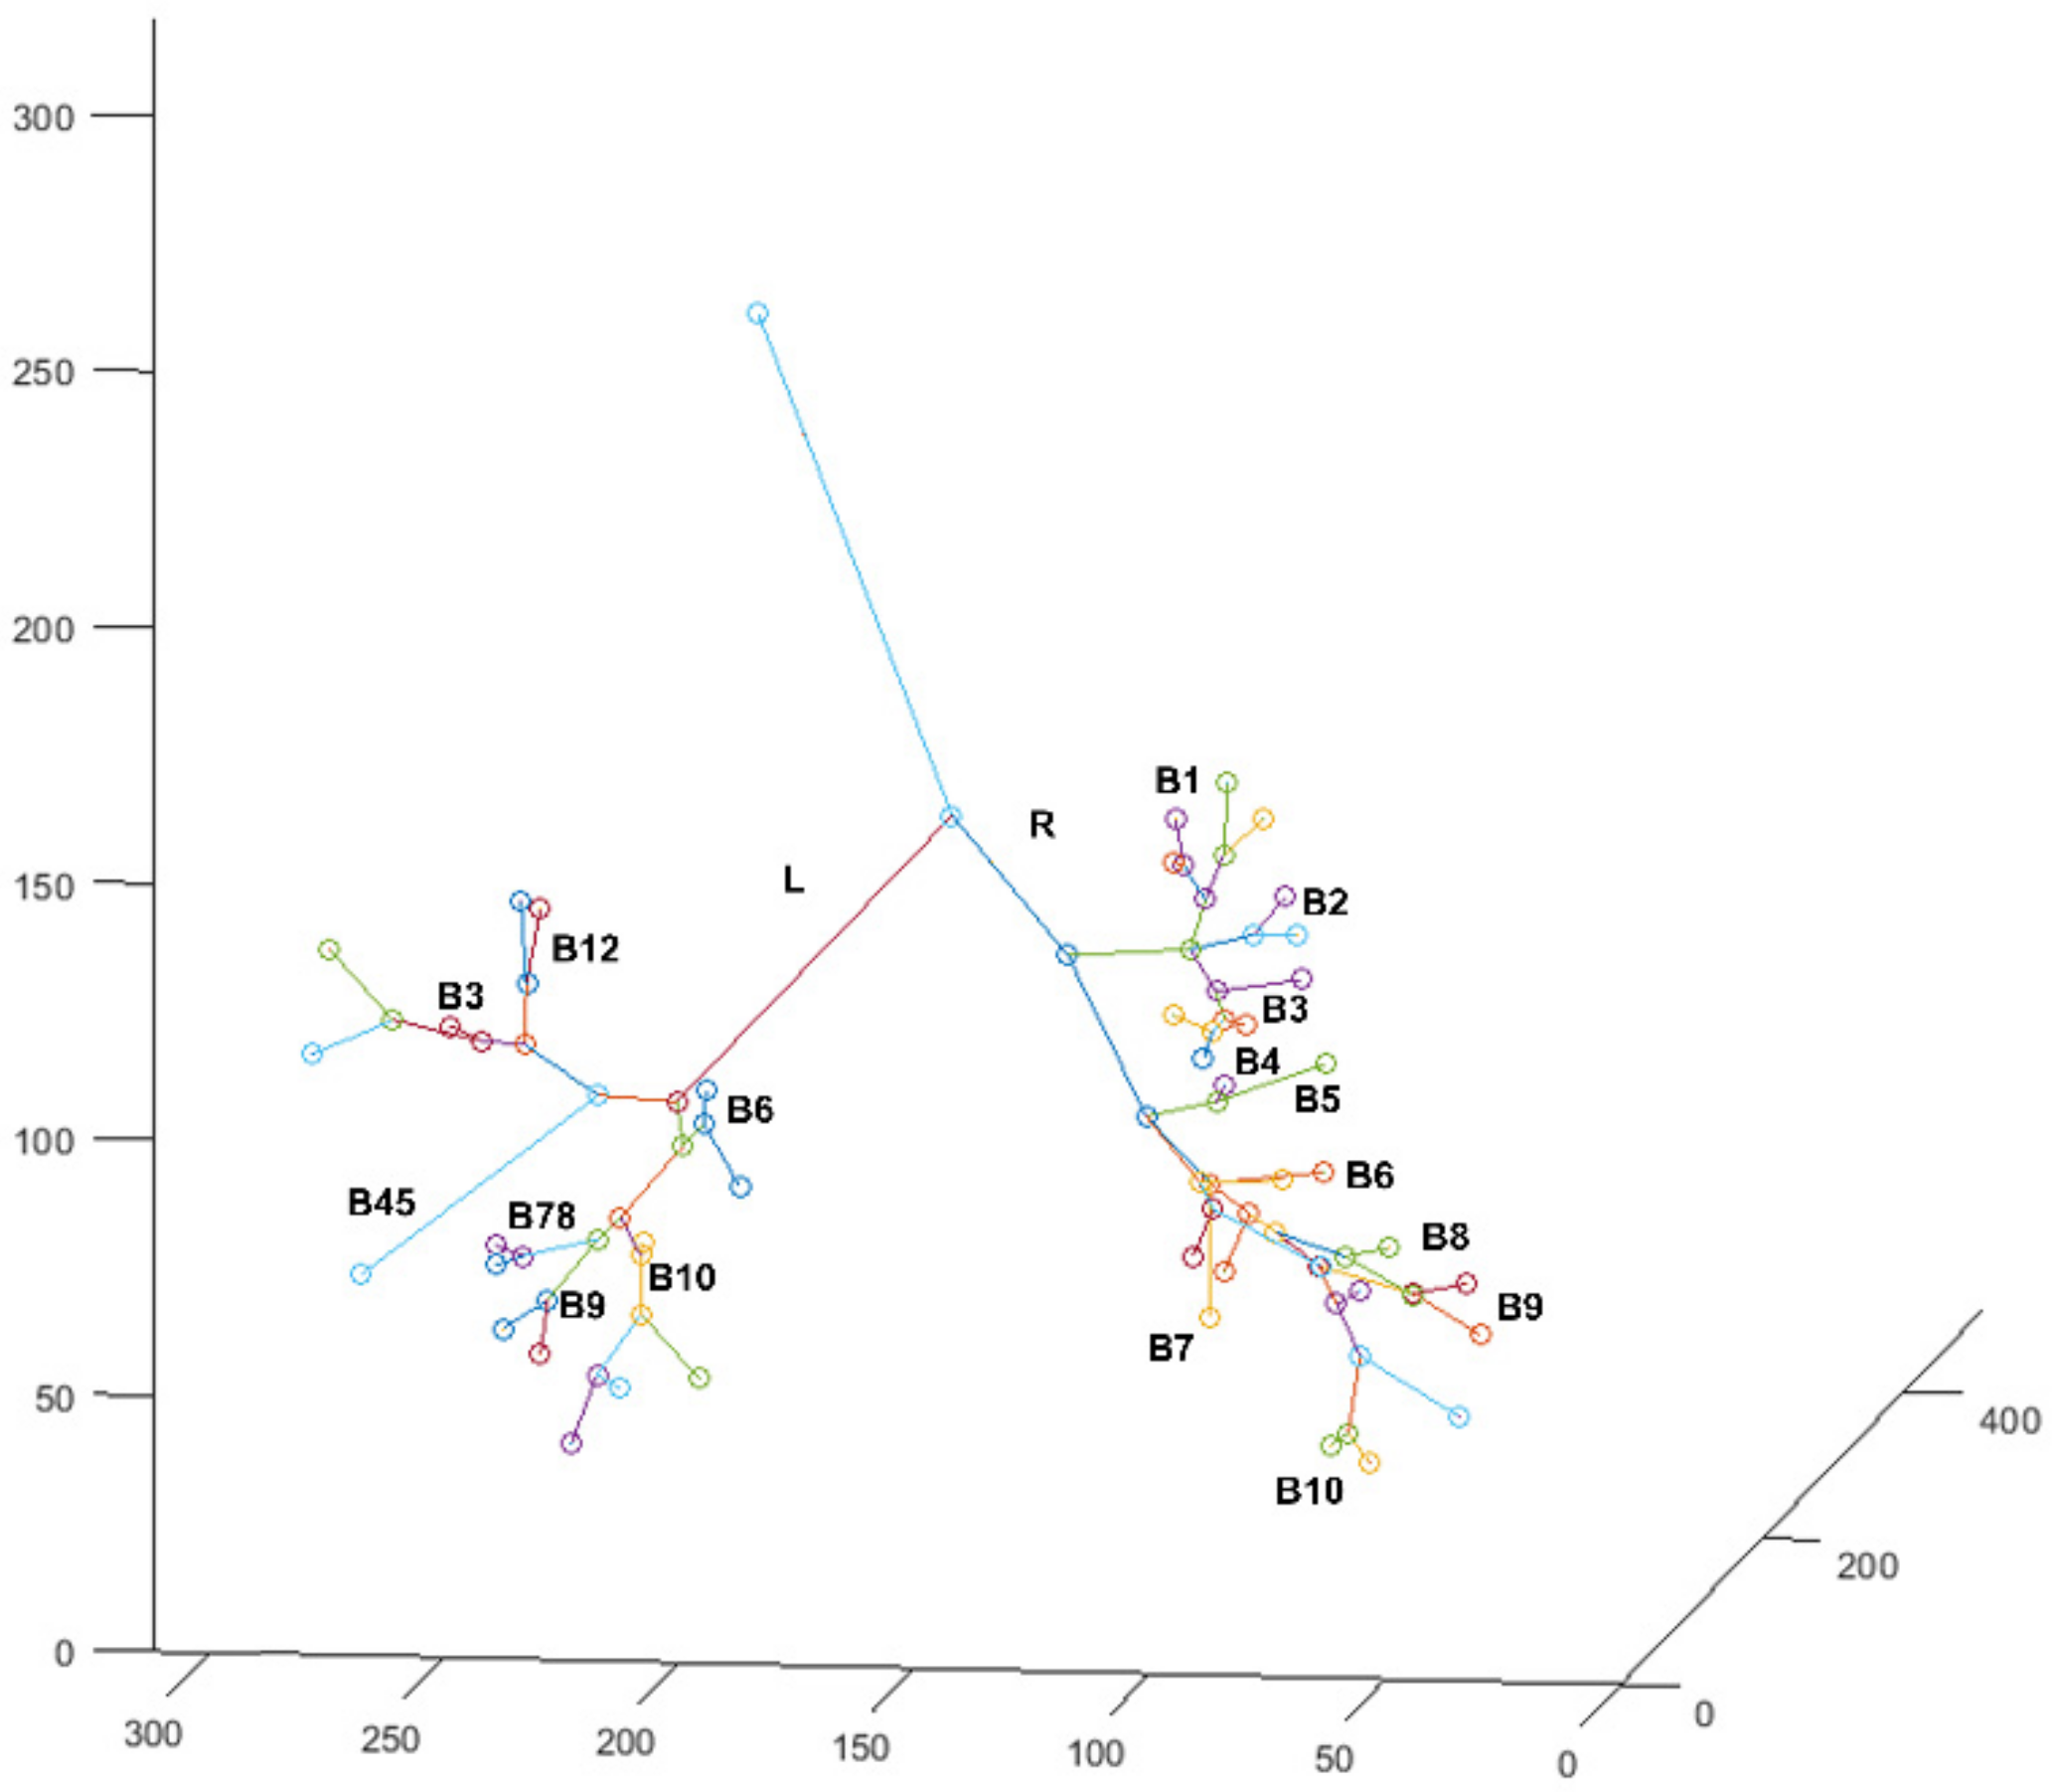
2.5. Bronchial Identification
- (1)
- Z-axis—main trachea (upper) direction i.e., negative child node direction of a tree root;
- (2)
- Y-axis—longitudinal direction, i.e., outer product of nodal coordinates of left airway minus nodal coordinates of the right airway to Z-axis;
- (3)
- X-axis—horizontal direction, i.e., the outer product of the Y-axis and Z-axis.
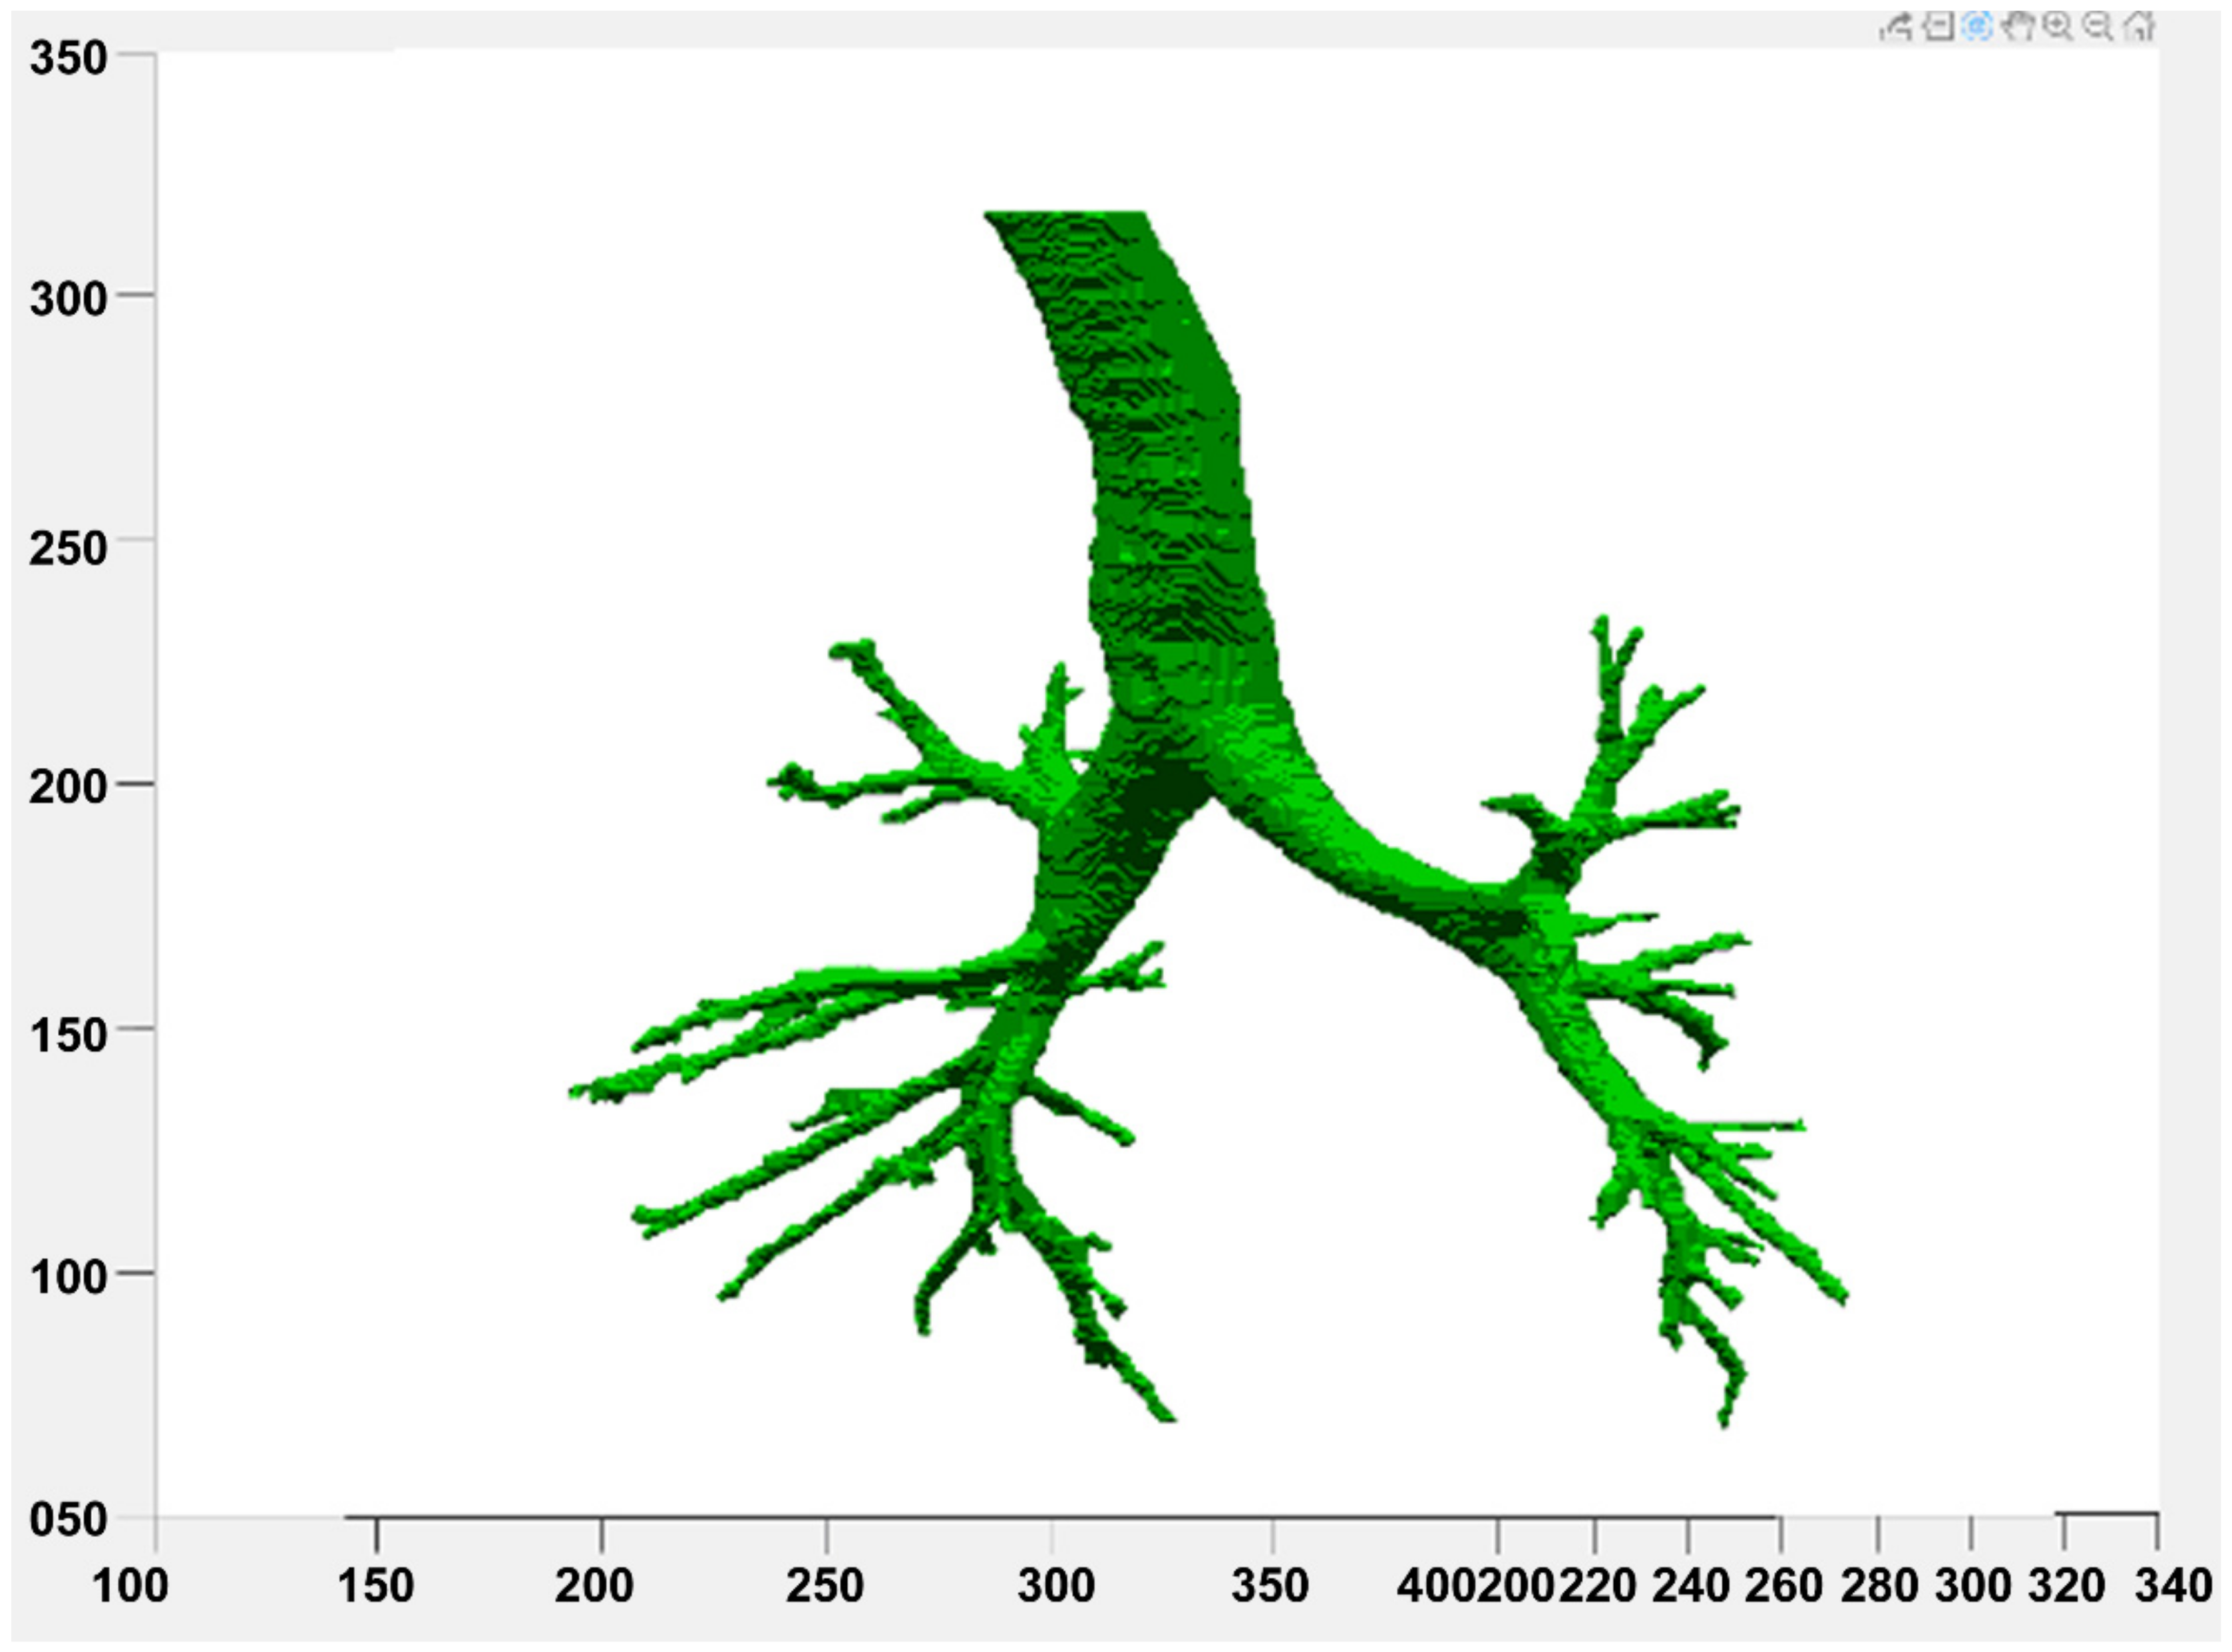
2.6. Result Display
3. Experimental Results
3.1. Image Preprocessing
3.2. Lung Circling
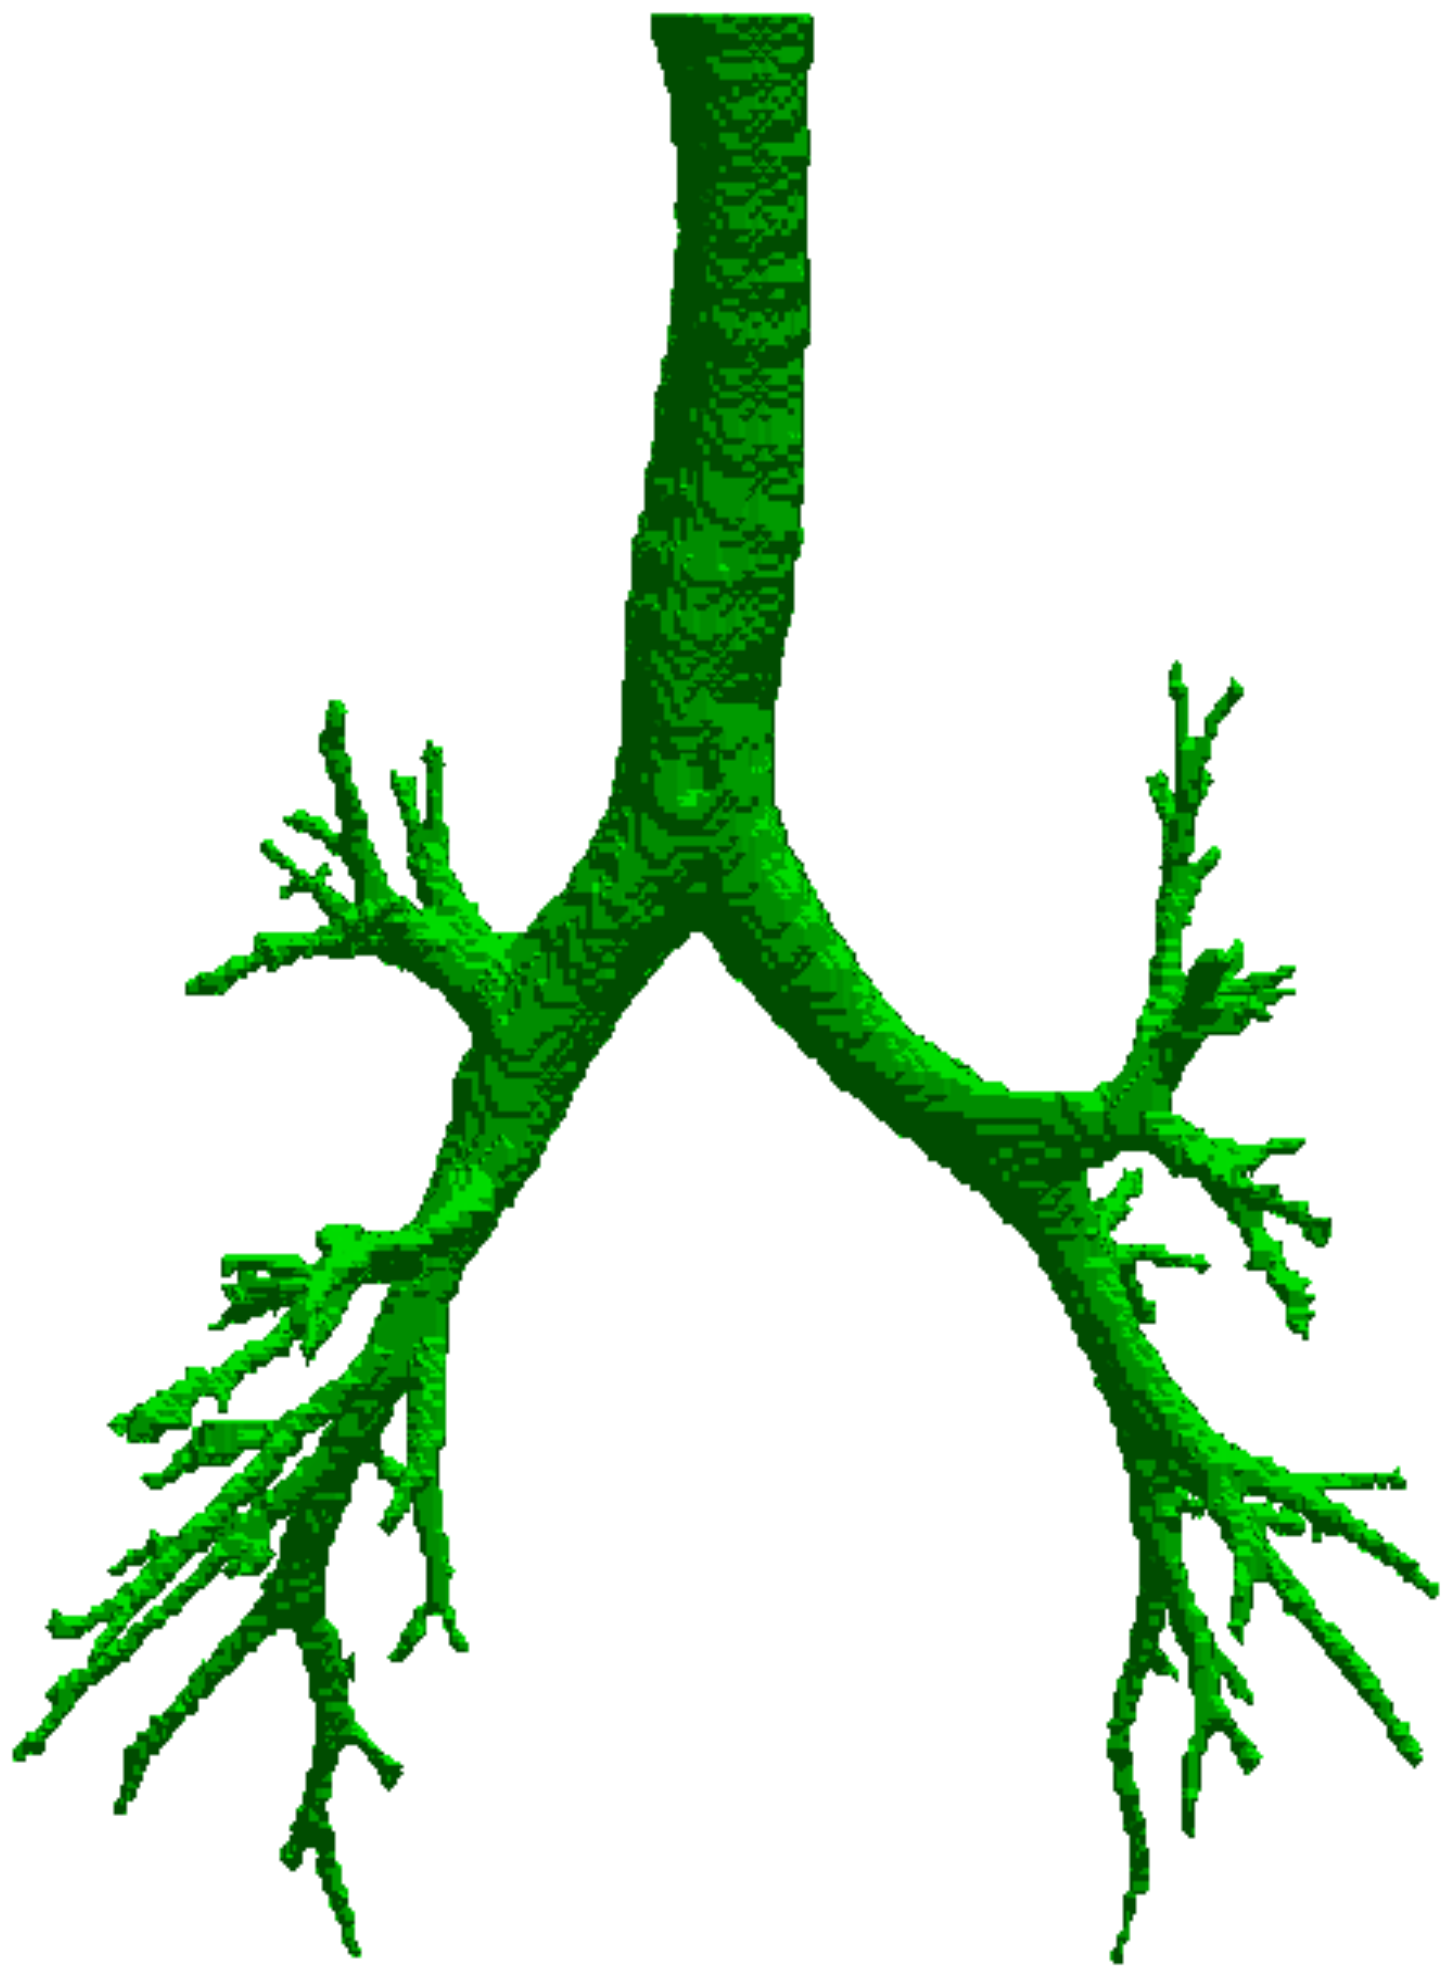
3.3. Pulmonary Airway Circling
3.4. Data Systematization
3.5. Bronchial Circling
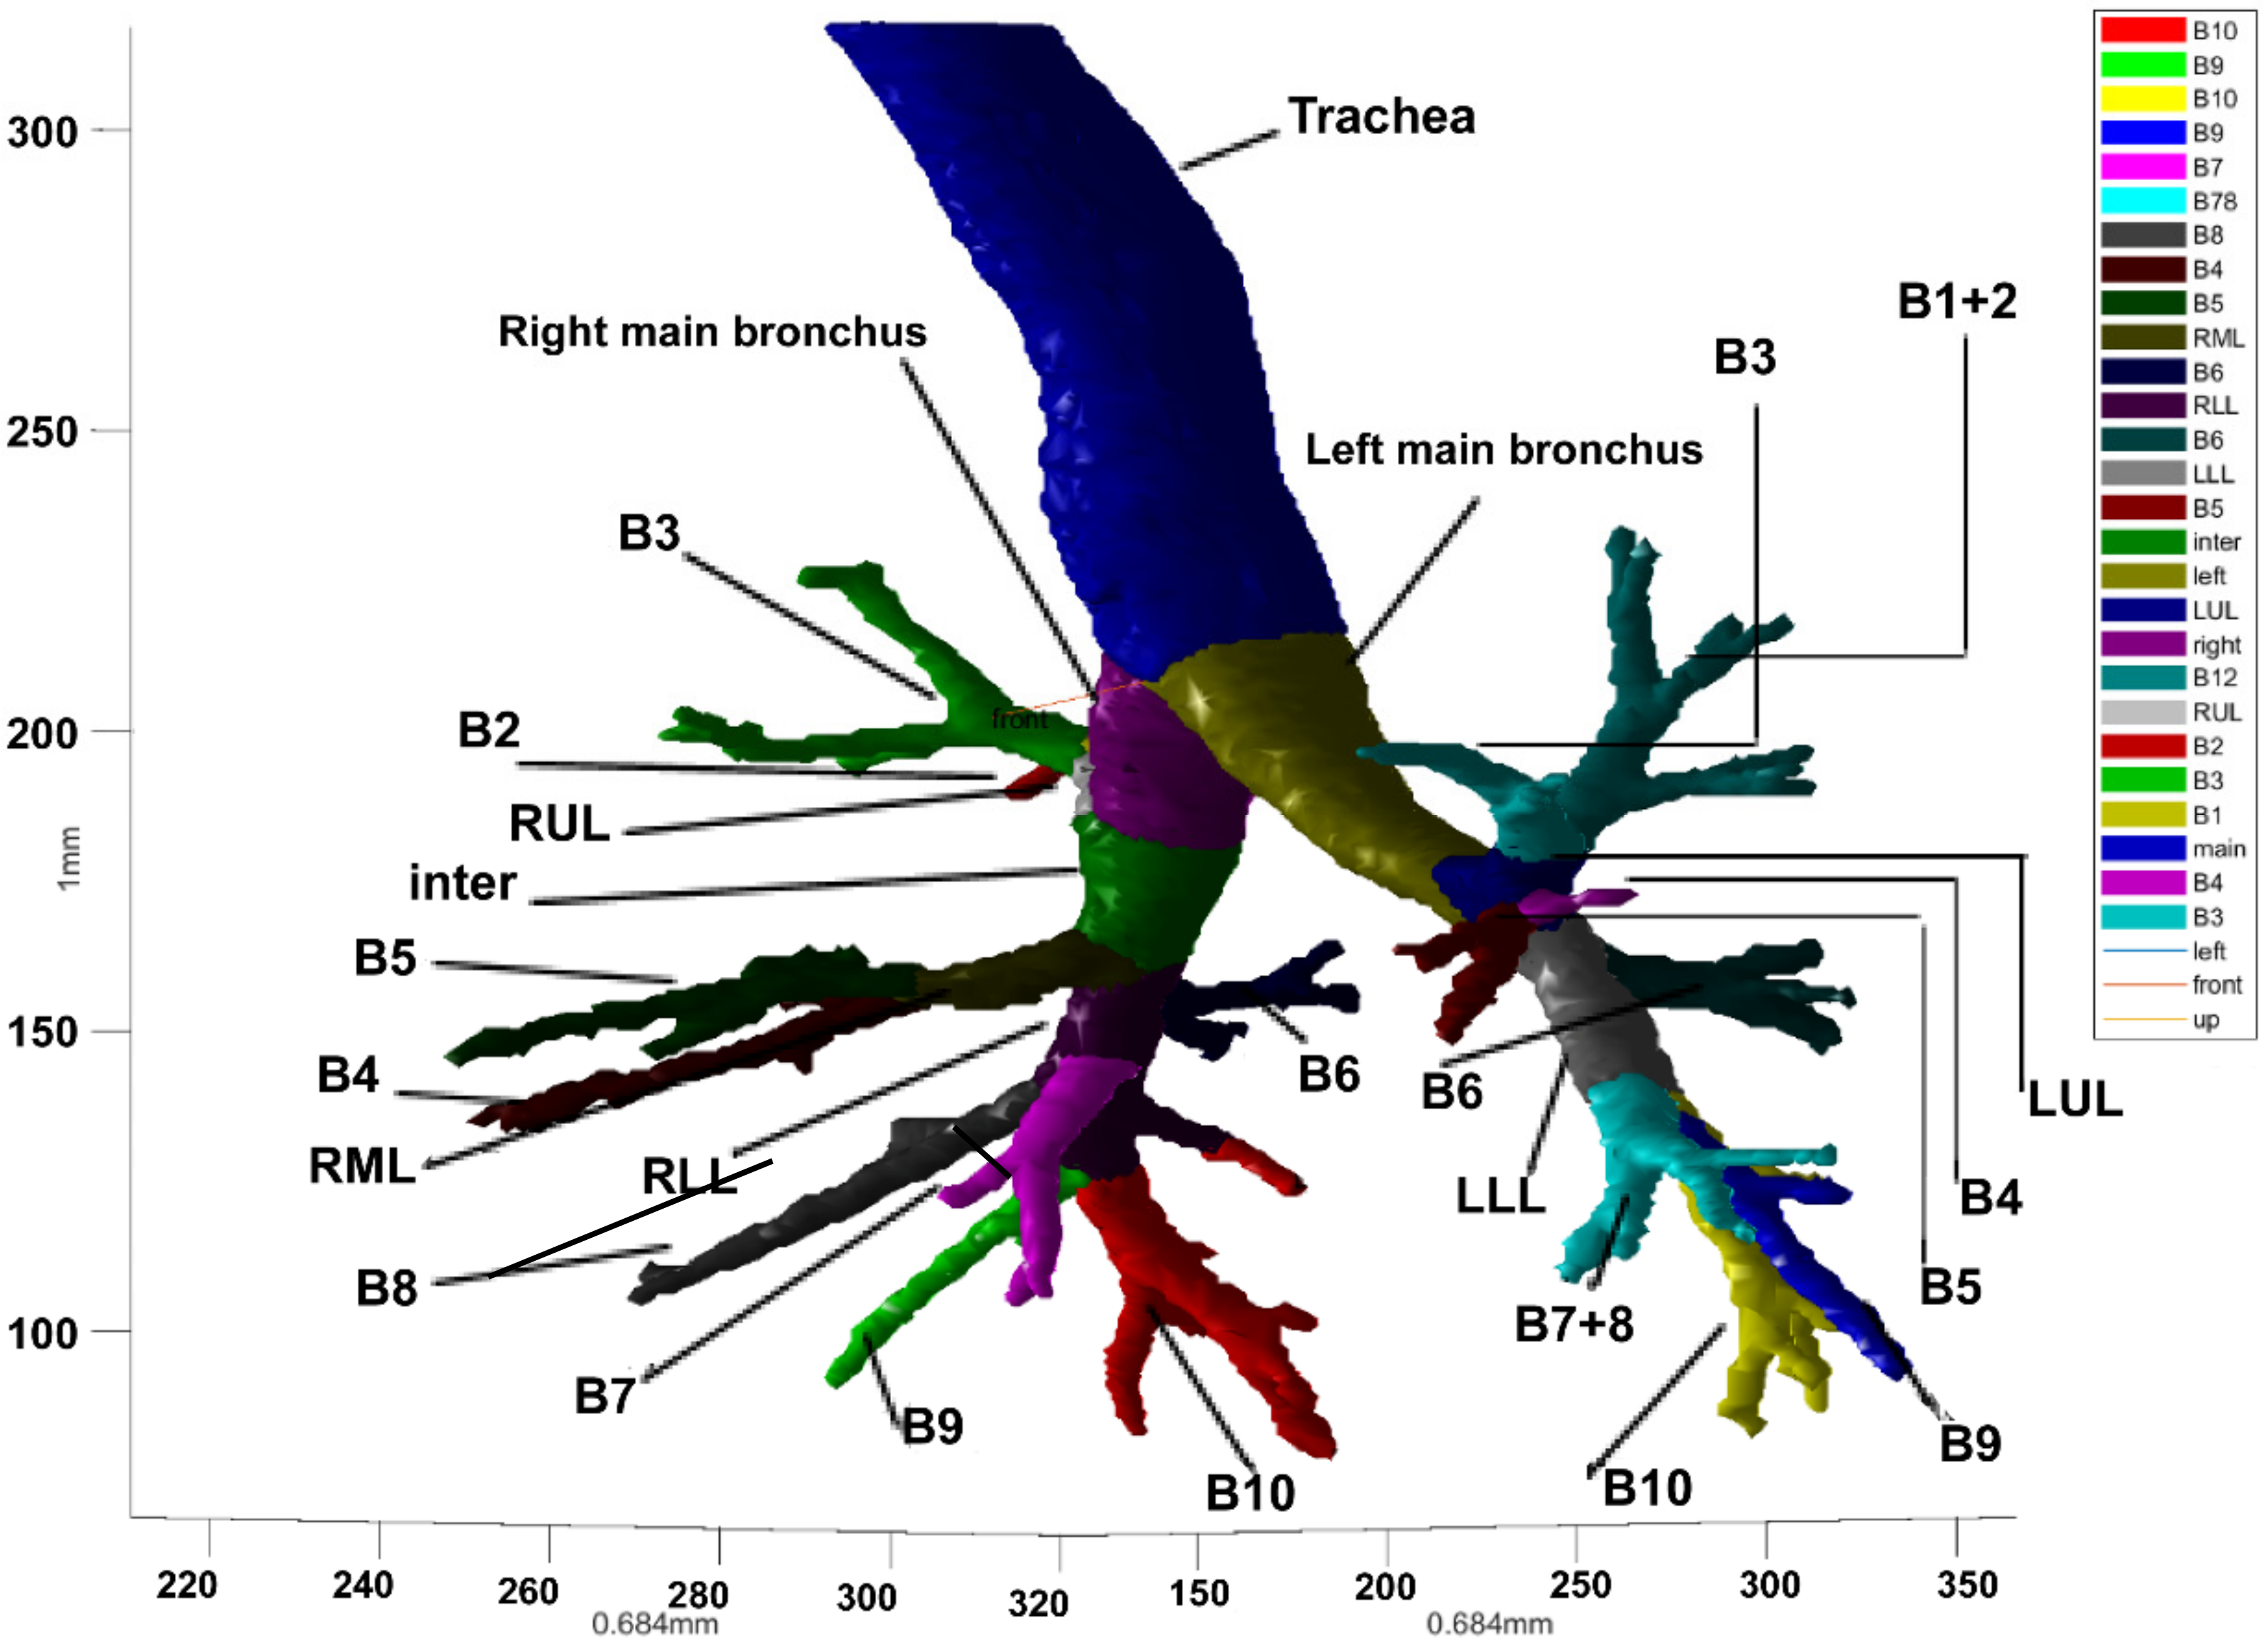
3.6. Result Display
3.7. Airway Circling Method
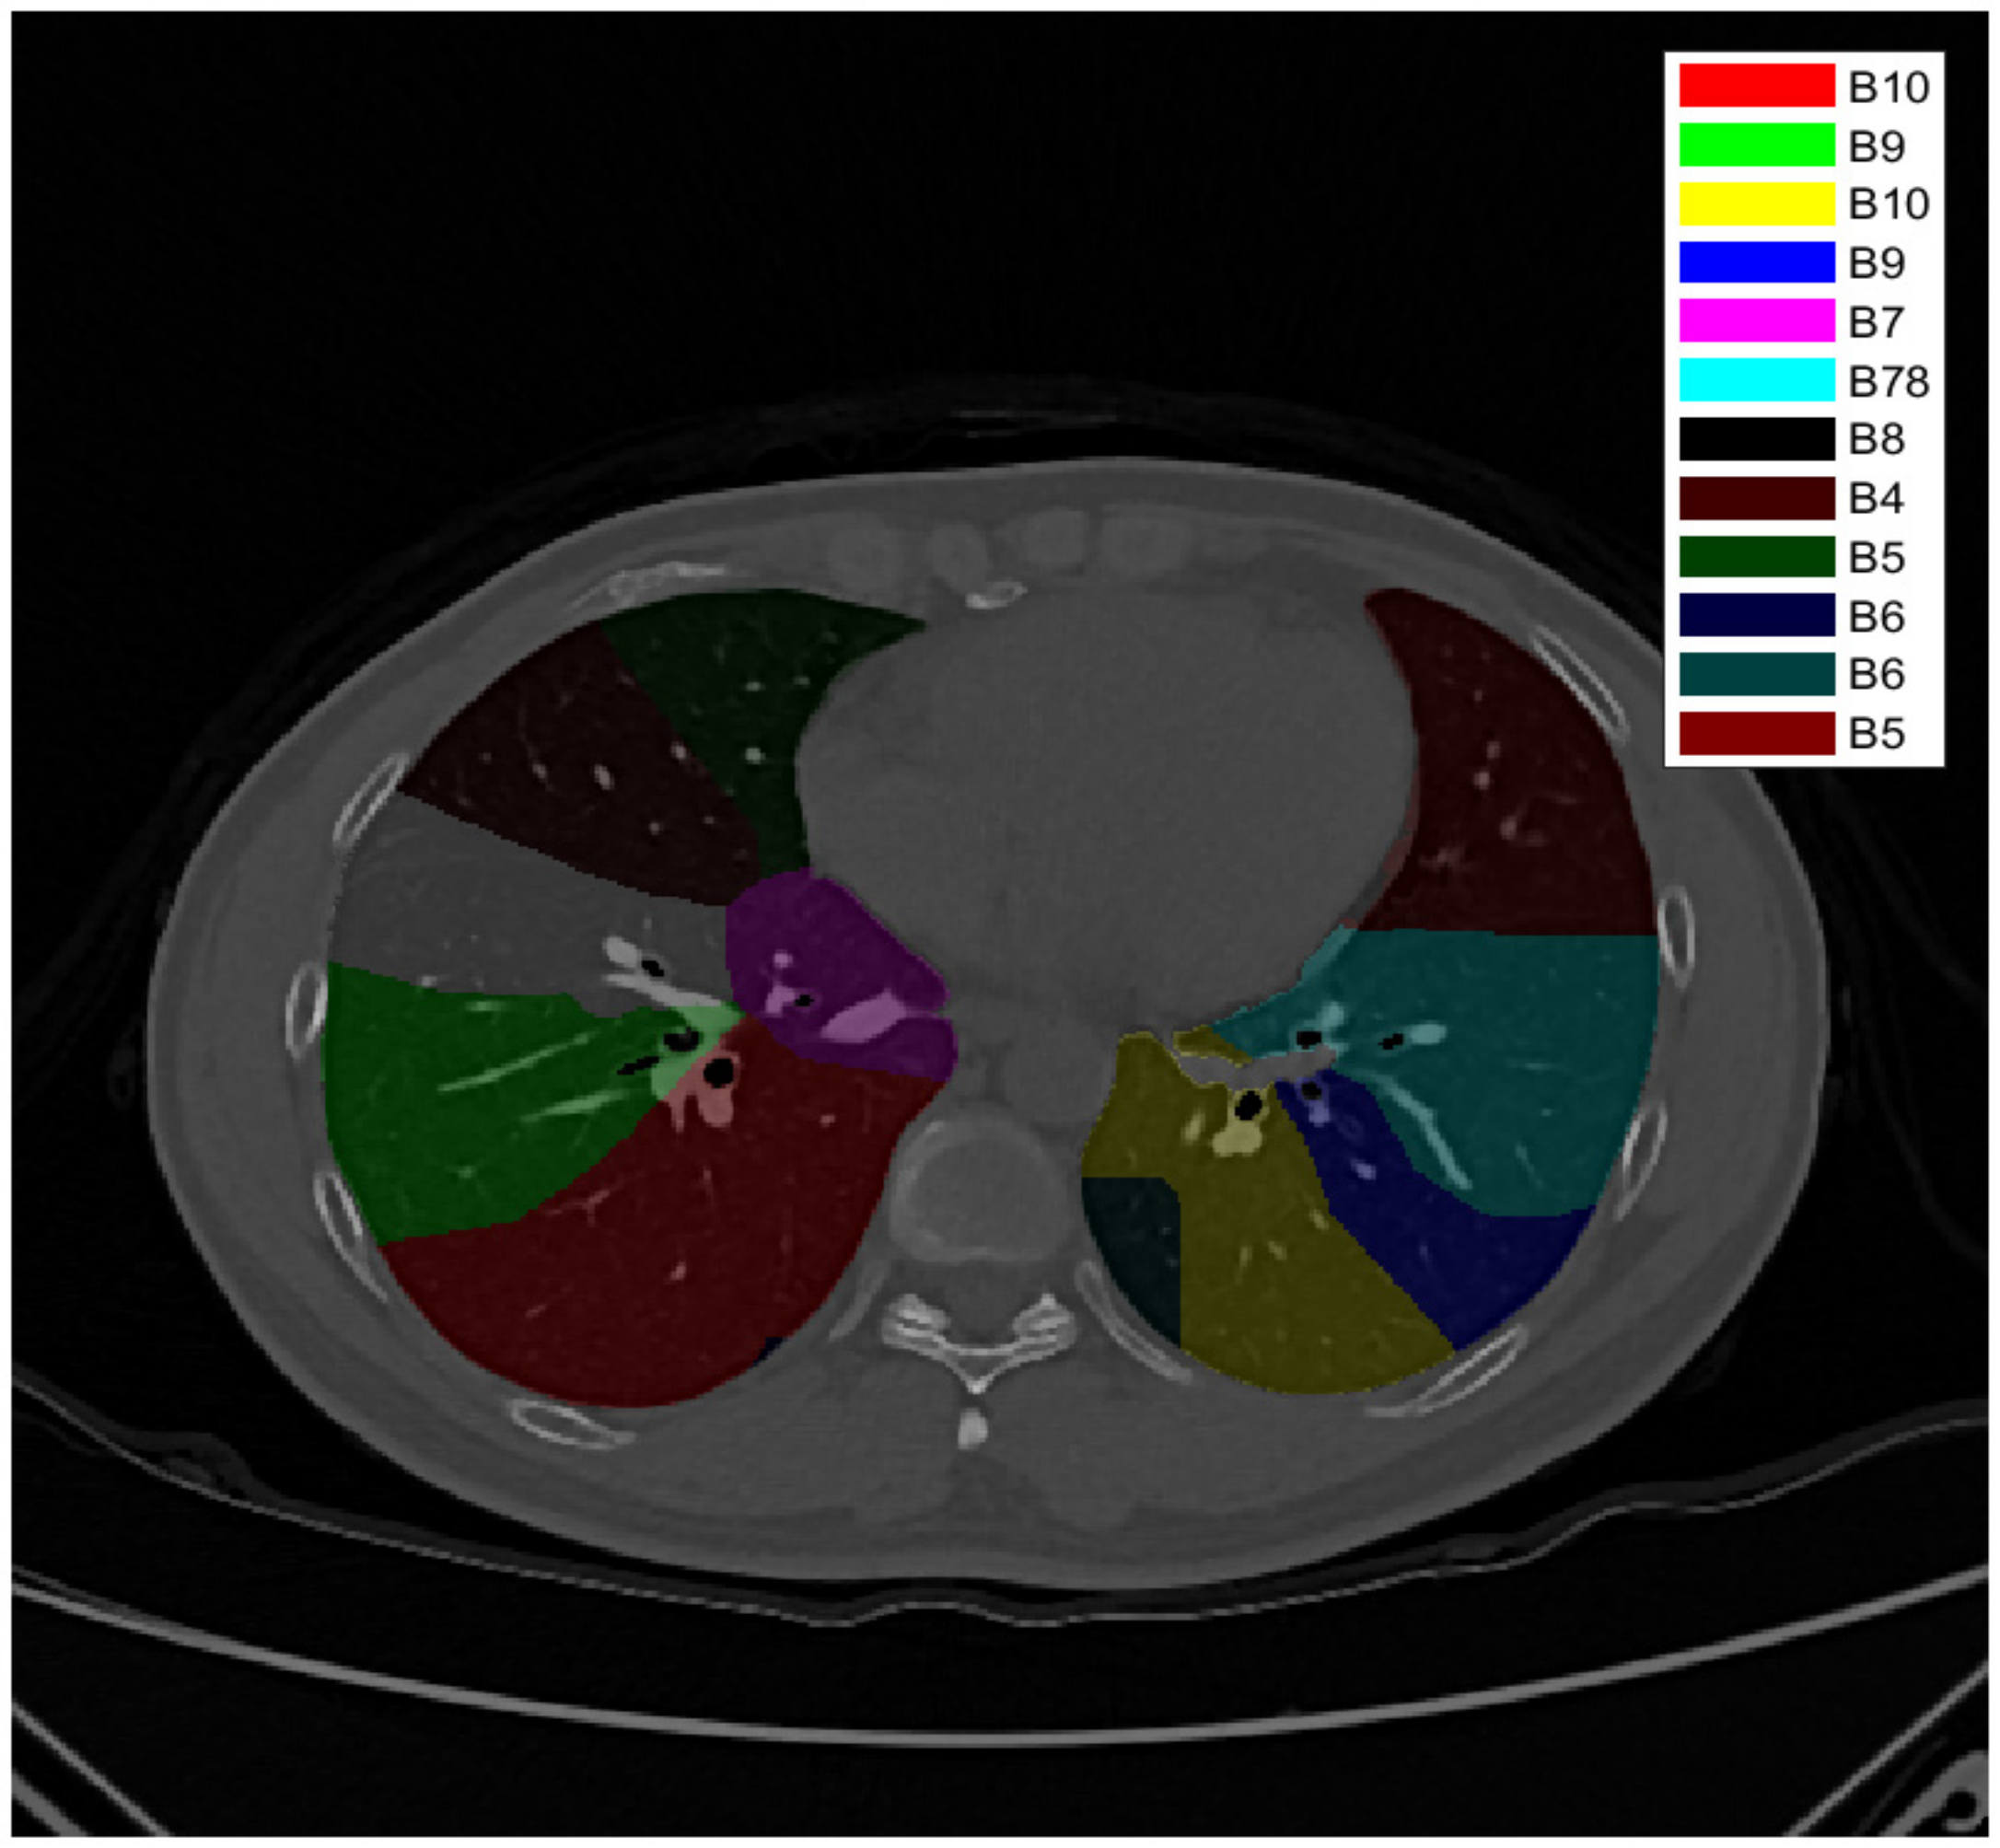
3.8. Bronchial Identification and Lung Segmentation
3.9. Airway Parameter Measurement and 3D Printing Verification
- (1)
- Length of the main trachea—length from the larynx to the bifurcation of the main trachea;
- (2)
- Length of the left main bronchus—length from the bifurcation of the main trachea to the leftmost lower bronchus;
- (3)
- Length of the right main bronchus—length from the bifurcation of the main trachea to the rightmost lower bronchus;
- (4)
- The cross-sectional area of the main bronchus junction—cross-sectional area of the main bronchus, taking its trend as a normal vector at the airway bifurcation;
- (5)
- The cross-sectional area of the left main bronchus junction—cross-sectional area of the left main bronchus, taking its trend as a normal vector at the airway bifurcation;
- (6)
- The cross-sectional area of the right main bronchus junction—cross-sectional area of the right main bronchus, taking its trend as a normal vector at the airway bifurcation;
- (7)
- The main bronchus’s cross-sectional area—cross-sectional area of the main bronchus, taking its trend as a normal vector (multi-section average);
- (8)
- The cross-sectional area of the left main bronchus—cross-sectional area of the left main bronchus, taking its trend as a normal vector (multi-section average);
- (9)
- The cross-sectional area of the right main bronchus—cross-sectional area of the right main bronchus, taking its trend as a normal vector (multi-section average);
- (10)
- Diameter of the main bronchus—long diameter and short diameter of the cross-sectional area of the main bronchus, taking its trend as a normal vector (multi-section average);
- (11)
- Diameter of the left main bronchus—long diameter and short diameter of the cross-sectional area of the left main bronchus, taking its trend as a normal vector (multi-section average);
- (12)
- Diameter of the right main bronchus—long diameter and short diameter of the cross-sectional area of the right main bronchus, taking its trend as a normal vector (multi-section average);
- (13)
- Perimeter of the main bronchus—perimeter of the cross-sectional area of main bronchus, taking its trend as a normal vector (multi-section average);
- (14)
- Perimeter of the left main bronchus—perimeter of the cross-sectional area of left main bronchus, taking its trend as a normal vector (multi-section average);
- (15)
- Perimeter of the right main bronchus—perimeter of the cross-sectional area of right main bronchus, taking its trend as a normal vector (multi-section average);
- (16)
- Angle of the left main bronchus—deviation angle of a left main bronchus from the main bronchus;
- (17)
- Angle of the right main bronchus—deviation angle of a right main bronchus from the main bronchus;
- (18)
- Volume of the main bronchus—spatial volume occupied by the main bronchus;
- (19)
- Volume of the left main bronchus—spatial volume occupied by the left main bronchus;
- (20)
- Volume of the right main bronchus—spatial volume occupied by the right main bronchus.
4. Discussion
5. Conclusions
Author Contributions
Funding
Institutional Review Board Statement
Informed Consent Statement
Data Availability Statement
Acknowledgments
Conflicts of Interest
References
- Bray, F.; Ferlay, J.; Soerjomataram, I.; Siegel, R.L.; Torre, L.A.; Jemal, A. Global cancer statistics 2018: GLOBOCAN estimates of incidence and mortality worldwide for 36 cancers in 185 countries. CA Cancer J. Clin. 2018, 68, 394–424. [Google Scholar] [CrossRef] [PubMed]
- Kumar, P.; Goldstraw, P.; Yamada, K.; Nicholson, A.G.; Wells, A.U.; Hansell, D.M.; Ladas, G. Pulmonary fibrosis and lung cancer: Risk and benefit analysis of pulmonary resection. J. Thorac. Cardiovasc. Surg. 2003, 125, 1321–1327. [Google Scholar] [CrossRef]
- McKenna, R.J., Jr.; Houck, W.V. New approaches to the minimally invasive treatment of lung cancer. Curr. Opin. Pulm. Med. 2005, 11, 282–286. [Google Scholar] [CrossRef] [PubMed]
- Wu, X.; Li, T.; Zhang, C.; Wu, G.; Xiong, R.; Xu, M.; Xie, M. Comparison of perioperative outcomes between precise and routine segmentectomy for patients with early-stage lung cancer presenting as ground-glass opacities: A propensity score-matched study. Front. Oncol. 2021, 11, 1400. [Google Scholar] [CrossRef] [PubMed]
- Sadeghi, A.H.; Maat, A.P.; Taverne, Y.J.; Cornelissen, R.; Dingemans, A.M.C.; Bogers, A.J.; Mahtab, E.A. Virtual reality and artificial intelligence for 3-dimensional planning of lung segmentectomies. JTCVS Tech. 2021, 7, 309–321. [Google Scholar] [CrossRef]
- Yao, F.; Wang, J.; Yao, J.; Hang, F.; Lei, X.; Cao, Y. Three-dimensional image reconstruction with free open-source OsiriX software in video-assisted thoracoscopic lobectomy and segmentectomy. Int. J. Surg. 2017, 39, 16–22. [Google Scholar] [CrossRef]
- van Rikxoort, E.M.; de Hoop, B.; Viergever, M.A.; Prokop, M.; van Ginneken, B. Automatic lung segmentation from thoracic computed tomography scans using a hybrid approach with error detection. J. Med. Phys. 2009, 36, 2934–2947. [Google Scholar] [CrossRef]
- De Nunzio, G.; Tommasi, E.; Agrusti, A.; Cataldo, R.; De Mitri, I.; Favetta, M.; Oliva, P. Automatic lung segmentation in CT images with accurate handling of the hilar region. J. Digit. Imaging 2011, 24, 11–27. [Google Scholar] [CrossRef]
- Diciotti, S.; Picozzi, G.; Falchini, M.; Mascalchi, M.; Villari, N.; Valli, G. 3-D segmentation algorithm of small lung nodules in spiral CT images. IEEE Trans. Inf. Technol. Biomed. 2008, 12, 7–19. [Google Scholar] [CrossRef]
- Pu, J.; Paik, D.S.; Meng, X.; Roos, J.; Rubin, G.D. Shape “break-and-repair” strategy and its application to automated medical image segmentation. IEEE Trans. Vis. Comput. Graph. 2010, 17.1, 115–124. [Google Scholar]
- Prabukumar, M.; Agilandeeswari, L.; Ganesan, K. An intelligent lung cancer diagnosis system using cuckoo search optimization and support vector machine classifier. J. Ambient Intell. Humaniz. Comput. 2019, 10, 267–293. [Google Scholar] [CrossRef]
- Xu, M.; Qi, S.; Yue, Y.; Teng, Y.; Xu, L.; Yao, Y.; Qian, W. Segmentation of lung parenchyma in CT images using CNN trained with the clustering algorithm generated dataset. Biomed. Eng. Online 2019, 18, 1–21. [Google Scholar] [CrossRef] [PubMed]
- Helen, R.; Kamaraj, N.; Selvi, K.; Raman, V.R. Segmentation of pulmonary parenchyma in CT lung images based on 2D Otsu optimized by PSO. In Proceedings of the 2011 International Conference on Emerging Trends in Electrical and Computer Technology, Nagercoil, India, 23–24 March 2011; pp. 536–541. [Google Scholar]
- Otsu, N. A threshold selection method from gray-level histograms. IEEE Trans. Syst. Man Cybern. Syst. 1979, 9, 62–66. [Google Scholar] [CrossRef]
- Ahmad, M.; Qadri, S.F.; Ashraf, M.U.; Subhi, K.; Khan, S.; Zareen, S.S.; Qadri, S. Efficient Liver Segmentation from Computed Tomography Images Using Deep Learning. Comput. Intell. Neurosci. 2022, 2022, 2665283. [Google Scholar] [CrossRef] [PubMed]
- Qadri, S.F.; Shen, L.; Ahmad, M.; Qadri, S.; Zareen, S.S.; Akbar, M.A. SVseg: Stacked sparse autoencoder-based patch classification modeling for vertebrae segmentation. Mathematics 2022, 10, 796. [Google Scholar] [CrossRef]
- Tschirren, J.; Hoffman, E.A.; McLennan, G.; Sonka, M. Segmentation and quantitative analysis of intrathoracic airway trees from computed tomography images. Proc. Am. Thorac. Soc. 2005, 2, 484–487. [Google Scholar] [CrossRef] [PubMed]
- Bauer, C.; Eberlein, M.; Beichel, R.R. Graph-based airway tree reconstruction from chest CT scans: Evaluation of different features on five cohorts. IEEE Trans. Med. Imaging 2014, 34, 1063–1076. [Google Scholar] [CrossRef]
- Selvan, R.; Kipf, T.; Welling, M.; Juarez, A.G.U.; Pedersen, J.H.; Petersen, J.; de Bruijne, M. Graph refinement based airway extraction using mean-field networks and graph neural networks. Med. Image Anal. 2020, 64, 101751. [Google Scholar] [CrossRef]
- Xu, Z.; Bagci, U.; Foster, B.; Mansoor, A.; Udupa, J.K.; Mollura, D.J. A hybrid method for airway segmentation and automated measurement of bronchial wall thickness on CT. Med. Image Anal. 2015, 24, 1–17. [Google Scholar] [CrossRef]
- Fetita, C.; Ortner, M.; Brillet, P.Y.; Prêteux, F.; Grenier, P. A morphological-aggregative approach for 3D segmentation of pulmonary airways from generic MSCT acquisitions. In Proceedings of the Second International Workshop on Pulmonary Image Analysis, London, UK, 20 September 2009; pp. 215–226. [Google Scholar]
- Charbonnier, J.P.; Van Rikxoort, E.M.; Setio, A.A.; Schaefer-Prokop, C.M.; van Ginneken, B.; Ciompi, F. Improving airway segmentation in computed tomography using leak detection with convolutional networks. Med. Image Anal. 2017, 36, 52–60. [Google Scholar] [CrossRef] [PubMed]
- Rosell, J.; Cabras, P. A three-stage method for the 3D reconstruction of the tracheobronchial tree from CT scans. Comput. Med. Imaging Graph. 2013, 37, 430–437. [Google Scholar] [CrossRef] [PubMed]
- Fabijańska, A. Two-pass region growing algorithm for segmenting airway tree from MDCT chest scans. Comput. Med. Imaging Graph. 2009, 33, 537–546. [Google Scholar] [CrossRef] [PubMed]
- Aykac, D.; Hoffman, E.A.; McLennan, G.; Reinhardt, J.M. Segmentation and analysis of the human airway tree from three-dimensional X-ray CT images. IEEE Trans. Med. Imaging 2003, 22, 940–950. [Google Scholar] [CrossRef]
- Mori, K.; Hasegawa, J.I.; Suenaga, Y.; Toriwaki, J.I. Automated anatomical labeling of the bronchial branch and its application to the virtual bronchoscopy system. IEEE Trans. Med. Imaging 2000, 19, 103–114. [Google Scholar] [CrossRef]
- Zhou, X.; Hayashi, T.; Hara, T.; Fujita, H.; Yokoyama, R.; Kiryu, T.; Hoshi, H. Automatic segmentation and recognition of anatomical lung structures from high-resolution chest CT images. Comput. Med. Imaging Graph. 2006, 30, 299–313. [Google Scholar] [CrossRef]
- Lassen, B.; van Rikxoort, E.M.; Schmidt, M.; Kerkstra, S.; van Ginneken, B.; Kuhnigk, J.M. Automatic segmentation of the pulmonary lobes from chest CT scans based on fissures, vessels, and bronchi. IEEE Trans. Med. Imaging 2012, 32, 210–222. [Google Scholar] [CrossRef]
- Tschirren, J.; McLennan, G.; Palágyi, K.; Hoffman, E.A.; Sonka, M. Matching and anatomical labeling of human airway tree. IEEE Trans. Med. Imaging 2005, 24, 1540–1547. [Google Scholar] [CrossRef]
- Feragen, A.; Petersen, J.; Owen, M.; Lo, P.; Thomsen, L.H.; Wille, M.M.W.; de Bruijne, M. Geodesic atlas-based labeling of anatomical trees: Application and evaluation on airways extracted from CT. IEEE Trans. Med. Imaging 2014, 34, 1212–1226. [Google Scholar] [CrossRef]
- Nadeem, S.A.; Hoffman, E.A.; Comellas, A.P.; Saha, P.K. Anatomical labeling of human airway branches using a novel two-step machine learning and hierarchical features. In Medical Imaging 2020: Image Processing; SPIE: Bellingham, WA, USA, 2020; Volume 11313, p. 1131312. [Google Scholar]
- Dogra, A.; Bhalla, P. Image sharpening by gaussian and butterworth high pass filter. Biomed. Pharmacol. J. 2014, 7, 707–713. [Google Scholar] [CrossRef]
- Hamerly, G.; Elkan, C. Learning the k in k-means. Adv. Neural Inf. Process. Syst. 2004, 16, 281–288. [Google Scholar]
- Adams, R.; Bischof, L. Seeded region growing. IEEE Trans. Pattern Anal. Mach. Intell. 1994, 16, 641–647. [Google Scholar] [CrossRef]
- Lorensen, W.E.; Cline, H.E. Marching cubes: A high resolution 3D surface construction algorithm. ACM Trans. Graph. 1987, 21, 163–169. [Google Scholar]
- Nousias, S.; Zacharaki, E.I.; Moustakas, K. AVATREE: An open-source computational modelling framework modelling anatomically valid airway TREE conformations. PLoS ONE 2020, 15, e0230259. [Google Scholar] [CrossRef] [Green Version]
- Bian, Z.; Charbonnier, J.P.; Liu, J.; Zhao, D.; Lynch, D.A.; van Ginneken, B. Small airway segmentation in thoracic computed tomography scans: A machine learning approach. Phys. Med. Biol. 2018, 63, 155024. [Google Scholar] [CrossRef]
- Cheng, G.; Wu, X.; Xiang, W.; Guo, C.; Ji, H.; He, L. Segmentation of the airway tree from chest CT using tiny atrous convolutional network. IEEE Access 2021, 9, 33583–33594. [Google Scholar] [CrossRef]
- Lee, M.; Lee, J.G.; Kim, N.; Seo, J.B.; Lee, S.M. Hybrid airway segmentation using multi-scale tubular structure filters and texture analysis on 3D chest CT scans. J. Digit. Imaging 2019, 32, 779–792. [Google Scholar] [CrossRef]
- Qin, Y.; Zheng, H.; Gu, Y.; Huang, X.; Yang, J.; Wang, L.; Zhu, Y.M. Learning bronchiole-sensitive airway segmentation CNNs by feature recalibration and attention distillation. In Proceedings of the International Conference on Medical Image Computing and Computer-Assisted Intervention, Strasbourg, France, 27 September–1 October 2020; pp. 221–231. [Google Scholar]
- Meng, Q.; Kitasaka, T.; Nimura, Y.; Oda, M.; Ueno, J.; Mori, K. Automatic segmentation of airway tree based on local intensity filter and machine learning technique in 3D chest CT volume. Int. J. Comput. Assist. Radiol. Surg. 2017, 12, 245–261. [Google Scholar] [CrossRef]
- Nardelli, P.; Khan, K.A.; Corvò, A.; Moore, N.; Murphy, M.J.; Twomey, M.; Cantillon-Murphy, P. Optimizing parameters of an open-source airway segmentation algorithm using different CT images. Biomed. Eng. Online 2015, 14, 62. [Google Scholar] [CrossRef]
- Gil, D.; Sanchez, C.; Borras, A.; Diez-Ferrer, M.; Rosell, A. Segmentation of distal airways using structural analysis. PLoS ONE 2019, 14, e0226006. [Google Scholar] [CrossRef]
- Chunder, R.; Nandi, S.; Guha, R.; Satyanarayana, N. A morphometric study of human trachea and principal bronchi in different age groups in both sexes and its clinical implications. Nepal Med. Coll. J. 2010, 12, 207–214. [Google Scholar]


| File | Order of Bronchial Tree Division by Our Method | |||||||||||
|---|---|---|---|---|---|---|---|---|---|---|---|---|
| 1st | 2nd | 3rd | 4th | 5th | 6th | 7th | 8th | 9th | 10th | 11th | All | |
| file1 | 1 | 2 | 4 | 9 | 18 | 14 | 12 | 6 | 6 | 2 | 0 | 74 |
| file2 | 1 | 2 | 4 | 8 | 17 | 21 | 6 | 7 | 5 | 2 | 2 | 75 |
| file3 | 1 | 2 | 4 | 9 | 21 | 25 | 27 | 19 | 15 | 4 | 2 | 129 |
| file4 | 1 | 2 | 4 | 8 | 18 | 11 | 10 | 4 | 5 | 2 | 2 | 67 |
| file5 | 1 | 2 | 4 | 8 | 16 | 28 | 13 | 7 | 6 | 2 | 0 | 87 |
| file6 | 1 | 2 | 4 | 9 | 20 | 24 | 26 | 14 | 6 | 1 | 0 | 107 |
| file7 | 1 | 2 | 4 | 9 | 17 | 16 | 4 | 4 | 2 | 1 | 0 | 60 |
| file8 | 1 | 2 | 4 | 9 | 18 | 22 | 6 | 2 | 1 | 0 | 0 | 65 |
| file9 | 1 | 2 | 4 | 8 | 18 | 26 | 16 | 5 | 4 | 2 | 0 | 86 |
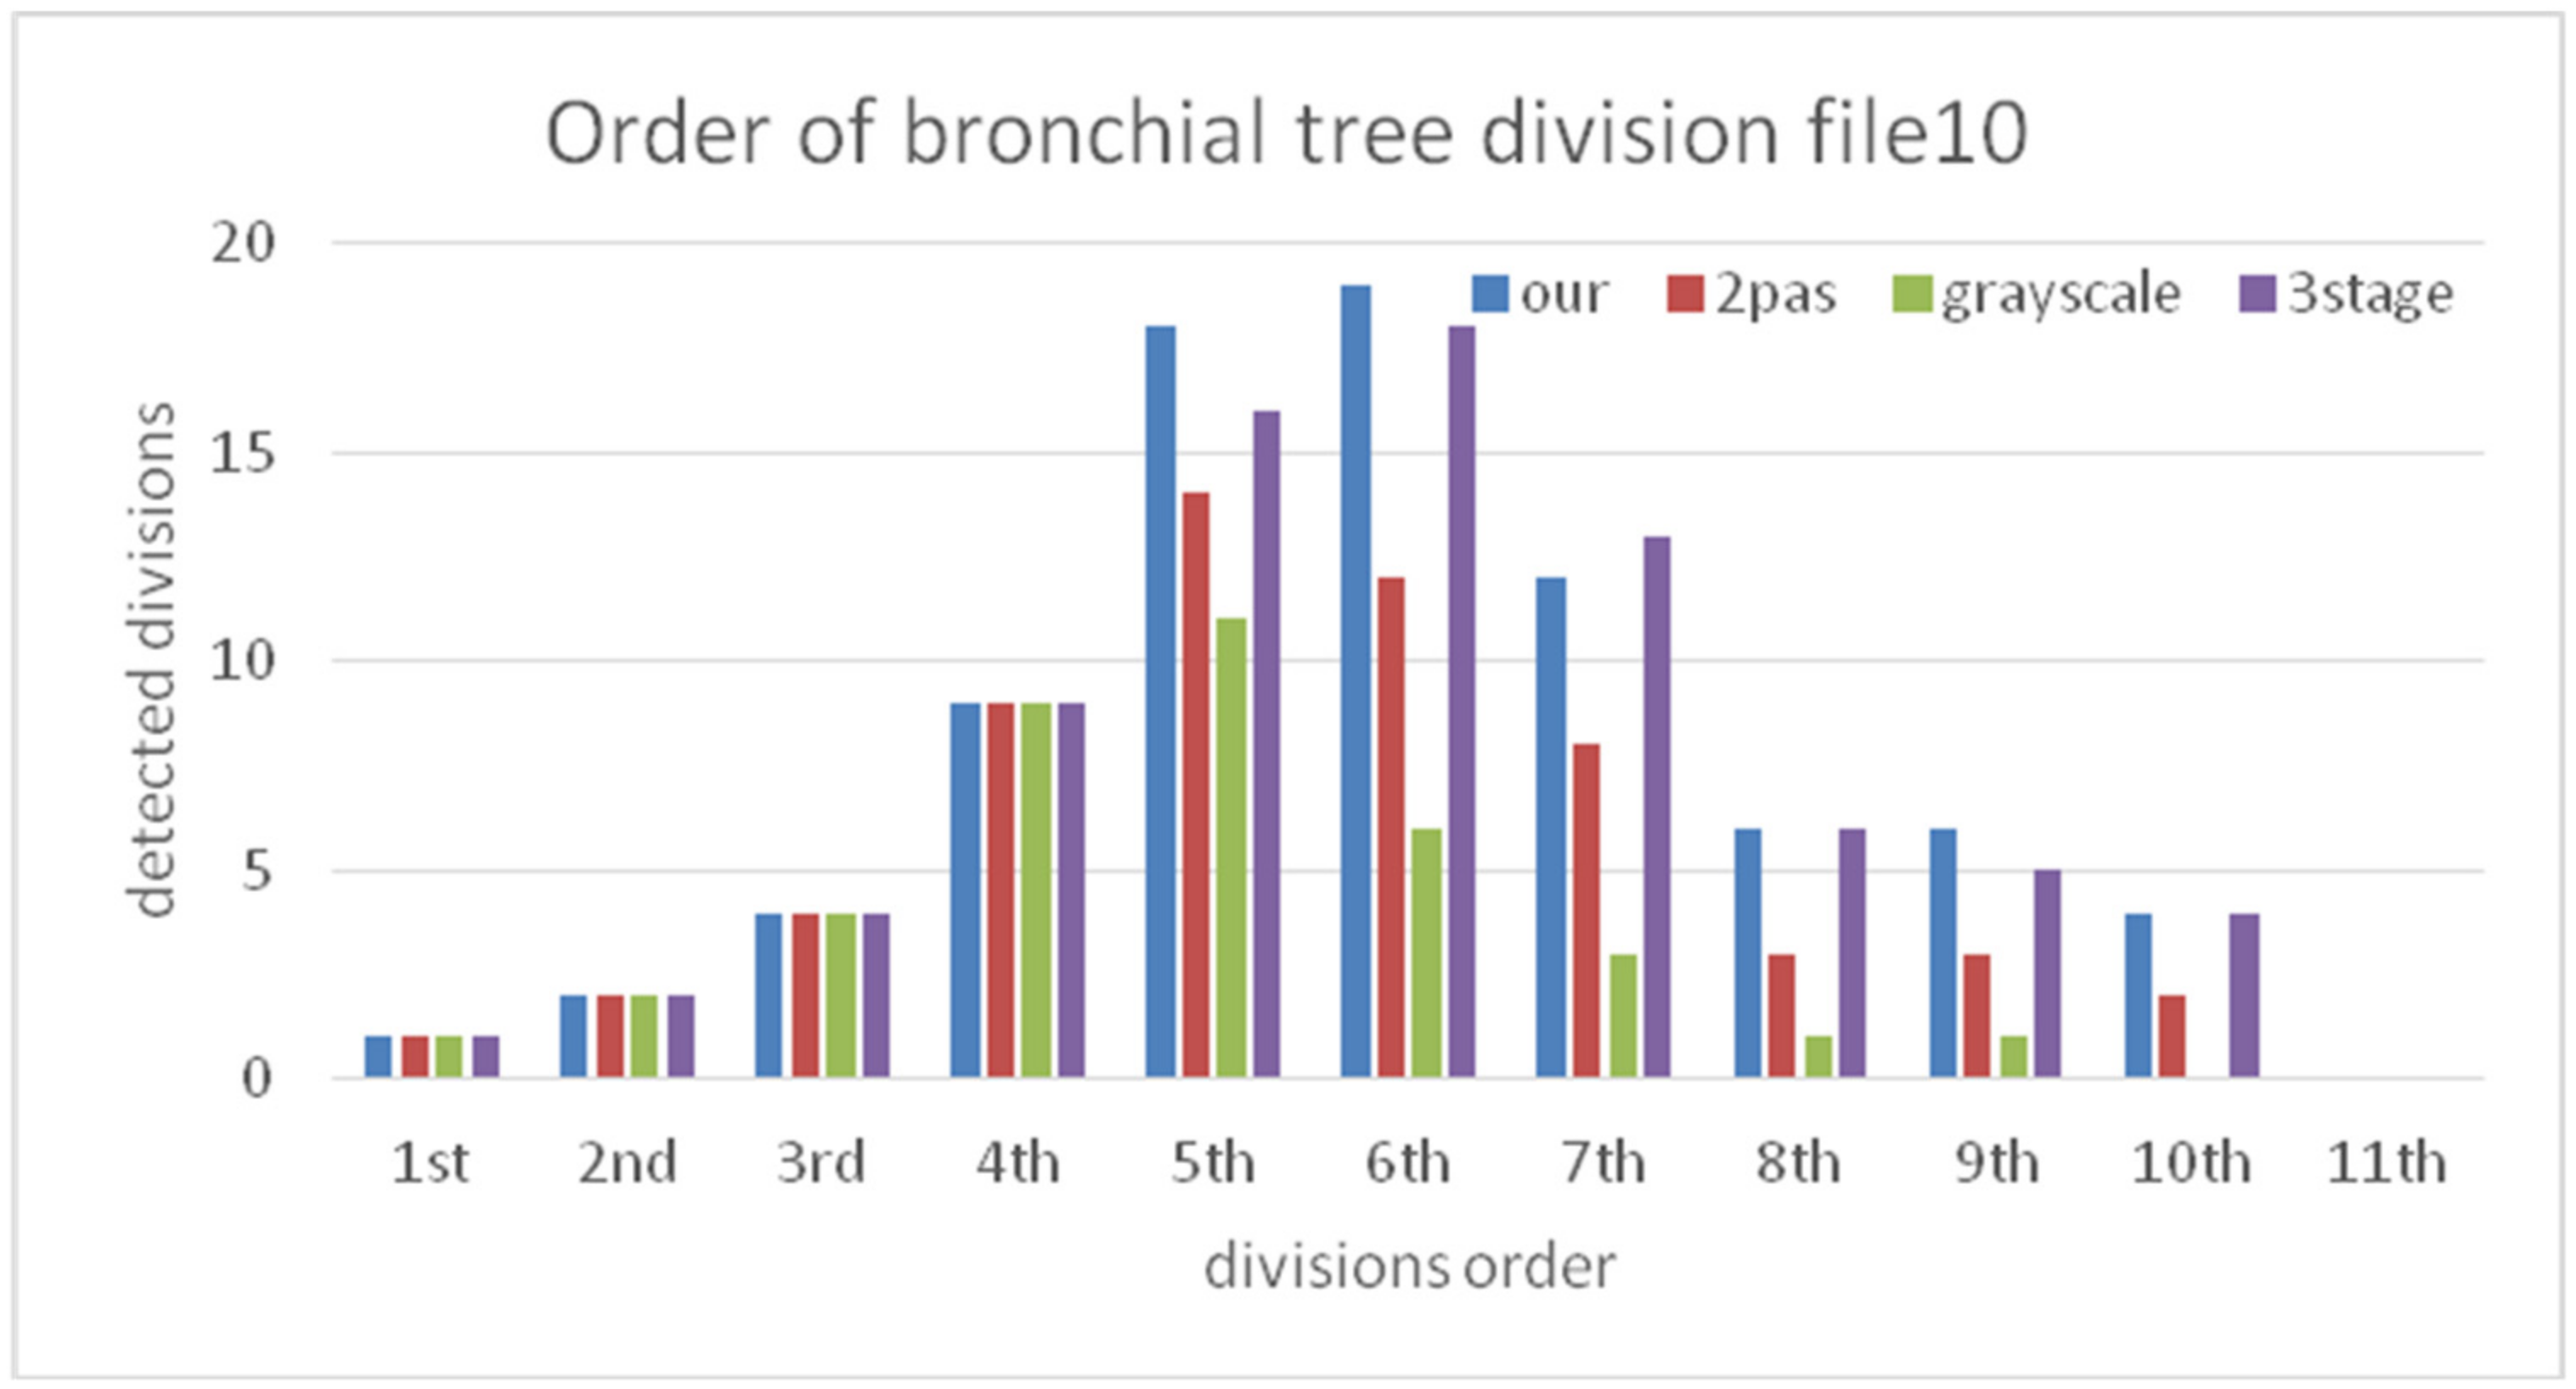
| file10 | 1 | 2 | 4 | 9 | 18 | 19 | 12 | 6 | 6 | 4 | 0 | 81 |
| Average | 1 | 2 | 4 | 8.6 | 18.1 | 20.6 | 13.2 | 7.4 | 5.6 | 2 | 0.6 | 83.1 |
| File | Bronchus Identification | ||||||||||
|---|---|---|---|---|---|---|---|---|---|---|---|
| B1 | B2 | B3 | B4 | B5 | B6 | B7 | B8 | B9 | B10 | ||
| file1 | right | 2 | 2 | 2 | 2 | 2 | 2 | 2 | 2 | 2 | 2 |
| left | 2 | 2 | 2 | 2 | 2 | 2 | 2 | 2 | |||
| file2 | right | 2 | 2 | 2 | 2 | 2 | 2 | 2 | 2 | 2 | 2 |
| left | 2 | 2 | 2 | 2 | 2 | 2 | 1 | 1 | |||
| file3 | right | 2 | 2 | 2 | 2 | 2 | 2 | 2 | 2 | 2 | 2 |
| left | 2 | 2 | 2 | 2 | 2 | 2 | 2 | 2 | |||
| file4 | right | 2 | 2 | 2 | 2 | 2 | 2 | 2 | 2 | 2 | 2 |
| left | 2 | 2 | 2 | 2 | 2 | 1 | 2 | 2 | |||
| file5 | right | 2 | 2 | 2 | 2 | 2 | 2 | 2 | 2 | 2 | 2 |
| left | 2 | 2 | 2 | 2 | 2 | 2 | 2 | 2 | |||
| file6 | right | 2 | 2 | 2 | 2 | 2 | 2 | 2 | 2 | 2 | 2 |
| left | 2 | 2 | 2 | 2 | 2 | 2 | 2 | 2 | |||
| file7 | right | 2 | 2 | 2 | 2 | 2 | 2 | 2 | 2 | 2 | 2 |
| left | 2 | 2 | 2 | 2 | 2 | 2 | 2 | 2 | |||
| file8 | right | 2 | 2 | 2 | 2 | 1 | 2 | 2 | 2 | 2 | 2 |
| left | 2 | 2 | 2 | 2 | 2 | 2 | 2 | 2 | |||
| file9 | right | 2 | 2 | 2 | 2 | 2 | 2 | 2 | 2 | 2 | 0 |
| left | 2 | 2 | 2 | 2 | 2 | 2 | 2 | 2 | |||
| file10 | right | 2 | 2 | 2 | 2 | 2 | 2 | 2 | 2 | 2 | 2 |
| left | 2 | 2 | 2 | 2 | 2 | 2 | 2 | 2 | |||
| System Measurement | 3D Printing | Accuracy | |
|---|---|---|---|
| Length of main trachea (mm) | 98.16 | 100.4 | 0.98 |
| Length of left main bronchus (mm) | 167.41 | 168.1 | 1.00 |
| Length of right main bronchus (mm) | 161.46 | 161.9 | 1.00 |
| Long/short diameter of main bronchus (mm) | 16.21/14.2 | 16.20/14.00 | 0.99/0.99 |
| Long/short diameter of left main bronchus (mm) | 10.41/7.87 | 10.42/7.82 | 1.00/0.99 |
| Long/short diameter of right main bronchus (mm) | 8.65/7.89 | 8.63/7.77 | 0.99/0.98 |
| Perimeter of main trachea (mm) | 45.69 | 44.9 | 0.98 |
| Perimeter of left main trachea (mm) | 26.63 | 26.3 | 0.99 |
| Perimeter of right main trachea (mm) | 24.58 | 24.4 | 0.99 |
| Angle of left main bronchus (degrees) | 44.2 | 44.5 | 0.99 |
| Angle of the right main bronchus (degrees) | 32.11 | 32 | 1.00 |
| Method | Systems Approach | Path Length (mm) | Training Data | Airway Recognition Execution Time | Bronchial Identification |
|---|---|---|---|---|---|
| This study | Region growing, three-stage segmentation, grayscale reconstruction, secondary region growing, tree structure level recognition | 913 | None | 10~20 min | 98.3% |
| Bian et al. [37] | Hessian matrix feature, Random forest learning | max: 2895 min: 397 | 80 groups | Training: 2 h Prediction: 15 min | N/A |
| Cheng et al. [38] | Tiny atrous convolutional network (TACNet) | 1869 | 80 groups | N/A | 85.6% |
| Lee et al. [39] | Hybrid enhanced filtering (tubular detection + black hat transformation), fuzzy connection, SVM | 1217 | 55 groups | 10–30 min | N/A |
| Qin et al. [40] | Attention distillation aid U-net | 907 | 90 groups | N/A | N/A |
| Meng et al. [41] | Tubular detector | 559 | None | 4~5 h | N/A |
| Nardelli et al. [42] | Semiautomatic algorithm, manual seed regrowth | 751 | Semi-automatic | Semi-automatic | N/A |
| Gil et al. [43] | Pooling layer multiscale single diameter tubular detector, reverse skeletonization growth | 745 | None | 21.36 min | N/A |
Publisher’s Note: MDPI stays neutral with regard to jurisdictional claims in published maps and institutional affiliations. |
© 2022 by the authors. Licensee MDPI, Basel, Switzerland. This article is an open access article distributed under the terms and conditions of the Creative Commons Attribution (CC BY) license (https://creativecommons.org/licenses/by/4.0/).
Share and Cite
Kuo, C.F.J.; Yang, Z.-X.; Lai, W.-S.; Liu, S.-C. Application of Image Processing and 3D Printing Technique to Development of Computer Tomography System for Automatic Segmentation and Quantitative Analysis of Pulmonary Bronchus. Mathematics 2022, 10, 3354. https://doi.org/10.3390/math10183354
Kuo CFJ, Yang Z-X, Lai W-S, Liu S-C. Application of Image Processing and 3D Printing Technique to Development of Computer Tomography System for Automatic Segmentation and Quantitative Analysis of Pulmonary Bronchus. Mathematics. 2022; 10(18):3354. https://doi.org/10.3390/math10183354
Chicago/Turabian StyleKuo, Chung Feng Jeffrey, Zheng-Xun Yang, Wen-Sen Lai, and Shao-Cheng Liu. 2022. "Application of Image Processing and 3D Printing Technique to Development of Computer Tomography System for Automatic Segmentation and Quantitative Analysis of Pulmonary Bronchus" Mathematics 10, no. 18: 3354. https://doi.org/10.3390/math10183354