1. Introduction
With the evolution in industrial fields, the mining industry is confronted with a huge energy demand, and is gradually emerging as the critical support for technological development and progress [
1,
2,
3]. To adapt to community challenges, ore-deposit extractions are constantly expanding, especially for open-pit mines [
4,
5]. Blasting is a conventional excavation measure for the ores crushing on the ground, and also an option for constructing roads, tunnels and other constructions in mine projects [
6]. However, during blasting operations, there are undesirable consequences engendered, such as seismic waves, explosive flying scatter (fly rocks), air shockwave, noise, toxic gases, blasting dust, etc. [
6,
7].
Within these hazards, blasting dust, the PM2.5 and PM10, and some toxic gases, including CO, NO
x, SO
2, H
2S, and so on, become prominent components of environmental pollutants in blasting sites [
8]. Most of these toxic gases are released in a range of concentrations due to environmental and technical factors [
9]. Inhaling a certain amount of these toxic gases during their diffusion period can be fatal [
10]. Furthermore, prior studies have denoted that it can reach thousands of milligrams per cubic meter for the local blasting dust concentration in surface mining [
11]. The combination of blasting dust with toxic gases, which is collectively referred to as smoke dust, has attracted extensive attention owing to its salient hazardousness on air quality in mining sites and detrimental effects on human health [
12,
13]. It has been demonstrated that a fairly high percentage of miners suffer from respiratory diseases or reduction in respiratory-system immunity due to long-term exposures to high-concentration dust environments, especially pneumoconiosis [
14,
15]. In addition, the accumulation of dust reduces the humidity of the atmosphere, which then increases the ambient temperature [
16]. Meanwhile, it is noteworthy that smoke dust reduces visibility in the mining site, resulting in high working risks and a significant reduction in production efficiency [
17]. Large amounts of dust pollution can depose on the ground, causing vegetation degradation and animal habitat destruction [
18]. With the characteristic of high concentration and wide range of diffusion it might spread into the water area for dust clusters, thereby contaminating the downstream areas [
8]. Studies over the past decades have provided important information on the generation and diffusion mechanisms of smoke dust in open-pit mines. Numerical simulations, for instance, Fluent software, LS-DYNA etc., were conducted to figure out the smoke dust movement, diffusion rate, and the time consuming to float out of the pit, validating the effects of vortex action and the vertical height in the pit on coal-mine dust, and optimizing blasting parameters at the same time [
19,
20]. Inspired by the approaches, Tang et al. [
21] established a circulating accumulation emission model to analyze dust diffusion, including dust emission, retention, and diffusion, respectively. Besides, pertinent artificial intelligence systems, such as particle swarm optimization (PSO) and the long short-term memory (LSTM), were employed to predict and control dust concentration [
22,
23,
24]. In terms of the evaluation system of efficiency of dust reduction with multiple techniques, there are also studies [
25,
26] in virtue of some tools (e.g., computational fluid dynamics model (CFD): ANSYS/Fluent 10.0 software, ANSYS, Inc., Pittsburgh, Pennsylvania, USA) mainly aiming at monitoring the dust diffusion, and then guaranteeing the mitigation of the smoke-dust pollution.
Furthermore, there are increasing concerns that, exposed to high-concentration smoke dust in open-pit mines, measurement equipment has been a crucial factor for immediately monitoring the pollution condition. Attalla et al. [
9] adopted non-dispersion infrared (NDIR) and differential optical absorption spectroscopy (DOAS) to examine the diffusion of fugitive NO
x and other pollutant gases. In addition, dust sample sensors, which are commonly based on ultrasound, optical, and electrochemical sensing elements, have also emerged as conventional methods for assessing contaminant gases and particulate fractions of dust emission [
2]. With the widespread application of unmanned aerial vehicles (UAVs), researches were performed to load a series of sensors in the rotary-winged platforms, such as CO
2, NO
2, SO
2, PM10, etc. [
27]. When in the application process, it is essential for the sampling collection location and source scales to be considered owing to the differences in fixed-wing and multi-rotor UAVs, and thus the long response time, limited measurement distance, and the accuracy of sensing elements hindered further use of UAVs.
Recent developments in the field of machine vision have led to a renewed interest in various industries due to their merits in non-contact measurements, full-visualization monitoring, and affordable cost [
28,
29,
30,
31]. In spite of the fact that the related studies on these vision-based models are currently at an early stage, digital image technology, mainly based on grayscale features and morphological features, has been widely applied in pollution analysis and control [
32,
33,
34,
35]. Dust-pollution measurement models established on the basis of grayscale features attempted to develop a relationship between the dust concentration and grayscale features extracted from dust images. Yue et al. [
30] presented a photo-based method for analyzing air pollution using grayscale data. Thereafter, a logarithmic relation was acquired between the grayscale values and the powder volume by Grasa et al. [
34], providing a calibration curve without any fitting constants. On the other hand, morphological feature models are inherently associated with the connections between the morphological features (such as the particle shape, size distribution, and surface structure) and dust concentration. R. Davies [
36] and M. Taylor [
37] were convinced that parameters of concentration and morphology were important in particle detection, and the latter presented mathematical models to characterize the particles. M. Paphael et al. [
38] estimated the mean particle size utilizing optical parameters, on-line turbidity, and solid concentrations. It is also notable for the fractal dimension, another aspect of morphological features, to describe the space occupancy and the irregularities of granulated materials [
39,
40,
41,
42]. To figure out the effects of fractal dimension on the porous texture of coal dust images, Mahamud et al. [
41] conducted experiments to measure particles exposed to different temperatures. Zhang et al. [
42] apply fractal dimension to record the particle size of crushed specimens and obtain a legible regularity of size distribution in different stress conditions. Nevertheless, traditional grayscale or morphological models only considere the local features of pollutants but ignore the global features of their distributions, resulting in a one-sided evaluation of the pollution environment.
To further present the main advantages and limitations of the technology and equipment of previous studies on the pollutant migration that happened during rock-blasting operations, an overall comparation between them is summarized as the
Table 1:
Overall, all the evidence reviewed here seems to require a comprehensive evaluation system and distribution analysis for smoke dust pollution caused by blasting operations in open-pit mines.
In this paper, a vision-based model was established based on the fractal dimension theory (Dbox(P)) and a grayscale average algorithm (Ga) for smoke dust evaluation in open-pit mines. Framed pictures were first collected from the video recorded by a UAV, and then, through a series of image processing operations, Dbox(P) and Ga were separately calculated, the results of which were fitted by logarithmic and linear functions, respectively. For the sake of considering both global and local characteristics of pollutants, and fully adopting simplified expressions to characterize the various generation stages of smoke dust in blasting sites, a pollution index (Pi) was proposed to integrate the Dbox(P) and Ga, developing a hazard classification mechanism corresponding to four-level regions. With this evaluation system, the pollution condition of smoke dust can be obviously developed and analyzed, and eventually adequate preparations in response time and emergency preparedness are capable of eliminating detrimental effects on health protection and property safety, as well as improving the environmental quality around the blasting sites.
2. Image Processing Method Based on Grayscale Average and Fractal Dimension
Digital image processing has been successfully applied in the engineering field depending on the difference in the morphological characteristics or the color features of the research object against the homologous background [
44,
45,
46]. Based on the technical principles, and the available devices, it is possible to achieve the monitoring and evaluation of the smoke-dust. The specific procedures of the algorithm in this research can be illustrated as a flowchart in
Figure 1:
As shown in
Figure 1, the proposed method can be divided into two parts, including the modules of image-processing operations and properties analysis, which primarily aim to acquire the feature image of the pollutants, and relevant calculation results about their distribution properties. According to the flowchart, pollution conditions in blasting sites can be analyzed and evaluated through a series of digital images. The specific application procedures are briefly presented below:
Step one: collect pollutants images of smoke dust at the blasting site, and then the software reads the images to form a three-dimensional digital matrix Cm×n×3, which includes pixel values and homologous locations (); m, n represent the image size in height and width, and the third dimension of the matrix represents three color channels: R, G and B, respectively.
Step two: based on the image matrix C
m×n×3, extract the main regions where pollutants distribute via Equations (1) and (2) below in accordance with the color characteristics of the smoke dust [
47]. As is usual, the smoke dust pollutants in non-coal mines appear a brighter color, and thus, compared to several dark backgrounds, the pixel values of pollutants tend to be higher. Through the screening method, a series of pixels representing superfluous regions will be removed, whereby the images can be prepared for subsequent image processing operations.
Step three: fulfill further image-processing operations with pertinent programs. Image graying is enforced using the empirical formula shown in
Figure 1, the matrix result of which is denoted as
Gm×n, and by virtue of image graying, the color dimensions are converted into two dimensions, viz., the image size. Then, binarization was served to recognize the regions of interest, in which a double-threshold method (T
1, T
2) was put forward to improve the performance of the feature extractions, and in this way, pixels within the gray image that are, respectively, lower or higher than T
1 and T
2 are assigned as 0 (black in color), while the intermediate areas between the thresholds are assigned as 1 (white in color). Noise reduction is then adopted to eliminate excrescent noise points caused by the forming transversion of pollutant images [
48].
Step four: calculate the
Dbox(P) and
Ga of the smoke-dust images to quantitively analyze the distribution changes of on-site pollutants. In the process, the two-dimensional box counting method was developed to acquire the fractal property of the pollutants [
40]. Within the fractal calculation processes, the binary images are traversed by a slew of windows, the side lengths of which are decided by the original picture size, and are incremental pixel by pixel until the width and height reach half of the original length. Then, for each window, keep a track of the number of square boxes
N(ε) intersecting the pollutant parts as well as the lengths of the boxes
ε. Afterwards, instead of the mathematical definition of fractal dimension theory as Equation (3), a regression method is used to analyze two groups of the box data through logarithmic processing, which can be expressed as Equation (4). Obviously, the slope of the regressed equation
Dbox(P) is the fractal dimension of the smoke dust.
Meanwhile,
Ga of the binary images is calculated based on Equation (5), which can be defined as the division operation between the pixels denoting pollutants and site background, respectively. When in the calculation process, a grayscale distribution curve is plotted to develop the pollutants distribution along the directions of horizontal strike.
where
and
represent the height and width of smoke-dust images.
Step five: through the computation of the
Dbox(P) and
Ga of the pollutant, a pollution index
Pi is provided to achieve a comprehensive consideration of
Dbox(P) and
Ga, and the integration expression can be depicted as Equation (6):
Then, according to the change tendency of Pi, it can be more accurate to evaluate the pollution condition from a quantitative aspect, and with a series of pollutant images collected from a whole blasting project, the index Pi is capable of dividing into four regions of pollution levels, Level I~IV, viz. Therefore, the pollutant condition of smoke dust can be dramatically characterized no matter the period of monitoring or throughout the whole working process by this research.
3. Algorithm Application of Dbox(P) and Ga with a Fugitive Dust Picture
For the sake of further demonstrating the proposed evaluation method of pollutant distribution in a blasting site, an image sample with fugitive dust shown as
Figure 2 was applied to validate the effectiveness of the image-processing algorithm, and measurement of
Dbox(P) with
Ga. Firstly, the original color image of fugitive dust as
Figure 2a was read, where in the image dust particles emerge distinctly with homologous pixels when compared to the black background. With the application of the image-processing method, the region of the floating dust was arguably extracted to produce a binary image, which can be visualized as
Figure 2b. Based on the binary image, the calculation processes of
Dbox(P),
Ga are also displayed in
Figure 2c,d, respectively. As for the grayscale distribution, an ergodic window of 438 × 10 pixels in size was employed to cover the binary image along the direction of the horizontal, and with the traversal calculations, the grayscale distribution, cumulative distribution curve, and grayscale average were obtained, the results of which are displayed in
Figure 2e. According to the grayscale parameters,
Ga of the whole image is 0.2490, and the dust objects primarily mainly distribute at 220~550 pixels of the horizontal strike. Similarly, the calculation procedures of
Dbox(P) are devised as
Figure 2d using the two-dimensional box counting method. With a series of measuring boxes covering the binary image, the computation procedures are revealed as the fitted equation in
Figure 2f, and the
Dbox(P) of the dust image is 1.977, the
R2 of which is 0.9998, embodying a precise fitting effect when applying it to research objects of fine grains.
In order to verify the accuracy of calculation results in
Dbox(P) and
Ga with the proposed binary dust image handled from the original image, the grayscale average distribution of the gray image, remaining quite complete image information with a 256-level grayscale form, was devised to analyze the change tendency of dust pixels as a comparison to the binary image, and quantitatively appraise the effectiveness on object segmentation within the application of image processing. The analysis results can be shown as
Figure 3.
As is mentioned with the grayscale parameters, dust particles are primarily distributed at 220~550 pixels of the horizontal strike in accordance with the binary image. It can be perceived that the developed trend of the grayscale average from gray image tends to be consistent, performing a fairly smooth waveform shape. In addition, it is almost coincident with the high-distribution region of dust particles in any binary image or gray image. While there is a hysteresis effect for the grayscale parameter of gray image at the boundaries between research objects and background, producing two hysteresis intervals in the rising and falling stages of the grayscale average, the area of the hysteresis intervals accounts for about 5.58% of the total enclosed area by the grayscale distribution line of gray image. It is imperative to note the significance turning points, data turning point G1 (90, 25.16) of gray image embodying a hysteresis effect contrasting to B1 (210, 7.37 × 10⁻⁵) of binary image for the first hysteresis interval, whereas G2 (560, 51.10) illustrates an almost the same horizontal position with B2 (560, 3.08 × 10⁻⁵). A possible explanation for this might be the low pixel values of edge dust particles in the image (i.e., grayscale value). As a whole, in spite of the existence of hysteresis intervals, the application image of fugitive dust presents a validity in the object recognition of dust clouds and other fine-grained substances from a quantitative aspect.
4. Results on the Dbox(P) with Ga and the Pollution Evaluation System of Blasting Operations
A field experiment for analyzing smoke dust distribution, and evaluating the pollution condition based on the proposed method, was conducted in a deep open-pit mine with multi-step terrain production in Xinjiang, China. Shallow hole blasting was adopted for the ores crushing along the hillside wall, and the whole blasting operations with partial diffusion were recorded by a UAV platform flying directly above the blasting region with a fixed height. The platform can be predetermined in an autonomous direction, and illustrates high-temporal sampled pictures in real time.
A total of 95 images were extracted from the video recorded by the UAV with an interval of 1 s, which are 640 pixels in width and 368 pixels in height, integrally revealing the processes of blasting preparation, exploding and diffusion of smoke dust, respectively, which are shown in
Figure 4.
From the images in
Figure 4, it can be found that there is an obvious contrast between smoke dust and the field background throughout the periods of blasting operation. At the initial stage, debris and dirt deposits on the ground were lifted up due to the shock wave of blasting, and with the gravity effect, the smoke dust was then dispersed suffering from the wind floating and other meteorological conditions. At this stage, most distribution regions of the pollutants perform as partially bright in color, while regions representing the ground surface and the bench tend to be dim. For a clearer description, a three-dimensional elevation grayscale image was put forward to show the grayscale distributions and the differences in elevation, as depicted in
Figure 5. The elevation range in
Figure 5e extracted from the region presents an exceedingly grayscale difference between the pollutants and ground surface. By this method, feature extraction of a complicated environment between the pollutants and background can be fulfilled through a series of image-processing algorithms proposed in this research.
To ulteriorly assess the effectiveness of the proposed method in blasting operations, the 95 images from the blasting work were processed by the image-processing algorithm, and then served to determine the
Dbox(P) and
Ga. Within the pollutant images, the computation processes begin from the 16th image because the 1st~15th images belong to the prior stage of blasting, and smoke dust is barely distributed in these images. Partial image-processing results of the 15th, 30th, 45th, 60th, 75th and 90th images are shown as
Figure 6:
Following the image-processing results it can be discerned that at the first stage of blasting, a large amount of smoke and dust are engendered to form smoke-dust clouds, mainly due to the explosive at each charge point, such as the 30th picture. At this stage, dust particles start to float due to the shockwave caused by the explosion, which is much larger than the gravity of the dust particles, friction between dust particles and rock particles, and adhesion of dust against other items. Then, with the completion of the blasting operation, the smoke-dust clouds gradually develop, when in this process the smoke dust continues to move upward as a consequence of the inertia effect, and the motion track of a large amount of smoke dust is superimposed, subsequently generating a mushroom or mushroom-like cloud. In addition, from a qualitative perspective for the pollutant distribution, the amount of smoke dust appears to have an upward trend with the explosion process, and then enters into a volatility phase, (60)~(75), for instance. Eventually, as the smoke dust continues to spread, which mainly interfered with meteorological conditions in this period, especially for the disturbed wind flow, the distribution is confronted with a certain degree of reduction.
To further describe the amount of pollutant,
Dbox(P) and
Ga for the 15th~95th smoke dust images were calculated, and the results with corresponding calculating time are demonstrated in
Table 2.
According to the results of Ga and Dbox(P), a relatively legible data trend is presented, which can be summarized as increasing to a peaking value, maintaining a stable fluctuation within a certain range, and then decreasing with time, respectively. Moreover, it is found that there is a discrepancy in calculating time between Ga and Dbox(P), the reasons for which may be explained by the varying levels of program complexity.
For the sake of further analyzing the
Dbox(P) and
Ga of the collected frame pictures from the video footage of field blasting, computations of all images by the proposed method were carried out and the specific results with related fitting curves can be denoted in
Figure 7:
It can be easily discovered from
Figure 7 that there are characteristic distributions for 80 image samples (16th~95th) on the basis of the results, which accord with a pattern consistent with the qualitative description, mainly including three stages: increasing, stable fluctuations, and decreasing. The fitted equations for the
Ga and
Dbox(P) are listed in
Table 3.
As illustrated in the fitted equations, for both of the
Dbox(P) and
Ga, stage one (
G1 and
D1) and stage three (
G3 and
D3) can be appropriately represented by logarithmic fits. Stage two (
G2 and
D2) in
Figure 7 presents varying data fluctuation within a certain range, and therefore, a linear fit was employed to demonstrate the relationship between the pollutant parameters and dust images at different times.
In addition, from the fit coefficients R2 of all fitted equations, it can be found that no matter Dbox(P) and Ga, there are differences in the logarithmic fit of stage one and stage three. For example, for the grayscale average, R2 of stage one and three are 0.9165 and 0.8188, and as regards the fractal dimension, R2 is 0.5707 and 0.4978, respectively. It is distinct that there is a numerical reduction from stage one to stage three, the possible reasons for which are mainly because of the different causes for the performances of the pollutants. Smoke dust in stage one is most likely caused by a dynamite explosion in the field, whereas smoke dust in stage three is more likely caused by a diffusion effect caused by meteorological conditions, particularly wind floating.
It is also important to denote that, with reference to the fit coefficient, the fitted equations of Ga (the maximum is 0.9165) perform better when compared to the Dbox(P) (the maximum is 0.5707), and this phenomenon elucidates that smoke dust in images reflects more local features than global features because when in the process, Ga is oriented to one calculation for a whole digital image, while Dbox(P) is confronted with multiple identical calculation procedures by a series of detecting boxes covering the image.
Based on the proposals of
Dbox(P) and
Ga, and while combining the benefits of local and global features, a pollution condition index (
Pi) is developed to assess quantitative changes and spatial-temporal distributions in smoke-dust images. By this way, an integration of image parameters consisting of
Dbox(P) and
Ga can be additionally completed, and in sites, the mathematical expression of
Pi is much more widely applied in engineering computation to guarantee acquisitions of pertinent information related to the engineering efficiency and practitioner safety.
Pi can be presented as Equation (6) above. On the basis of the equation,
Pi of the blasting images can be drawn as
Figure 8:
The results of the correlational analysis are presented in
Figure 8, and the relevant fitted equations with homologous goodness of fits (
R2) are also shown. Compared to any of the parameters in
Figure 7 and the calculated results of fitted equations in
Table 3, data distributions of
Pi similarly illustrate the legible diffusion stages of smoke dust: generation stage, cloud-formation stage and diffusion stage. In the graph, the time intervals of stages one~three are 16~44 s, 45~84 s and 85~95 s, respectively. The single most striking observation to emerge from the data comparison is that the data distribution tendency of
Pi is similar to the results of
Dbox(P) and
Ga. Moreover, the
R2 of the fitted curves are 0.8365, 0.0022 and 0.7397, embodying a fair logarithmic relationship for stage one and stage three. At the same time, it also appears to have a more stable data fluctuation for stage two in contrast to the single parameter. In brief, the proposal of
Pi illustrates an ideal performance throughout blasting processes, and achieves one mathematical expression corresponding to three stages of pollution distribution. To observe the performance of the proposed method of smoke dust evaluation in this research, comparative results are summarized in
Table 4.
Three previous studies on estimation of PM2.5, PM10 and NO
2 were presented based on the digital image processing, and RMSE along with R squared values are the metrics for evaluation models. From
Table 4, although the three studies targeted three specific pollutants, the RMSE values of the proposed method (stage one and stage three) indicate a fair regression effectiveness when compared to the other these models. Similarly, the R squared values also reveal that the
Dbox(P) −
Ga based method is reliable for the analysis about pollutants migrations in blasting operations. Therefore, the RMSE and R squared values of the proposed method were confirmed by the comparisons.
Based on the comprehensive pollution index of blasting engineering, the proposed model can be further utilized in pollution hazard classifications. In this research, an attempt was made to provide a method to evaluate the pollution condition on site in accordance with the fitting curves shown in
Figure 8, which were divided into four pollution levels, including the serious, the high, the middle, and the mild, as depicted in
Figure 9. Detailed division procedures are also introduced.
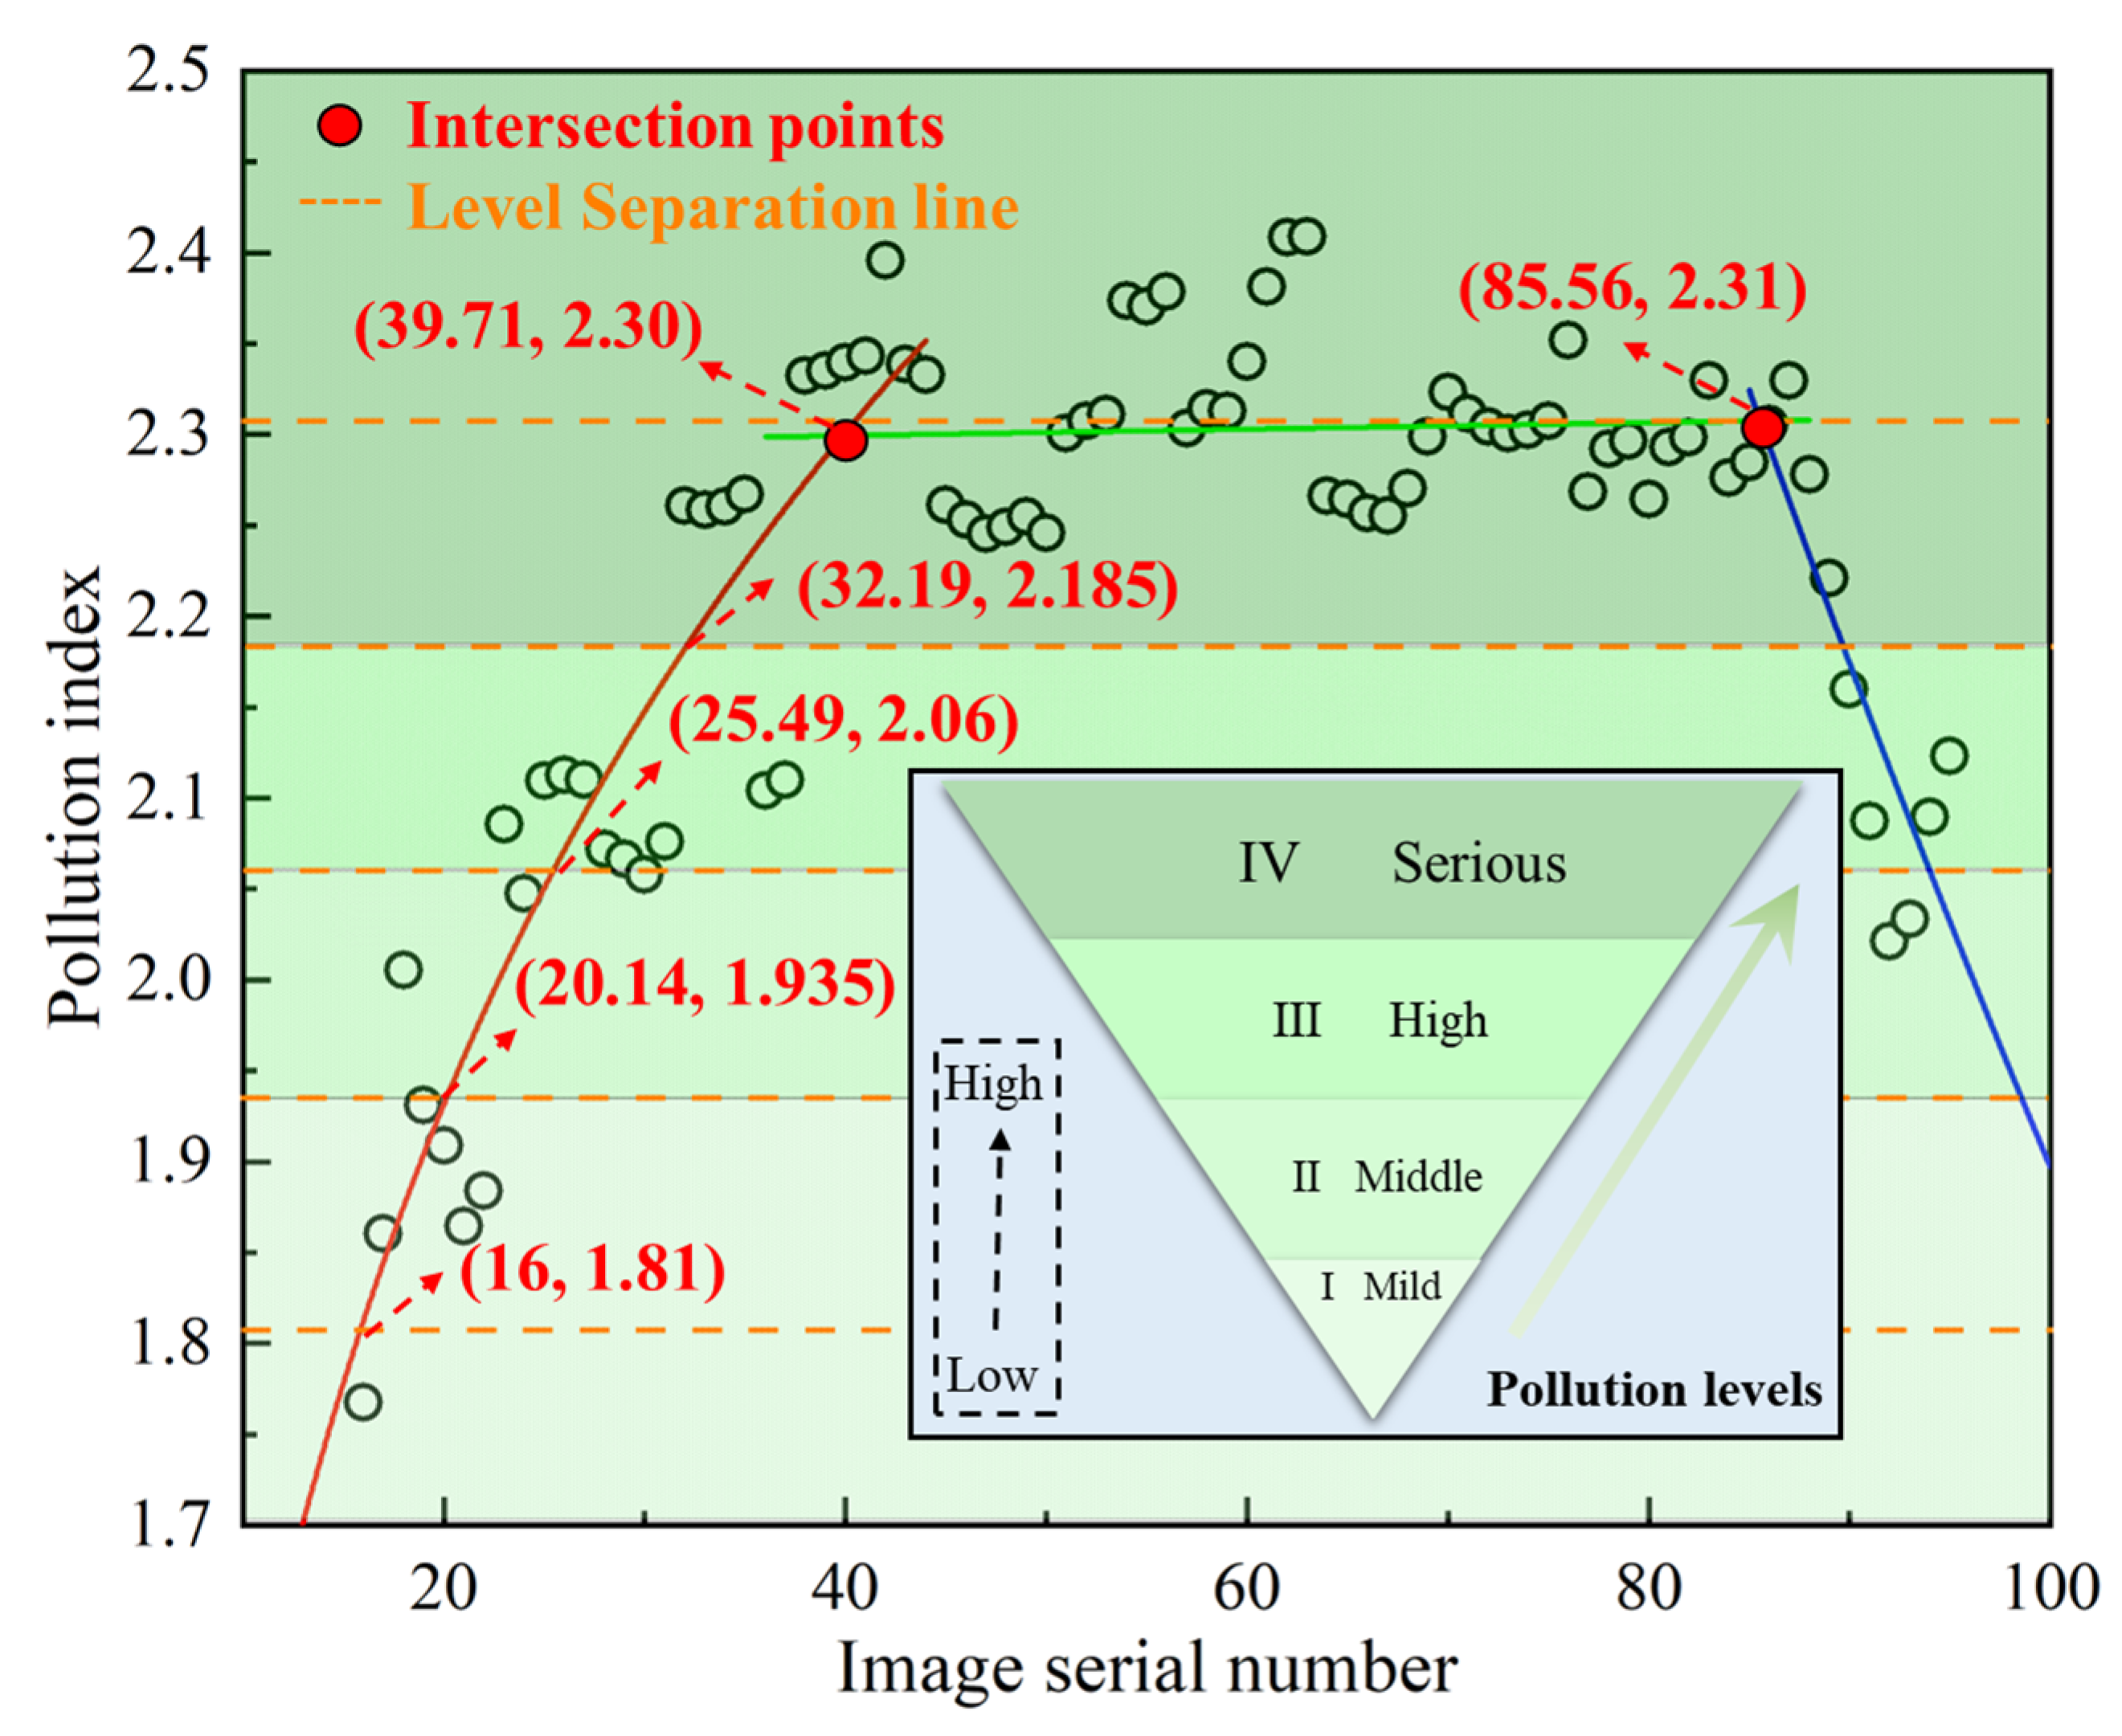
- (a)
At the start of the blasting (from the 16th image), according to the fitting result of stage one, the Pi is 1.81, and at stage two of the fluctuation period, the logarithmic fitting results of stage one and three were extended to intersect with it to generate two intersection points, the coordinates of which are (39.71, 2.30) and (85.56, 2.31). Thus, the peak value of the model is dictated as the intersection point between stage two and three. In this way, the Pi interval is [1.81, 2.31].
- (b)
After determining the Pi interval, four equal parts were then calculated and determined, and the Pi values along with their corresponding occurrence times are Pi1 (20.14 s, 1.935), Pi2 (25.49 s, 2.06), Pi3 (32.19 s, 2.185) and Pi4 (85.56 s, 2.31), respectively.
- (c)
Based on the
Pi values, the distribution graph was divided into four regions. As a supplementary, the region below 1.81 of the
Pi value was also assigned to the first level, while that above 2.31 was assigned to the last level. Therefore, the whole graph of pollution distribution is divided into four levels, and a color pyramid is used to describe it. The detailed division criteria of level I~IV can be presented as
Table 5.
By virtue of the critical factor of Pi, the pollution evaluation system can be established for analyzing the distribution conditions of smoke dust, and provide an approach to develop a comprehensive program in pollution prevention and control. Different from previous methods in monitoring smoke dust pollution, the proposed system in this research adopts a series of digital images, and then fulfills pollution classifications through computations of Pi in the software. Subsequently, the final pollution levels at the target time point can be determined.
5. Discussion
5.1. Pollution Evaluation of Single-Point Area with Image Slices
The aforementioned research on
Dbox(P),
Ga and
Pi were conducted by virtue of certain smoke dust images, in which the computation scope was oriented to the full range of one blasting image. However, sometimes it is necessary to monitor and evaluate the pollutants at a single point within a provided image to figure out whether the proposed method is capable of enforcing the task.
Figure 10 demonstrates the application procedures for two single-point areas in the 30th image chosen from the same video.
As shown in
Figure 10 b, two pictures were extracted from the binary image, which are the bench and diffusion area, and the selected square regions are 50 × 50 and 70 × 70 in size, respectively.
Dbox(P) and
Ga of the pictures were then calculated, and the fitted results of fractal dimension are illustrated in
Figure 10c,d. Distinctly,
Ga of area one and two are 0.174 and 0.481, and
Dbox(P) are 1.5454 and 1.8398. Thus, the pollution indexes (
Pi values) can be calculated, the results of which are 1.7194 and 2.3208. Depending on the proposed pollution-level evaluation system in the previous section, regions one and two are supposed to be classified as level I and level IV in smoke dust pollution. Consequently, in addition to the computation ability for the full range of an image, the proposed system can be also exceedingly applied in the calculation of a single-point pollution area, thereby satisfying relevant monitoring tasks. At the same time, the results of these two regions also demonstrate that it is feasible for the system to accomplish analysis on the pollution condition of smoke dust through digital images recorded at blasting sites.
5.2. Variation Trends on Binarization Thresholds within Image Processing Operations
In the conversion process from image graying to binarization, double threshold binarization was adopted to extract the pollutant features in an image, the thresholds of which are denoted as T
1 and T
2. Nonetheless, it is not always consistent for the threshold values with the blasting program in progress. Owing to the pollutants with variable quantities, and the complex background in blasting site, T
1 and T
2 are also required to adapt to the optimal image conversion in binarization operation. The thresholds used in this research are denoted in
Table 6.
It is apparent from this table that there are different numbers of time nodes for T1 and T2 when choosing threshold values in the process of binarization, where T1 consists of five nodes while T2 possesses eight nodes. This result may be explained by the fact that there are more changes happening at the border of the highlight pixels, while the dark regions in the image mostly representing the background present fewer changes. In other words, the generation process of smoke dust is inherently more associated with the bright pixels in the pollutant images.
As for T1, at the first time-interval of 1–15 s, the optimal threshold value tends to be chosen as less than 10, which is an important parameter for the segmentation between the pollutants and background. Thereafter, T1 is preferably assigned as 100 in 16–35 s. Obviously, there is a pretty large increase from the first time-interval to the second, the reason for which might be the mixture of items produced in the initial stage, which mainly consist of mud blocks, gravel, dust particles, and so on, illustrated as grayish-black in morphology. For the sake of capturing the features of items while trying to remove the background part of the picture, it is essential for the threshold border T1 to be moved up to 100.
After the first time-interval, the blasting operation began at 16 s, and then there is a steady decline for T1 value until 49 s with a range of 20. A possible explanation for this might be that the generation process of pollutants has a relatively stable impact on image pixels in dark regions. The finding provides some supports for the conceptual premise of the generation stage aforementioned in the presentation of image parameters due to the three time nodes being from 16 s to 48 s, where the time interval defined before the generation stage is 16–44 s. Moreover, at the time interval of 49–95 s, it appears appropriate for the T1 to be less than 40 so as to preserve dark-area features of pollutants, and the implication of this is the possibility that there is also a minor effect on T1 for the pollutant distribution within the cloud-formation stage and diffusion stage. Potentially, this phenomenon indicates that in these two stages, there are few variations in the dark features of smoke dust.
Turning now to the T2, it is obvious for it to have a data trend of decreasing and increasing in succession (>240–140–>170), the reasons for which could be attributed to the generation of a large amount of smoke dust, inducing the bright features to tend towards unified in a blasting image, and simultaneously masking the features of other bright areas in sites so that the grayscale values of bright pixels experience a decrease. Then, with the fading of time, the diffusion of smoke dust is confronted with a gradual reduction, and the grayscale distribution of the original image progressively reappears again.
At the pre-blast stage of 1–16 s, T2 was decided as less than 240 to guarantee the removal of pixels not related to pollutants, which indicates that there are more distributions of bright pixels in the background part of the original image. On the other hand, different from the steady declines in T1, T2 emerges at decremental or incremental intervals throughout the whole time-node. Within the time nodes of 17–22 s, 23–31 s and 32–37 s, the decreasing of T2 demonstrates that with the start of blasting, smoke dust gradually covers the bright areas in the background, contributing to a more centralized grayscale distribution. Additionally, the decremental intervals of T2 depict that the generation of smoke dust slows down at a later stage. The finding further supports the logarithmic relationship discussed in the generation stage mentioned above. As for the time nodes from 38–76 s, the selections of T2 also present stable fluctuations similar to the cloud-formation stage, and in this stage, the steady decline may be explained by the inertial motion of smoke dust, resulting in different development tracks. Then, at 77–95 s, T2 are chosen at more than 170, which are in line with the previous description of the diffusion stage, when in this process the smoke dust is mainly subject to meteorological conditions, suffering from a sluggish spread.


