Article

Enhanced Evaluation Method of Musical Instrument Digital Interface Data based on Random Masking and Seq2Seq Model

1
Department of Autonomous Things Intelligence, Graduate School, Dongguk University–Seoul, Seoul 04620, Korea
2
Department of Multimedia Engineering, Graduate School, Dongguk University–Seoul, Seoul 04620, Korea
3
Department of Multimedia Engineering, Dongguk University–Seoul, Seoul 04620, Korea
*
Author to whom correspondence should be addressed.
Mathematics 2022, 10(15), 2747; https://doi.org/10.3390/math10152747
Submission received: 24 June 2022 / Revised: 28 July 2022 / Accepted: 31 July 2022 / Published: 3 August 2022
(This article belongs to the Special Issue Application of Mathematical Methods in Artificial Intelligence)

Abstract

:
With developments in artificial intelligence (AI), it is possible for novel applications to utilize deep learning to compose music by the format of musical instrument digital interface (MIDI) even without any knowledge of musical theory. The composed music is generally evaluated by human-based Turing test, which is a subjective approach and does not provide any quantitative criteria. Therefore, objective evaluation approaches with many general descriptive parameters are applied to the evaluation of MIDI data while considering MIDI features such as pitch distances, chord rates, tone spans, drum patterns, etc. However, setting several general descriptive parameters manually on large datasets is difficult and has considerable generalization limitations. In this paper, an enhanced evaluation method based on random masking and sequence-to-sequence (Seq2Seq) model is proposed to evaluate MIDI data. An experiment was conducted on real MIDI data, generated MIDI data, and random MIDI data. The bilingual evaluation understudy (BLEU) is a common MIDI data evaluation approach and is used here to evaluate the performance of the proposed method in a comparative study. In the proposed method, the ratio of the average evaluation score of the generated MIDI data to that of the real MIDI data was 31%, while that of BLEU was 79%. The lesser the ratio, the greater the difference between the real MIDI data and generated MIDI data. This implies that the proposed method quantified the gap while accurately identifying real and generated MIDI data.

1. Introduction

With rapid developments in the field of artificial intelligence (AI), deep learning has been implemented in many areas. Deep learning [1,2] is utilized for extracting hidden features of data, such as texts, images, and sounds, and then learning the inherent rules from the hidden features. In deep learning, neural networks [3,4] simulate the human brain for analysis and learning data, which imitates the data interpretation mechanism of the human brain for proposes such as data mining [5], machine translation [6], multimedia learning [7], image reconstruction [8], recommendation [9], and speech technology [10]. Recently, the potential of deep learning in the field of music has been explored and has applications such as genre classification [11,12,13], music recommendation [14,15], and music generation [16,17]. Deep-learning-based applications can be used to compose music even without the knowledge of music theory.
However, there is a need to evaluate the quality of the generated musical instrument digital interface (MIDI) data. These data are normally evaluated using their similarity to real MIDI data by tests such as the Turing test [18], which subjectively evaluates the data using parameters such as pitch distances, chord rates, tone spans, drum patterns, etc. There have been other attempts to replace subjective human assessments by objective MIDI data evaluation approaches based on statistics and algorithms [19,20,21,22]. As a large number of general descriptive parameters [23] for the objective MIDI data evaluation approach have to be set manually, there approaches have some limitations in generalization and are challenging to apply to large datasets. General descriptive parameters refer to descriptions of musical features that are set as evaluation metrics, including pitch, pitch distance, chord rate, pitch span, drum pattern, etc.
MIDI data evaluations are categorized into subjective evaluation and objective evaluation. Most subjective evaluation approaches follow the Turing test, which is used to determine whether MIDI data are composed by a human or using deep learning. To this end, evaluating the quality of the MIDI data with subjective evaluations utilizing query metrics based on musical theory is critical [24]. However, subjective evaluation of MIDI data results in prejudiced outcomes, in which different people will achieve distinct evaluation results when evaluating the same MIDI data, and it is time-consuming as well.
The objective evaluation of MIDI data was introduced as a tool for performing subjective evaluation. Numerous studies have utilized objective evaluations of music [19,20,21,22,25,26], classified into the following types. The first type is statistical metric [19,20,21,22], which evaluates target samples based on the common features or value ranges obtained by statistical analysis on reference data. Statistical metric goes along with general information about the music domain, such as pitch range, duration range, polyphonic rate, and drum pattern. Statistical metric utilizes general knowledge of the music domain to solve the multi-criteria features and evaluation problems of MIDI data generation tasks [16,17]. Specifically, statistical metric integrates knowledge in music and enables detailed assessments based on music features. For example, MuseGAN [19] applies statistical analysis to evaluate MIDI data, where evaluation metrics include: (1) the ratio of empty bars (EB)—the ratio of bars without notes to the total number of bars (EB empty bars in music indicates to performer that they have nothing to play); (2) used pitch classes (UPC)—the number of scale tones used per bar (scales tones are from 0 to 12); (3) the ratio of “qualified” notes (QN)—a note no shorter than three time steps to be qualified and is indicative of whether the music is overly fragmented; (4) drum pattern (DP)—the ratio of notes in 8-beat or 16-beat patterns; and (5) pitch distance (TD)—the measure of the distance between a pair of tracks. Continuous RNN-GAN (C-RNN-GAN) [20] is a music generation approach based on continuous recurrent neural networks (RNN) with generative adversarial networks (GAN). The evaluation metrics of this approach are statistical. There are four metrics: (1) tone span—the number of the steps of the half-tone between the lowest tone and the highest tone in a sample; (2) polyphony—measure of how often several tones is played simultaneously; (3) scale consistency—finding the pitch of scale that best matches the standard scale to calculate scale consistency; and (4) repetitions—measure of the number of repetitions of a short subsequence. The single-step approach to musical tempo estimation [21] is used to evaluate single-step tempo directly from spectral features based on convolutional neural network (CNN) [27], which is a feedforward neural network with deep structure that includes convolutional computation. Multi-pitch detection, voice separation, metrical alignment, note value detection, and harmonic analysis (MV2H) [22] based on musical knowledge are introduced. Statistical metrics exhibit considerable interpretability and versatility as well as effectiveness. However, statistical metrics are complex and manually set; these statistical metrics cannot cover the features of MIDI data globally. Another limitation of these statistical metrics is that excellent performance on one criterion does not guarantee excellent performance on other criteria.
The second type is the probabilistic metric [25,26], which calculates probability of target samples as score for the evaluation by analyzing reference data. Probabilistic metric is based on likelihood or density estimation without any domain knowledge about music. The difference compared with statistical metric is that probabilistic metric tends to consider features comprehensively rather than separately. Recently, the probabilistic metric has been increasingly used in MIDI data generation tasks to evaluate the quality of the generated MIDI data. It entails analyzing MIDI data features without general descriptive parameters. For example, COCONET [25], a frame-wise evaluation approach, was introduced to calculate the log-likelihood between real and generated MIDI data at each time step. Log-likelihood is the natural logarithm of the likelihood, which models the joint probability of observed data to estimate the probability of the unknown data. Even with an increase in sample size, log-likelihood exhibits excellent convergence and low computational complexity. Bilingual evaluation understudy (BLEU) metric [26] was first used in machine translation, and it is currently most widely used in the field of music evaluation. BLEU is used to model the fitting of discrete piano key patterns and is advantageous owing to its fast computation and low computational costs.
In this paper, the enhanced evaluation method of MIDI data based on random masking and sequence-to-sequence (Seq2Seq) model [28] with attention mechanism [29] was proposed to evaluate MIDI data automatically without general descriptive parameters, where random masking is a common preprocessing approach to mask input sequence randomly for encoders and Seq2Seq implements the conversion from one sequence to another sequence. The proposed method is classified into two phases: the training and execution phases. The training phase consists of preprocessor [30], Seq2Seq model trainer, and indices equalizer. In the training phase, the Seq2Seq model is trained to extract hidden features using real MIDI data. To improve the feature extraction capability of the Seq2Seq model trainer, a preprocessor is used to convert notes to vectors and mask real MIDI data. Finally, the indices equalizer calculates the accuracy. The execution phase consists of the preprocessor, Seq2Seq model executer, and score calculator. In the execution phase, the preprocessor and Seq2Seq model executer are joined to calculate an evaluation score. First, the preprocessor is used to convert notes to vectors and mask the generated MIDI data, similar to the training phase. Next, the trained Seq2Seq model is used within the Seq2Seq model executer, which extracts hidden features. Finally, the score calculator calculates an evaluation score. The main contributions of the proposed method are as follows:
(1)
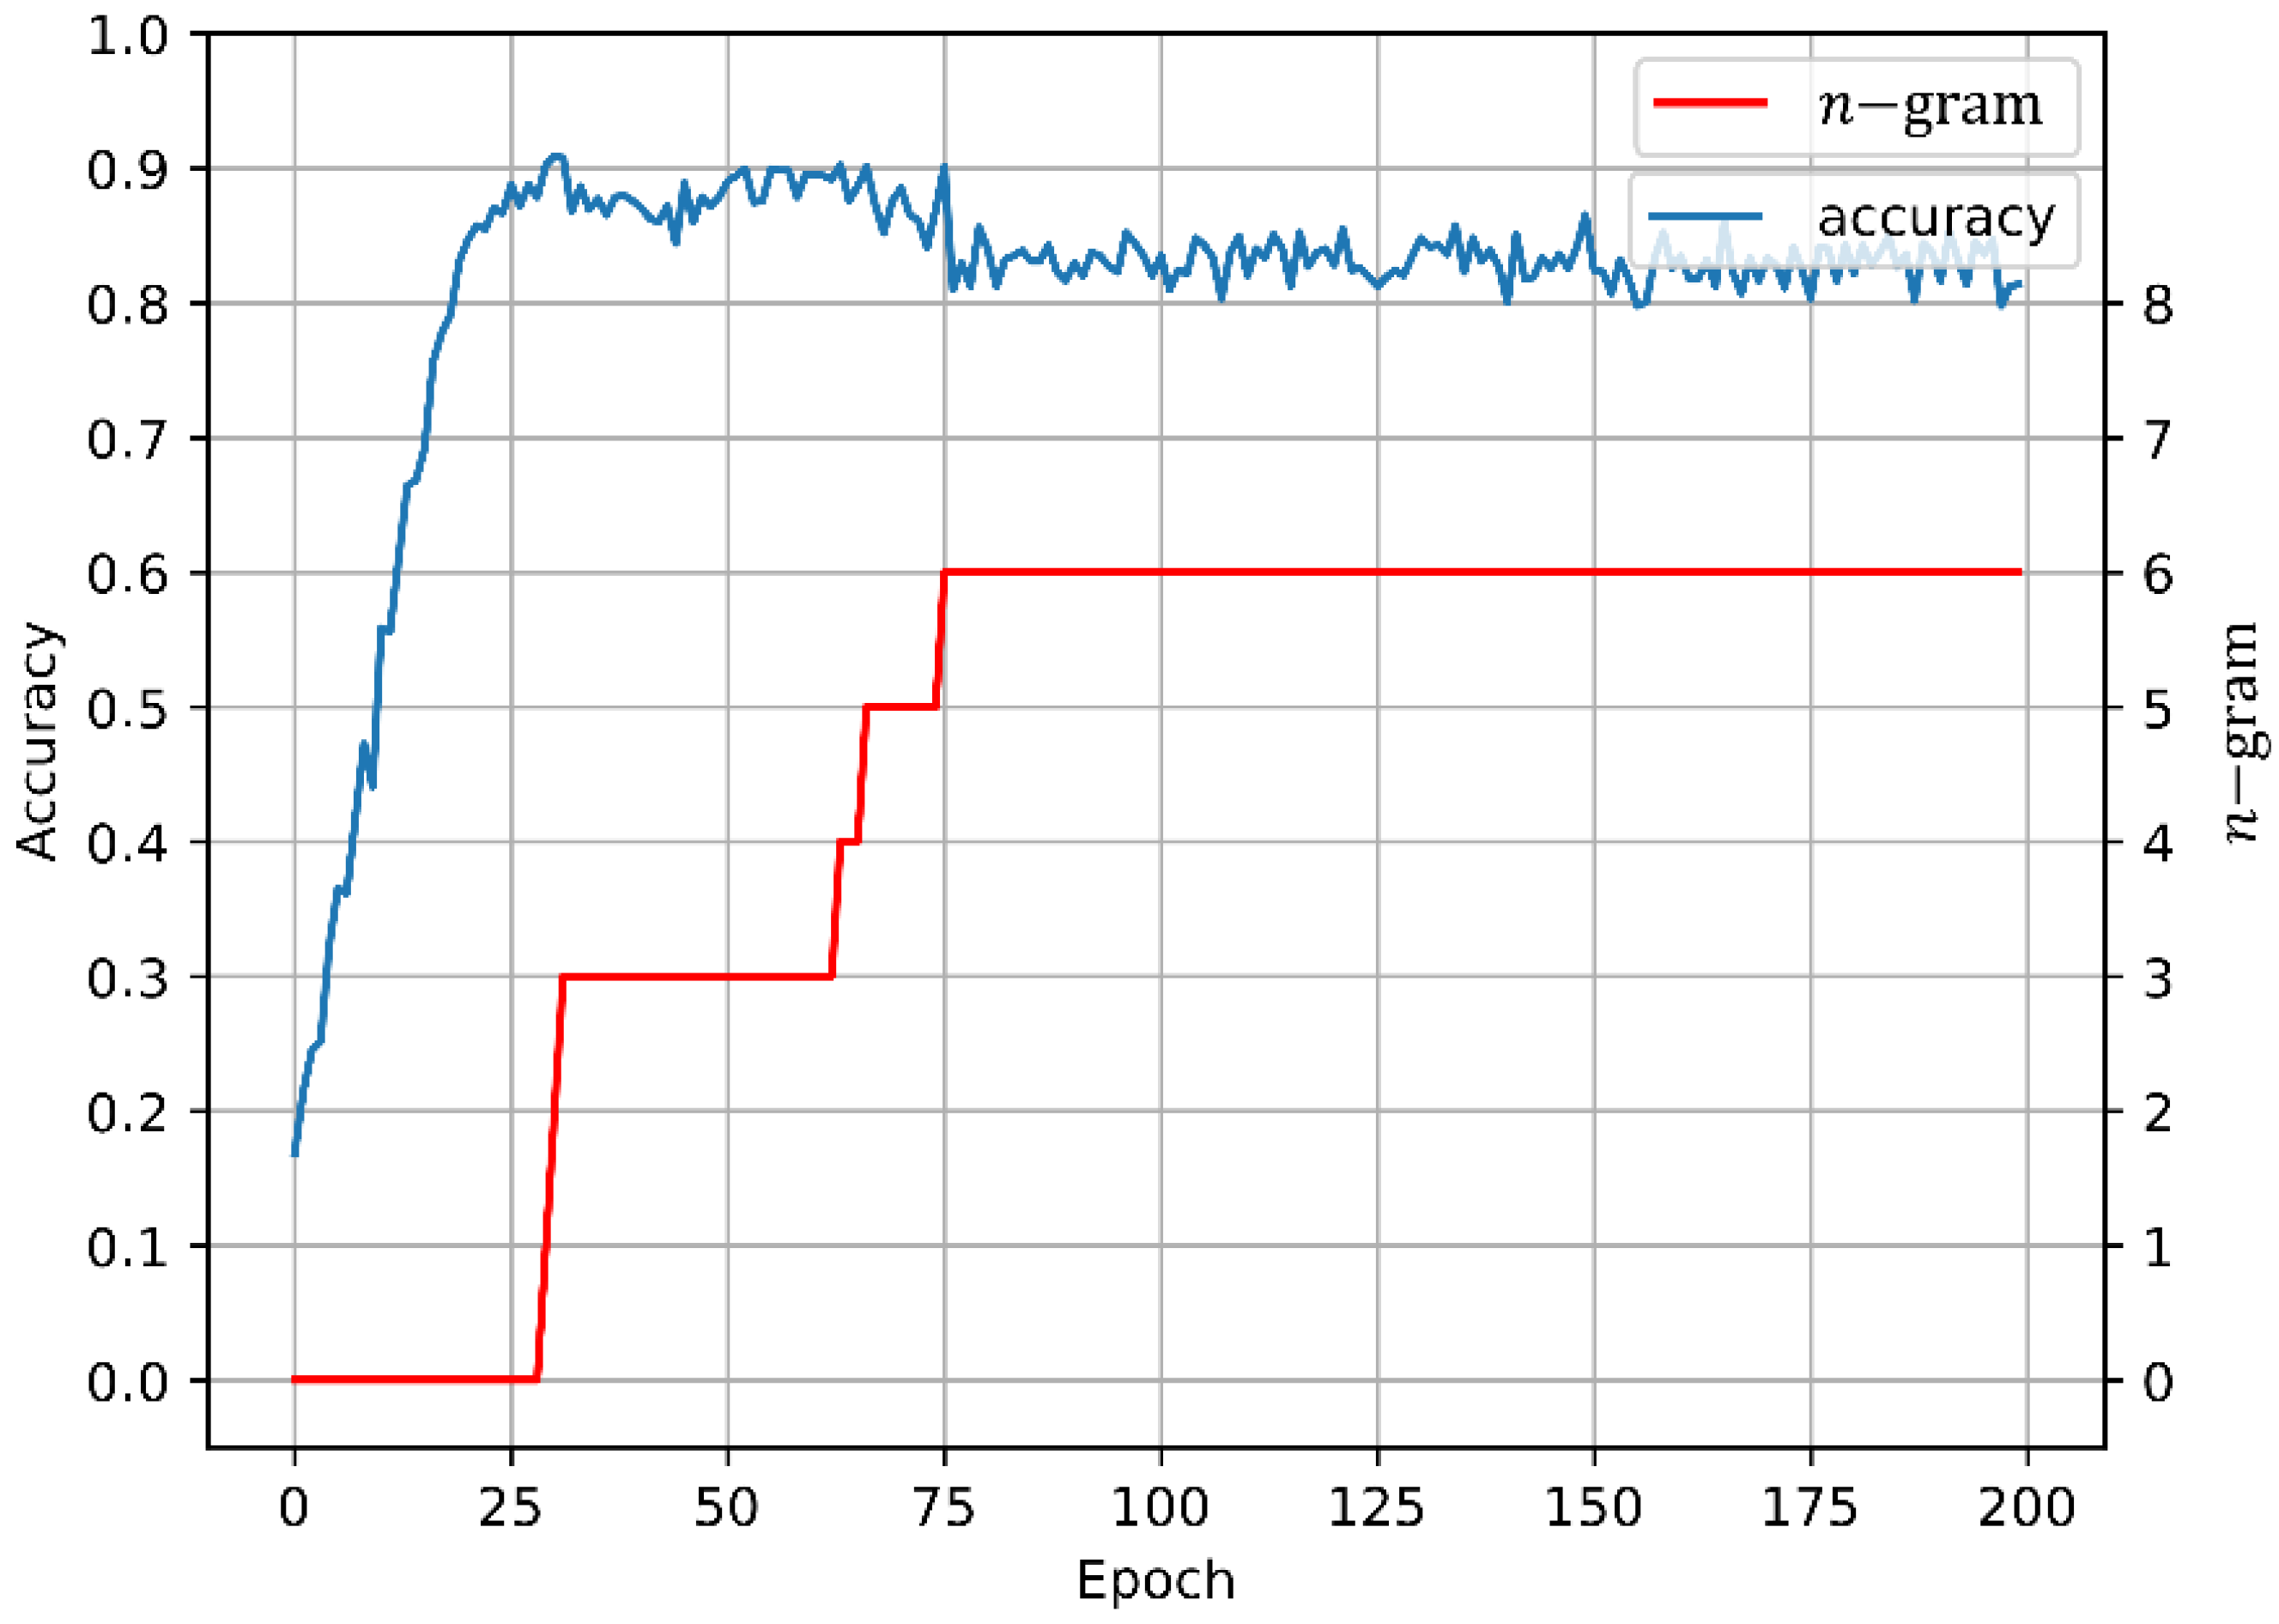
When the accuracy of estimating the masked part of the masked sequence reaches the threshold, the coverage area of the mask is expanded, thus prompting the Seq2Seq model to estimate more unknowns with less information.
(2)
In the enhanced evaluation method, the Seq2Seq model and attention mechanism are used; the ability of the model to be used globally is critical.
(3)
The random mask processor and Seq2Seq model analyze the musical features of the MIDI data without manual setting of the general descriptive parameters. Hence, we achieve automatic evaluation of the quality of the generated MIDI data.

2. Related Works

In this section, the core categories of MIDI data objective evaluation approaches, such as statistical metrics [19,20,21,22] and probabilistic metrics [25,26,31], used in recent MIDI data generation studies are discussed in detail.

2.1. MIDI Data Objective Evaluation Approaches

Statistical metrics denote various human interpretable standard metrics, also called statistical descriptors of music, which were introduced to address multi-criteria features and evaluation problems of MIDI data generation systems [32]. Statistical criteria are defined by the range of values for each feature summed up by analyzing real MIDI data. Specifically, these metrics integrate musical knowledge as features, such as pitch range, duration range, polyphonic rate, and drum pattern. These metrics can be evaluated in detail based on musical feature rules. For example, MuseGAN [19] introduced some intra-track and inter-track objective metrics (EB, UPC, QN, DP, and TD) for evaluating MIDI data. In C-RNN-GAN [20], rhythm-related (modeling of polyphony, scale consistency, repetitions, and tone span) metrics were used to evaluate the generated MIDI data. CNN can improve music information retrieval performance for procedures, such as single-step tempo estimation [21]. In automatic music transcription (AMT), MV2H [22] was introduced for both multi-pitch detection and musical analysis. Statistical metrics in which domain knowledge is considered exhibits not only interpretability but also versatility and effectiveness. However, music rules are diverse and changeable, and hence, selecting suitable statistical metrics can be challenging. Additionally, these metrics cannot cover the global features of MIDI data. Another limitation of these metrics is that excellent performance on one criterion cannot guarantee similar performance on other criteria. The proposed method is based on probabilistic metric, which can be used to automatically analyze related musical features without general descriptive parameters to improve this problem. For example, COCONET [25] was evaluated based on log-likelihood, which exhibits excellent convergence and low computational cost. BLEU [26] is one of the most popular metrics for evaluating Seq2Seq tasks, whose goal is conversion from one sequence to another sequence in the domain of machine translation, text summarization, and chatbot. BLEU is a computationally fast and low-cost approach. However, its generalization ability and performance are not satisfactory. A variant of the fundamental frequency ( f 0 ) [31] was proposed, in which an improvement over the existing single f 0 metric was proposed. For the variant of f 0 , it was possible to represent the estimated voicing as a continuous likelihood instead of a binary quantity, and a weighting on pitch accuracy was introduced. To assess the accuracy of the estimation of f 0 , a common strategy of evaluating the output of the algorithm against manually annotated references was adopted. However, manual generation of f 0 annotations is laborious and sometimes not feasible, which further necessitates automatic approaches.

2.2. Comparison of Objective MIDI Data Evaluation Approaches

Table 1 details the differences between the existing objective MIDI data evaluation approaches and the proposed method. MIDI data objective evaluations were compared based on four items: (1) metric type—statistical or probabilistic; (2) metrics—what evaluation criteria or approaches were used; (3) general descriptive parameters—indicative of whether there was manual setting of general descriptive parameters; and (4) global consideration—whether they considered and analyzed based on global features. Traditional MIDI data objective evaluation approaches mandate setting of general descriptive parameters and rules. However, the proposed method evaluates MIDI data by automatically analyzing MIDI data features without setting general descriptive parameters. In addition, the Seq2Seq model is based on an attention mechanism, which is a mechanism that can focus on important information by considering global contents.

3. Enhanced Evaluation Method

In this section, an enhanced evaluation method was proposed to objectively evaluate the generated MIDI data composed using AI models. The proposed method is an evaluation method that automatically extracts musically meaningful features.

3.1. Overview

The enhanced evaluation method is categorized into two phases: the training phase and execution phase. As illustrated in Figure 1, the training phase consists of three parts: the preprocessor, Seq2Seq model trainer, and indices equalizer. In the preprocessor, real MIDI data are converted into bar sequence c using a note converter by considering the notes in each bar. Next, the bar sequence c is converted into the input index sequence s E and the target index sequence s D by the index converter, where s E is used as the input for the encoder, and s D is used as the input for the decoder after random masking. Finally, the random mask processor, whose function is to mask the random part of a sequence, masks each index of the target index sequence s D and outputs the masked sequence m D .
In the Seq2Seq model trainer, the encoder and decoder of the Seq2Seq model are trained. The input of the encoder is the input index sequence s E . The encoder extracts the hidden feature h from s E . The hidden feature h contains the relationship between the index and adjacent indices. The inputs of the decoder are masked sequence m D obtained from preprocessor and the hidden feature h . The goal of decoder is to estimate the masked part of m D based on h and output the estimated sequence e .
In the indices equalizer, the accuracy a is calculated using the accuracy calculator by comparing each index in the same position of the estimated sequence e and the target index sequence s D . As the number of matched indices increases, the accuracy a also increases. Higher accuracy denotes that the decoder of the Seq2Seq model is trained accurately to estimate the indices of masked bars in masked sequence m D based on the hidden feature extracted from the encoder of the Seq2Seq model. The most critical aspect of the training phase is enabling the Seq2Seq model to gradually estimate the indices of masked bars based on fewer indices of unmasked bars. As the accuracy a reaches a threshold, the number of the indices of masked bars in masked sequence m D increases, which means that the proportion of the masked area increases in the random mask processor. In the random mask processor, n-gram [33] is used here to represent contiguous masked bars, where the gram denotes a masked bar, and n indicates the number of masked bars.
As displayed in Figure 2, the execution phase consists of three parts: the preprocessor, Seq2Seq model executer, and score calculator. In the preprocessor, generated MIDI data are converted into the masked sequence m D , similar to the training phase. However, in this preprocessor, the proportion of masking is fixed using the final parameter of the training phase. To improve the evaluation performance, one of the masking strategies is selected to be utilized on the generated MIDI data to attain a masked sequence.
In the Seq2Seq model executer, the encoder and decoder in the trained Seq2Seq model are used to estimate the indices of masked bars in masked sequence m D . The encoder receives the input index sequence s E as the input to extract hidden feature h’. Each masked sequence m D and extracted hidden feature h’ are passed to the decoder. In the decoder, SoftMax function [34] is used to output an estimated probability distribution p . Specifically, the SoftMax function is an activation function, which can normalize the output of the network to a probability distribution.
In the score calculator, instead of comparing the target index sequence s D with the estimated sequences e’, the estimated probability distribution p is compared with the target index sequence s D to ensure an accurate evaluation score, as the note combination in music is non-unique and changeable. A particular note can be combined with various notes in numerous approaches. Therefore, probability distributions rather than estimated sequence e’ are used as the criteria when calculating an evaluation score u. To compare the target index sequence s D with the estimated probability distribution p using the probability distribution comparer, the target index sequence s D is converted into a vector v D , which exhibits the same dimension as the estimated probability distribution p through one-hot converter, based on one-hot encoding [35]. It converts the index into a one-hot vector, and the one-hot vector consists of one bit with a value 1 and all other bits with value 0. The higher the evaluation score u is, the more superior the quality of the generated MIDI data.

3.2. Preprocessor

For the preprocessor, real MIDI data are inputted for the training phase and generated MIDI data for the execution phase. We assume that only one melody track exists in each MIDI data. Multiple melodies should be considered in future studies. As displayed in Figure 3, real MIDI data or generated MIDI data are changed into a bar sequence c of the training phase or a bar sequence c of the execution phase by the note converter. Each element of a bar sequence, c or c , contains the information of all notes of one bar. During the training phase, the bar sequence c is converted into two index sequences by the index converter. The two index sequences are input index sequence s E or the target index sequence s D .
During the execution phase, the bar sequence c is converted into the input index sequence s E or the target index sequence s D , as in the case of the training phase. Finally, the target index sequence s D or s D is masked by the random mask processor; therefore, masked sequences m D or m D are obtained. The masked bars are determined by the n-gram, which is controlled by accuracy during the training phase.
The conversion process of the note converter is detailed in Figure 4. The real MIDI data or generated MIDI data are represented by PianoRoll [36]. The vertical axis represents pitches, and the horizontal axis represents the durations of the corresponding pitches. Each bar consists of four columns in the case of 4/4 beats, and each column represents a duration of a quarter note. We only considered the MIDI data in 4/4 beats and will focus on other beats in the future. In the bar sequence c or c, the smallest units we considered in each bar are determined to be 1/16 beats; therefore, the length of each bar is 16. Each element in a bar of the bar sequence c or c represents a pitch and an octave. In the “D4”, “D” represents a pitch and “4” an octave.
In the index converter, the bar sequences c or c are converted to the index sequences s or s’, respectively, based on the note-index lookup dictionary, as presented in Table 2. Each note that appears in real MIDI dataset exhibits a unique index in the note-index lookup dictionary. Furthermore, “Mask” is set to −1 to facilitate the masking operations of bar sequence c or c’. Figure 5 depicts how bar sequence c or c’ is converted to input index sequences ( s E or s E ) and target index sequence ( s D or s D ) by using the note-index lookup dictionary.
In the random masking processor, the masking strategy with n-gram is adopted on target index sequence s D or s D . Therefore, for masking strategy, the masked sequence m D or m D is obtained, as displayed in Figure 6. The n of n-gram represents the number of masked bars. Masked bars in masked sequence m D or m D , which are represented by gray color, and the indices of masked bars are replaced by −1, where −1 represents the index of the “Mask”.

3.3. Seq2Seq Model Trainer

Using the Seq2Seq model trainer, a Seq2Seq model is trained by optimizing itself considering its model generalization as below. As displayed in Figure 7, the goal of Seq2Seq model trainer is to train a Seq2Seq model. In the Seq2Seq model trainer during the training phase, the encoder receives the input index sequence s E as the input and outputs the hidden feature h. Next, the output of encoder and masked sequence m D are passed to the decoder, which then outputs estimated sequence e.
As displayed in Figure 8, the encoder of the Seq2Seq model consists of the embedding layer and encoder block. In the embedding layer, position sequence z or z’ and input index sequence s E or s E are embedded into the encoder block. In the encoder block, residual connection is used for each multi-head attention layer and position-wise feedforward layer and merged through normalization layer. Multi-head attention mechanism [37] is an approach that uses multiple attention layers together, which calculates the attention map based on query and key and outputs the combination of the value and attention map. The position-wise feedforward layer is a linear layer to deal with the one-dimensional vector. The normalization layer normalizes each feature of the activations to zero mean and unit variance. Residual connection is a type of skip connection between layers instead of throughout. Finally, the encoder blocks outputs the h or h’, which is the hidden feature extracted from input index sequence s E or s E , respectively.
As displayed in Figure 9, the decoder of the Seq2Seq model consists of embedding layers and decoder blocks. In embedding layers, position sequence z or z’ and masked sequence m D or m D are embedded into decoder blocks. The decoder blocks exhibit a structure similar with the encoder block. However, the difference is that two multi-head attention layers are used to receive the embedded features and the output h or h’, respectively. Similar to the encoder block, residual connections are also used in the decoder block for each multi-head attention layer and position-wise feedforward layer and merged through the normalization layer. Finally, the linear layer is connected to the decoder block that outputs the result. During the execution phase, the estimated probability distribution p is directly output through the linear layer with a SoftMax activation function. However, in the training phase, estimated probability distribution p is also passed into the Argmax function [38] to obtain the estimated sequence e, where Argmax function finds the index, which is an indicator of a pitch, of the maximum value in probability distribution.
The encoder and decoder are optimized by the Equation (1):
L = [ q log p + ( 1 q ) log ( 1 p ) ]
where L is cross-entropy loss. q is one-hot encoding vector of target index sequence s D or s D , and p is estimated probability distribution output by the linear layer with SoftMax activation function.
The proposed method can be easily transferred from small to large datasets while training. Compared with other traditional evaluation approaches, it exhibits generalization given that the proposed model does not need to be reconstructed and does not need to reset general descriptive parameters while expanding datasets.

3.4. Seq2Seq Model Executer

As displayed in Figure 10, in the Seq2Seq model executer, the trained Seq2Seq model is utilized to evaluate generated MIDI data. The encoder extracts hidden feature h’ from the input index sequence s E . The masked sequence m D obtained from the preprocessor and the hidden feature h’ are passed into the decoder. Numerous differences exist between the Seq2Seq model executer and Seq2Seq model trainer of the decoder. The decoder in the Seq2Seq model executer just outputs the estimated probability distribution p by the SoftMax function without the Argmax function. The estimated probability distribution p is obtained by the decoder based on hidden feature h’ and the masked sequence m D . Finally, the estimated probability distribution p and the target index sequence s D are passed into the score calculator described in Section 3.6.

3.5. Indices Equalizer

The indices equalizer is used to calculate the accuracy a based on the estimated sequence e and the target index sequence s D as expressed in the following sequence:
a i = 1 L f ( τ i , η i ) L   w h e r e   f ( τ i , η i )   i s   { f ( τ i , η i ) = 1   ( τ i = η i ) f ( τ i , η i ) = 0   ( τ i η i )
where L is the length of sequences. The indices equalizer counts the number of equal indices within the index sequence s and estimated sequence e at the corresponding position,   i ( 1 ,   L ) .   τ i ( τ 1 ,   τ 2 , , τ L s D ) and η i ( η 1 ,   η 2 , , η L e ) are one index that belong to the target index sequence s D and the estimated sequence e. The accuracy a is calculated by using the indices equalizer, which indicates the degree of correctness of the estimation of the generated MIDI data.

3.6. Score Calculator

The evaluation score n g r a m is calculated based on probability distribution by the tanh function as follows:
n g r a m = 1 t a n h ( i = 1 N j = 1 U ( P i , j e P i , j t ) 2 N )
where N is the number of masked notes, and   U is the number of unique notes in the real MIDI dataset. Each set of pitch differs from that of others. Here, P i , j e   is the probability distribution of the i th masked note estimation, and P i , j t   is the target one-hot vector of the note, which is in same position with i th masked note.

4. Experiments

The section describes the results of the experiment conducted on the proposed objective MIDI data evaluation method. First, the Seq2Seq model is trained based on a real MIDI dataset. Next, the trained Seq2Seq model is used to evaluate the generated MIDI data. Simultaneously, real MIDI data and random MIDI data are evaluated for comparing with the proposed method. BLEU [26] is widely used for objective evaluation of music. Therefore, in this study, BLEU was used as a baseline approach for the comparison.

4.1. Experimental Environment

MIDI is a communication standard format for storing musical information. The experiments of the proposed method were conducted on OpenEWLD, which is a subset of the Wikifonia Leadsheet Dataset (EWLD) [39] reduced to only copyright-free songs. OpenEWLD is an extraction of 502 songs in MusicXML format from EWLD. Converting between MusicXML format and MIDI format is highly convenient.
In the training phase, for verifying the performance of the Seq2Seq model, accuracy and loss values were obtained to determine whether the Seq2Seq model performed satisfactorily.
Table 3 details the hyper parameters used during the training phase. The input dimension and output dimension are 38, representing the number of unique pitches. In the MIDI format, 128 unique pitches exist, but only 38 unique notes appeared in the real MIDI dataset. The embedding dimension was set to 256. The encoder block number and decoder block number were set to 3. The encoder head and decoder head were set to 8, which indicate that each multi-head attention layer had eight heads in the encoder and decoder. The encoder position-wise feedforward dimension and decoder position-wise feedforward dimension were set to 512, indicating the dimension of the encoder position-wise feedforward layer and decoder position-wise feedforward layer. To prevent overfitting, encoder dropout and decoder dropout were set to 0.1 in the encoder and decoder. The learning rate was set to a small value of 0.0005, and the epoch was set as 200.
The experiments were performed using Windows 10, i5-10400, NVIDIA GeForce GTX 3080 10 GB, and DDR4 32 GB. The model of the proposed method was developed with Python. The enhanced evaluation method for the generated MIDI data was implemented with PyTorch.

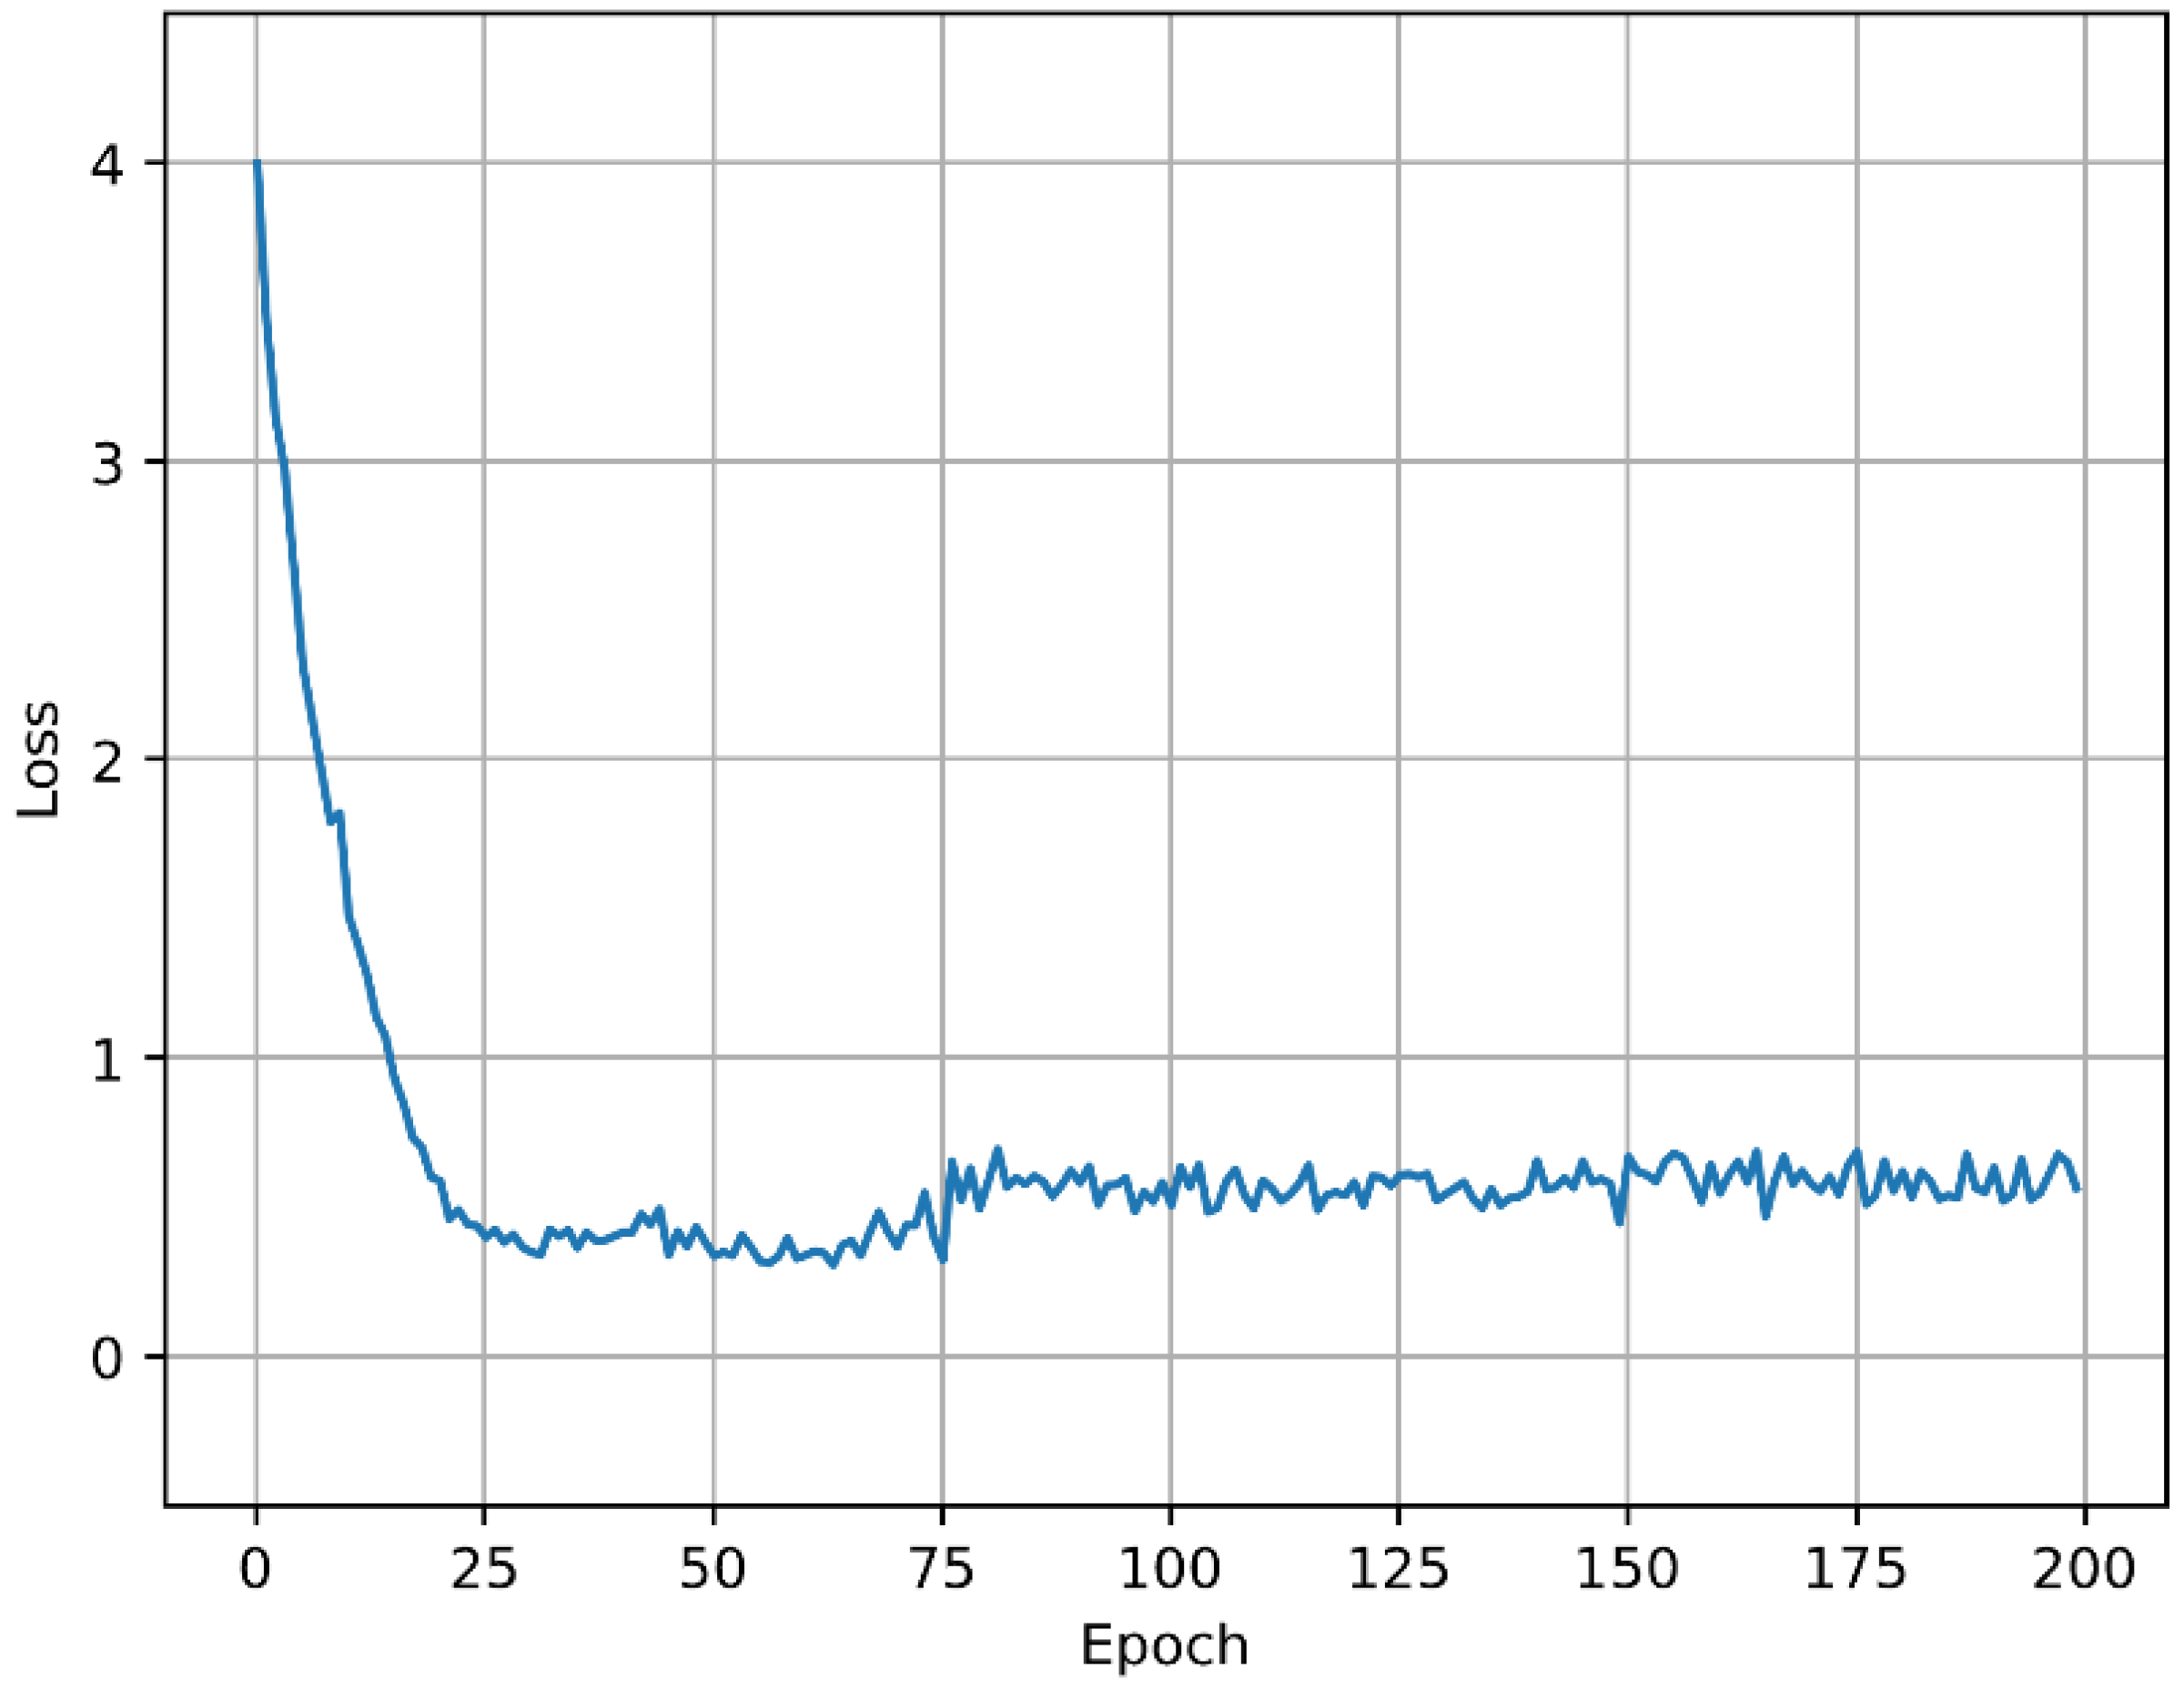
4.2. Experimental Results

As displayed in Figure 11, the change of n in n-gram was controlled by evaluating accuracy. The proposed method set the threshold as 90% for accuracy during the training phase. Whenever the accuracy breached the 90% threshold, n was increased by 1. Initially, the accuracy increased until it reached 88% at the 28th epoch. The accuracy first reached 90% in the 29th epoch, and the n increased by 1. At the 30th epoch, the accuracy reached 90% again, and the n increased to 2. Finally, the n remained at 6, and the accuracy could not reach 90% again. Therefore, when n is 5, the estimation is accurate, and this value is used in the evaluation score.
Figure 12 displays the loss of the Seq2Seq model during the training phase. The loss decreased as the accuracy increased (Figure 10). Similar to accuracy, the increase or decrease of loss is closely related to the change of n in n-gram. When the n increased, the loss increased significantly. After the 75th epoch, n reached 6, and the loss finally converged to approximately 0.55.
Figure 13 displays evaluation scores of the proposed method using real MIDI data, generated MIDI data, and random MIDI data. The proposed method and BLEU were used to evaluate 80 samples in each MIDI data from the test set. For random samples, the evaluation average score by the proposed method was 0.057. The results revealed that the proposed method achieved average evaluation scores of 0.59 for real samples and 0.18 for generated samples, in which evaluation scores of real MIDI data were always higher than generated MIDI data.
As displayed in Figure 14, for random samples, the average evaluation score by BLEU was 0.024. The average evaluation score of the BLEU for real samples was 0.48, and that of generated samples was 0.38. For BLEU, in majority of the cases, evaluation scores of generated samples were higher than that of real samples because BLEU was evaluated based on local fragments. Notably, the proposed method based on global consideration is reasonable. By calculating the gap between the real sample average evaluation scores and the generated average sample evaluation score, the proposed method was 0.41, and that by BLEU was 0.10. The ratios of the generated MIDI data average evaluation score to the real MIDI data average evaluation score were 31% and 79% for the proposed method and BLEU, respectively. The smaller the ratio, the more dissimilar the generated MIDI data were to the real MIDI data. Notably, the proposed method magnified the gap between real and generated samples, which can clearly identify two MIDI data types accurately.

5. Conclusions

In this study, an enhanced evaluation method for MIDI data based on random masking and Seq2Seq model was proposed. This method is intended to evaluate neither the creativity of musical works nor the aesthetics of the MIDI data composed by AI models. The model is used to analyze the features of MIDI data to evaluate their quality. Specifically, in the proposed method, the random mask processor should be used to mask MIDI data and train a Seq2Seq model to analyze the knowledge of basic MIDI data theory and analyze MIDI data features to evaluate the generated MIDI data quality automatically without general descriptive parameters. The proposed method could be used to overcome the limitations of subjective evaluation MIDI data. The BLEU was used as a comparative experiment to prove the feasibility of the proposed method. For real MIDI data and generated MIDI data, the average evaluation scores of the proposed method were 0.59 and 0.18, respectively; evaluation scores of real MIDI data were always higher than generated MIDI data. In BLEU, the average evaluation scores were 0.48 and 0.38, respectively. However, most of the time, evaluation scores of generated MIDI data of BLEU were higher than real MIDI data. The gap between real MIDI data average evaluation score and random MIDI data average evaluation score in the proposed method was 0.41, which implies that the ratio was 31%. However, BLEU was 0.10, and the ratio was 79%. The proposed method magnified the gap between real MIDI data and generated MIDI data and is able to distinguish the two types of MIDI data accurately.

Author Contributions

Conceptualization, Z.J., S.L. and Y.S.; methodology, Z.J., S.L. and Y.S.; software, Z.J. and S.L.; validation, Z.J., S.L. and Y.S.; formal analysis, Z.J., S.L. and Y.S.; data curation, Z.J. and S.L.; writing—original draft preparation, Z.J.; writing—review and editing, Z.J., S.L. and Y.S. All authors have read and agreed to the published version of the manuscript.

Funding

This work was supported by the Ministry of Education of the Republic of Korea and the National Research Foundation of Korea (NRF-2021R1F1A1063466).

Institutional Review Board Statement

Not applicable.

Informed Consent Statement

Not applicable.

Data Availability Statement

Data available in a publicly accessible repository that does not issue DOIs. Publicly available datasets were analyzed in this study. This data can be found here: [https://github.com/00sapo/OpenEWLD, accessed on 23 June 2022].

Conflicts of Interest

The authors declare no conflict of interest.

References

  1. LeCun, Y.; Bengio, Y.; Hinton, G. Deep Learning. Nature 2015, 521, 436–444. [Google Scholar] [CrossRef] [PubMed]
  2. Schmidhuber, J. Deep Learning in Neural Networks: An Overview. Neural Netw. 2015, 61, 85–117. [Google Scholar] [CrossRef] [PubMed] [Green Version]
  3. Louati, H.; Bechikh, S.; Louati, A.; Hung, C.C.; Said, L.B. Deep Convolutional Neural Network Architecture Design as A Bi-Level Optimization Problem. Neurocomputing 2021, 439, 44–62. [Google Scholar] [CrossRef]
  4. Saha, S.; Gan, Z.; Cheng, L.; Gao, J.; Kafka, O.L.; Xie, X.; Li, H.; Tajdari, M.; Kim, H.A.; Liu, W.K. Hierarchical Deep Learning Neural Network (HiDeNN): An Artificial Intelligence (AI) Framework for Computational Science and Engineering. Comput. Methods Appl. Mech. Eng. 2021, 373, 113452–113480. [Google Scholar] [CrossRef]
  5. Haoxiang, W.; Smys, S. Big Data Analysis and Perturbation Using Data Mining Algorithm. JSCP 2021, 3, 19–28. [Google Scholar] [CrossRef]
  6. Zheng, Z.; Zhou, H.; Huang, S.; Chen, J.; Xu, J.; Li, L. Duplex Sequence-To-Sequence Learning for Reversible Machine Translation. In Proceedings of the 35th Advances in Neural Information Processing Systems (NeurIPS), Online, 6–14 December 2021; pp. 21070–21084. [Google Scholar]
  7. Wong, R.M.; Adesope, O.O. Meta-Analysis of Emotional Designs in Multimedia Learning: A Replication and Extension Study. Educ. Psychol. Rev. 2021, 33, 357–385. [Google Scholar] [CrossRef]
  8. Yu, D.; Ji, S.; Liu, J.; Wei, S. Automatic 3D Building Reconstruction from Multi-View Aerial Images with Deep Learning. ISPRS J. Photogramm. Remote Sens. 2021, 171, 155–170. [Google Scholar] [CrossRef]
  9. Sivaramakrishnan, N.; Subramaniyaswamy, V.; Viloria, A.; Vijayakumar, V.; Senthilselvan, N. A Deep Learning-Based Hybrid Model for Recommendation Generation and Ranking. Neural. Comput. Appl. 2021, 33, 10719–10736. [Google Scholar] [CrossRef]
  10. Dokuz, Y.; Tufekci, Z. Mini-Batch Sample Selection Strategies for Deep Learning Based Speech Recognition. Appl. Acoust. 2021, 171, 107573. [Google Scholar] [CrossRef]
  11. Choi, K.; Fazekas, G.; Sandler, M.; Cho, K. Convolutional Recurrent Neural Networks for Music Classification. In Proceedings of the 2017 IEEE 42nd International Conference on Acoustics, Speech and Signal Processing (ICASSP), New Orleans, LA, USA, 5–9 March 2017; pp. 2392–2396. [Google Scholar]
  12. Qiu, L.; Li, S.; Sung, Y. DBTMPE: Deep Bidirectional Transformers-Based Masked Predictive Encoder Approach for Music Genre Classification. Mathematics 2021, 9, 530–547. [Google Scholar] [CrossRef]
  13. Qiu, L.; Li, S.; Sung, Y. 3D-DCDAE: Unsupervised Music Latent Representations Learning Method Based on a Deep 3D Convolutional Denoising Autoencoder for Music Genre Classification. Mathematics 2021, 9, 2274–2290. [Google Scholar] [CrossRef]
  14. Cheng, Z.; Jialie, S.; Hoi, S.C. On Effective Personalized Music Retrieval by Exploring Online User Behaviors. In Proceedings of the 39th International Association for Computing Machinery Special Interest Group on Information Retrieval Conference on Research and Development in Information Retrieval (ACM SIGIR), Pisa, Italy, 17–21 July 2016; pp. 125–134. [Google Scholar]
  15. Costa, F.S.D.; Dolog, P. Collective Embedding for Neural Context-Aware Recommender Systems. In Proceedings of the 13th ACM Conference on Recommender Systems, Copenhagen, Denmark, 16–20 September 2019; pp. 201–209. [Google Scholar]
  16. Jiang, N.; Jin, S.; Duan, Z.; Zhang, C. RL-Duet: Online Music Accompaniment Generation Using Deep Reinforcement Learning. In Proceedings of the 34th AAAI Conference on Artificial Intelligence, New York, NY, USA, 7–12 February 2020; pp. 710–718. [Google Scholar]
  17. Li, S.; Jang, S.; Sung, Y. INCO-GAN: Variable-Length Music Generation Method Based on Inception Model-Based Conditional GAN. Mathematics 2021, 9, 387–403. [Google Scholar] [CrossRef]
  18. Ariza, C. The Interrogator as Critic: The Turing Test and the Evaluation of Generative Music Systems. Comput. Music J. 2009, 33, 48–70. [Google Scholar] [CrossRef]
  19. Dong, H.W.; Hsiao, W.Y.; Yang, L.C.; Yang, Y.H. MuseGan: Multi-Track Sequential Generative Adversarial Networks for Symbolic Music Generation and Accompaniment. In Proceedings of the 32nd AAAI Conference on Artificial Intelligence, New Orleans, LA, USA, 2–7 February 2018; pp. 34–41. [Google Scholar]
  20. Mogren, O. C-RNN-GAN: Continuous Recurrent Neural Networks with Adversarial Training. arXiv 2016, arXiv:1611.09904. [Google Scholar]
  21. Schreiber, H.; Müller, M. A Single-Step Approach to Musical Tempo Estimation Using a Convolutional Neural Network. In Proceedings of the 19th International Society for Music Information Retrieval Conference (ISMIR), Paris, France, 23–27 September 2018; pp. 98–105. [Google Scholar]
  22. McLeod, A.; Steedman, M. Evaluating Automatic Polyphonic Music Transcription. In Proceedings of the 19th International Society for Music Information Retrieval Conference (ISMIR), Paris, France, 23–27 September 2018; pp. 42–49. [Google Scholar]
  23. Friberg, A.; Schoonderwaldt, E.; Hedblad, A. Perceptual Ratings of Musical Parameters. J. Psychol. 1937, 49, 621–630. [Google Scholar]
  24. Asmus, E.P. Music Assessment Concepts: A Discussion of Assessment Concepts and Models for Student Assessment Introduces This Special Focus Issue. Music Eucators J. 1999, 86, 19–24. [Google Scholar] [CrossRef]
  25. Huang, C.Z.A.; Cooijmans, T.; Roberts, A.; Courville, A.; Eck, D. Counterpoint by Convolution. In Proceedings of the 18th International Society for Music Information Retrieval Conference (ISMIR), Suzhou, China, 23–27 October 2017; pp. 211–218. [Google Scholar]
  26. Papineni, K.; Roukos, S.; Ward, T.; Zhu, W.J. BLEU: A Method for Automatic Evaluation of Machine Translation. In Proceedings of the 40th Association for Computational Linguistics (ACL), Philadelphia, PA, USA, 6–7 July 2002; pp. 311–318. [Google Scholar]
  27. Krizhevsky, A.; Sutskever, I.; Hinton, G.E. ImageNet Classification with Deep Convolutional Neural Networks. In Proceedings of the 26th Advances in Neural Information Processing Systems (NeurIPS), Lake Tahoe, NV, USA, 3–8 December 2012; pp. 1097–1105. [Google Scholar]
  28. Huang, C.Z.A.; Vaswani, A.; Uszkoreit, J.; Shazeer, N.; Simon, I.; Hawthorne, C.; Dai, A.M.; Hoffman, M.D.; Dinculescu, M.; Eck, D. Music Transformer: Generating Music with Long-Term Structure. arXiv 2018, arXiv:1809.04281. [Google Scholar]
  29. Vaswani, A.; Shazeer, N.; Parmar, N.; Uszkoreit, J.; Jones, L.; Gomez, A.N.; Kaiser, L.; Polosukhin, I. Attention is All You Need. In Proceedings of the 31st Advances in Neural Information Processing Systems (NeurIPS), Long Beach, CA, USA, 4–9 December 2017; pp. 6000–6010. [Google Scholar]
  30. Devlin, J.; Chang, M.W.; Lee, K.; Toutanova, K. BERT: Pretraining of Deep Bidirectional Transformers for Language Understanding. arXiv 2018, arXiv:1810.04805. [Google Scholar]
  31. Bittner, R.M.; Bosch, J.J. Generalized Metrics for Single-f0 Estimation Evaluation. In Proceedings of the 20th International Society for Music Information Retrieval Conference (ISMIR), Delft, The Netherlands, 4–8 November 2019; pp. 738–745. [Google Scholar]
  32. Briot, J.P.; Hadjeres, G.; Pachet, F. Deep Learning Techniques for Music Generation--A Survey. arXiv 2017, arXiv:1709.01620. [Google Scholar]
  33. Brown, P.F.; Della Pietra, V.J.; Desouza, P.V.; Lai, J.C.; Mercer, R.L. Class-Based N-Gram Models of Natural Language. CL 1992, 18, 467–480. [Google Scholar]
  34. Bridle, J. Training Stochastic Model Recognition Algorithms as Networks Can Lead to Maximum Mutual Information Estimation of Parameters. In Proceedings of the 4th Advances in Neural Information Processing Systems (NeurIPS), Denver, CO, USA, 26–29 November 1990; pp. 211–217. [Google Scholar]
  35. Zhang, X.; Zhao, J.; LeCun, Y. Character-Level Convolutional Networks for Text Classification. arXiv 2015, arXiv:1502.01710. [Google Scholar]
  36. Walder, C. Modelling Symbolic Music: Beyond the Piano Roll. In Proceedings of the 8th Asian Conference on Machine Learning (ACML), Hamilton, New Zealand, 16–18 November 2016; pp. 174–189. [Google Scholar]
  37. Zhu, H.; Lee, K.A.; Li, H. Serialized Multi-Layer Multi-Head Attention for Neural Speaker Embedding. arXiv 2021, arXiv:2107.06493. [Google Scholar]
  38. Agarap, A.F. Deep Learning Using Rectified Linear Units (ReLU). arXiv 2018, arXiv:1803.08375. [Google Scholar]
  39. Simonetta, F.; Carnovalini, F.; Orio, N.; Rodà, A. Symbolic Music Similarity through a Graph-Based Representation. In Proceedings of the Audio Mostly on Sound in Immersion and Emotion, North Wales, UK, 12–14 September 2018; pp. 1–7. [Google Scholar]
Figure 1. Training phase of the enhanced evaluation method.
Mathematics 10 02747 g001
Figure 2. Execution phase of the enhanced evaluation method.
Mathematics 10 02747 g002
Figure 3. Preprocessor of the enhanced evaluation method, which consists of the note converter, index converter, and random mask processor.
Mathematics 10 02747 g003
Figure 4. Conversion process of the note converter.
Mathematics 10 02747 g004
Figure 5. Process of the index converter.
Mathematics 10 02747 g005
Figure 6. Masking strategy of the random masking processor.
Mathematics 10 02747 g006
Figure 7. Seq2Seq model trainer for the training phase.
Mathematics 10 02747 g007
Figure 8. Encoder of the Seq2Seq model.
Mathematics 10 02747 g008
Figure 9. Decoder of the Seq2Seq model.
Mathematics 10 02747 g009
Figure 10. Seq2Seq model executer for the execution phase.
Mathematics 10 02747 g010
Figure 11. Change in the n-gram and accuracy during the training phase.
Mathematics 10 02747 g011
Figure 12. Loss of the Seq2Seq model during the training phase.
Mathematics 10 02747 g012
Figure 13. Evaluation scores of the proposed method by using real MIDI data, generated MIDI data, and random MIDI data.
Mathematics 10 02747 g013
Figure 14. Evaluation scores of BLEU using real MIDI data, generated MIDI data, and random MIDI data.
Mathematics 10 02747 g014
Table 1. Differences between previous approaches and the proposed method.
Research WorkMetric TypeMetrics General
Descriptive Parameters
Global
Consideration
MuseGAN [19]StatisticalEB, UPC, QN, DP, TD
C-RNN-GAN [20]StatisticalPolyphony, Scale Consistency, Repetitions, Tone Span
MV2H [22]StatisticalVoice Separation, Multi-pitch Detection, Metrical Alignment, Note Value Detection, etc.
COCONET [25]ProbabilisticLog-likelihood
BLEU [26]ProbabilisticBLEU
The Proposed MethodProbabilisticSeq2Seq Model and Random Mask Processor
Table 2. Note-index lookup dictionary for the note converter.
Note/MaskIndex
Rest0
C31
C3#2
D33
D3#4
E35
F36
F3#7
G38
B536
Mask−1
Table 3. Hyper parameters during the training phase.
Hyper ParameterValue
Input dimension 38
Output dimension 38
Embedding dimension256
Encoder block number3
Decoder block number 3
Encoder head8
Decoder head8
Encoder position-wise feedforward dimension512
Decoder position-wise feedforward dimension512
Encoder dropout0.1
Decoder dropout0.1
Epoch200
Learning rate0.0005
Publisher’s Note: MDPI stays neutral with regard to jurisdictional claims in published maps and institutional affiliations.

