Article

Failure Transition and Validity of Brazilian Disc Test under Different Loading Configurations: A Numerical Study

1
School of Resources and Safety Engineering, Central South University, Changsha 410083, China
2
Deep Mining Laboratory, Shandong Gold Group, Yantai 264000, China
3
Shandong Province Key Laboratory of Deep Earth and Deep Sea Intelligent Mining, Shandong Gold Group, Yantai 264000, China
*
Author to whom correspondence should be addressed.
Mathematics 2022, 10(15), 2681; https://doi.org/10.3390/math10152681
Submission received: 23 June 2022 / Revised: 12 July 2022 / Accepted: 27 July 2022 / Published: 29 July 2022
(This article belongs to the Special Issue Computational Methods and Applications for Numerical Analysis)

Abstract

:
The Brazilian disc test is a popular tensile strength test method for engineering materials. The fracture behavior of specimens in the Brazilian disc test is closely related to the validity of the test results. In this paper, the fracture process of granite discs under different loading configurations is simulated by using a coupled finite–discrete element method. The results show that the maximum tensile stress value is located within 18 mm (0.7 times the disc radius) of the vertical range of the disc center under different loading configurations. In small diameter rods loading, the invalid tensile strength is obtained because the crack initiation and plastic strain is at the end of the disc. The crack initiation points of flat platen loading and curved jaws loading are all within the center of the disc, and the valid tensile strength can be obtained. The tensile strength test results under different loading configurations show that the error of small diameter rods loading is 13%, while the errors of flat platen loading and curved jaws loading are both 1%. The curved jaws loading is the most suitable for measuring the tensile strength of brittle materials such as rock, followed by flat platen loading. The small diameter rods loading is not recommended for the Brazilian test.

1. Introduction

The tensile strength of brittle materials such as rock is far less than the compressive strength. The initiation and development of a tensile crack is an important factor leading to brittle materials failure [1,2,3,4,5]. The brittle materials fail in tension under the uniaxial tension or Brazilian test [6,7,8]. In addition, the macroscopic shear cracks of brittle materials under uniaxial compression or dynamic impact are mainly caused by the development of internal tensile micro-cracks [9,10,11,12]. In order to measure the tensile strength of brittle materials, the Brazilian test was put forward by Carneiro and Akazawa [13,14]. At present, the Brazilian disc test is still a popular tensile strength test method because its specimen preparation and test procedures are much more convenient than the uniaxial tensile test [15,16,17,18,19].
The loading configuration for the Brazilian disc test were originally flat loading platens. In the Brazilian tensile test with flat loading platens, Hudson, Swab et al. observed that the crack initiation point and the maximum tensile strain of the Brazilian disc are frequently away from the center of the disc under flat platen loading [20,21]. It may lead to the invalid estimation of tensile strength because it does not accord with the assumptions of the Brazilian disc test and the Griffith criterion. As a supplement, the Brazilian tests with different loading configurations were proposed in the past. In addition to flat platen loading, the other two popular configurations are a small diameter rod and curved jaw loading. The small diameter rod loading can make the disc have a relatively complete splitting failure along the loading direction [22]. The curved jaw loading can reduce the shear stress concentration at the end of the disc [23].
Among the tensile strength test values, the tensile strength obtained by small diameter loading rod is the smallest, the tensile strength obtained by flat platen loading is the second, and the tensile strength obtained by curved jaw loading is the largest [24,25]. It should be noted that the tensile strength of the small diameter loading rod is significantly lower than that of the other two kinds of loading, and the tensile strength of curved jaw loading is only slightly higher than that of flat platen loading. According to the basic assumption of the Brazilian disc test recommended by ISRM, the crack initiation point must be at the location of maximum tensile stress [26]. That is, the valid tensile strength can be calculated only when the tensile failure occurs first at the position of maximum tensile stress under the peak load. In the Brazilian disc test under different loading configurations, the analytical solution and numerical simulation results show that the maximum tensile stress appears in a certain range of the center of the disc in the loading direction [27,28,29,30]. Yanagidani et al. observed that the crack originated in the center of the disc under flat platen loading through the strain gages as a crack detector [31]. Through numerical simulation and digital image correlation technology, Li and Stirling et al. [15,24,32] found that the maximum tensile strain occurs far away from the center of disc under small diameter rod loading and flat platen loading, even at the end of the disc, and the maximum tensile strain appears in the center of disc under curved jaw loading. There are still some debates about the validity of the Brazilian disc test under different loading configurations.
The tensile strength of materials is an important parameter for engineering stability analysis and is often obtained through Brazilian tests. Considering that the Brazilian tests of three loading configurations are widely used, some loading configurations may lead to an invalid tensile strength value of brittle materials. In general, the existing studies mainly evaluate the validity of the Brazilian test by the maximum tensile stress distribution and the crack initiation point. Few studies have considered the development of the damage zone or plastic strain in the disc. Some studies have shown that cracks originate in the fracture process zone (damage zone), which is an important basis for judging the initiation and propagation of cracks [33,34,35]. In this research, a coupled finite−discrete element method (FDEM) is used to study the crack propagation, stress field, and damage (plastic) zone of Brazilian discs under three loading configurations. The validity of three loading configurations is evaluated and some new insights into the Brazilian disc test are presented. This is helpful for testers to select the appropriate loading configuration to obtain an effective tensile strength value of brittle materials.

2. Numerical Method and Model
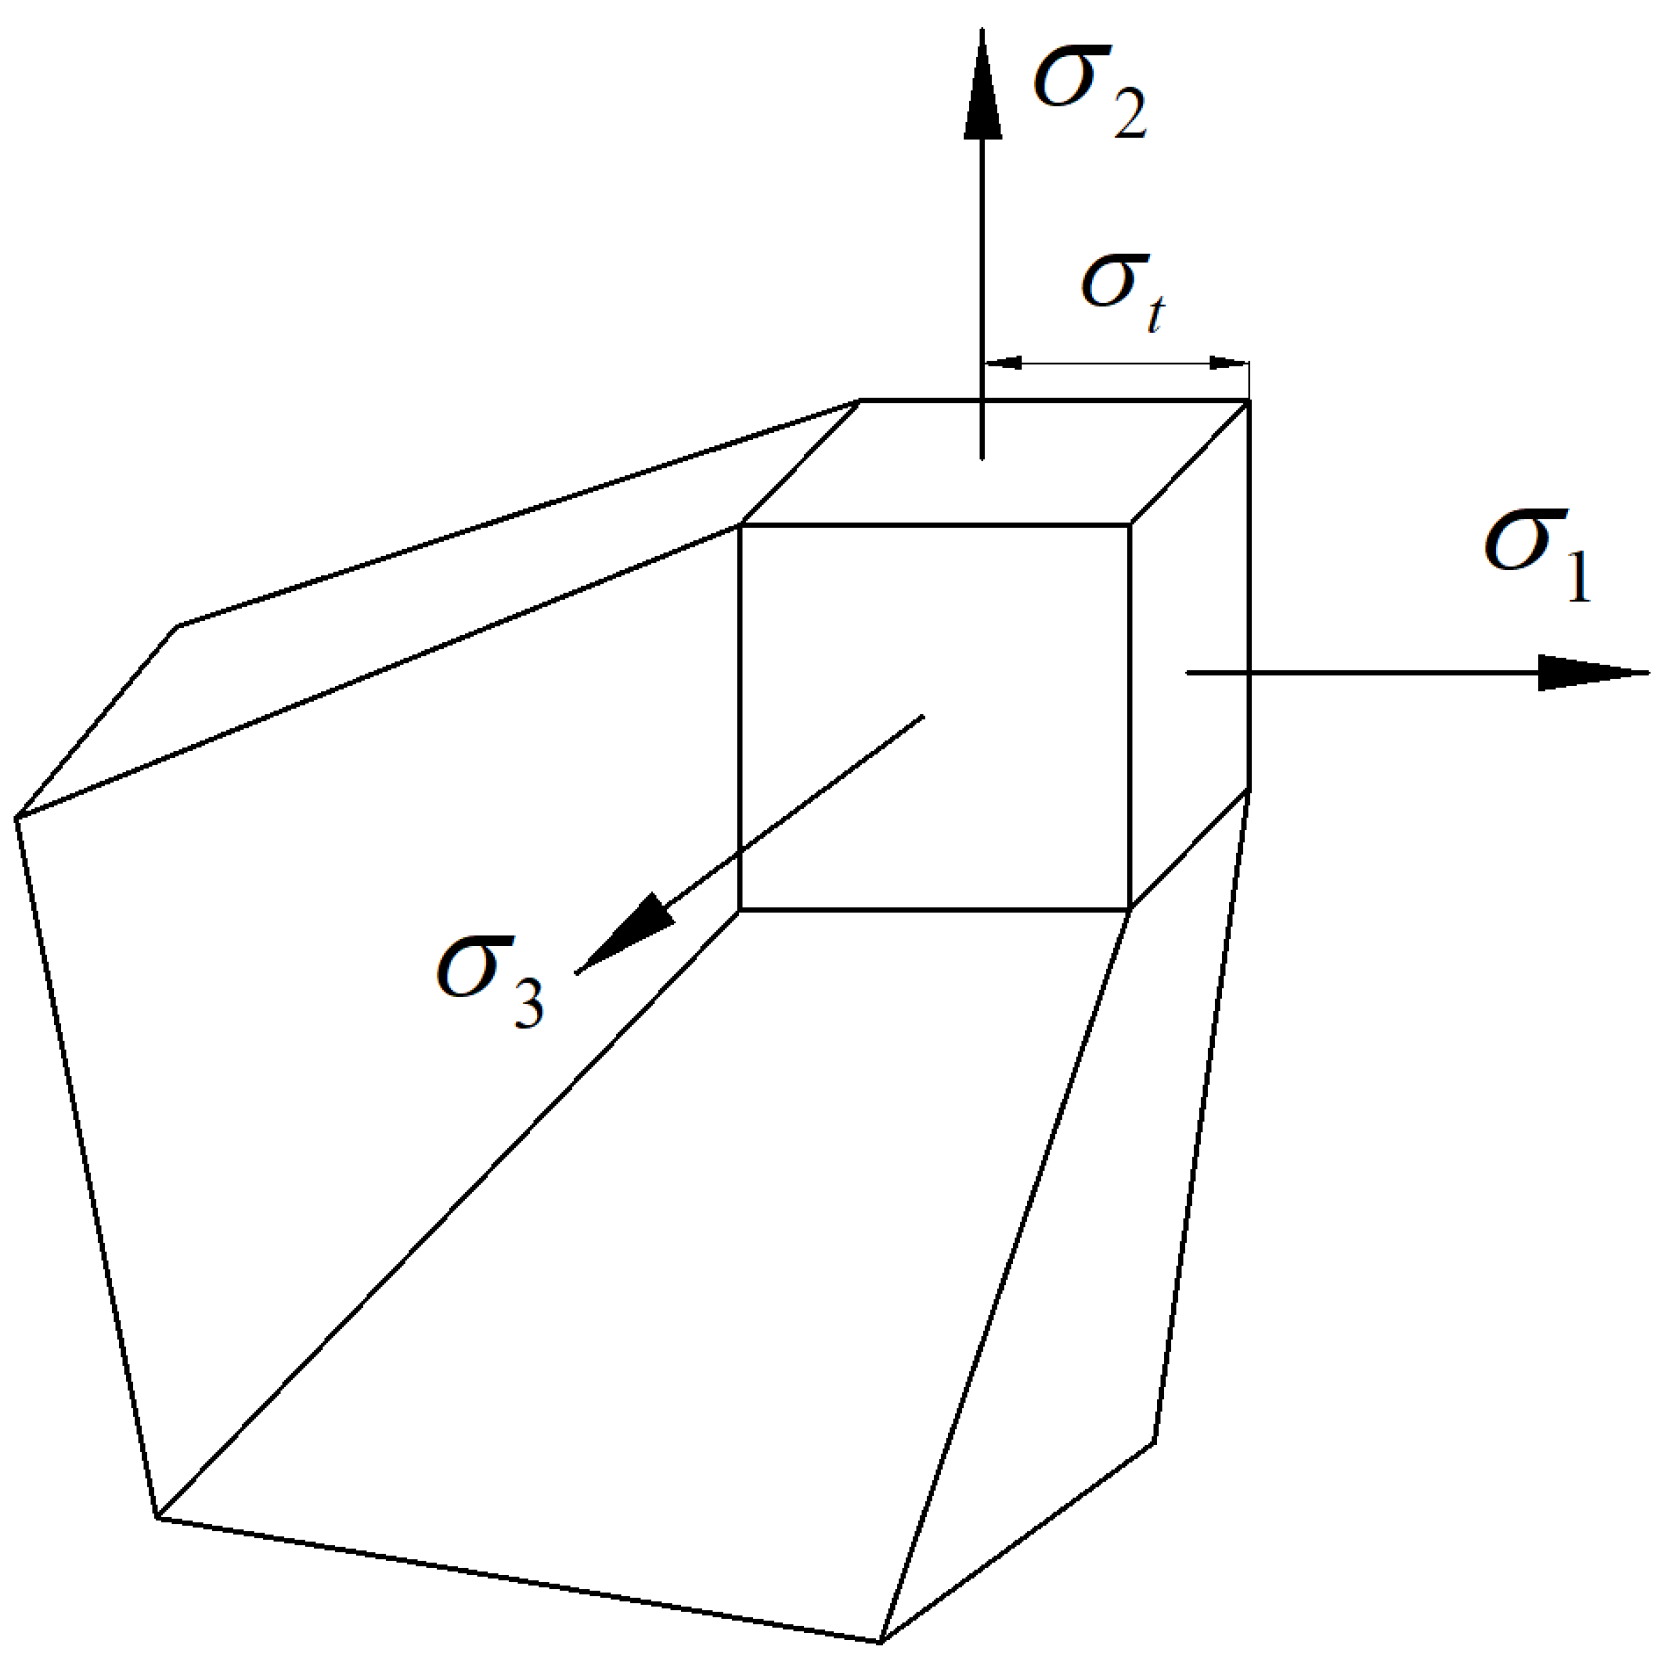
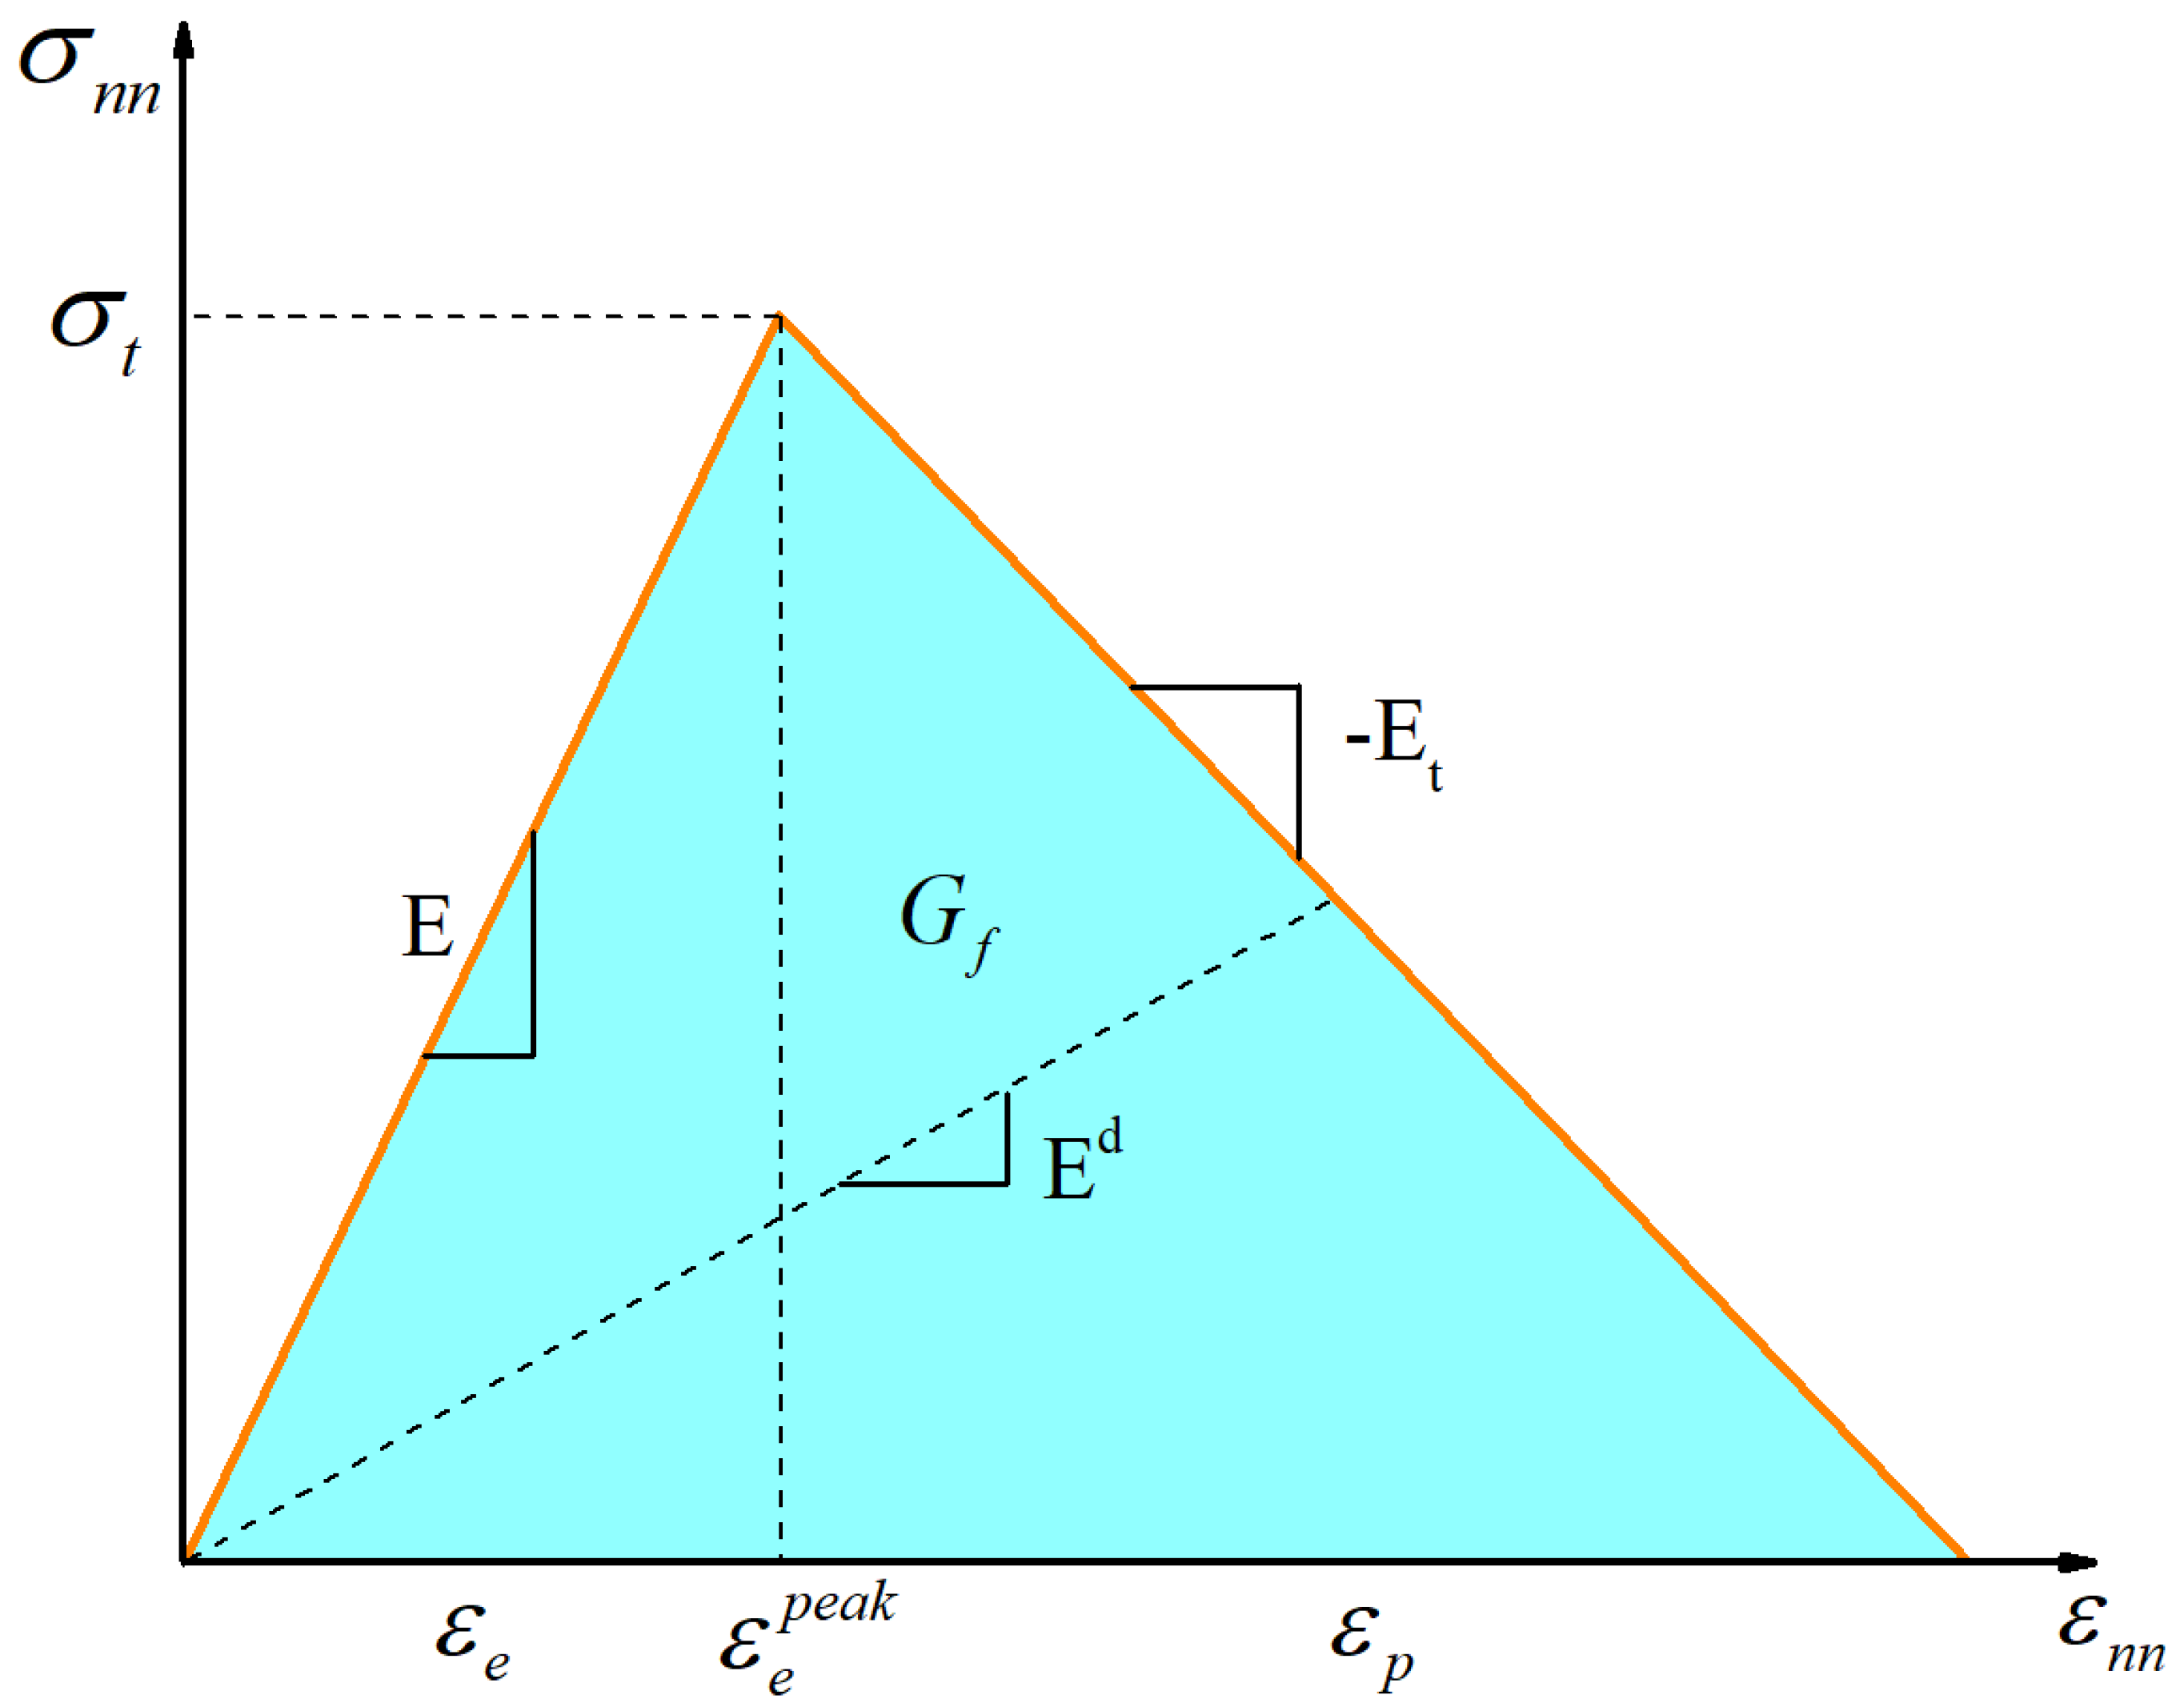
2.1. FDEM Method

The coupled finite–discrete element method (FDEM) can realize the real simulation of material failure process by combining finite and discrete elements and introducing the principle of fracture mechanics. The unique feature of the method is to simulate the transition from continuous state to discontinuous state by explicitly simulating the fracturing and crushing process [36]. A hybrid code ELFEN has been increasingly used to simulate the fracture process of brittle materials under laboratory tests [37,38,39,40], which is also the code used in this research. The code can simulate the fracture initiation, propagation, and penetration of brittle material under increasing strain. If the failure criterion of intact model (initially expressed as finite element domain) is satisfied, cracks will occur, and the model will become discrete element. As shown in Figure 1, the code allows new fractures to pass through the existing grid element, and the insertion of discrete fractures can be intra−element fracturing and inter−element fracturing. As shown in Figure 1b, using the intra−element fracturing method with small grid size, a single small fracture can be inserted according to the appropriate fracture stress direction, thereby obtaining a more real fracture propagation behavior. Some studies show that this method successfully simulates the fracture process of rock under static and dynamic loading [41,42,43].
The ELFEN formula assumes that the new crack in the quasi−brittle material model is related to tensile deformation. The model under compressive load will expand in the orthogonal direction of the loading direction due to the Poisson effect, and the crack originates on the loading path and expands along the loading direction. Cai believes that the formation of typical shear bands observed in compression tests is actually a secondary process of interaction polymerization of extension cracks [12].
The Mohr–Coulomb with Rankine tensile yield criterion is used to judge the failure of Brazilian discs under different loading configurations. The model includes five material parameters: cohesion (c), friction angle ( φ ), expansion angle ( ψ ), tensile strength ( σ t ), and fracture energy (Gf). Compared with the traditional Mohr–Coulomb criterion, the modified criterion can better describe the shear and tensile failure of the material, as shown in Figure 2.
The Mohr–Coulomb with Rankine tensile yield criterion combines the Mohr–Coulomb yield criterion and the Rankine tensile yield criterion. The Mohr–Coulomb yield criterion is used to judge shear failure and is described by:
τ = c σ n tan φ
where τ is the shear stress, c is the cohesion, σ n is the normal pressure, and φ is the friction angle. The Rankine tensile yield criterion is used to judge tensile failure and is described by:
σ i σ t = 0 i = 1 , 2 , 3
where σ i is the principal stress and σ t is the tensile strength. The cohesion of model decreases after plastic strain occurs, and the tensile strength is softened by the decrease in cohesion, as shown in Equation (3). This ensures that there is always normal stress on the failure shear surface.
σ t c ( 1 sin φ ) / cos φ
The stress−strain relationship of the discrete crack model is shown in Figure 3, which includes an elastic part and a softening (plastic) part [44], and damage begins after peak intensity. The cracks can be introduced in a direction perpendicular to the principal strain and are assumed to rotate upon further loading to maintain this orthogonal relationship.
In the post−peak region, the rotational crack formulation shows the anisotropic damage evolution by decreasing the elastic modulus in the direction of major principal stress, and is formulated as:
σ n n = E d ε n n = ( 1 ω ) E ε n n
where n-s is the local coordinate related to the principal stress, Ed is the elastic damage secant modulus, E is the Young’s modulus, and ω is the damage parameter. The scalar damage evolution of the linear strain softening curve is defined by:
ω = ψ ( ε ) 1 ψ ( ε )
where ψ ( ε ) is a function of strain described by [45]:
For   ε σ t E ψ ( ε ) = 1 ω = 0   For   σ t E < ε σ t E + σ t E t ψ ( ε ) = E 2 ε E t σ t + E σ t E t E ε 0 < ω < 1 For   ε > σ t E + σ t E t ψ ( ε ) ω = 1
where Et is the tangential softening modulus. The fracture energy Gf is an important parameter for fracture development. It refers to the energy required to generate continuous cracks per unit area, which is defined as:
G f = σ d u = σ ε ( s ) d s
where σ is the tensile stress and u is the tensile displacement. The fracture energy is related to the stress intensity factor (KIC) and elastic modulus (E):
G f = K I C 2 E
The localized bandwidth lc of the linear slope softening model is integrated to obtain:
E t = σ t 2 l c 2 G f

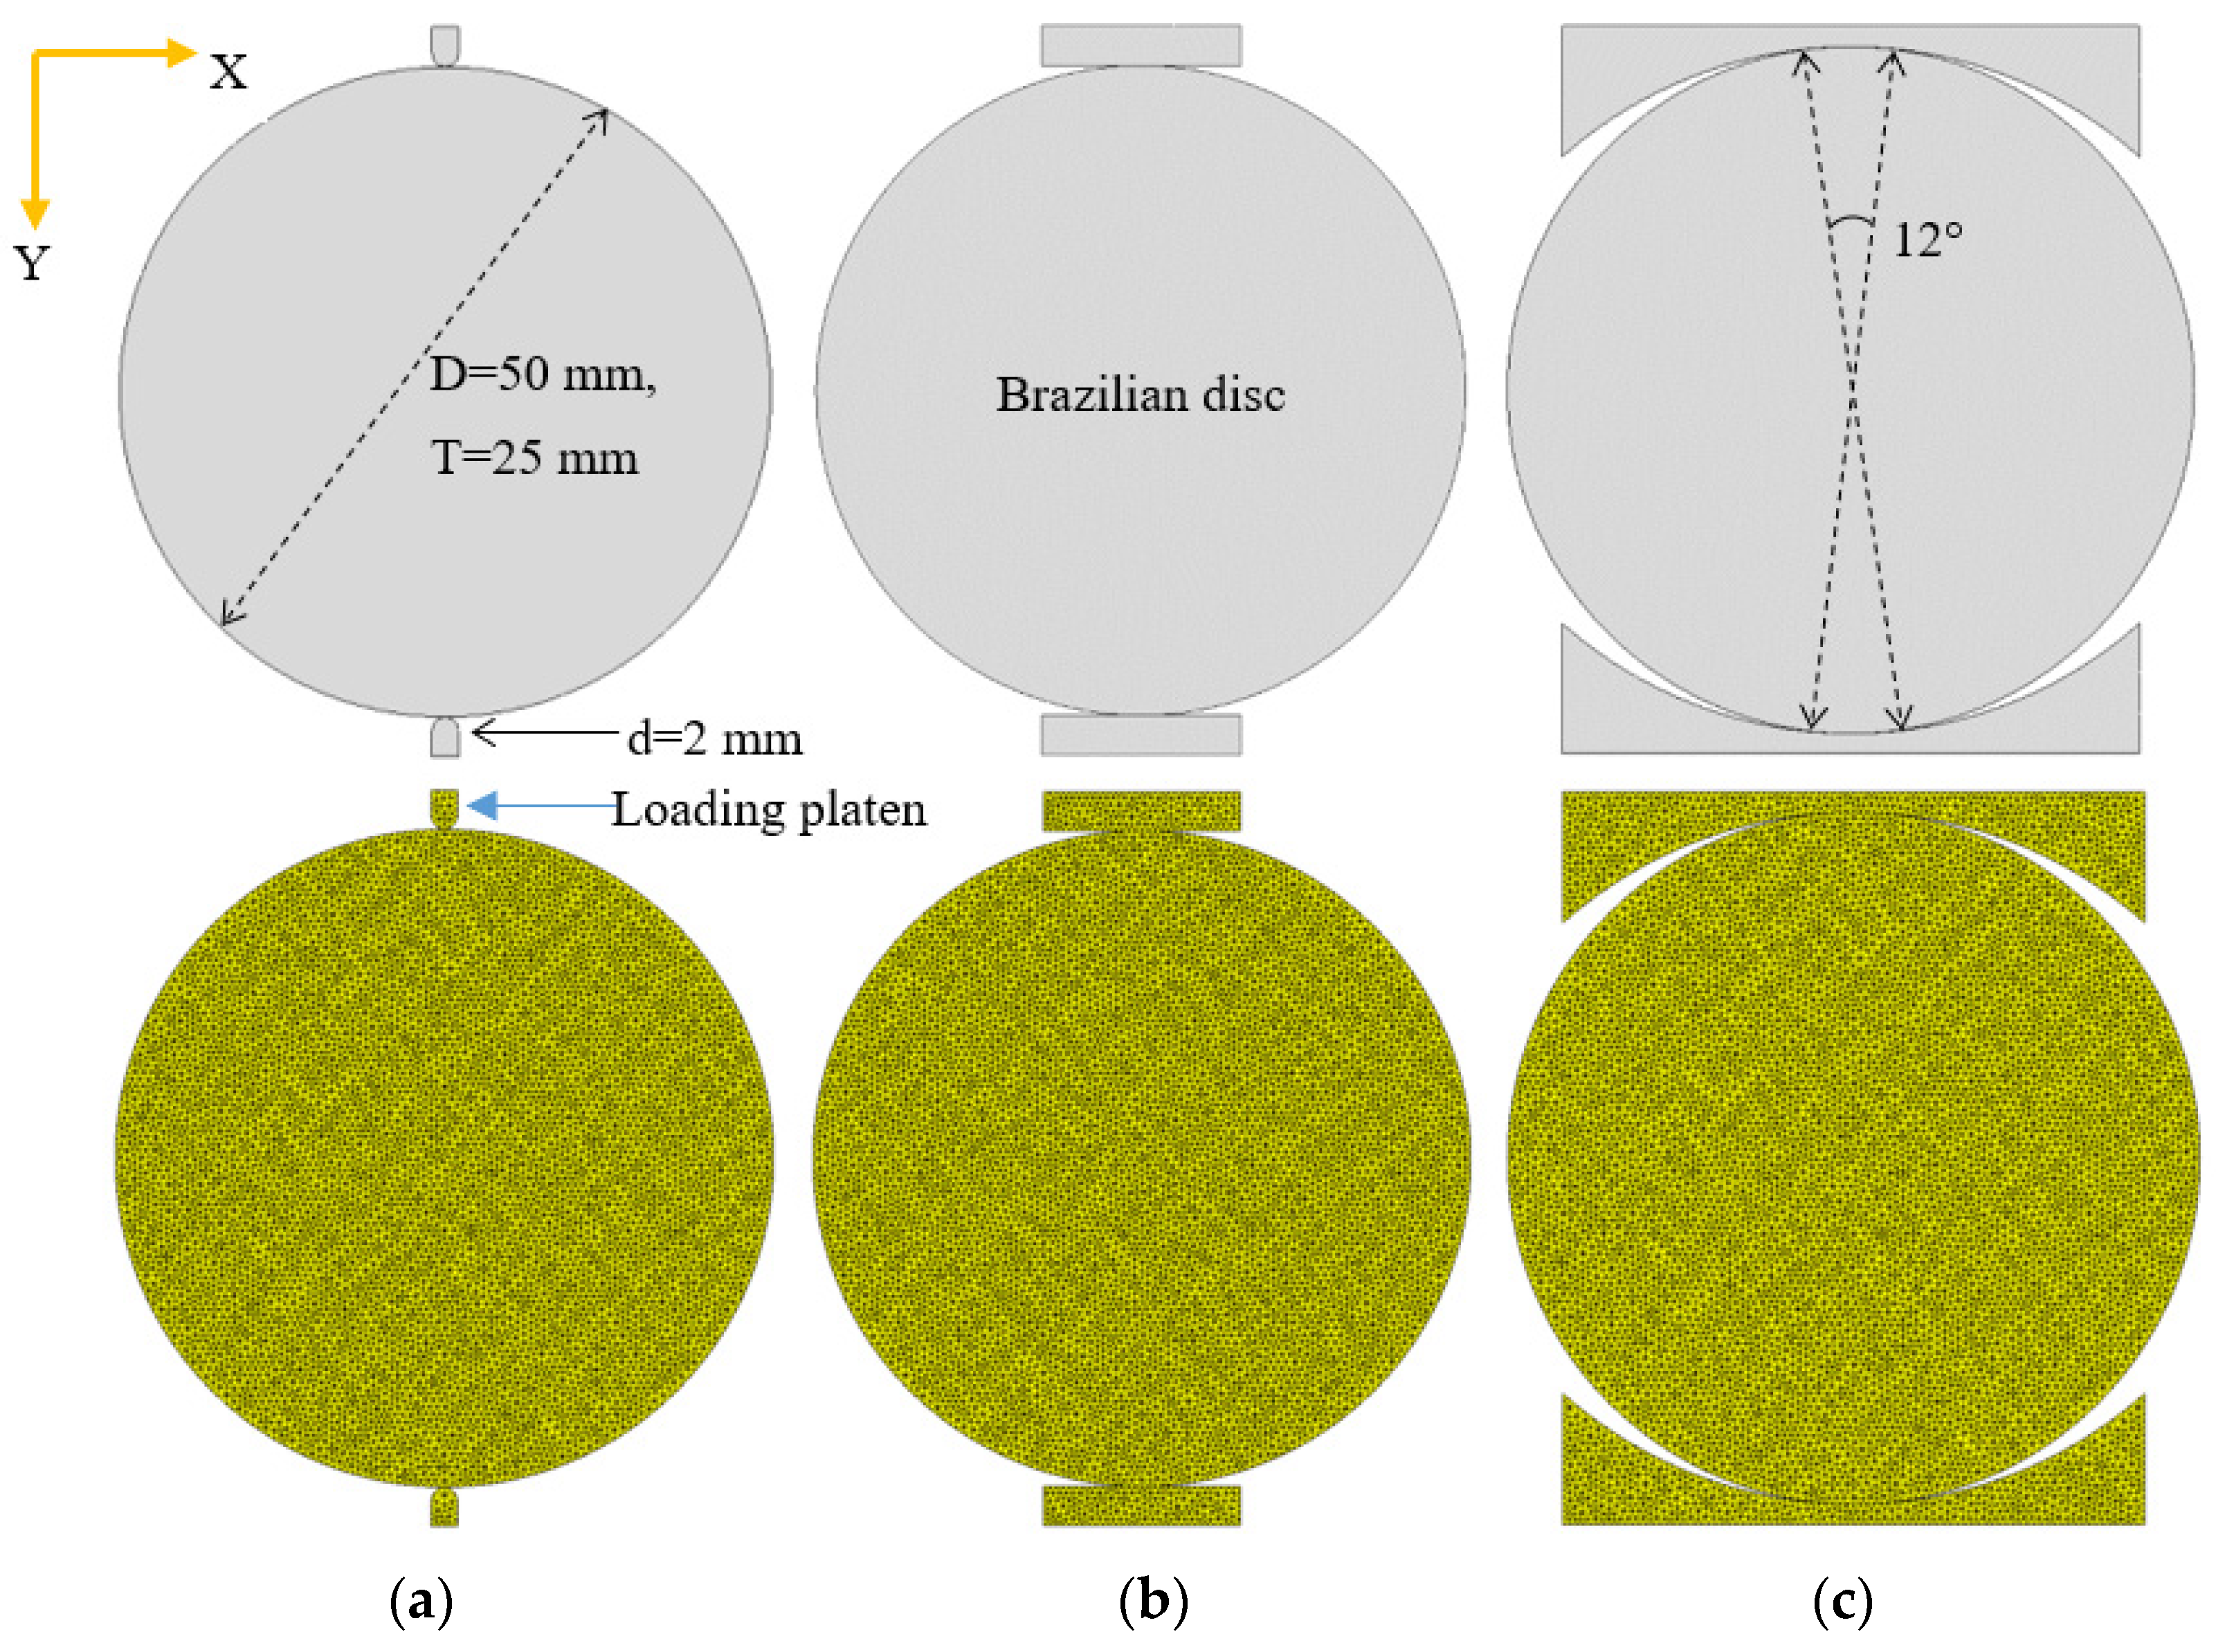
2.2. Numerical Model

The three loading configurations commonly used in Brazilian testing are small diameter rod, flat plate, and curved jaw. As shown in Figure 4, three Brazilian disc models with different loading configurations are built: small diameter loading rods (Type I), flat loading platens (Type II), and curved loading jaws (Type III). The diameter of Brazilian discs is 50 mm and the thickness is 25 mm. The two rods of Type I test are 2 mm in diameter. The loading speed is set to 0.5 mm/s and the corresponding strain rate is 0.01, which can be regarded as quasi−static loading.
The mechanical parameters of a granite are selected as the parameters of the Brazilian disc and the mechanical parameters of loading platen and granite disc are shown in Table 1. The material properties of the granite disc come from Li’s research [24,46]. The failure energy of hard and brittle materials are the range of 0.01 N/mm to 0.3 N/mm [47], and 0.05 N/mm is used as the failure energy of granite in this study. The normal penalty is generally 1.0 times the elastic modulus, and the tangential penalty is 0.1 times the normal penalty. The friction refers to the friction between the disc and loading plate. The element size of model is 0.5 mm, and the diameter of disc is 100 times the element size, which ensures that the element size can obtain accurate crack propagation. The influence of the mesh size is shown in Appendix A.

3. Results

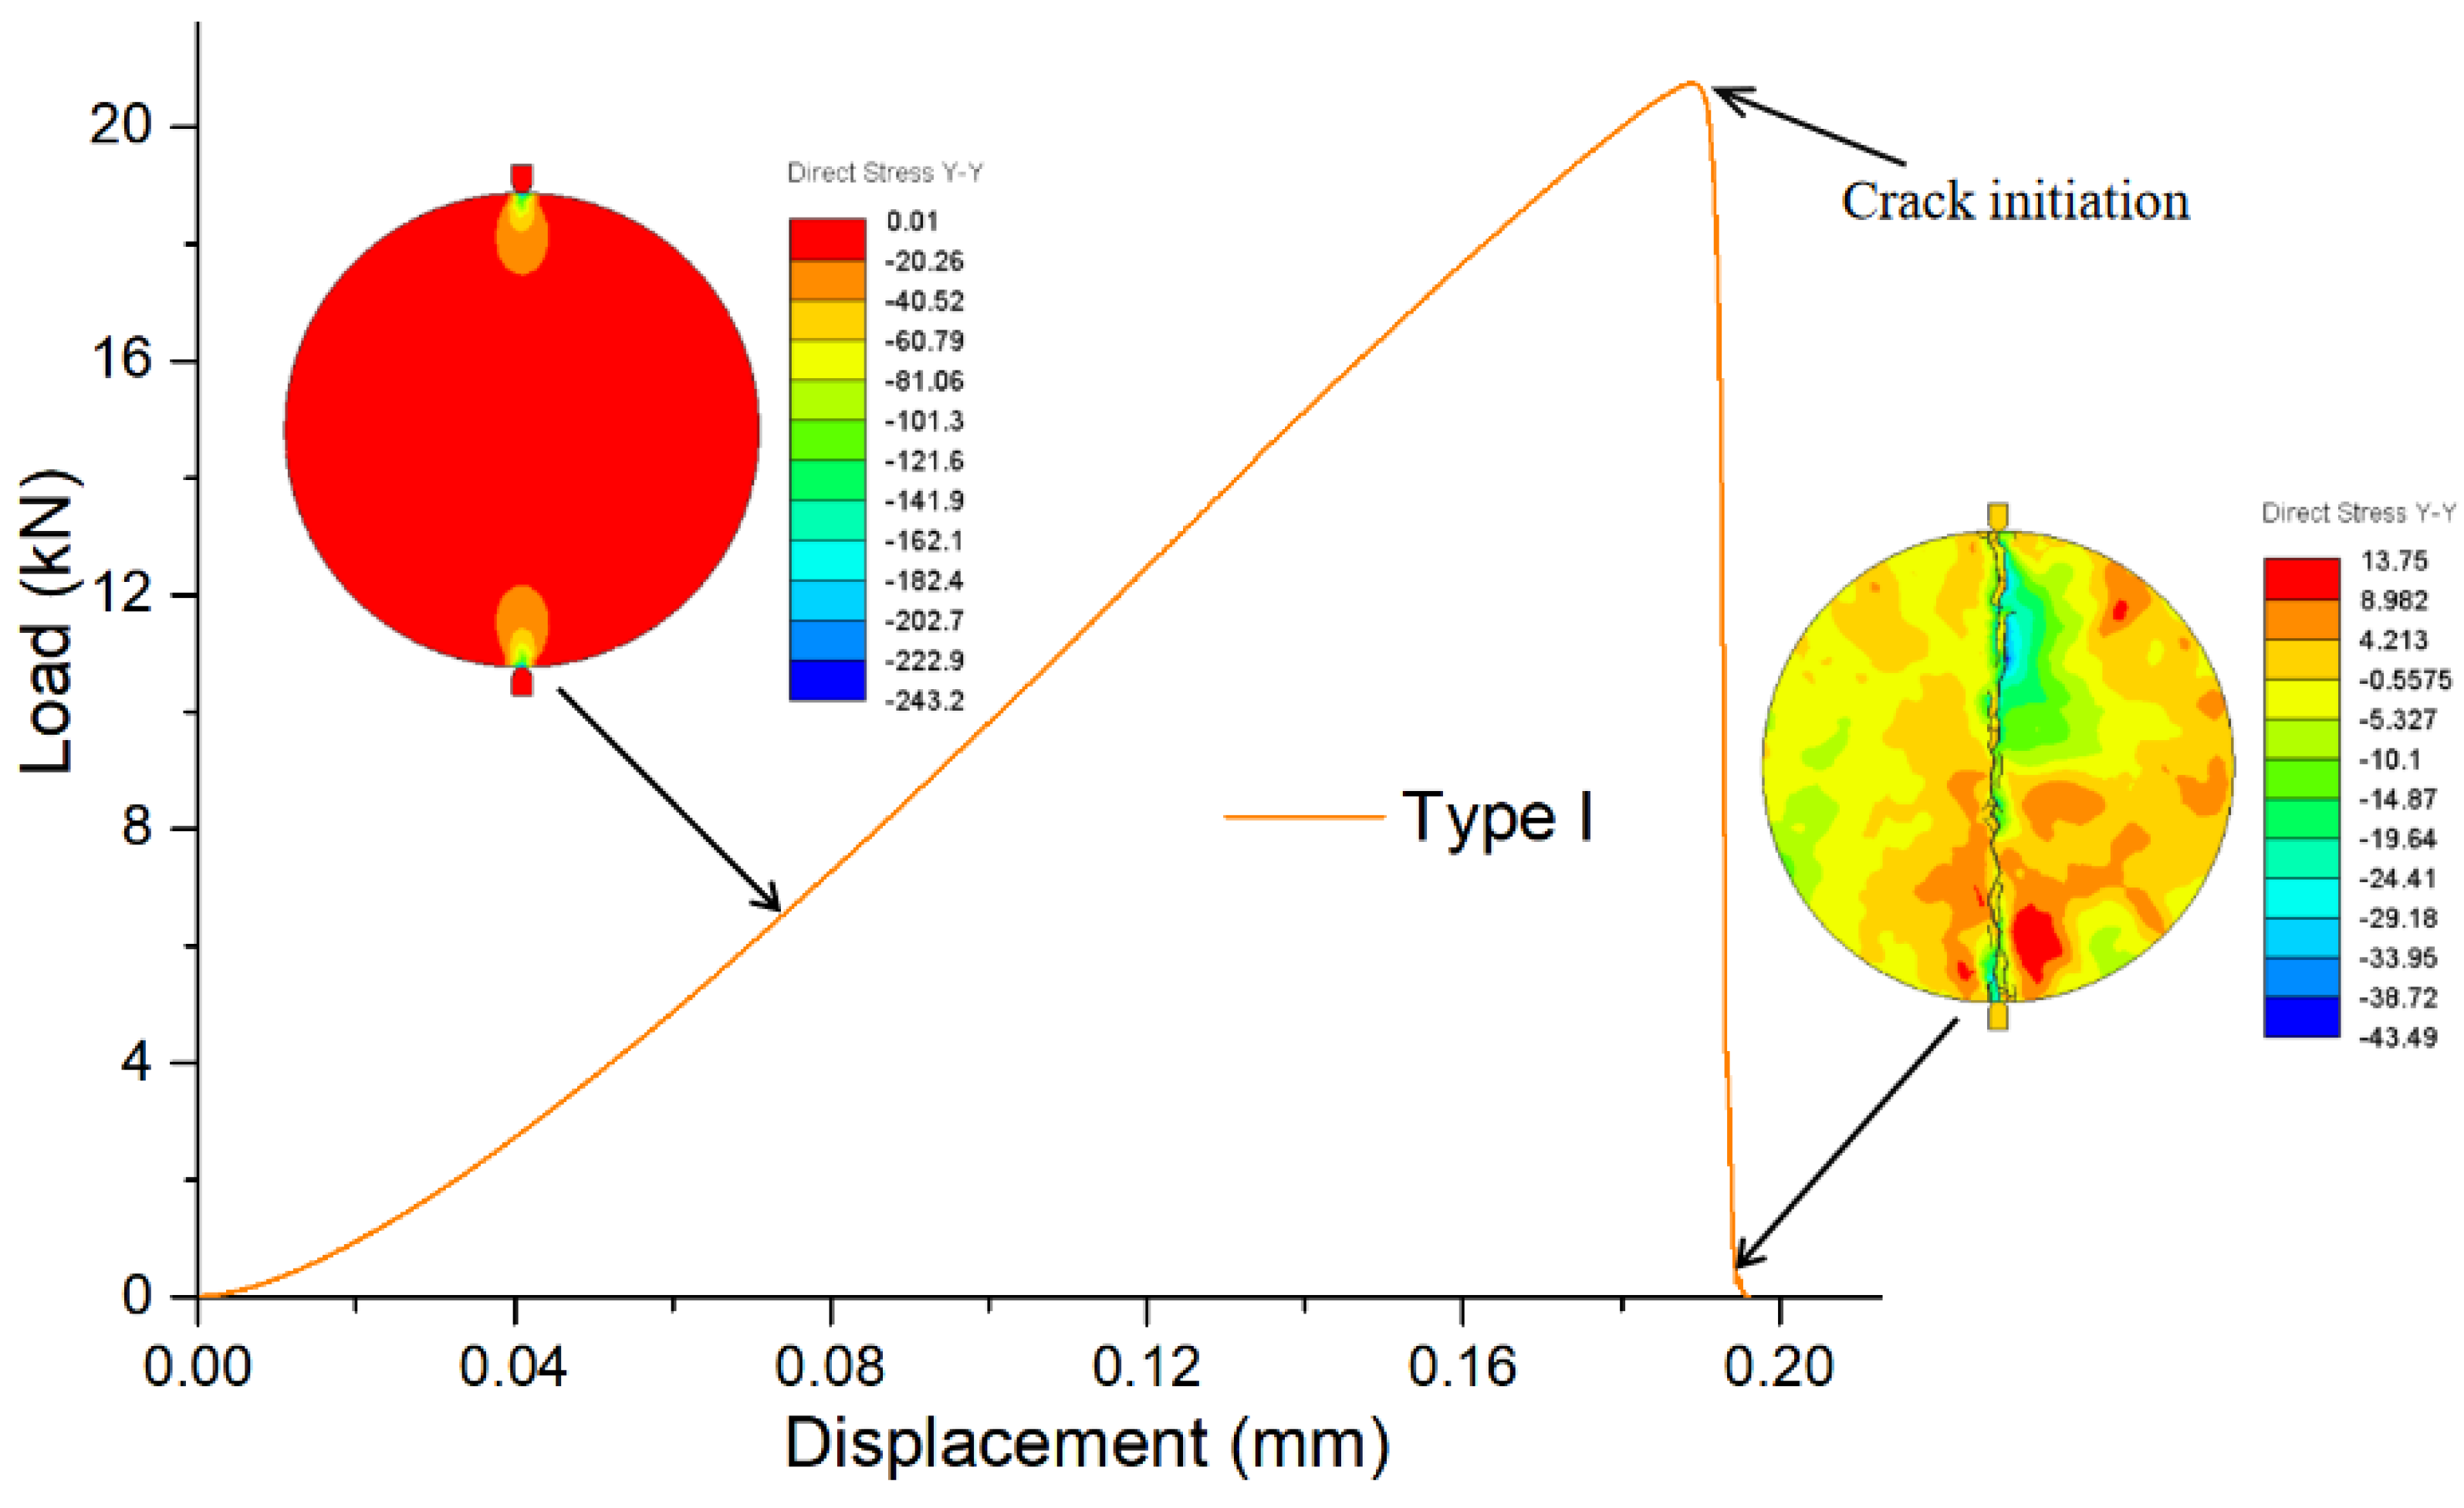
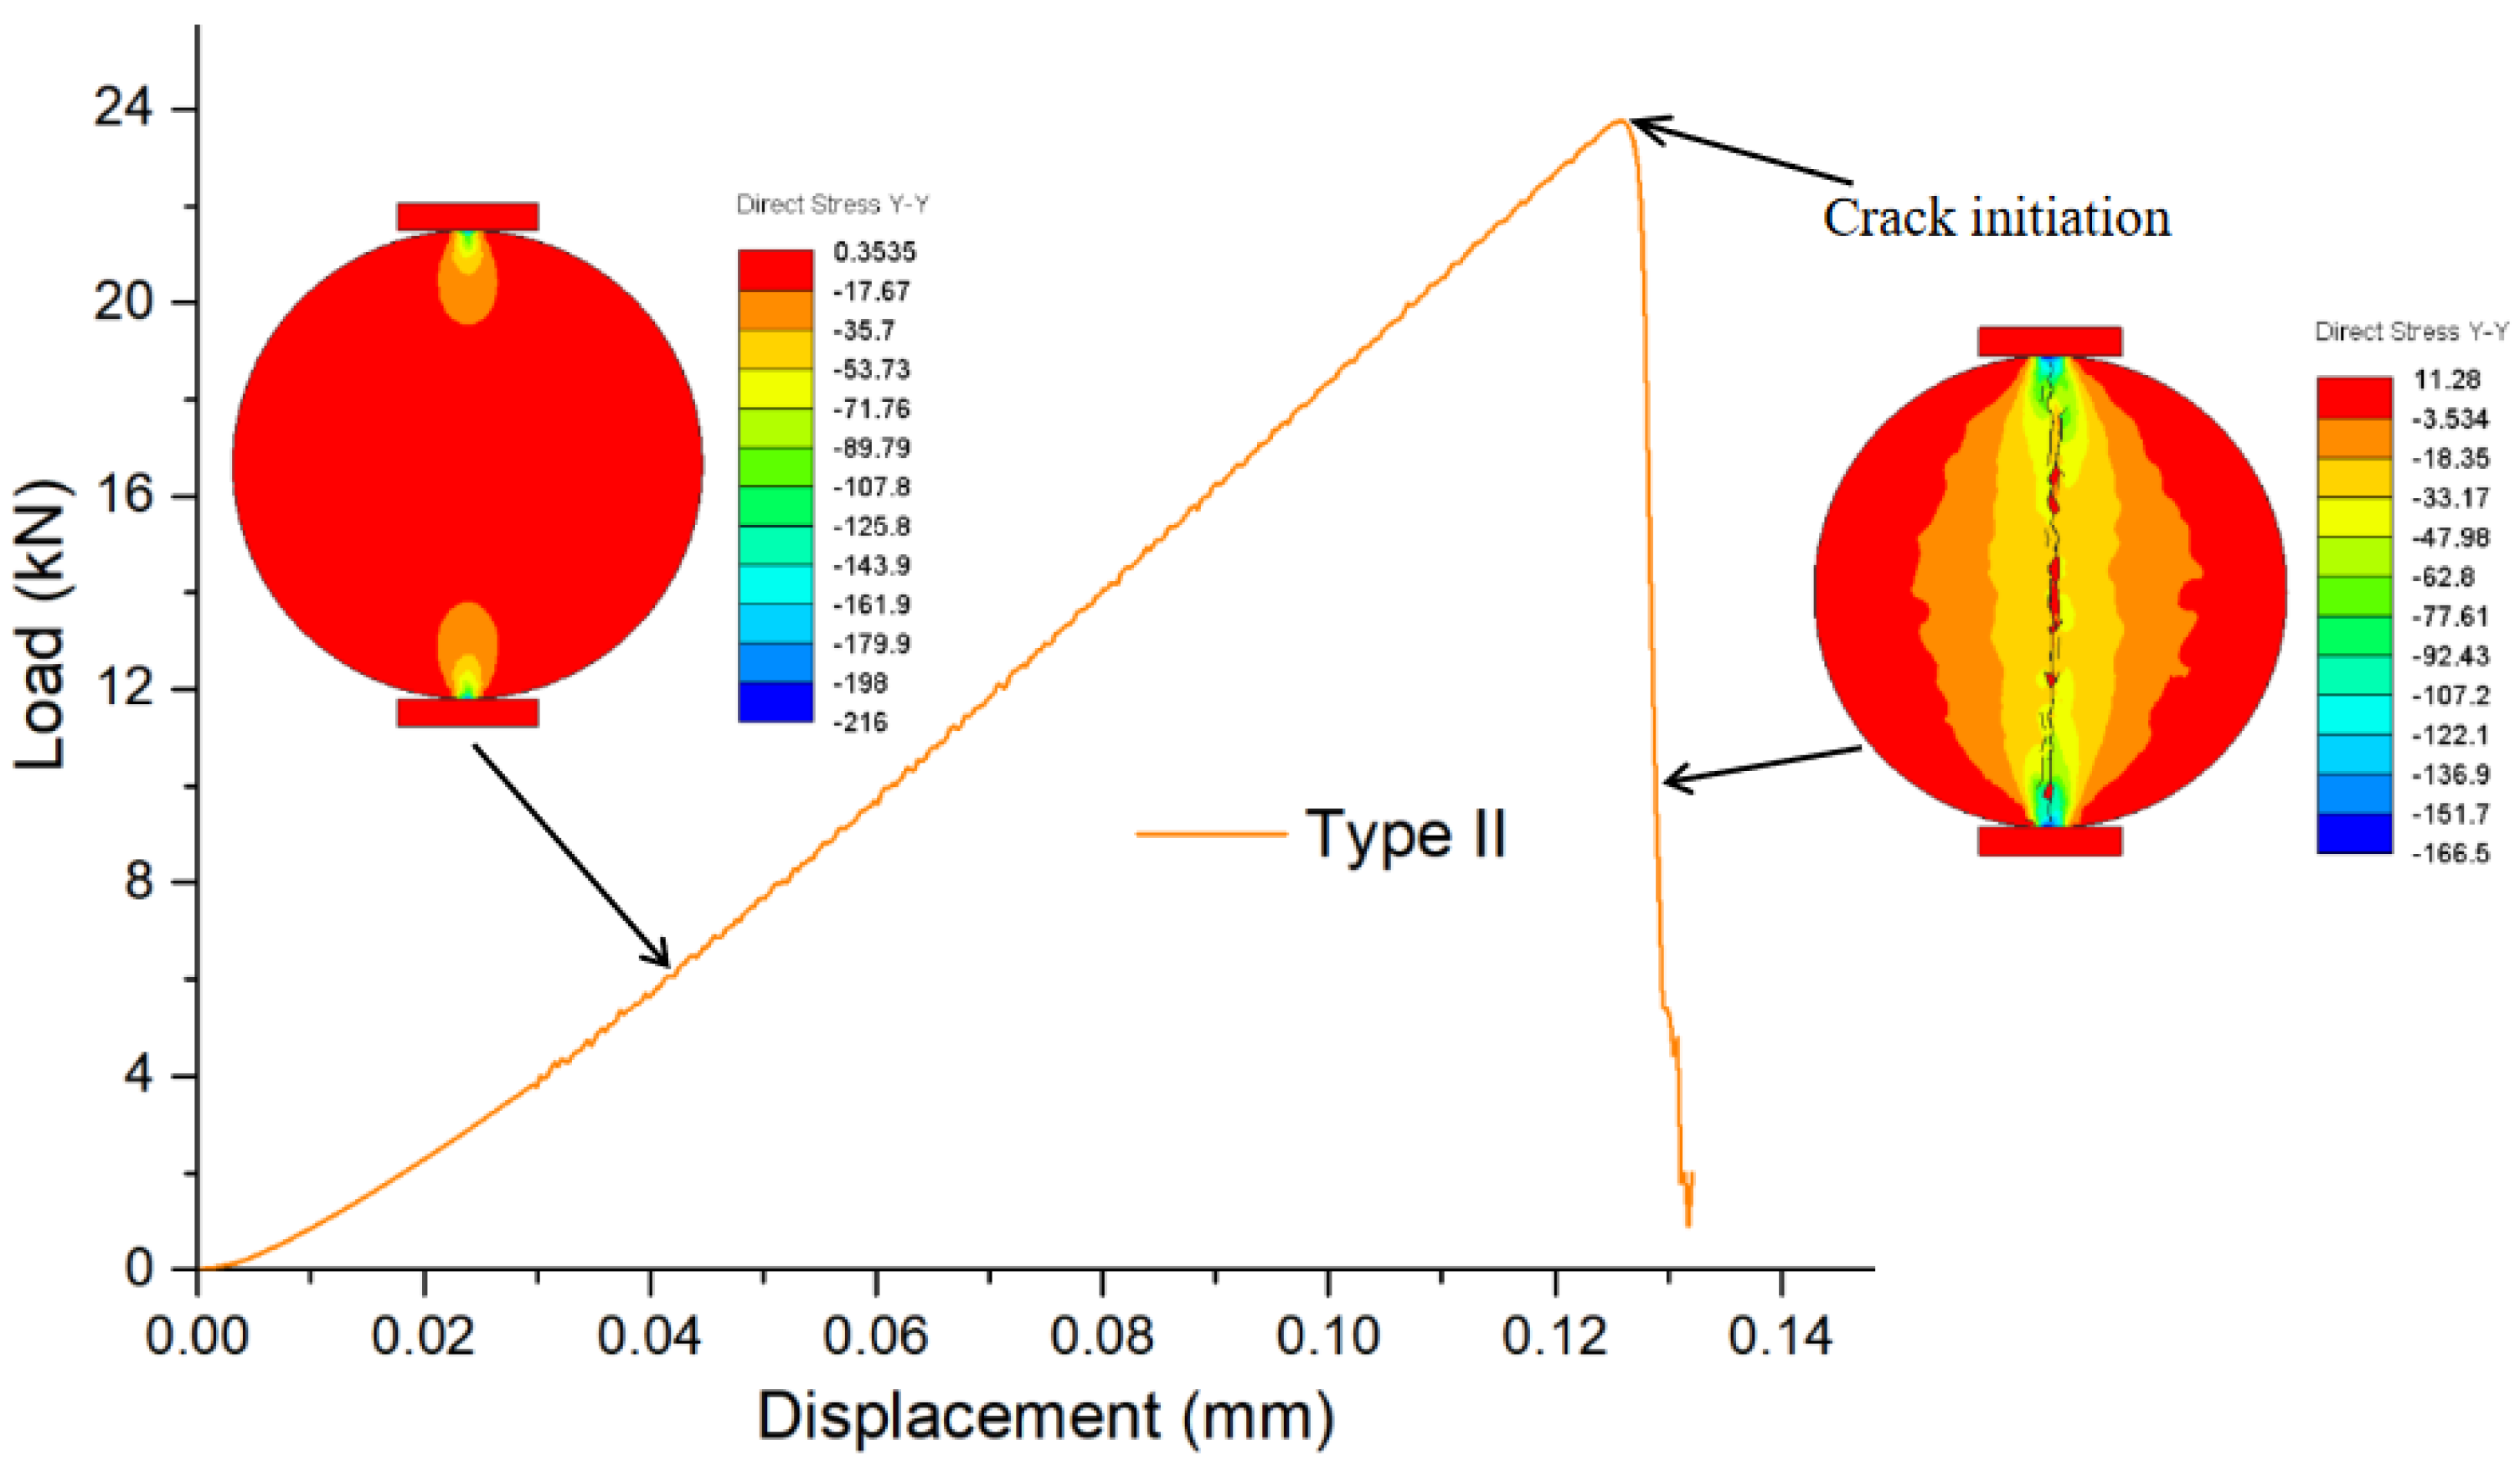
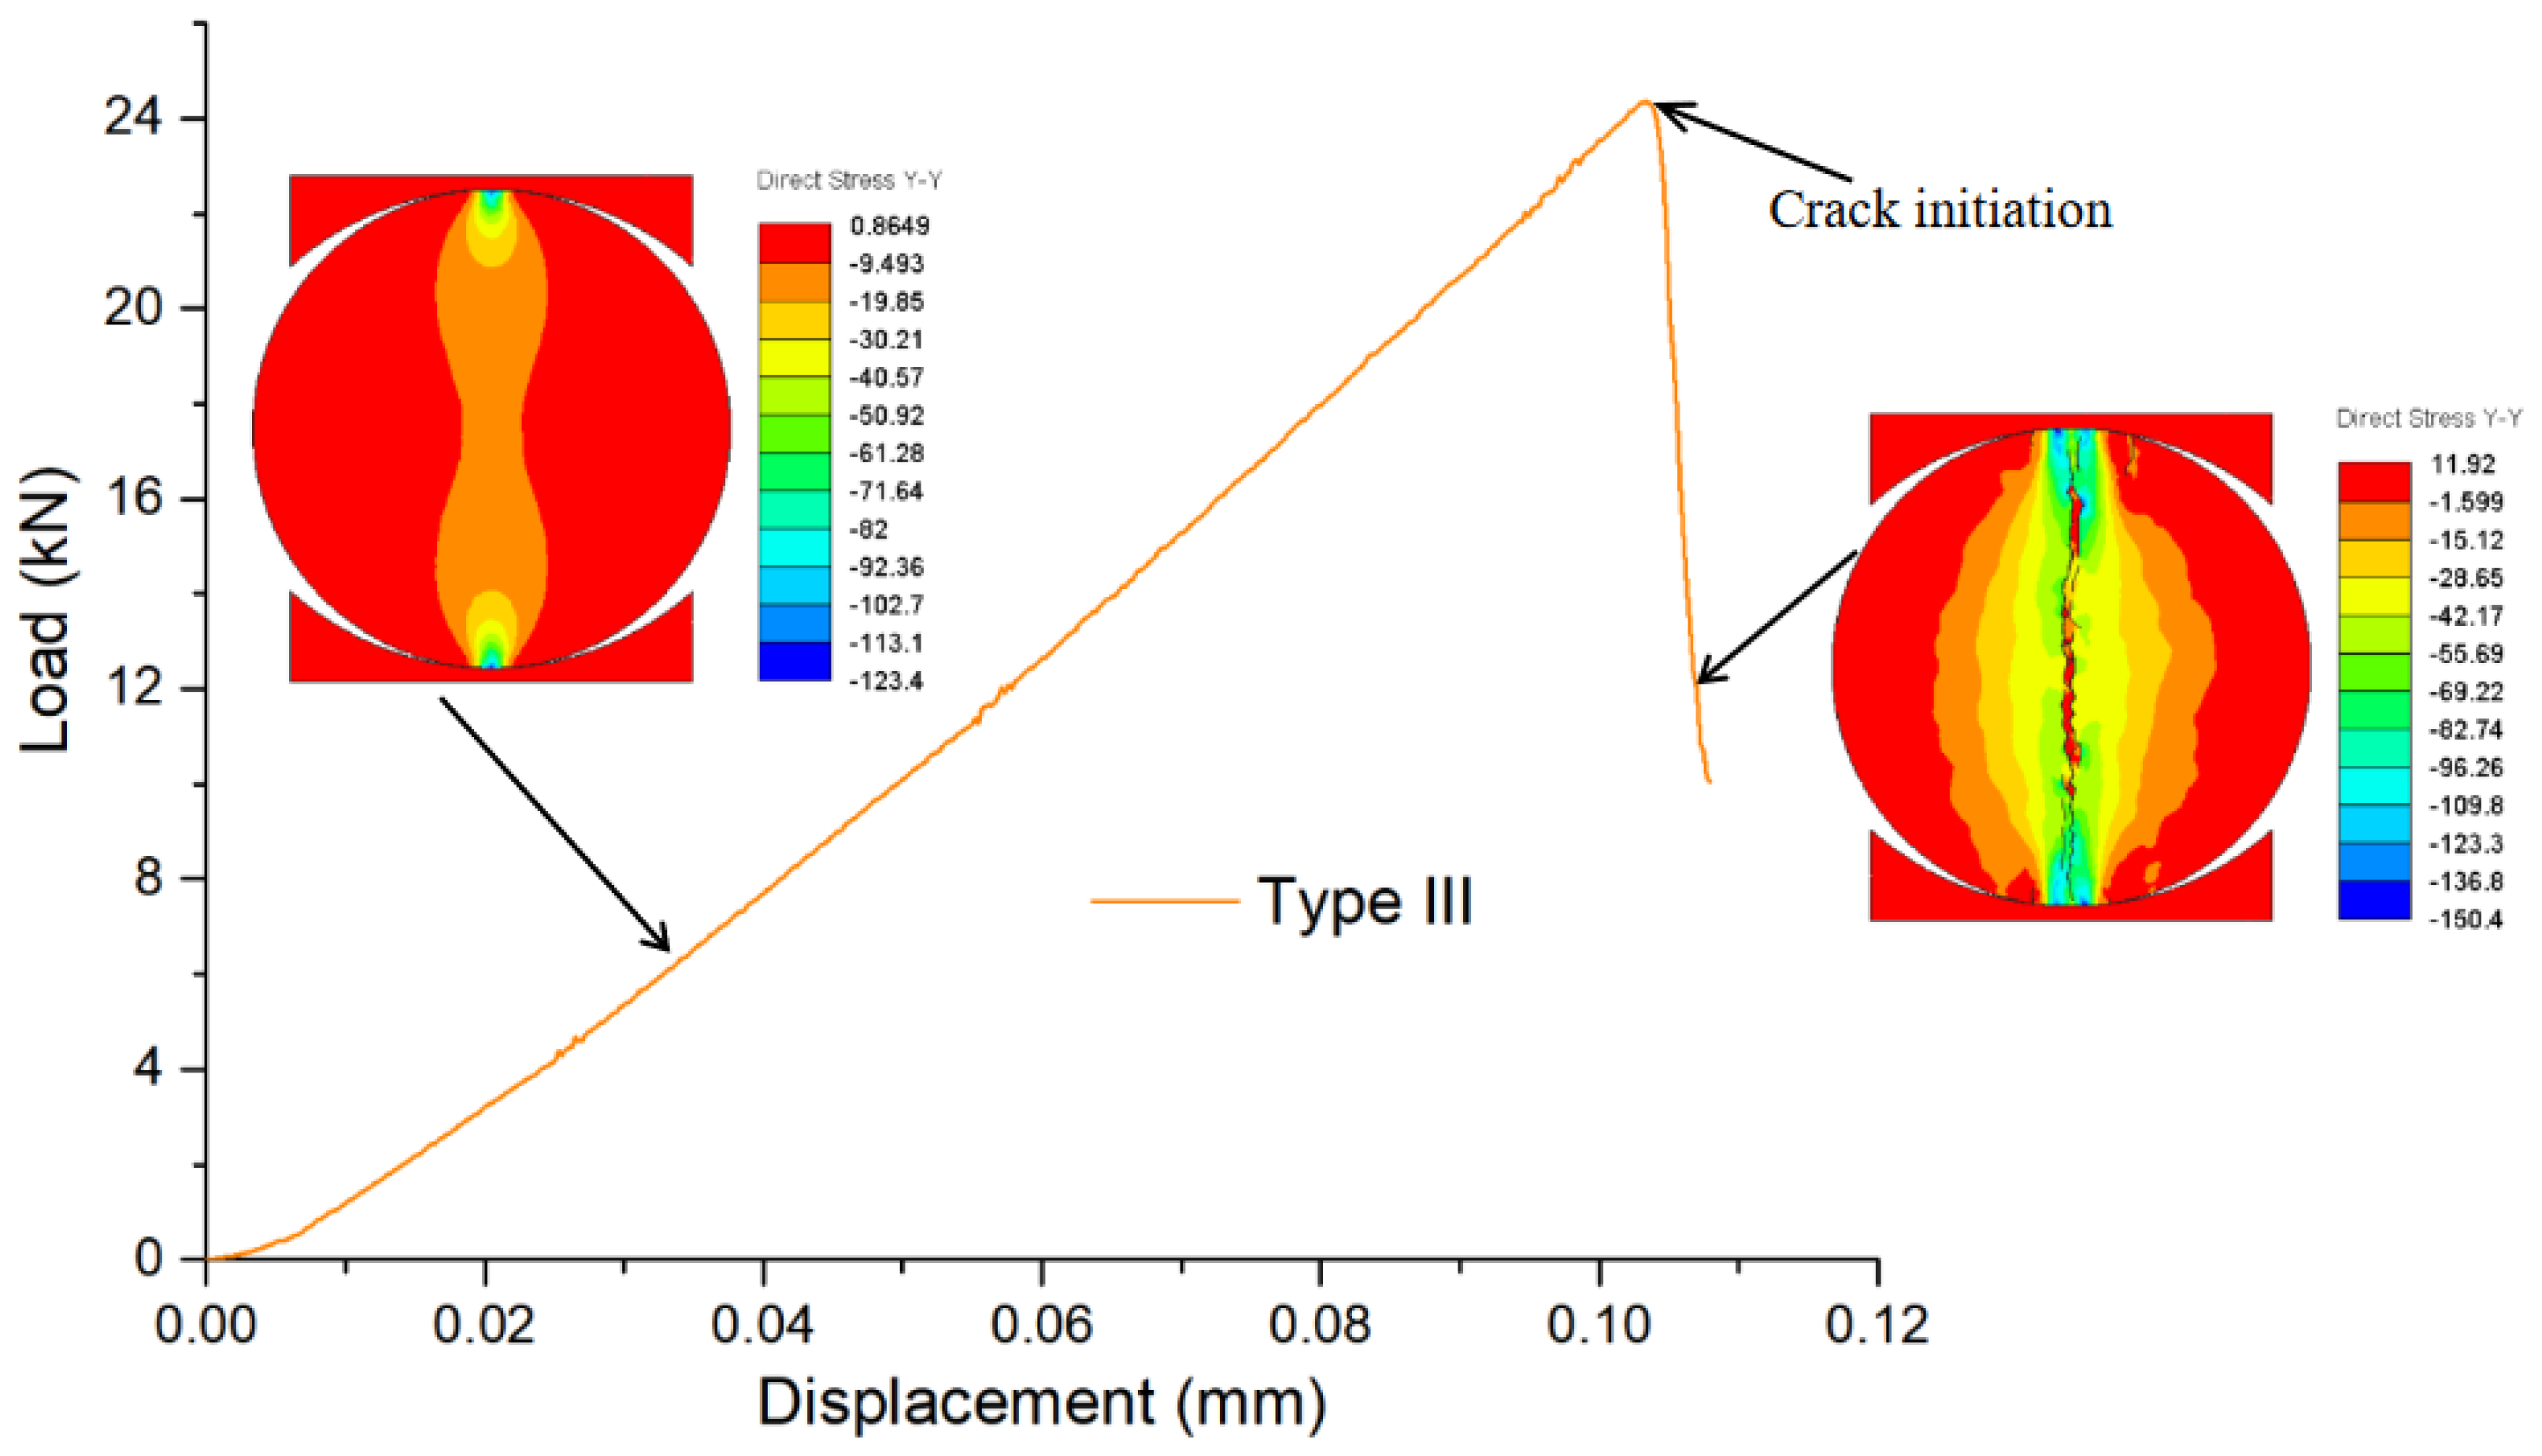
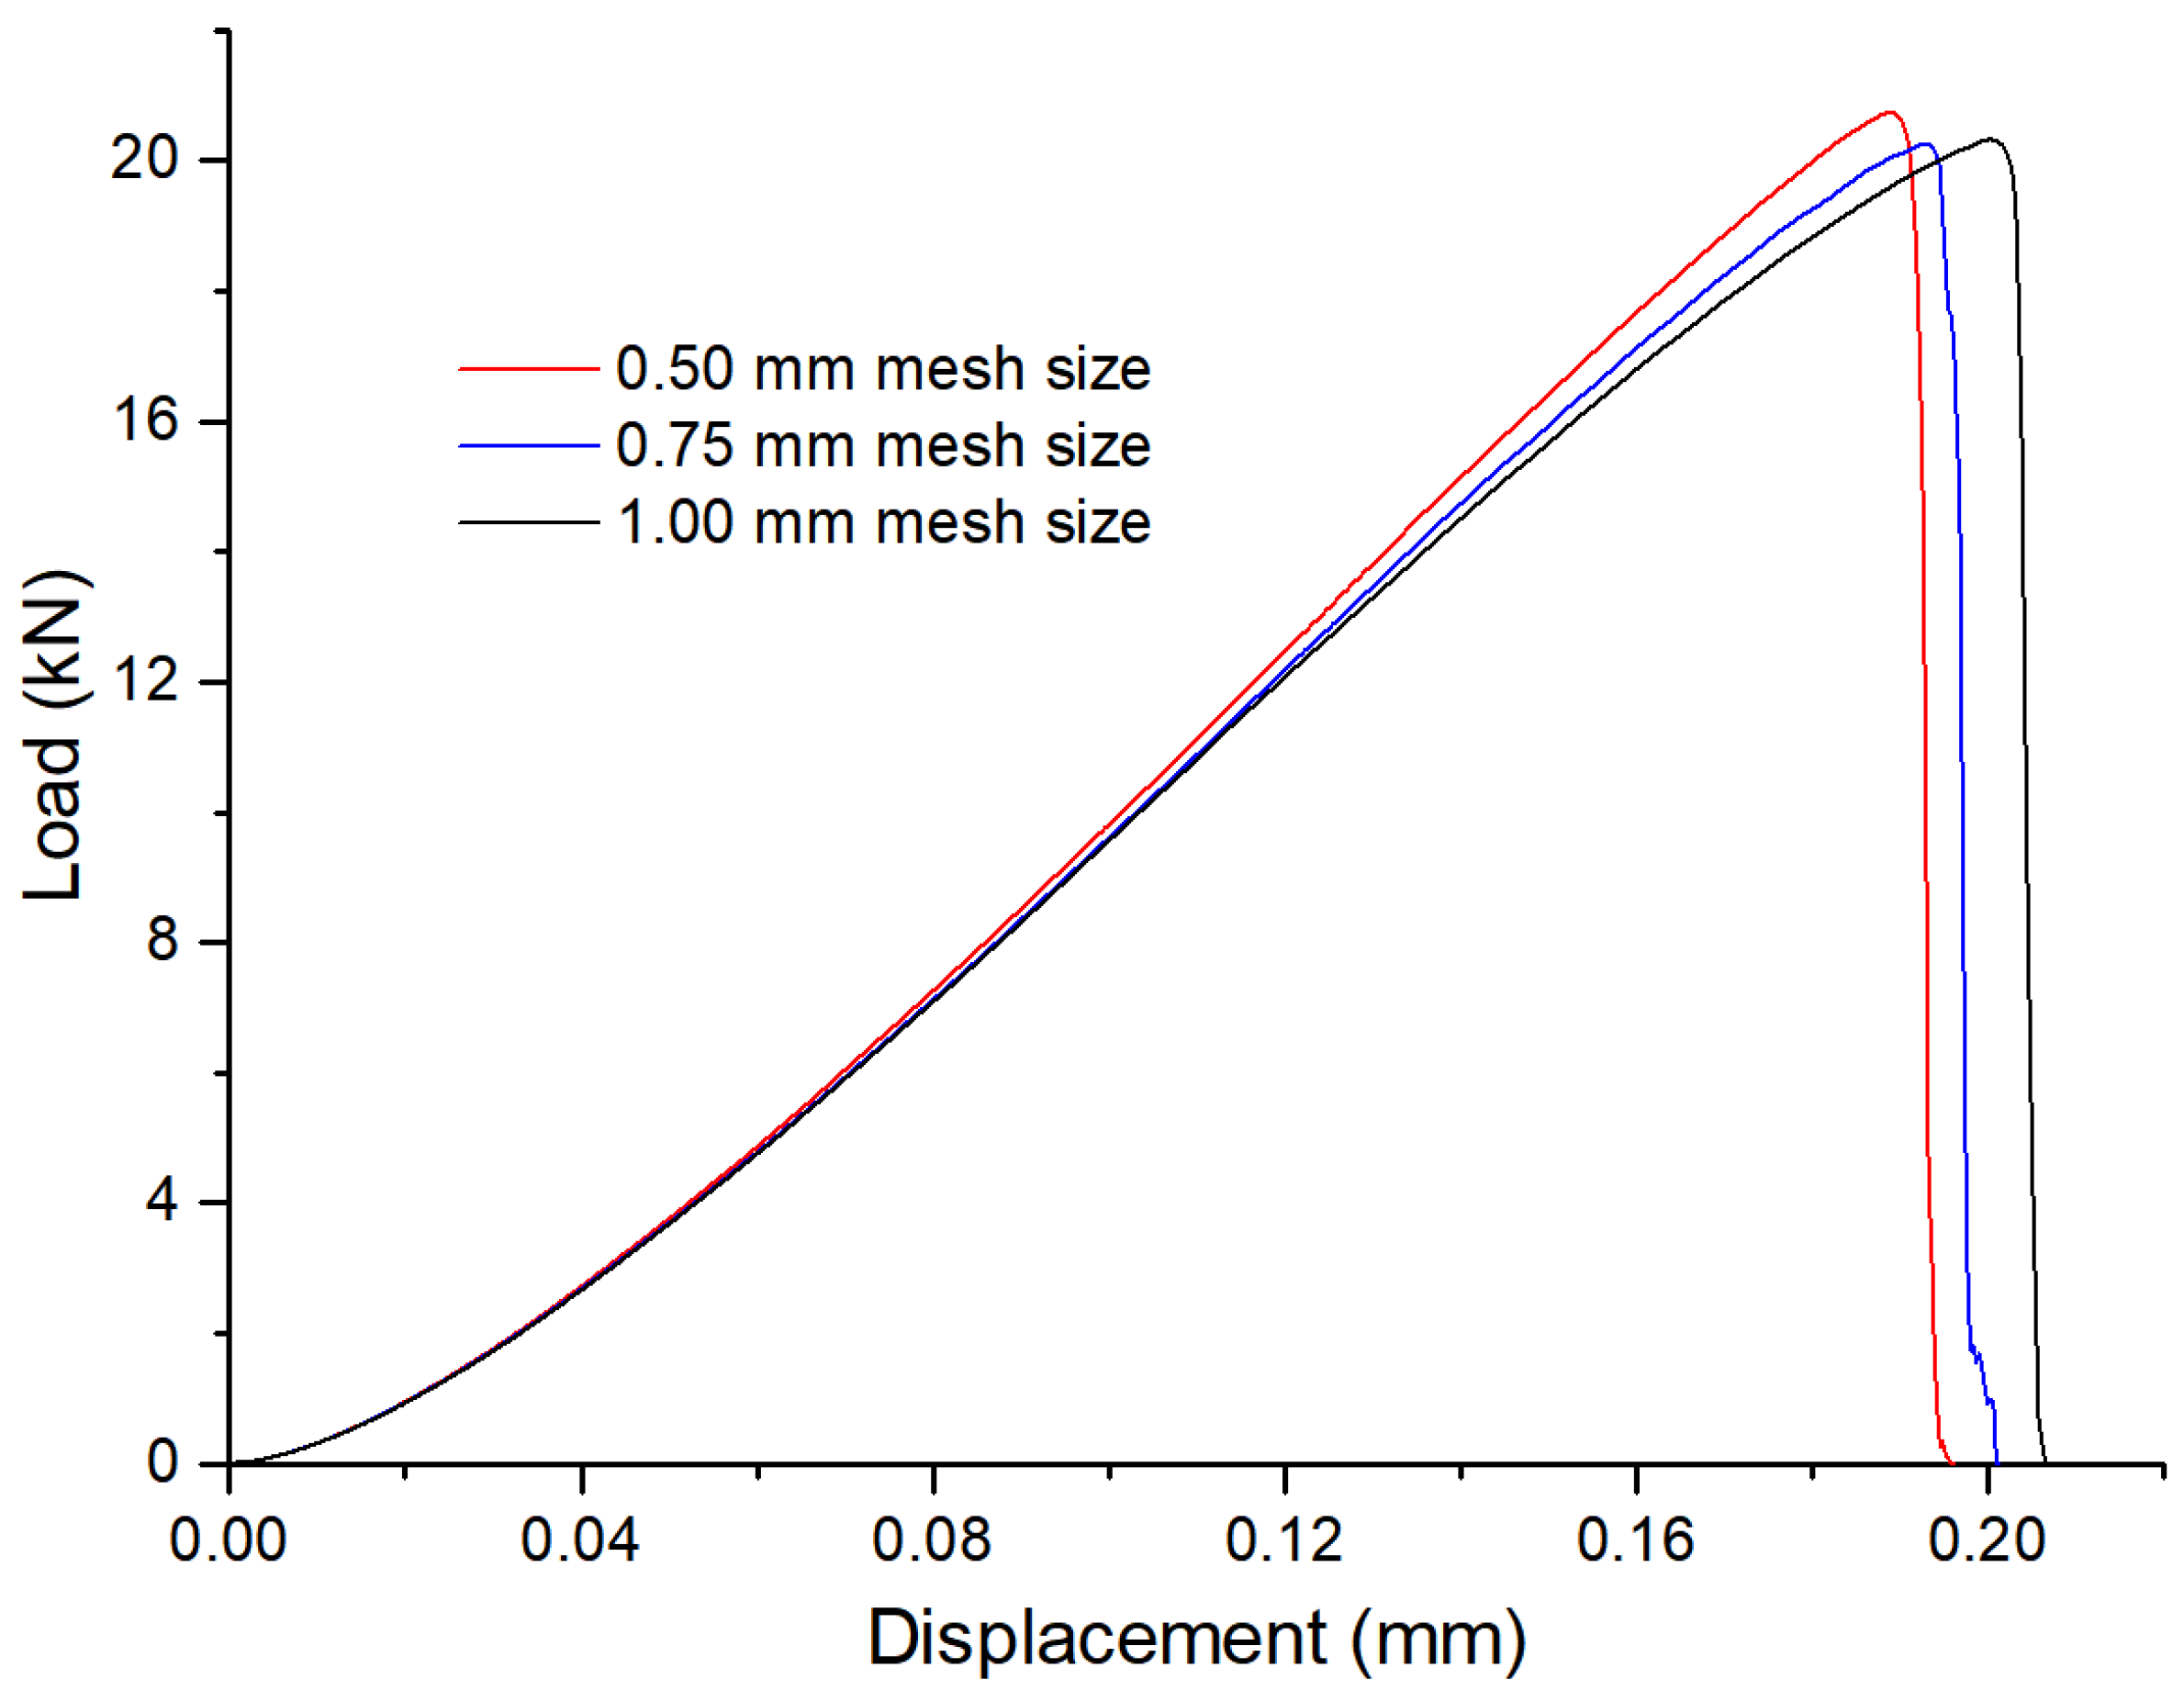
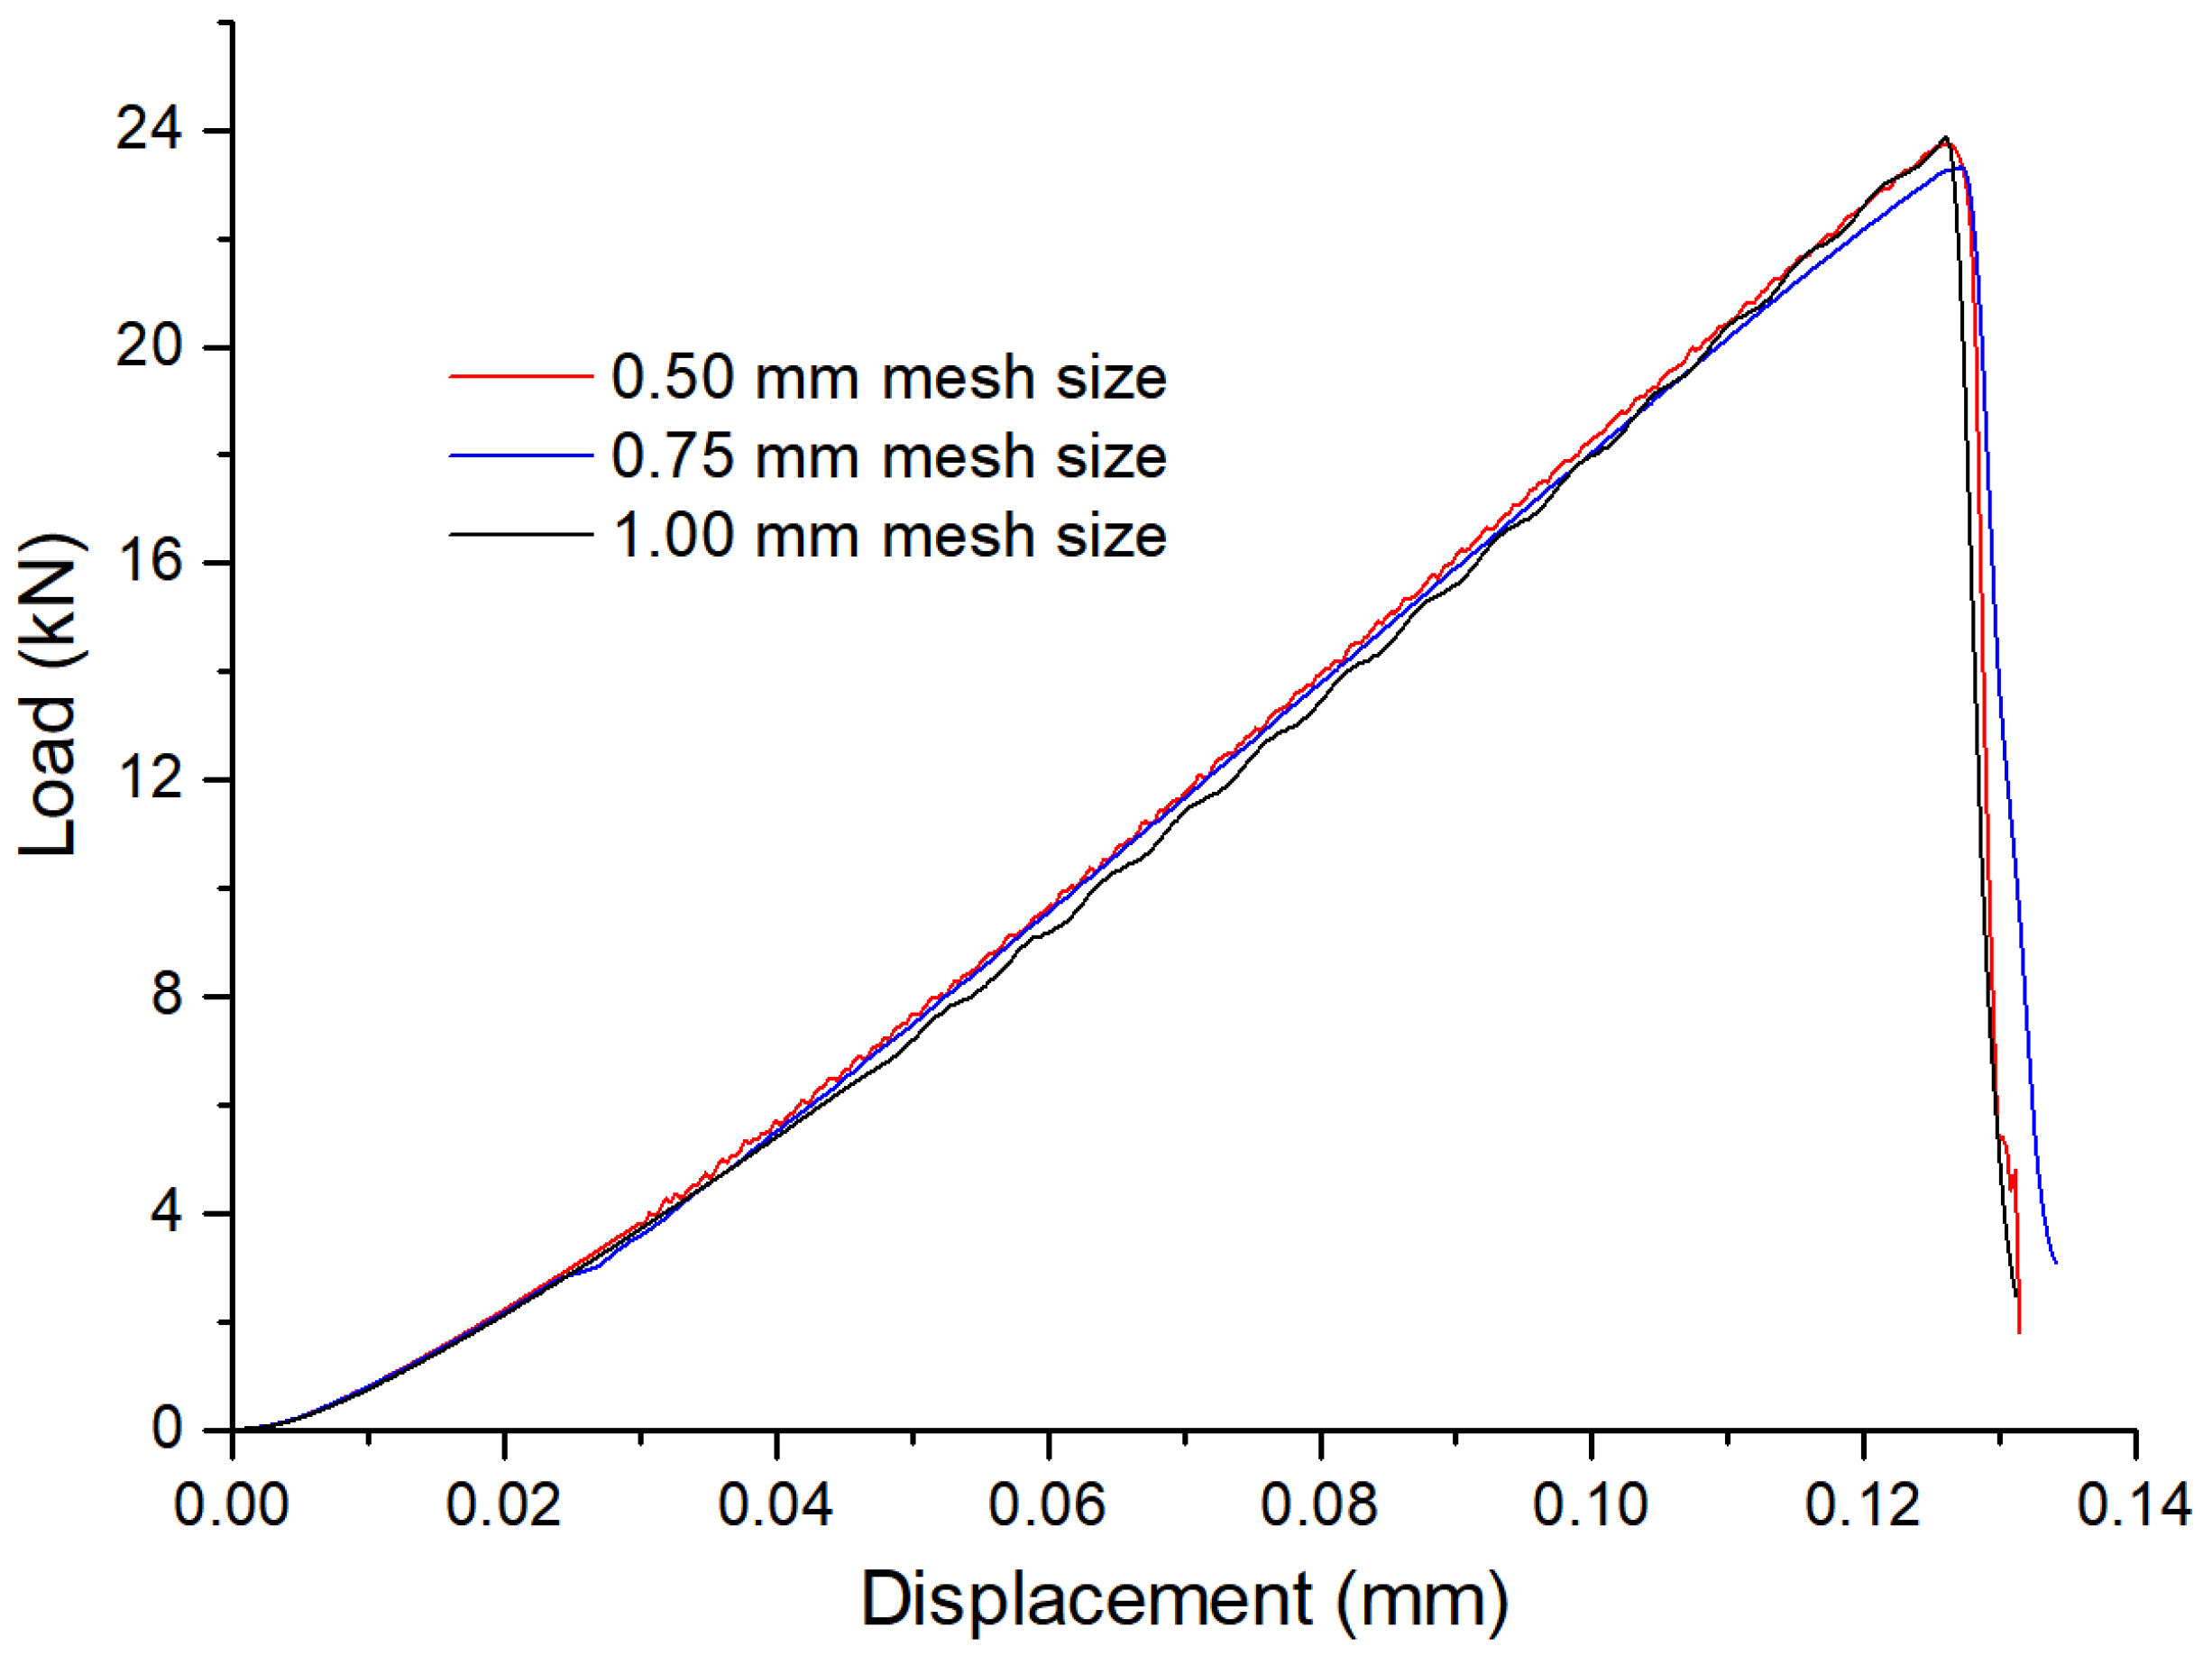
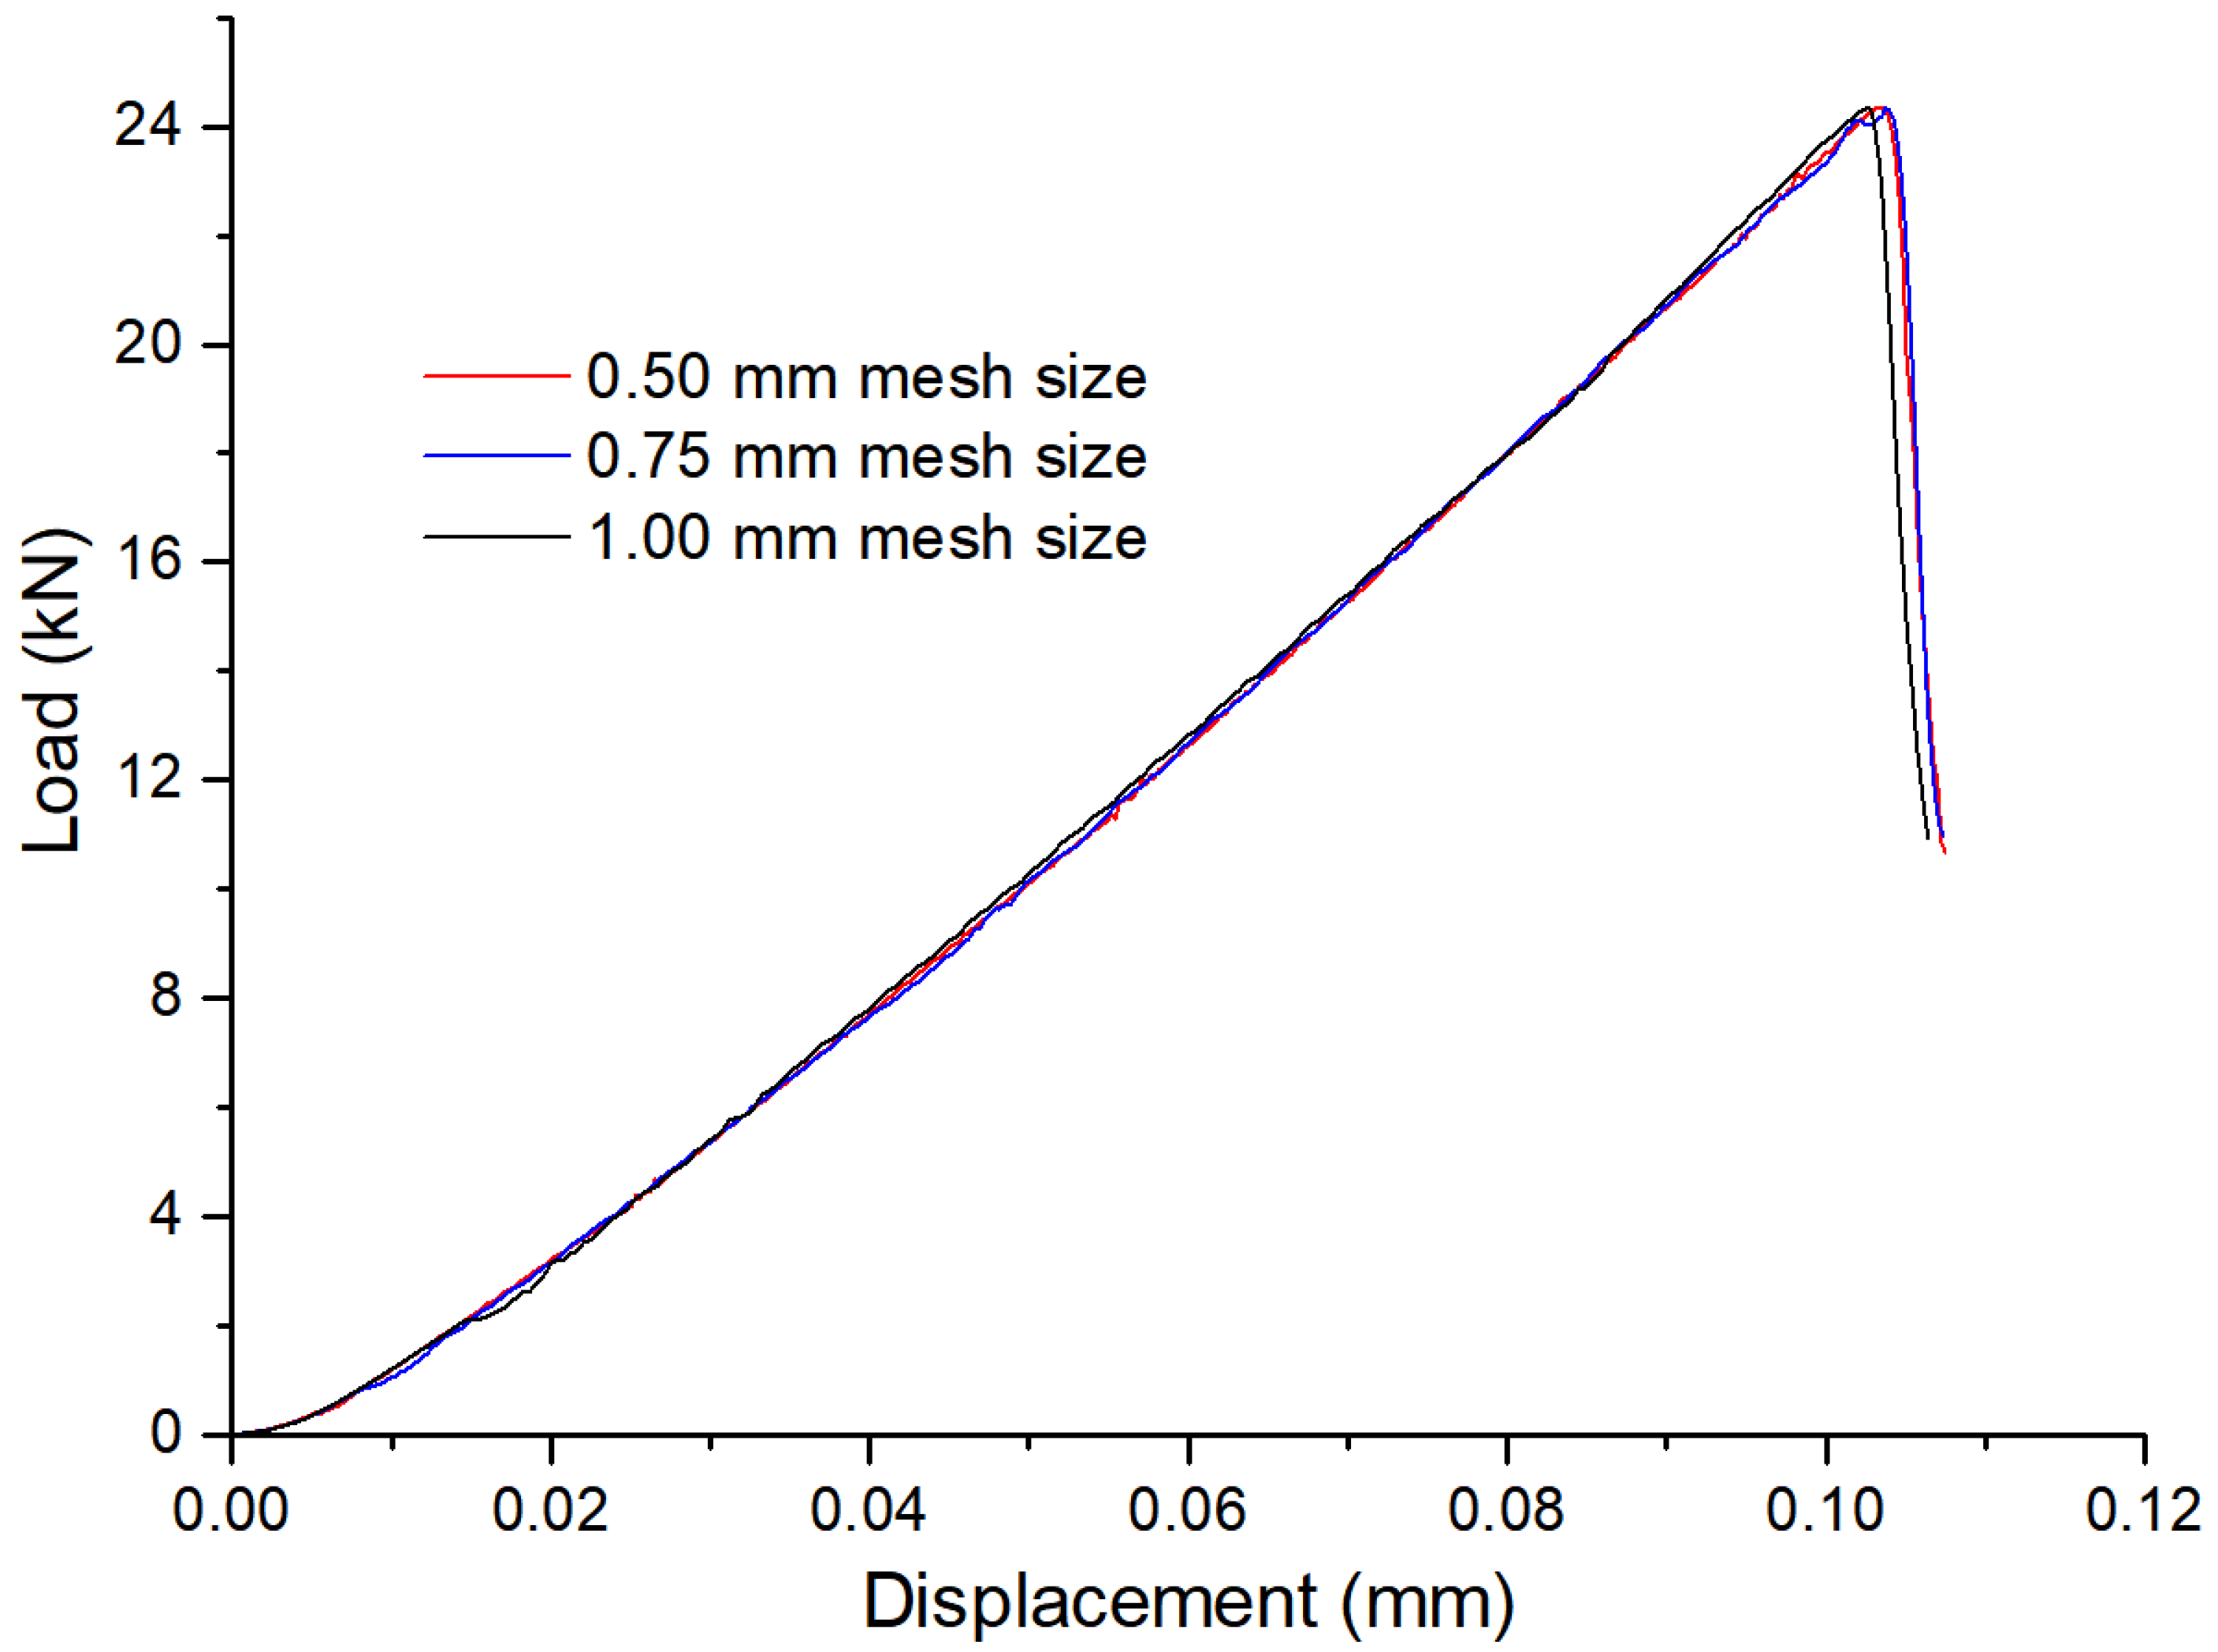
3.1. Load Versus Displacement Curve

The load and displacement are recorded through the loading plate. The horizontal direction is the X direction and the vertical direction is the Y direction. Figure 5 is the load–displacement curve for the Type I Brazilian disc testing. The peak load and peak displacement are 20.7 kN and 0.189 mm, respectively. The load–displacement curve before the peak value is approximately a straight line, and the vertical stress at the contact part between the rod and disc is much greater than that at other positions. Due to the small contact area between the rod and the disc, there is a large local compression stress concentration. When the macro crack almost penetrates the disc after the peak load, there is a certain vertical stress on both sides of the crack, and the vertical stress in other areas is very small.
Figure 6 is the load−displacement curve for the Type II Brazilian disc testing. The peak load and peak displacement are 23.8 kN and 0.126 mm, respectively. The load–displacement curve of the Type II test is similar to that of Type I. The stress concentration of the disc before the peak load under the Type II test is less than that of Type I. After the peak load, the vertical stress distribution of the disc is more evenly distributed on both sides of the crack. There are some arc−shaped stress zones around the vertical main crack, and the value of the arc−shaped stress zone decreases from the center to the circumference. The crack inside the disc is consistent with the loading direction and the occurrence of a straight crack is related to the spreading of stress propagation.
Figure 7 is the load–displacement curve for the Type III Brazilian disc testing. The peak load and peak displacement are 24.1 kN and 0.103 mm, respectively. The load–displacement curve of the Type III test before peak value is similar to that of Type II and Type I. After the crack penetrates the disc, the disc still has a certain bearing capacity, due to the contact area being larger than the Type II and Type I test. The stress concentration of the disc before the peak load of the Type III test is less than that of Type II and Type I, and the vertical stress distribution of the disc is more uniform in the whole loading stage. A more dense arc−shaped stress zone appears around the vertical main crack.

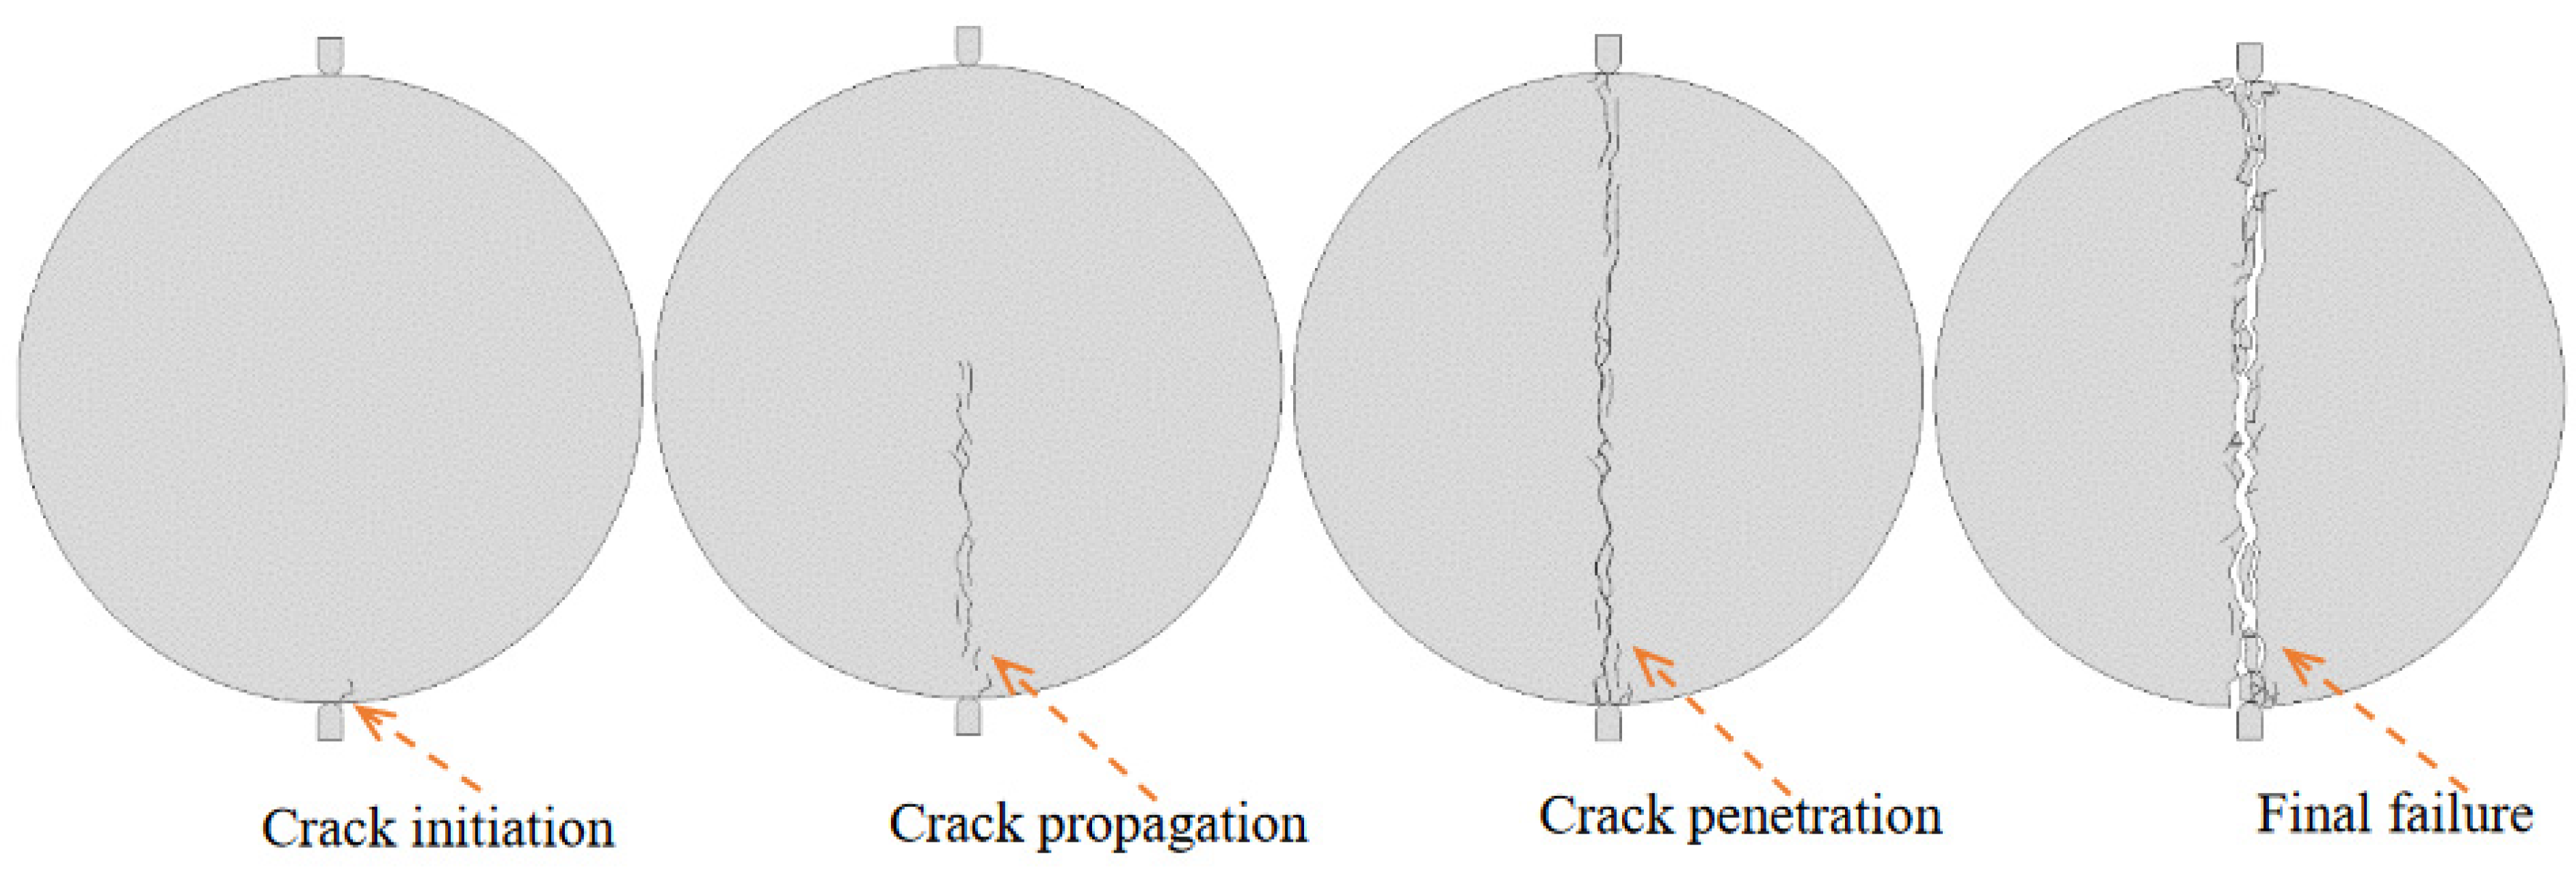
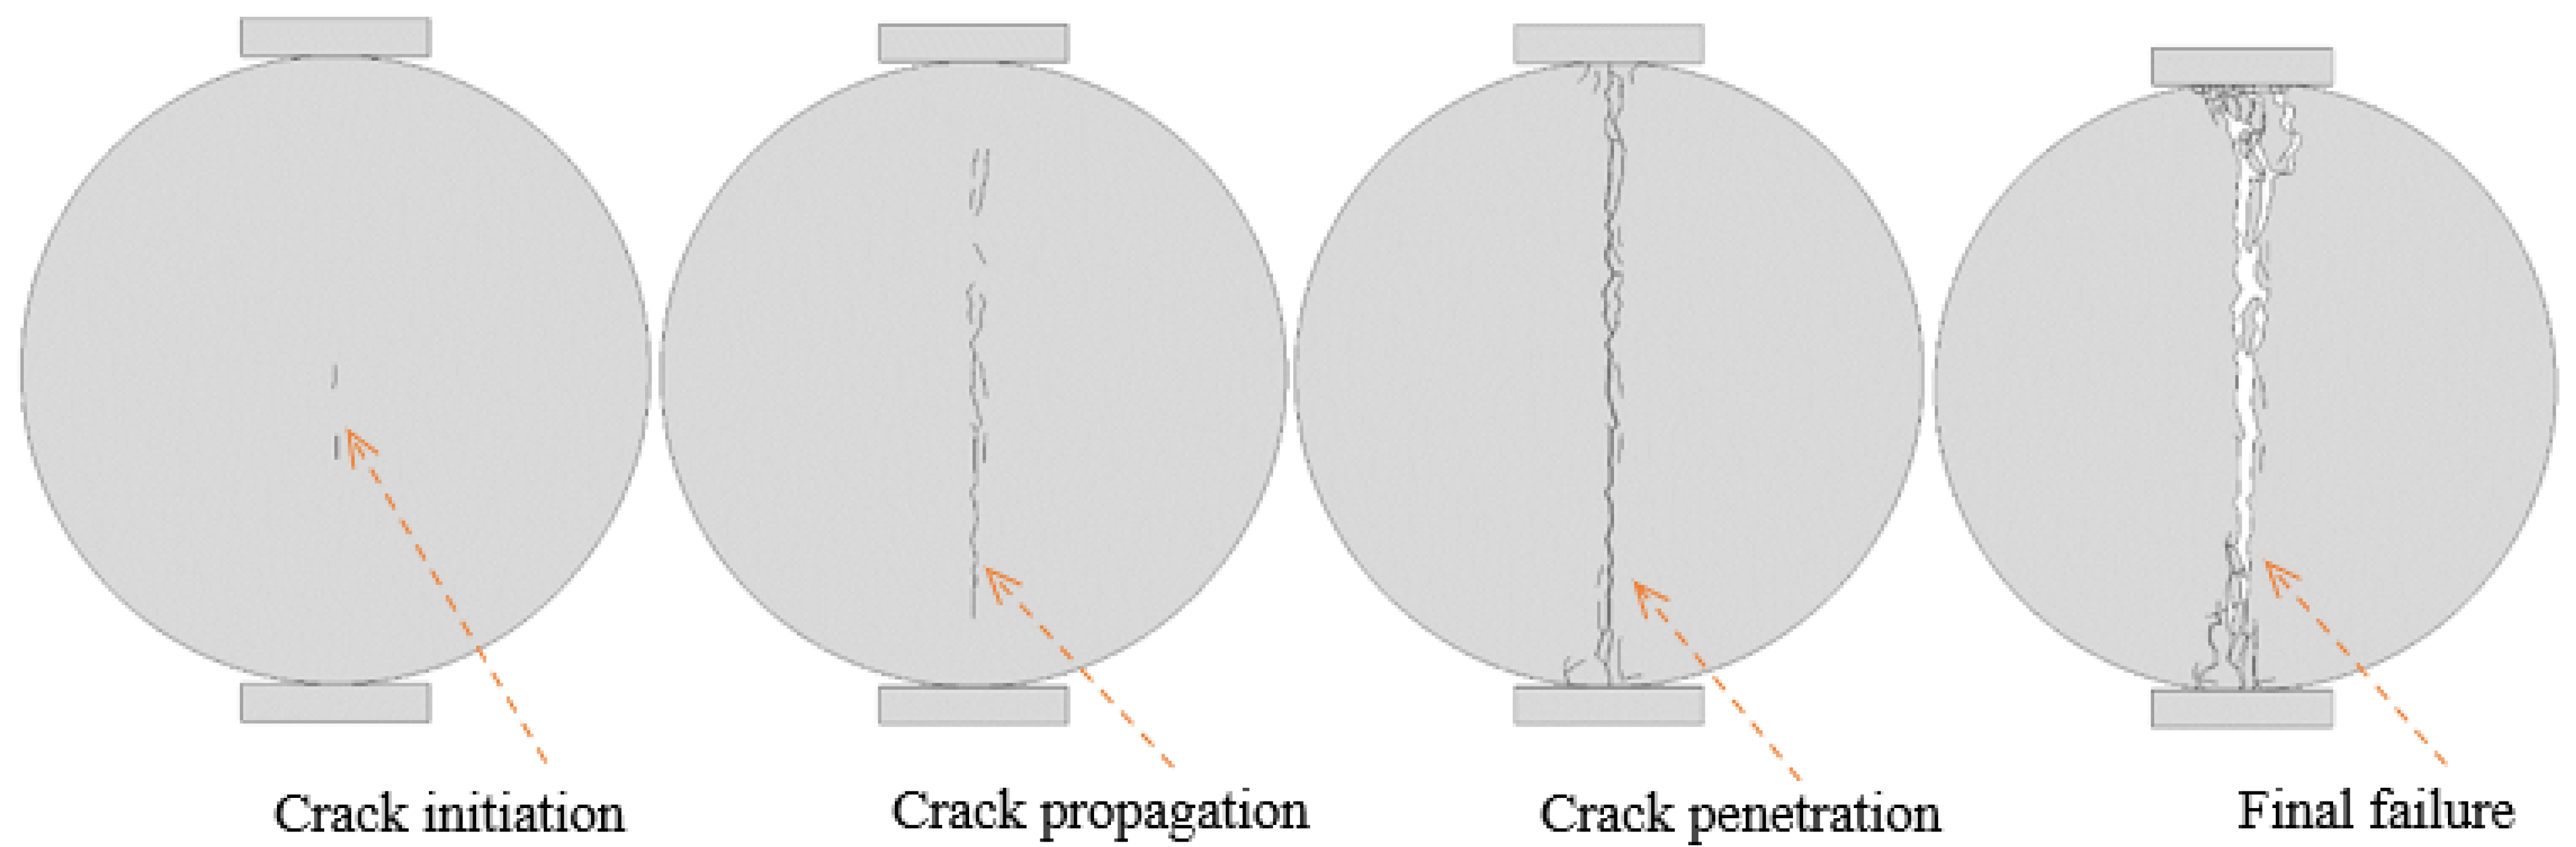
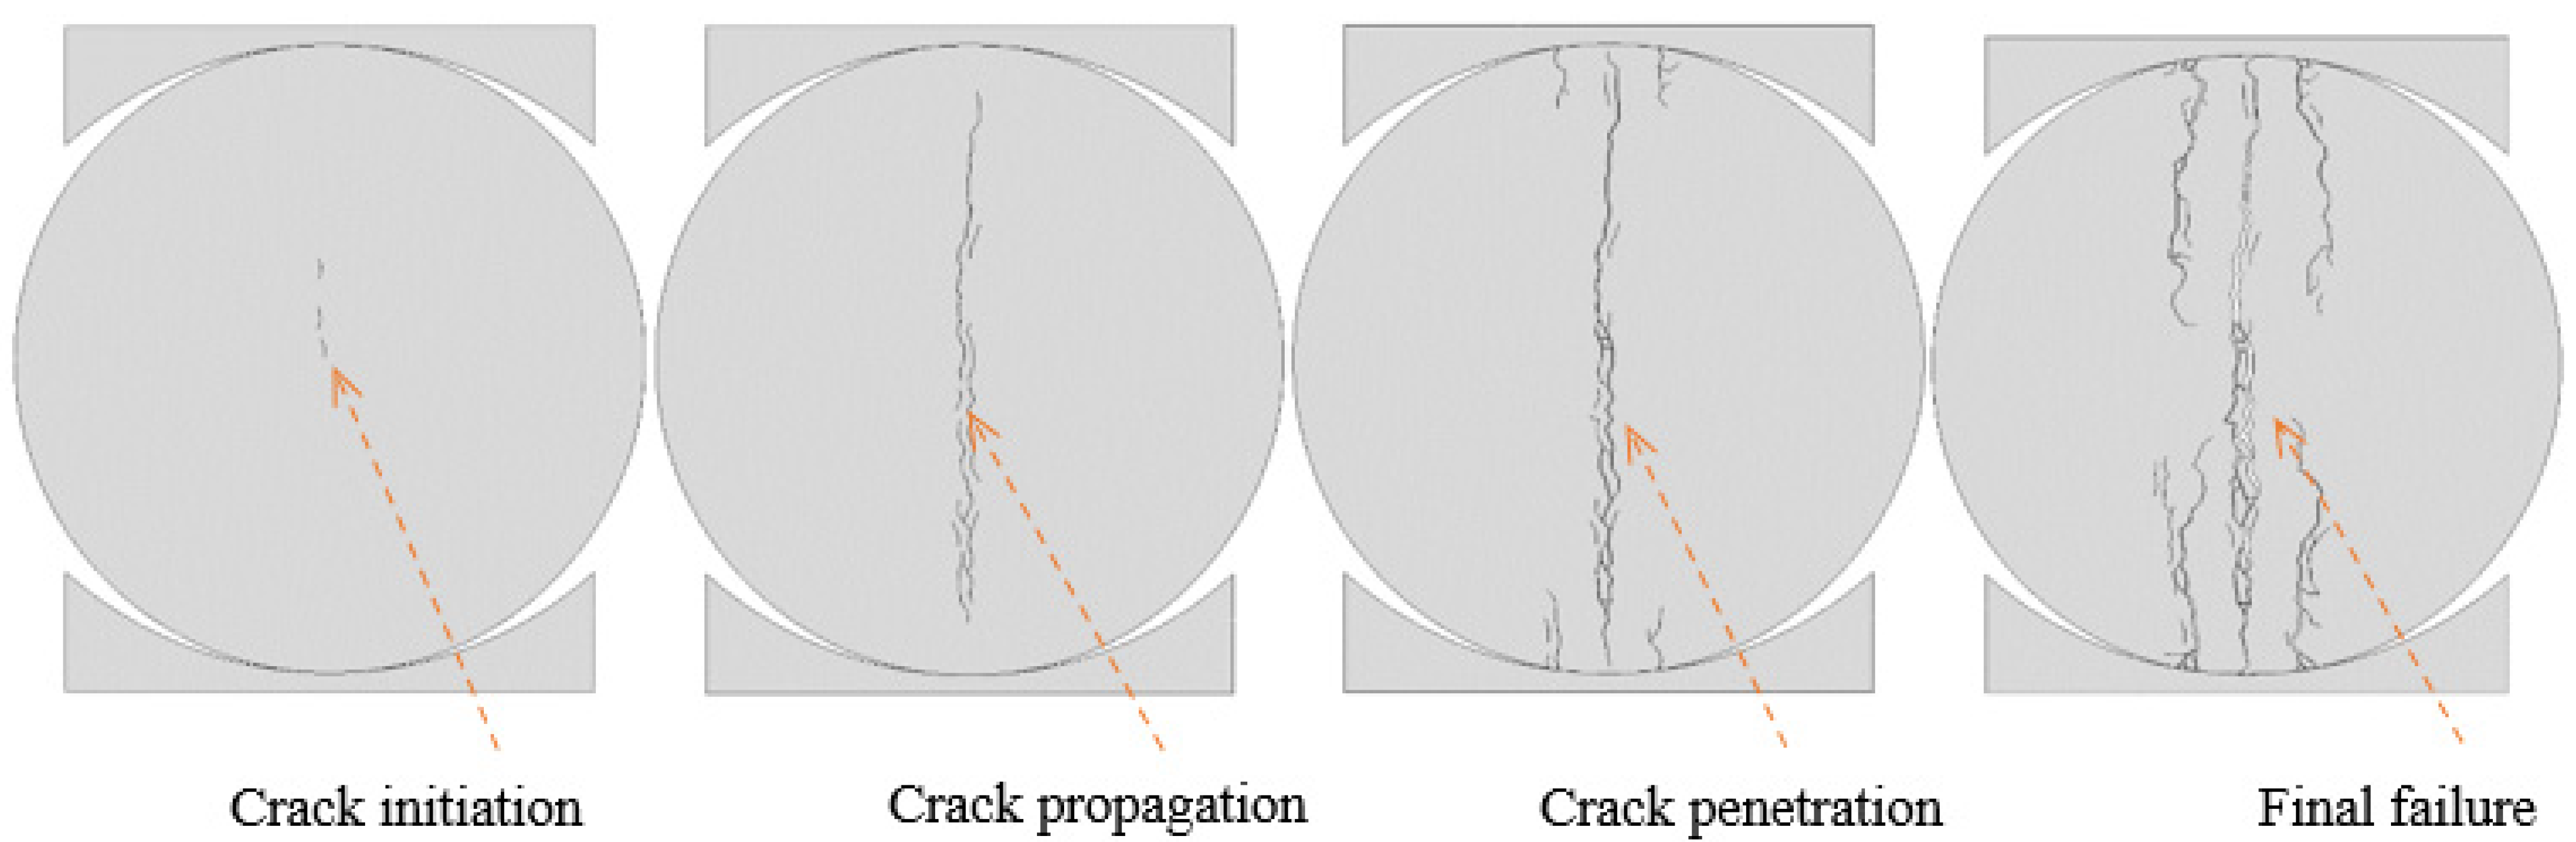
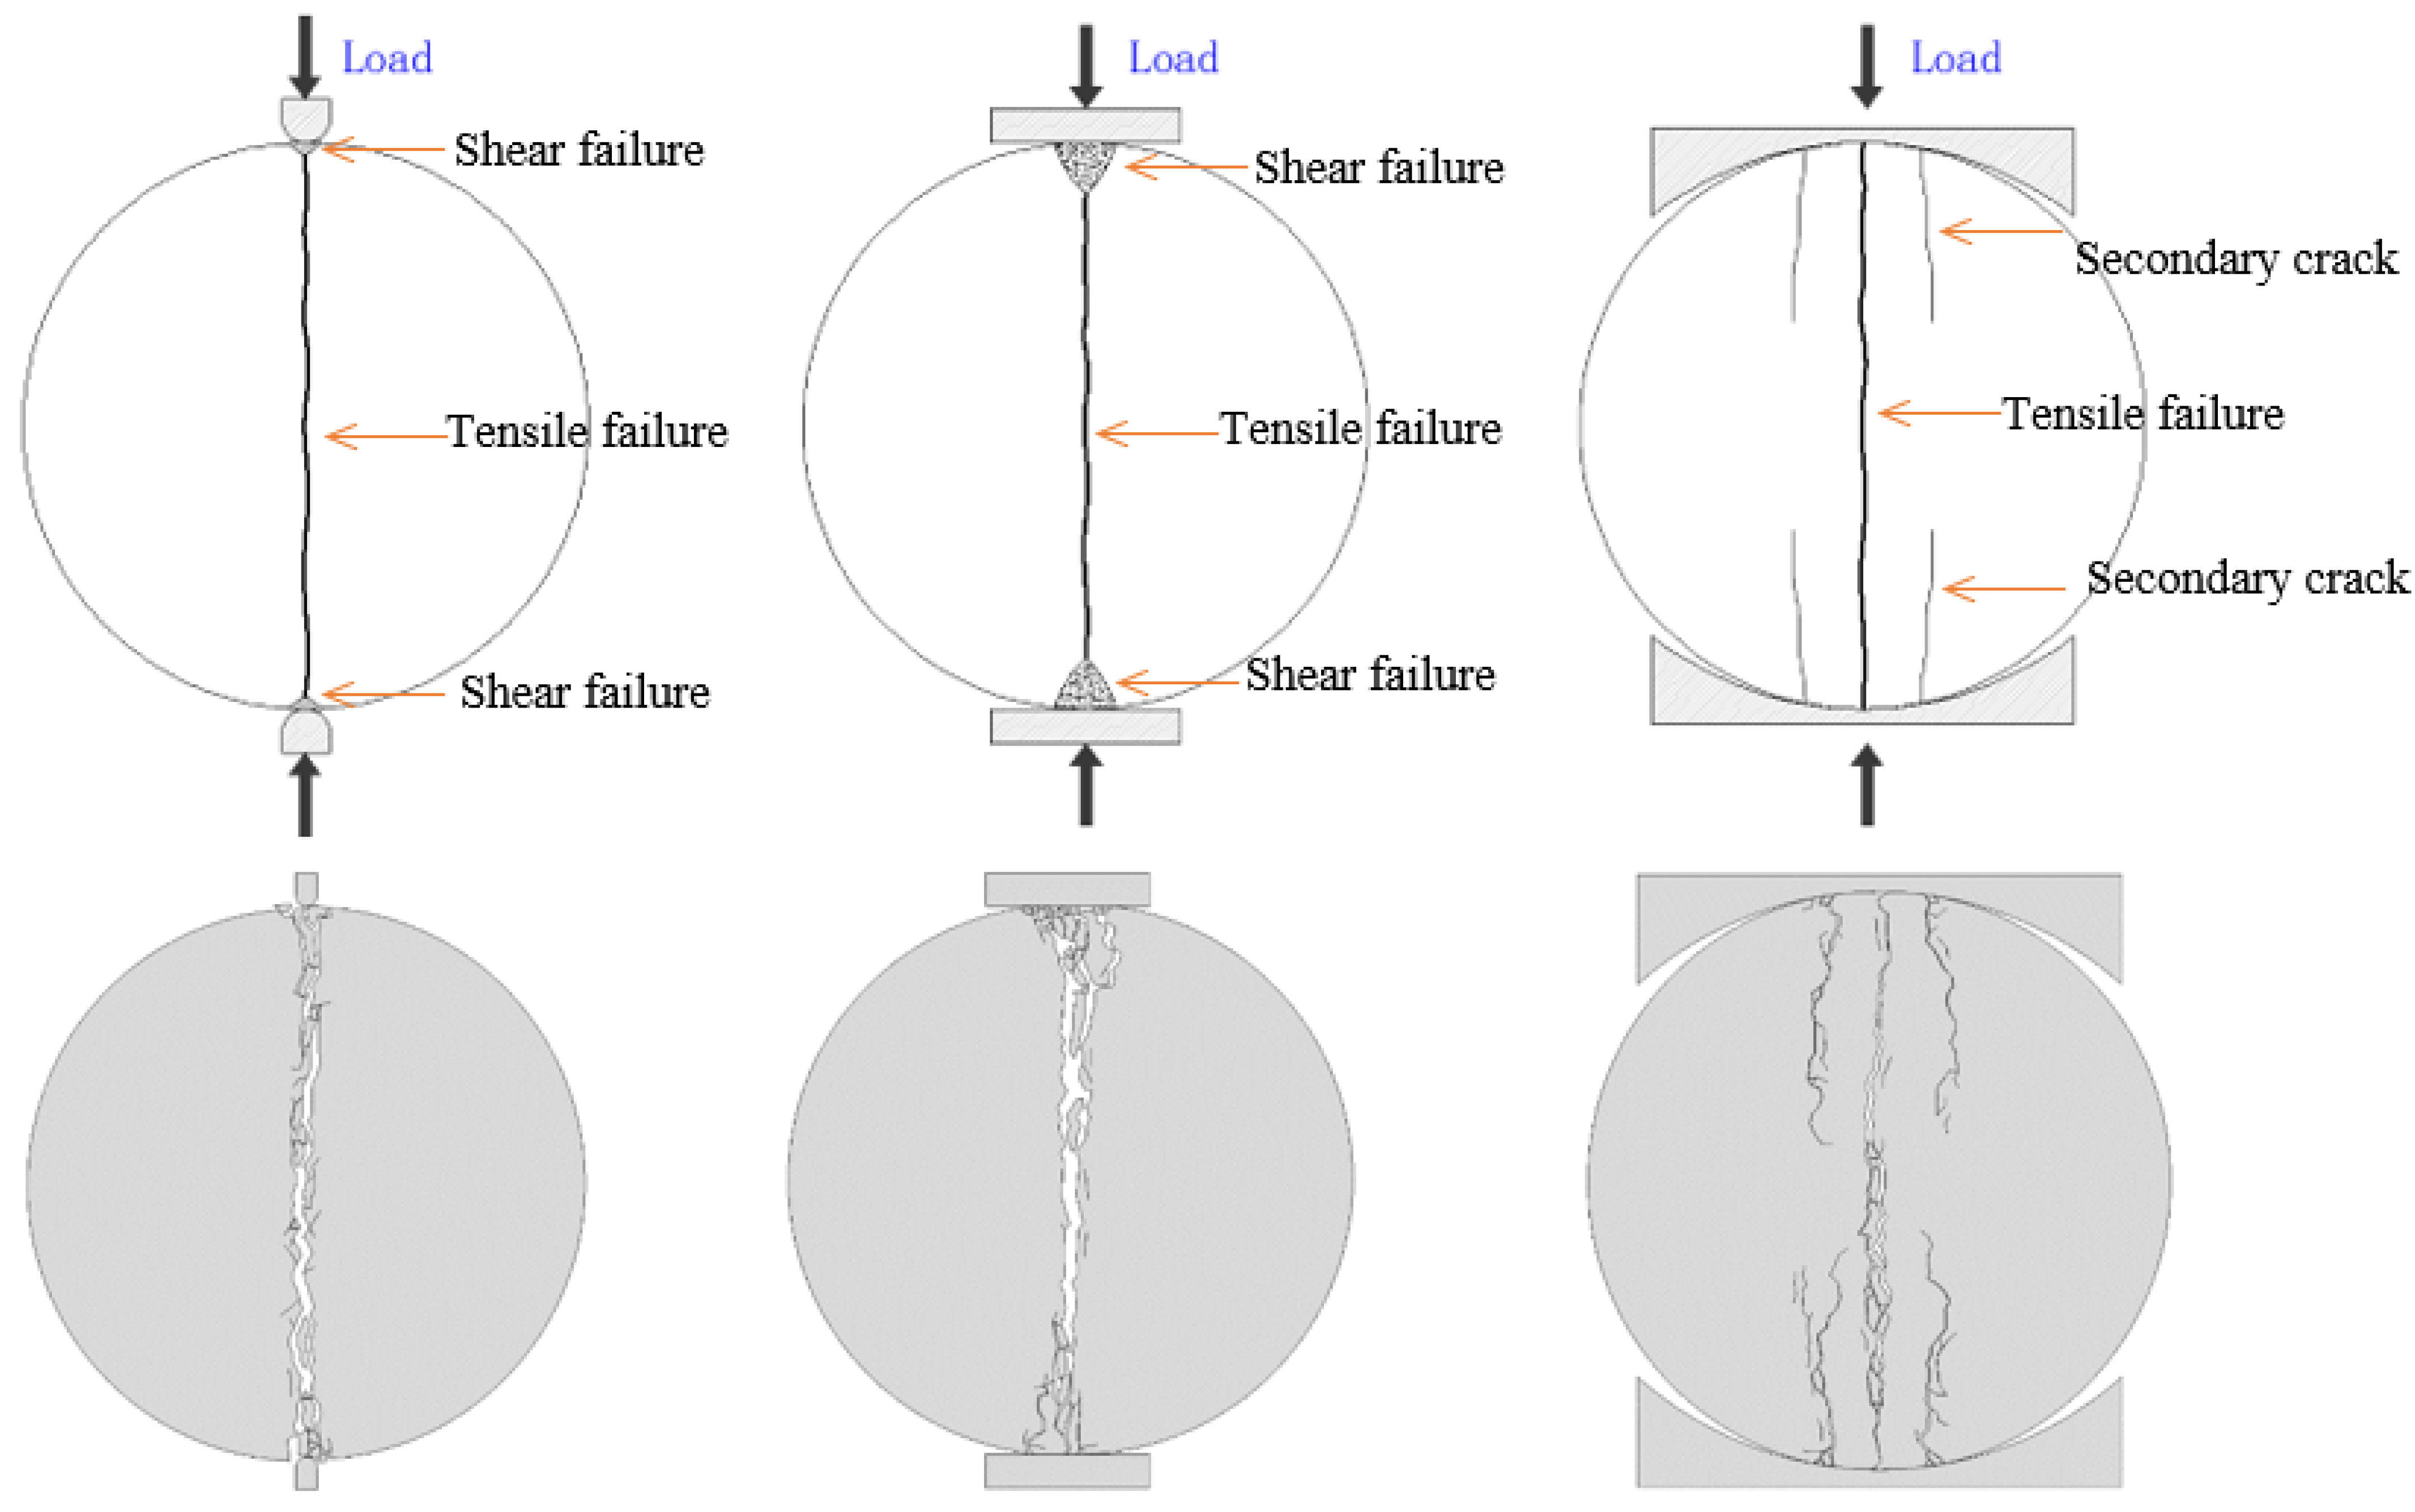
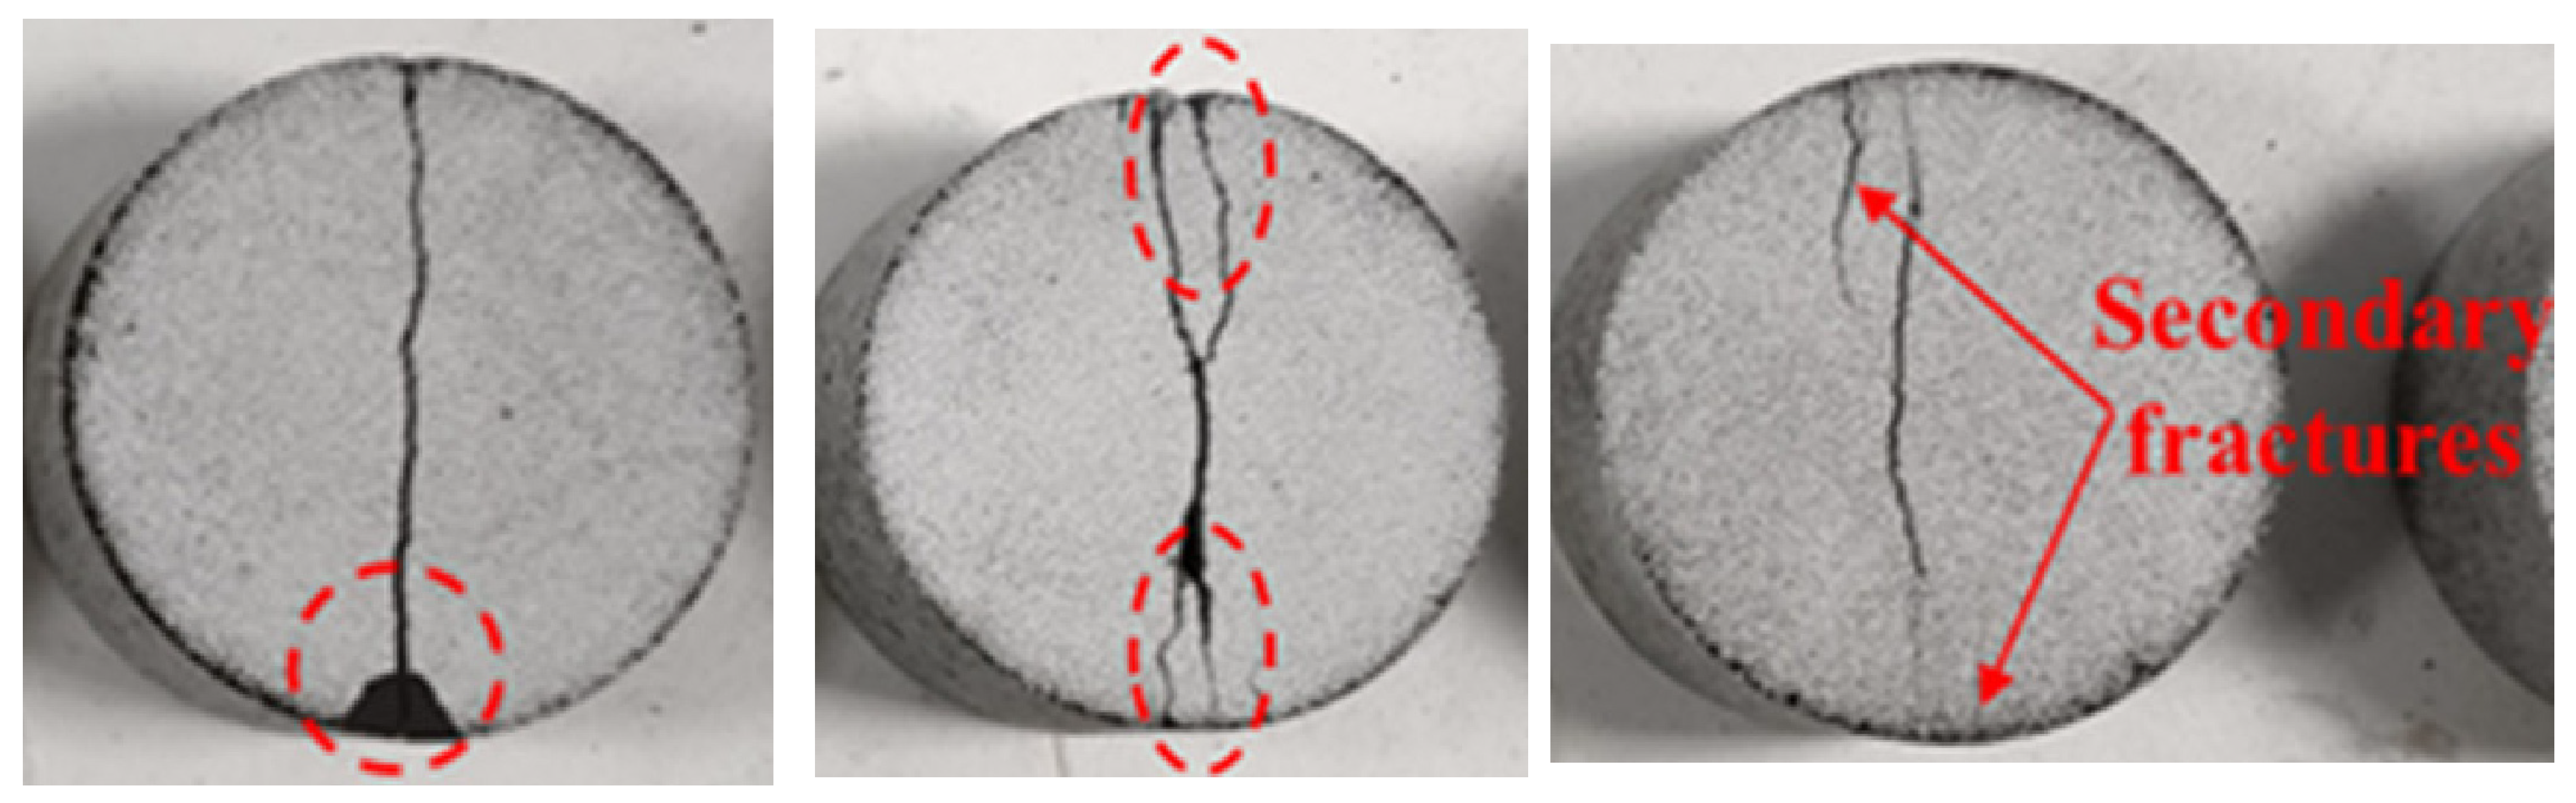
3.2. Fracture Process

In order to express the whole fracture process of the disc, the crack propagation process is divided into four parts: crack initiation, crack propagation, crack penetration, and final failure. Figure 8 is the fracture process for the Type I Brazilian disc testing. The crack of the Type I test starts at the end of the disc, then develops towards the center of the disc, and finally penetrates the disc. The disc is finally divided into two halves by the main crack. Although the final failure mode is good under Type I testing, the crack initiation point is located at the end of the disc due to the high degree of compressive stress concentration. It was also found by the digital image correlation method in Li’s physical test of five types of rocks [24].
Figure 9 is the fracture process for the Type II Brazilian disc testing. The crack in the Type II test starts from the center of the disc, then develops to both ends of the disc, and finally penetrates the disc. The disc was eventually divided into two halves, and the damage degree of the end of the disc is greater than that of the center. Although the end failure of the disc is serious under the Type II testing, the crack initiation point is close to the center of the disc, which is consistent with the hypothesis of the Brazilian disc test.
Figure 10 is the fracture process for the Type III Brazilian disc testing. The crack in the Type III test starts from the center of the disc and then develops to both ends of the disc. When the main crack penetrates the disc, the secondary cracks are generated on both sides of the main crack. The disc is finally divided into two parts, accompanied by obvious secondary cracks. Although four secondary cracks appeared at the end of the disc under Type III testing, the starting point of the main crack was close to the center of the disc, which was also consistent with the hypothesis of the Brazilian disc test.

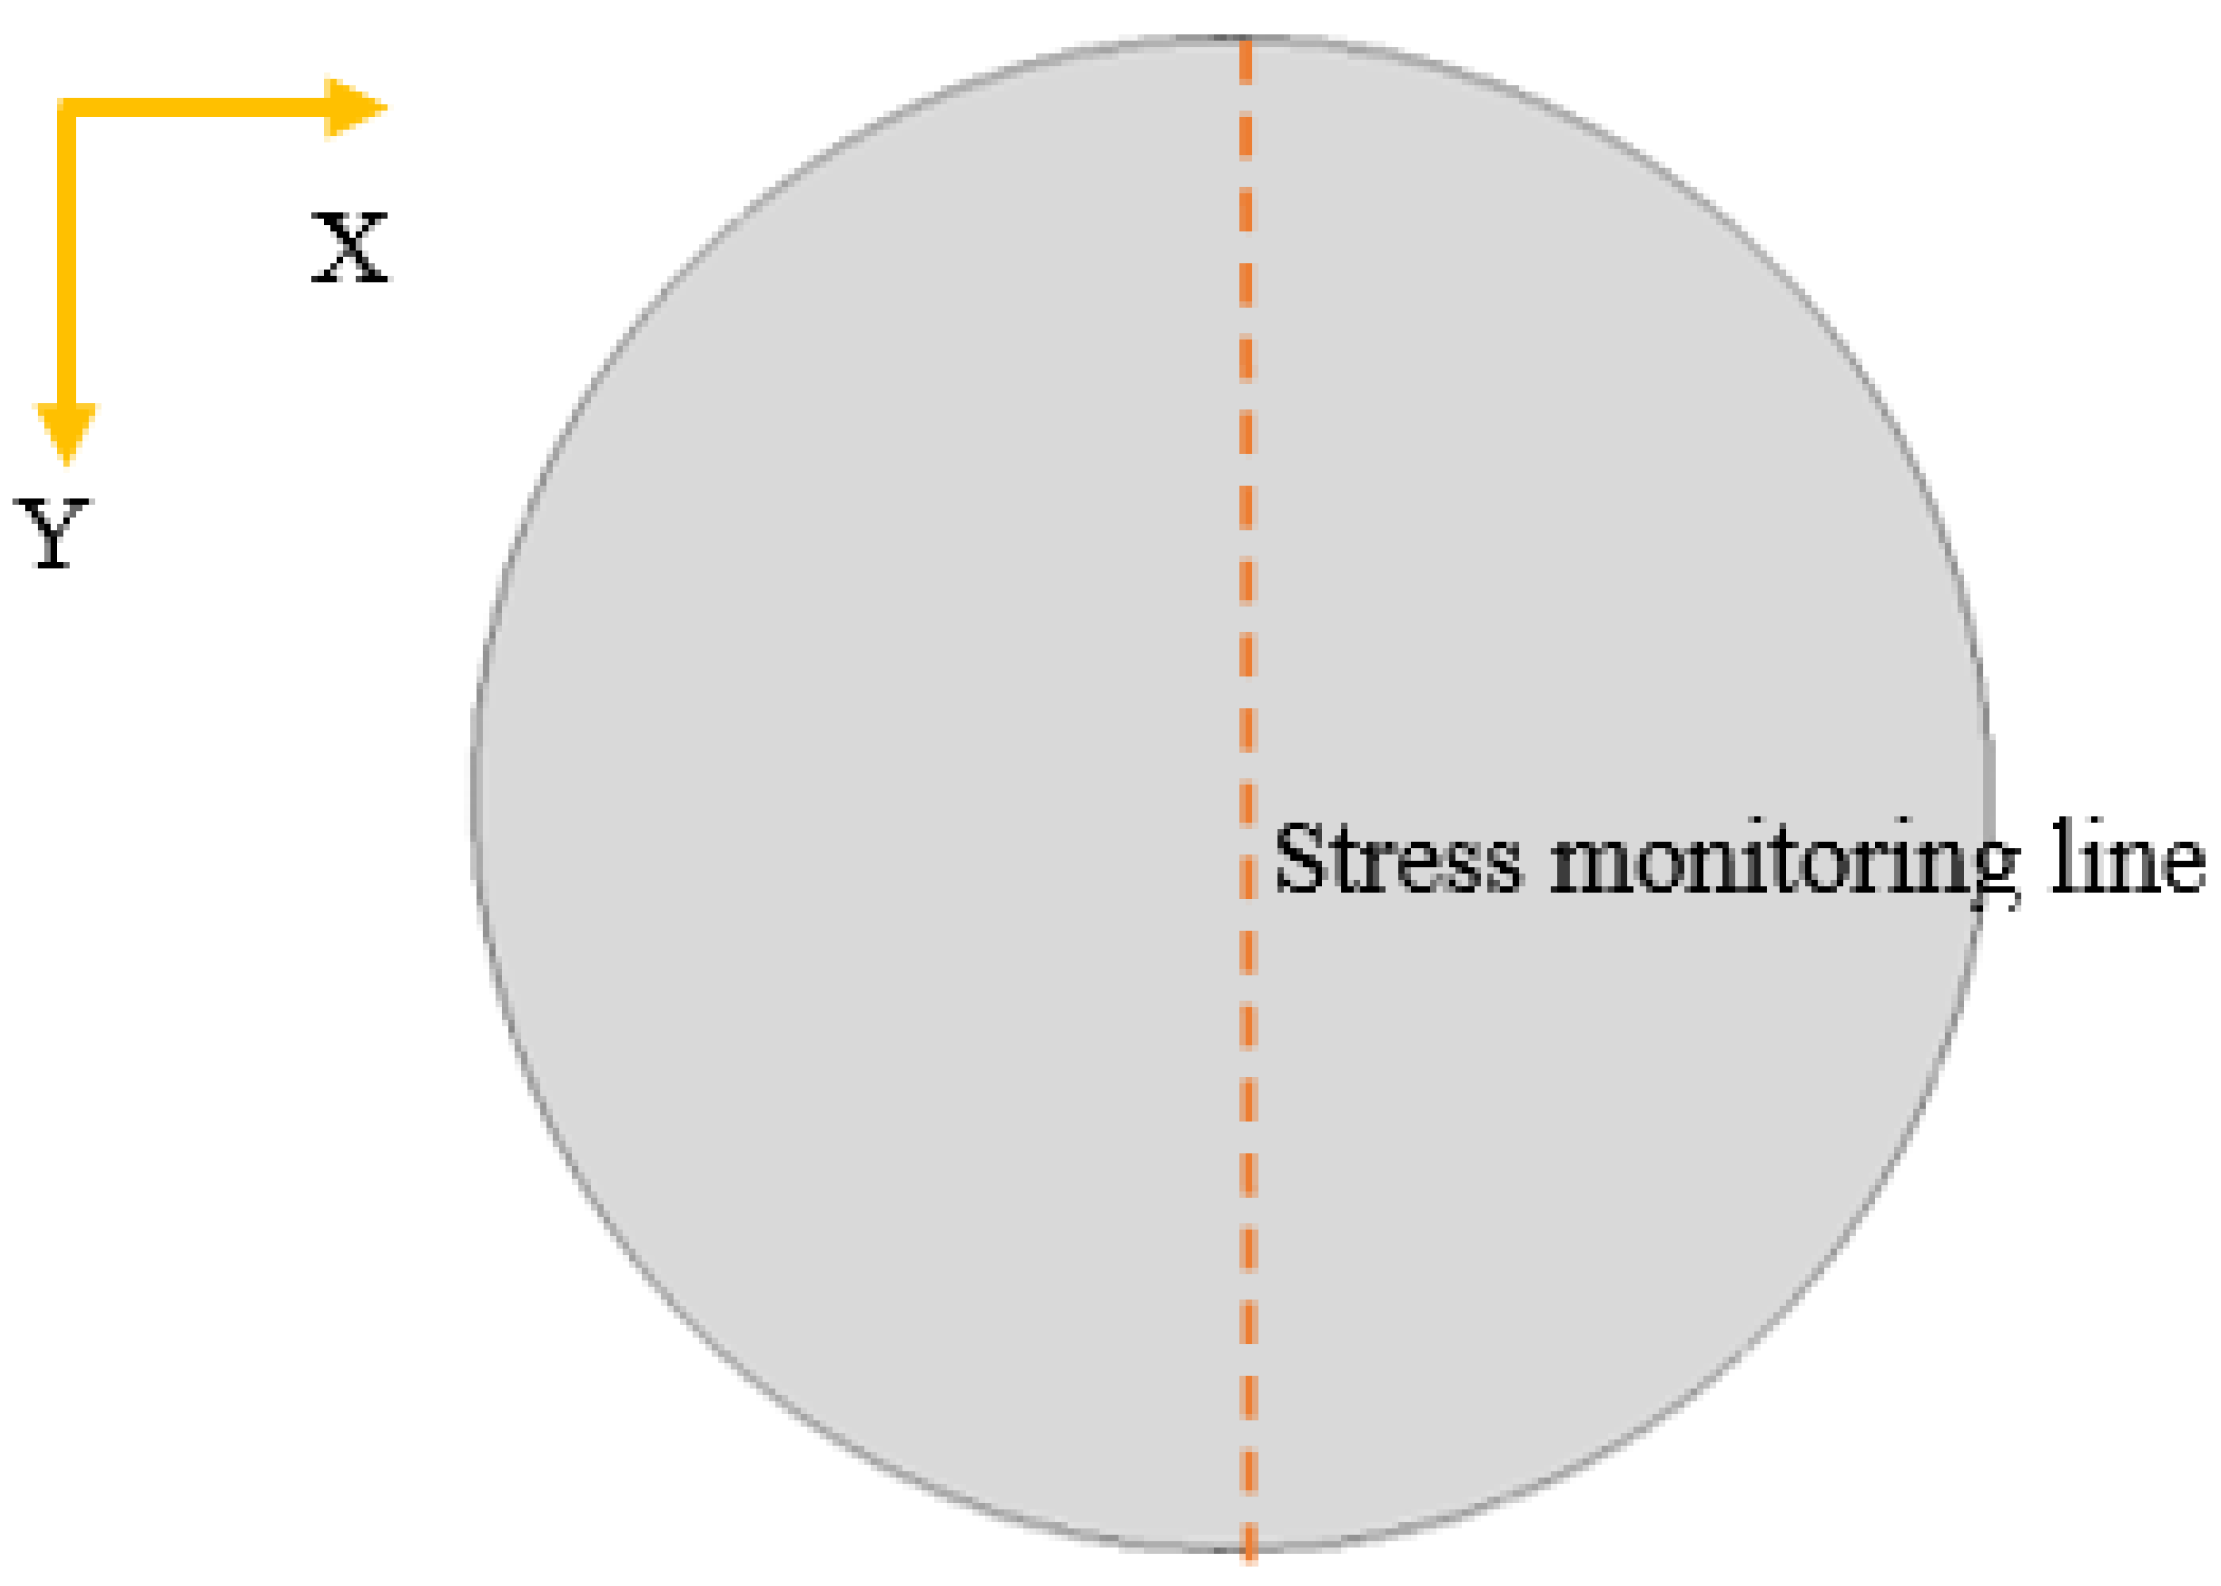
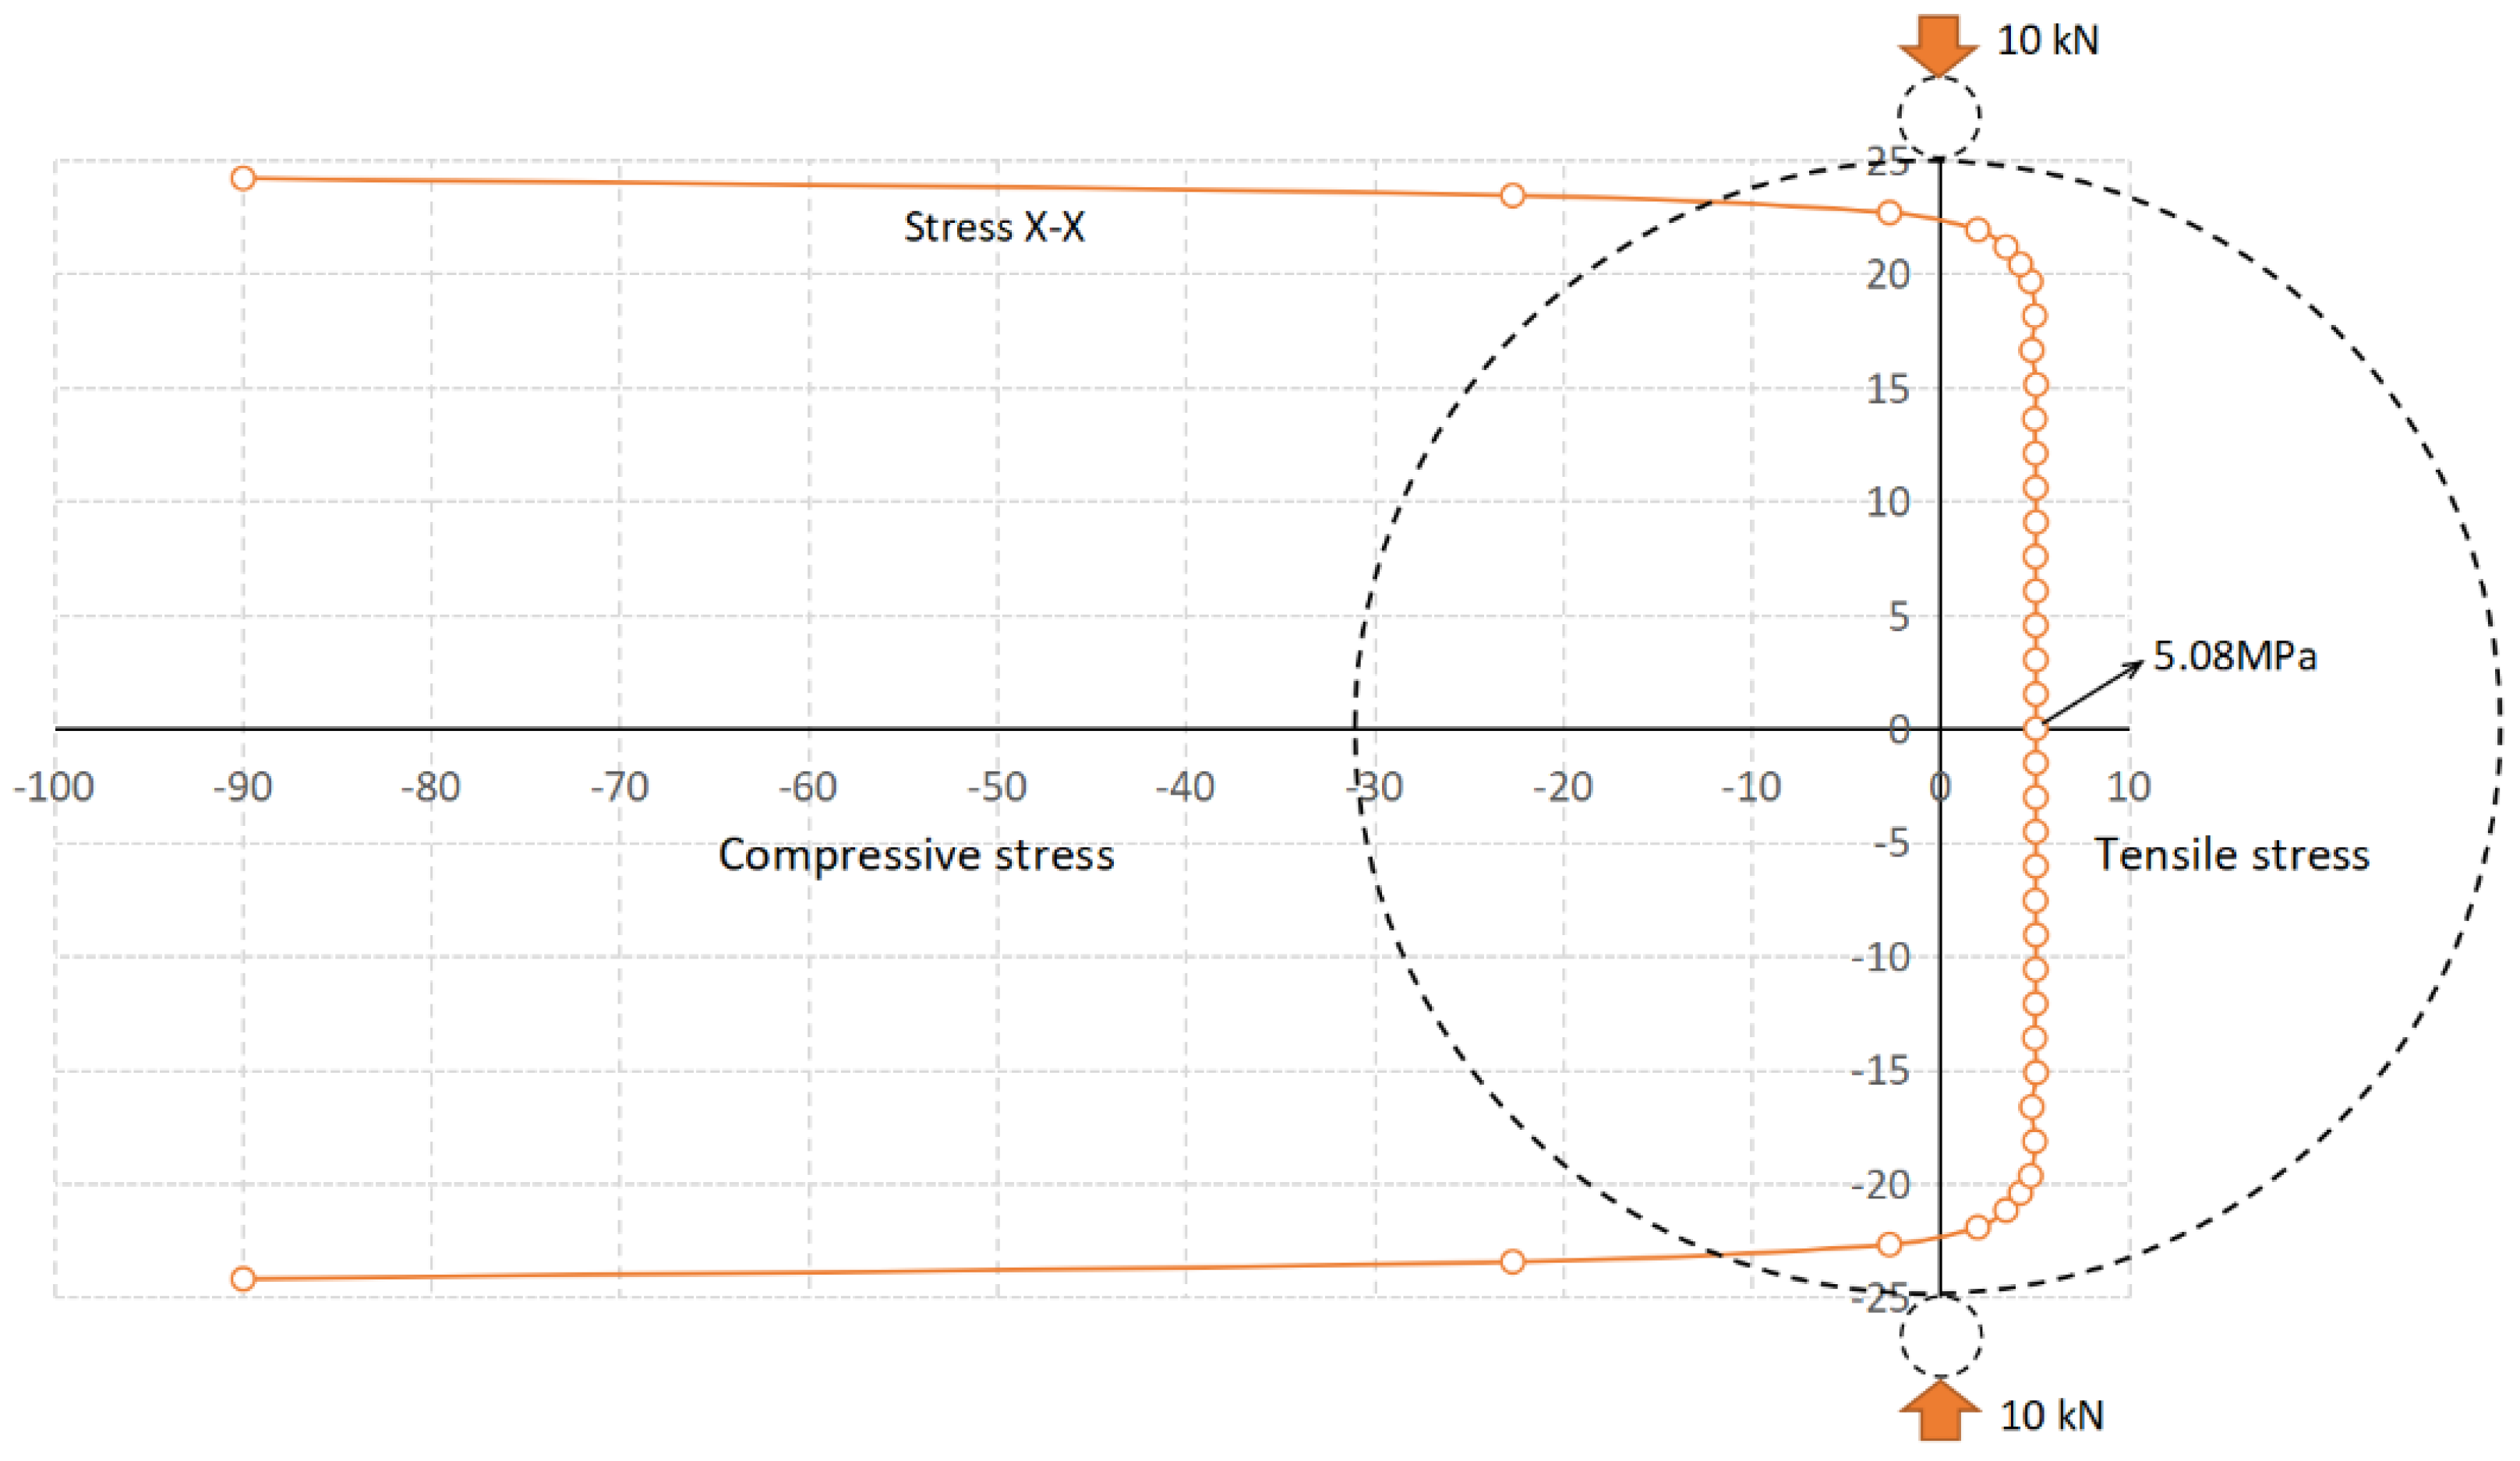
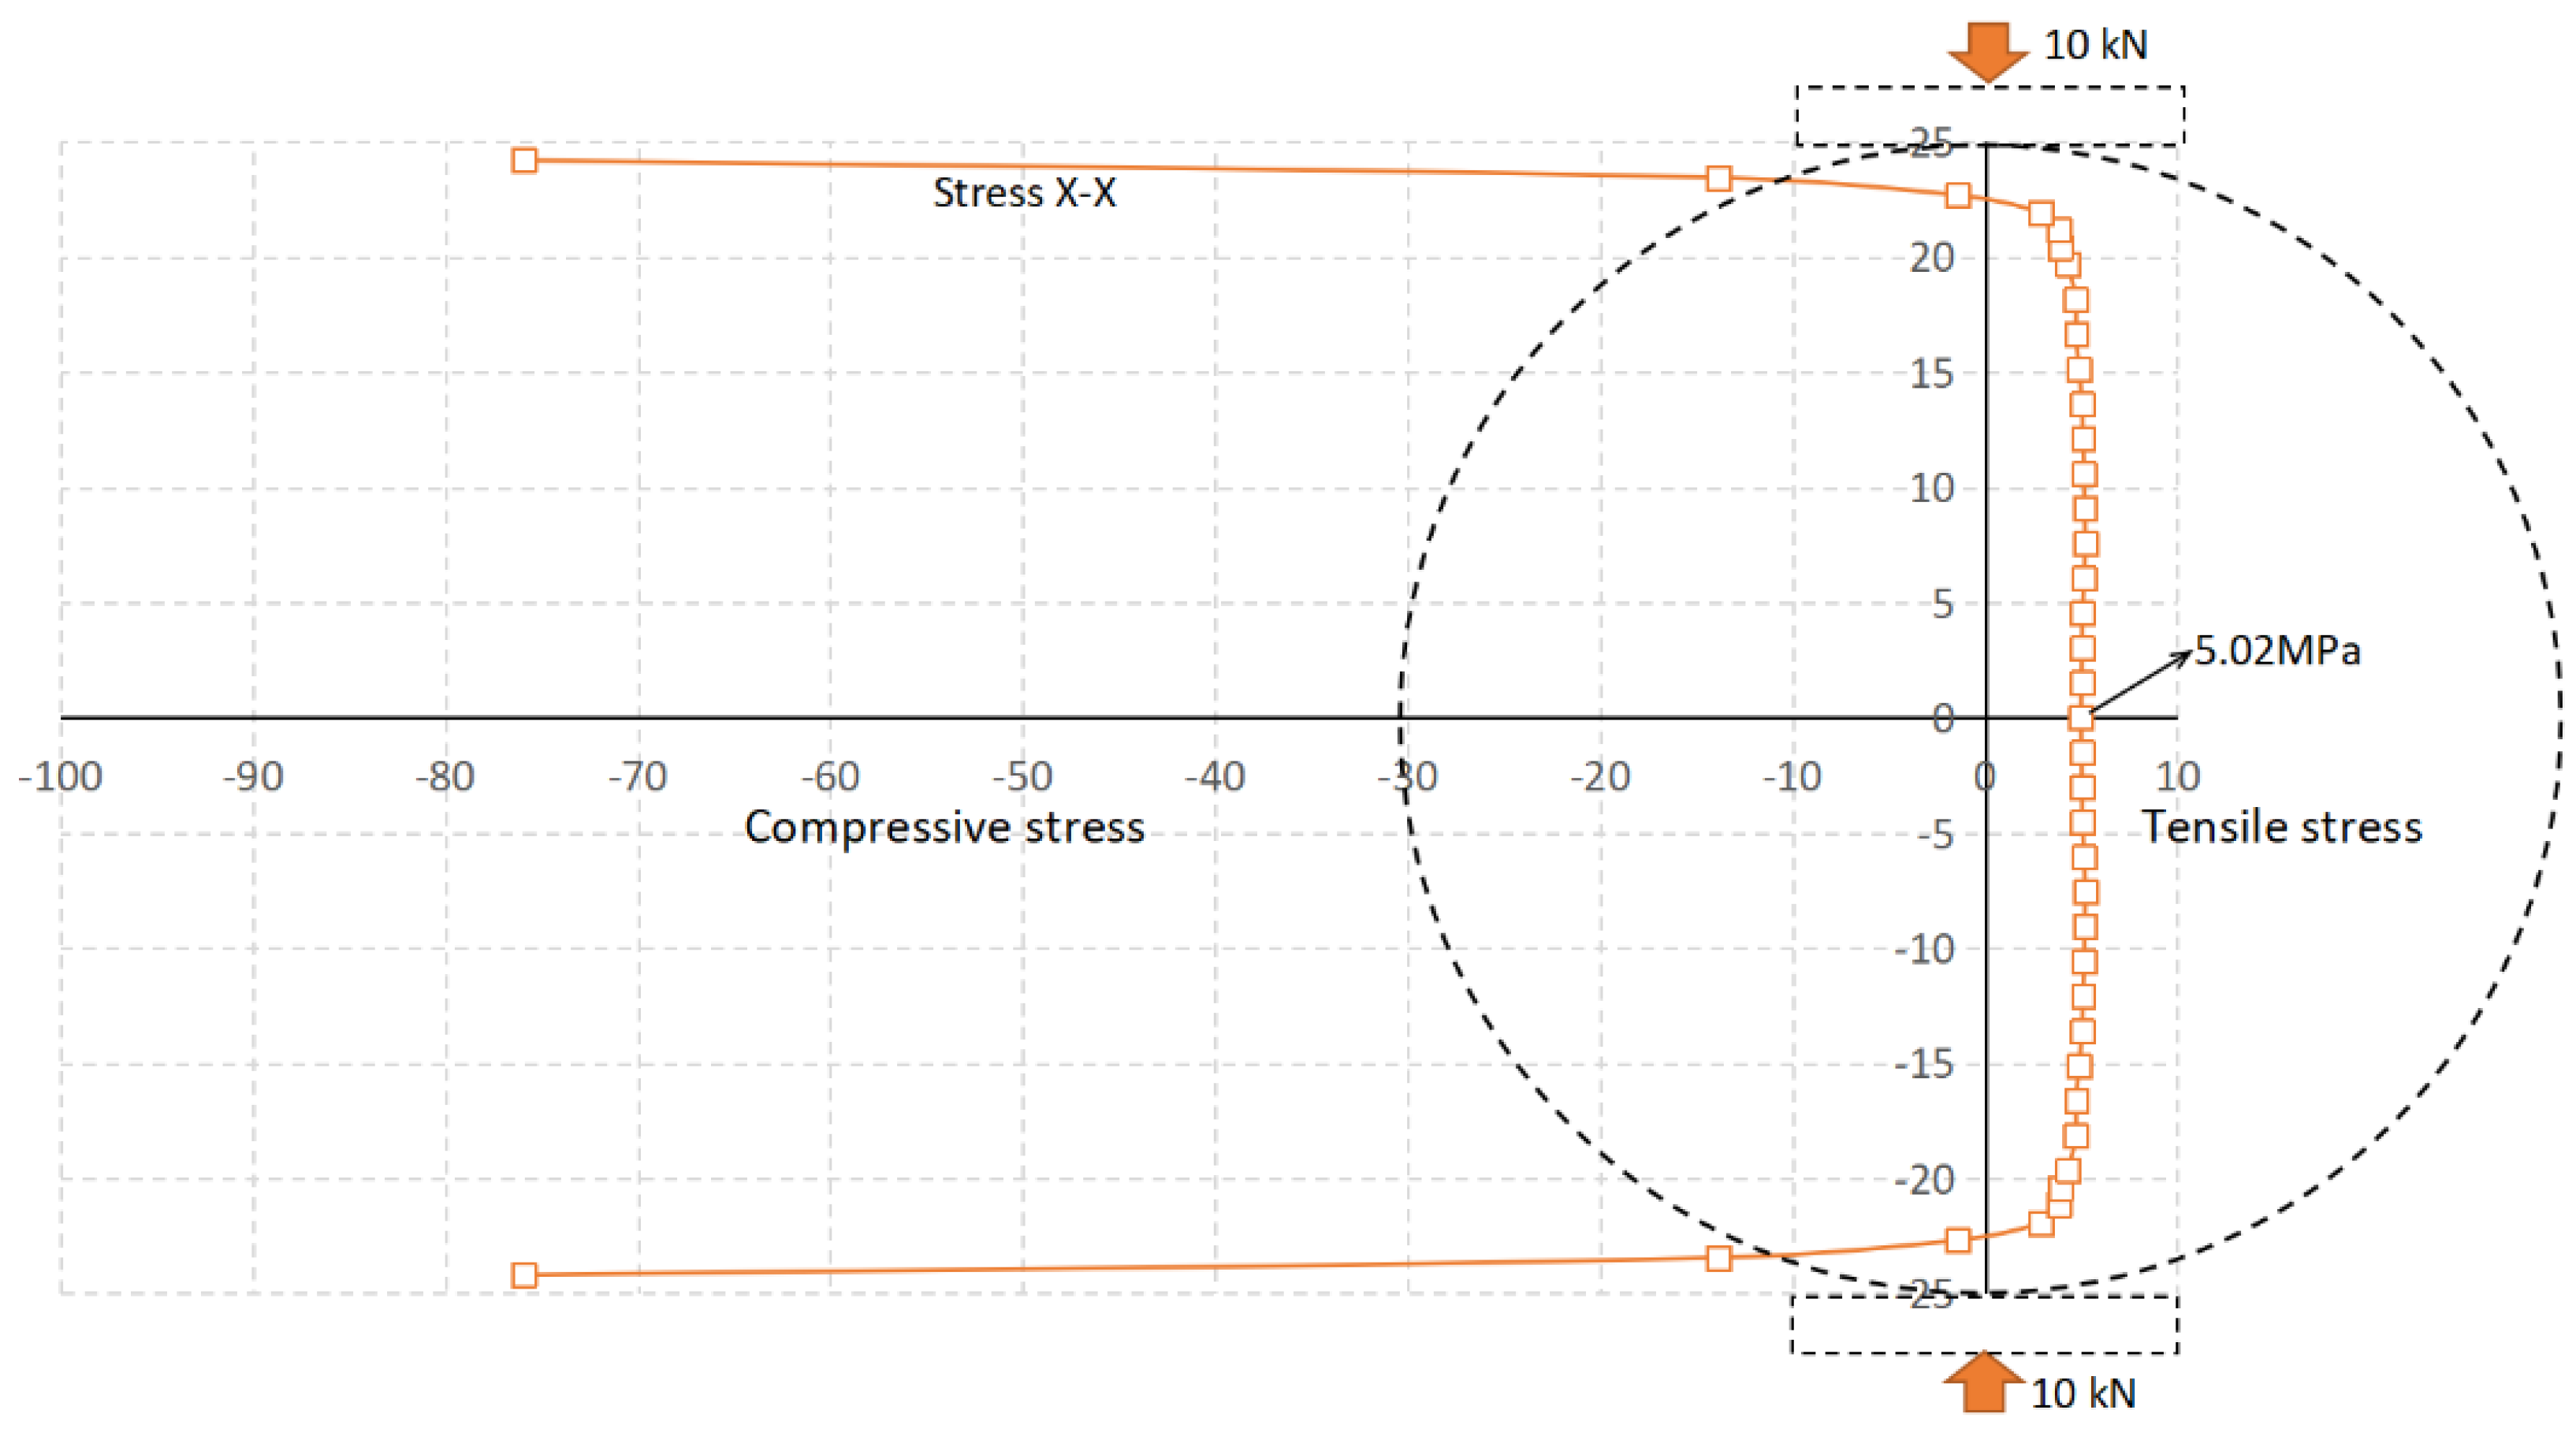
3.3. Stress Distribution in Central Line

As shown in Figure 11, a horizontal stress monitoring line is arranged in the center of the Brazilian disc. Figure 12 is the horizontal stress X-X distribution in the monitoring line for Type I testing under an external load of 10 kN. It shows that the horizontal stress distribution within the range of less than 20 mm from the center is relatively uniform, and the horizontal tensile stress is approximately 5.08 MPa. When the distance from the center is more than 20 mm, the horizontal stress changes rapidly from tensile stress to compressive stress with a large value. When the distance from the center is 24.5 mm, the horizontal compressive stress reaches 90 MPa.
Figure 13 is the horizontal stress X-X distribution in the monitoring line for Type II testing under an external load of 10 kN. It shows that the horizontal stress is approximately a tensile stress of 5.02 MPa within the range of less than 18 mm from the center. When the distance from the center is more than 18 mm, the horizontal stress changes rapidly from tensile stress to compressive stress with a large value. When the distance from the center is 24.5 mm, the horizontal compressive stress reaches 78 MPa.
Figure 14 is the horizontal stress X-X distribution in the monitoring line for Type III testing under an external load of 10 kN. It shows that the horizontal stress is approximately a tensile stress of 4.96 MPa within the range of less than 18 mm from the center. When the distance from the center is more than 18 mm, the horizontal stress changes rapidly from tensile stress to compressive stress with a large value. When the distance from the center is 24.5 mm, the horizontal compressive stress reaches 77 MPa.
Comparing Figure 12, Figure 13 and Figure 14, it can be seen that under the same load, the stress concentration on the stress monitoring line of the Type I test is the most obvious. The stress concentration of Type II and Type III tests decrease in turn, which can also be seen from Figure 5, Figure 6 and Figure 7. Under the same external load, the difference of the maximum tensile stress within 18 mm (0.7 times the disc radius) of the center for the three Types of tests is small, and the difference is mainly reflected in the compressive stress at the end of the disc. Type III testing is beneficial for reducing stress concentrations at the ends of the disc, which is conducive to the initiation of cracks in the center of the disc.

3.4. Evolution of Fracture Process Zone

The plastic strain law in the model has been described in Figure 3. The strain generated after the peak elastic strain is defined as the plastic strain, which is used to characterize the fracture process zone before fracture. Figure 15 is the plastic strain evolution with load for the Type I loading. When the external load is 6.8 kN, two plastic zones appear in the contact part between the disc and the rod. When the external load is 20.6 kN, the plastic strain at the end of the disc is approximately 0.2%, which indicates that the damage at the end is obvious. As the loading progresses, the crack initiates from the plastic zone at the bottom of the disc. At 19.2 kN, after the peak load, the plastic zone develops rapidly to the center of the disc, and the crack develops rapidly in the plastic zone. Finally, the plastic zone continues to develop rapidly throughout the disc, resulting in a rapid decrease in the load−carrying capacity of the disc.
Figure 16 is the plastic strain evolution with load for the Type II loading. When the external load is 17.5 kN, the plastic zone appears in the contact part between the disc and the flat platen. When the external load is 22.0 kN, the plastic zone develops rapidly in the center of the disc. As the loading progresses, the crack initiates from the center of the plastic zone of the disc. At 20.0 kN, after the peak load, the plastic zone continues to develop rapidly throughout the disc and a crack develops rapidly in the plastic zone. At 7.7 kN, after the peak load, two triangular plastic zones are formed at the end of the disc, which is the cause of shear failure at the end of the disc under Type II loading.
Figure 17 is the plastic strain evolution with load for the Type III loading. When the external load is 23.6 kN, a plastic zone appears in the center of the disc. When the external load is 23.9 kN, the plastic zone develops rapidly in the center of disc towards both ends of the disc. As the loading progresses, the crack initiates from the center of the plastic zone. At 11.4 kN, after the peak load, the crack developed rapidly in the plastic zone and penetrated the disc, and the secondary plastic zones and cracks were produced at the end of the disc.

4. Discussion

4.1. Failure Mode Transition

Figure 18 and Figure 19 are the failure mode transitions of the Brazilian disc test with different loading configurations. It can be seen that the Brazilian disc under the Type I test mainly suffered tensile failure and a small shear failure at the end. The Brazilian disc under the Type II test mainly suffered tensile failure and an obvious conical shear failure zone at the end. The Brazilian disc under the Type III test mainly suffered tensile failure, and obvious secondary cracks are associated on both sides of the main tensile crack.
It is worth noting that although the disc of Type I testing has a relatively good splitting failure, the crack is initiated at the end of the disc, which does not meet the assumptions of the Brazilian disc test. The shear conical failure zone at the end of the disc under the Type II test occurs after the peak load and does not affect the magnitude of the peak load; that is, it does not affect the validity of the tensile strength. The secondary cracks at the end of the disc under the Type III test also occurred after the peak load and did not affect the magnitude of the peak load and the validity of the tensile strength.

4.2. Validity of Tensile Strength

The tensile strength for Type I and Type II testing can be calculated according to Equation (10), and the tensile strength for Type III testing can be calculated according to Equation (11) [27]. The 2 α is the angle of the circular arc of the contact area between the curved jaw and the disc, which is 12° in this model. The calculation results are shown in Table 2. It can be seen that the error of tensile strength for Type I is 13%, while the errors of tensile strength for Type II and Type III are both 1%. It shows that the Type I test is not suitable for testing the tensile strength, while the Type II and Type III tests are suitable for testing the tensile strength.
σ t = 2 P π D t
σ t = 2 P π D t ( sin 2 α α 1 )

5. Conclusions

The main conclusions were obtained as follows:
(1)
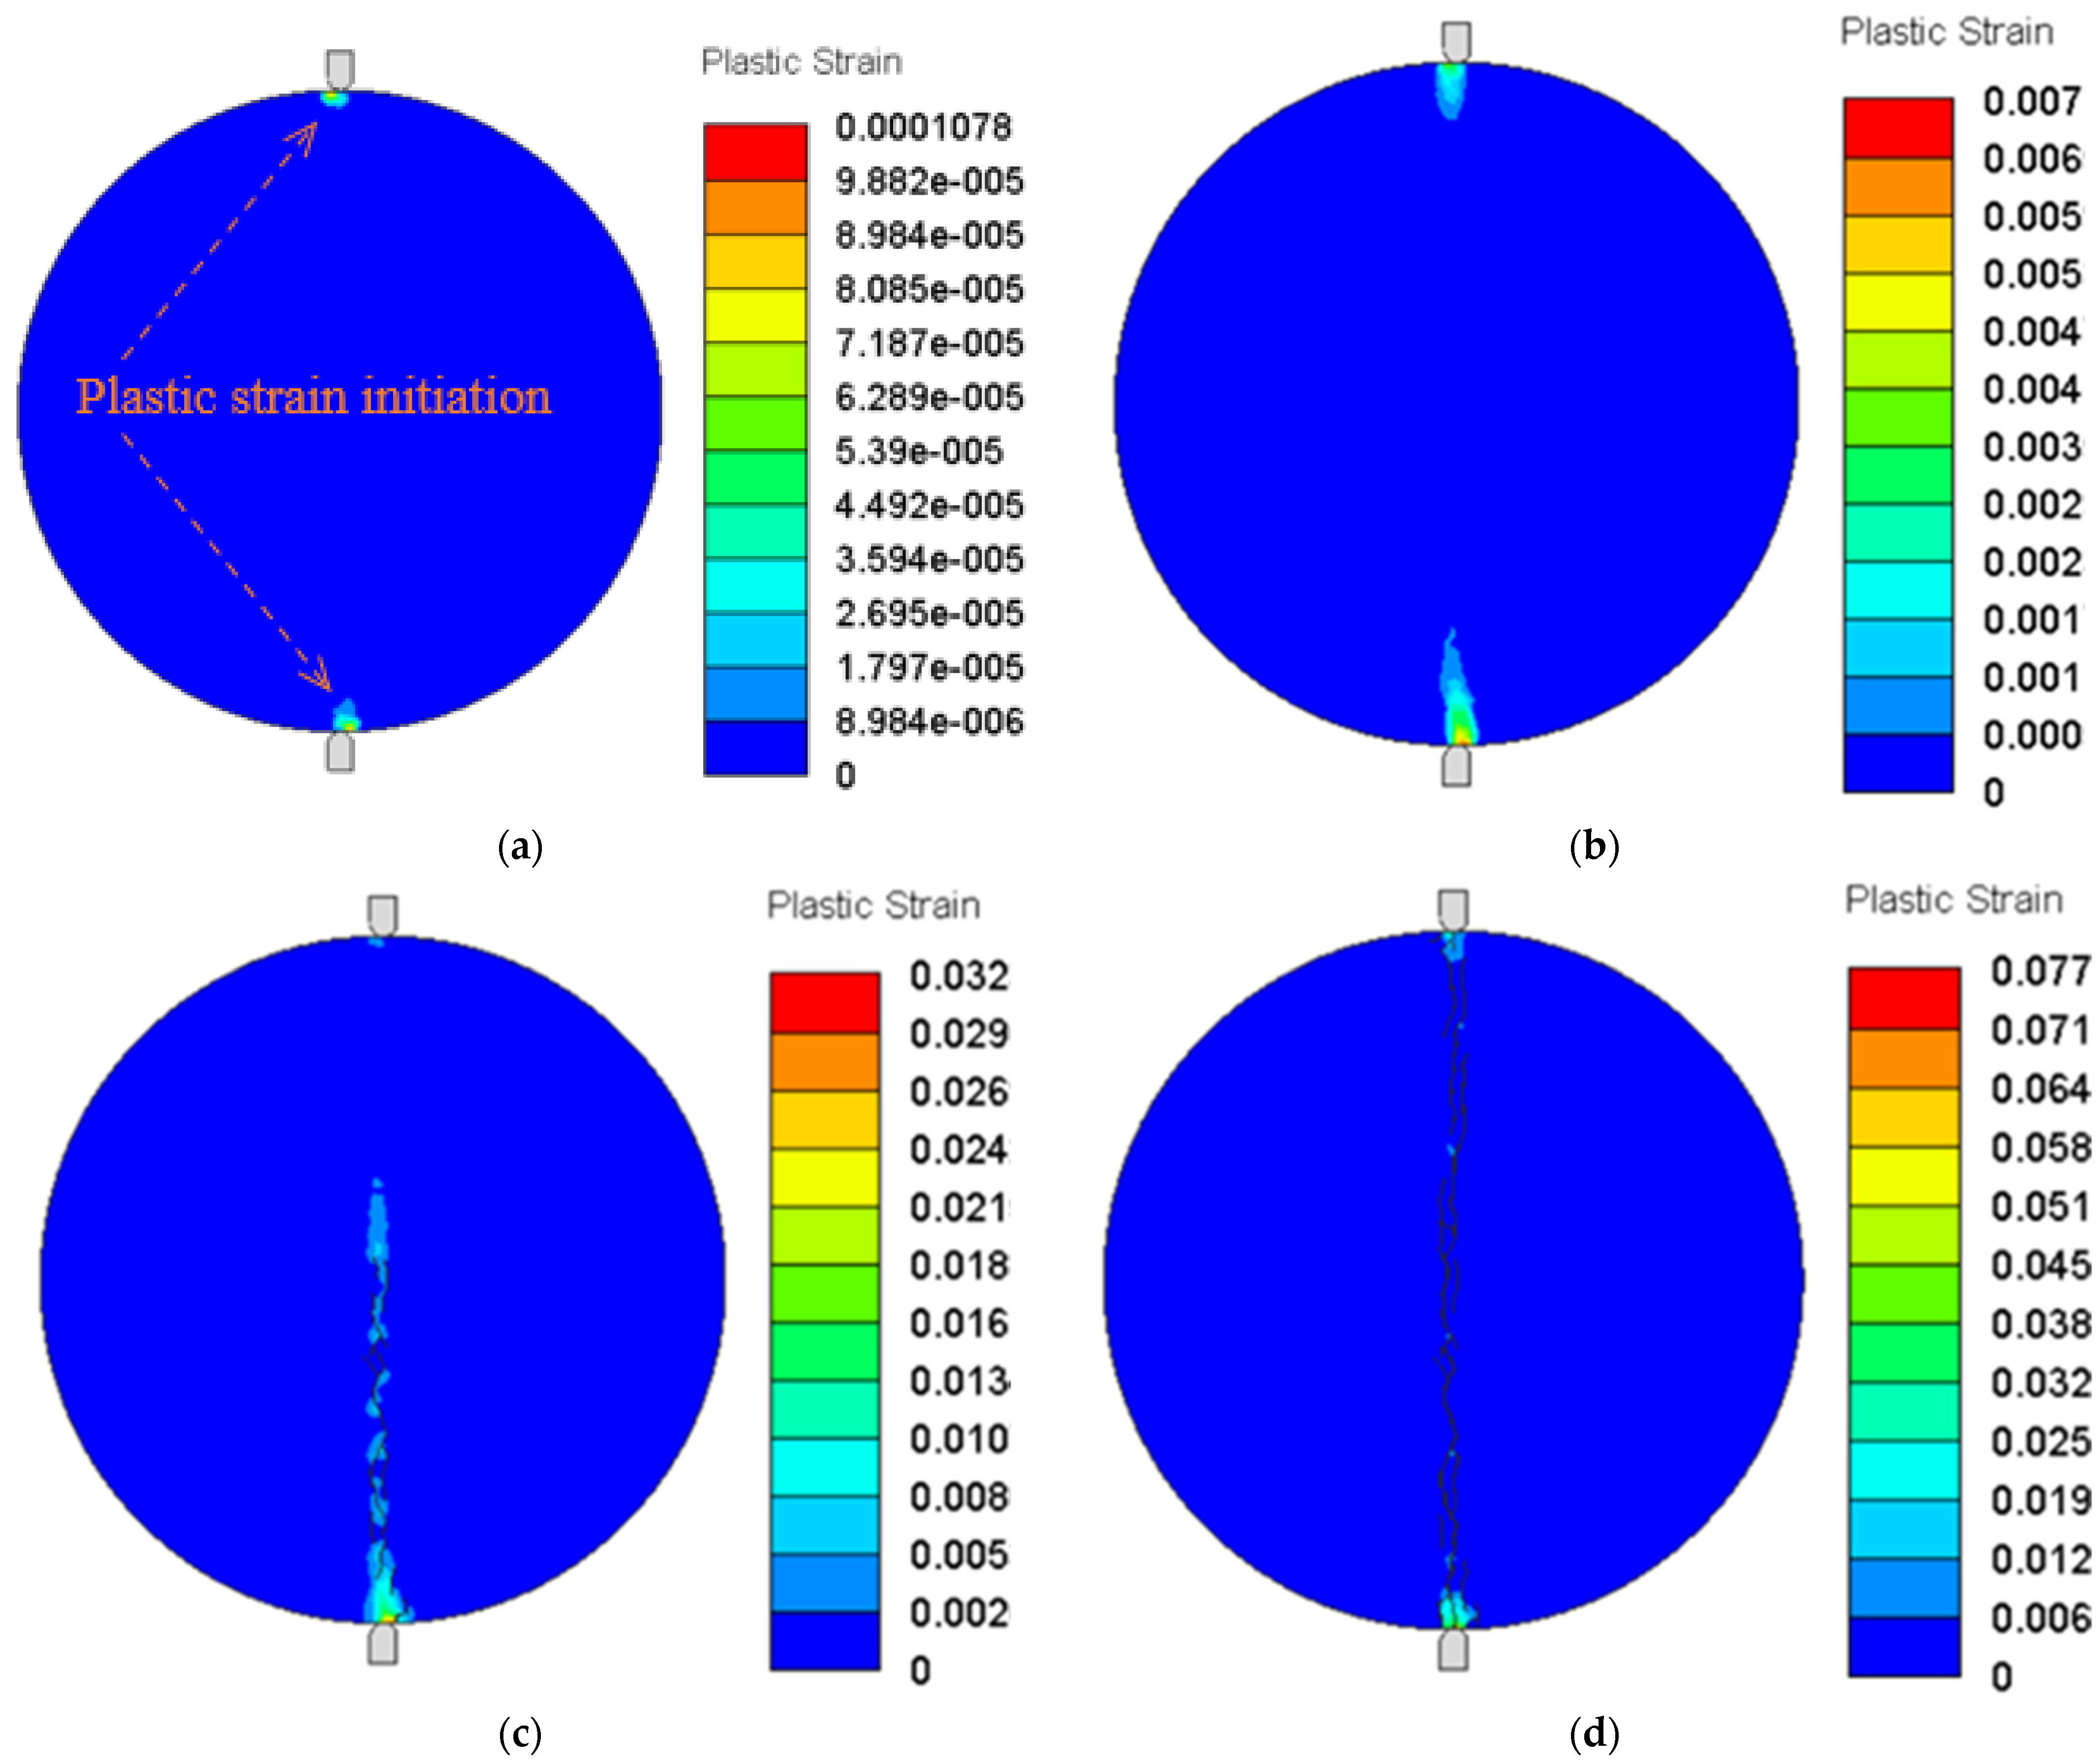
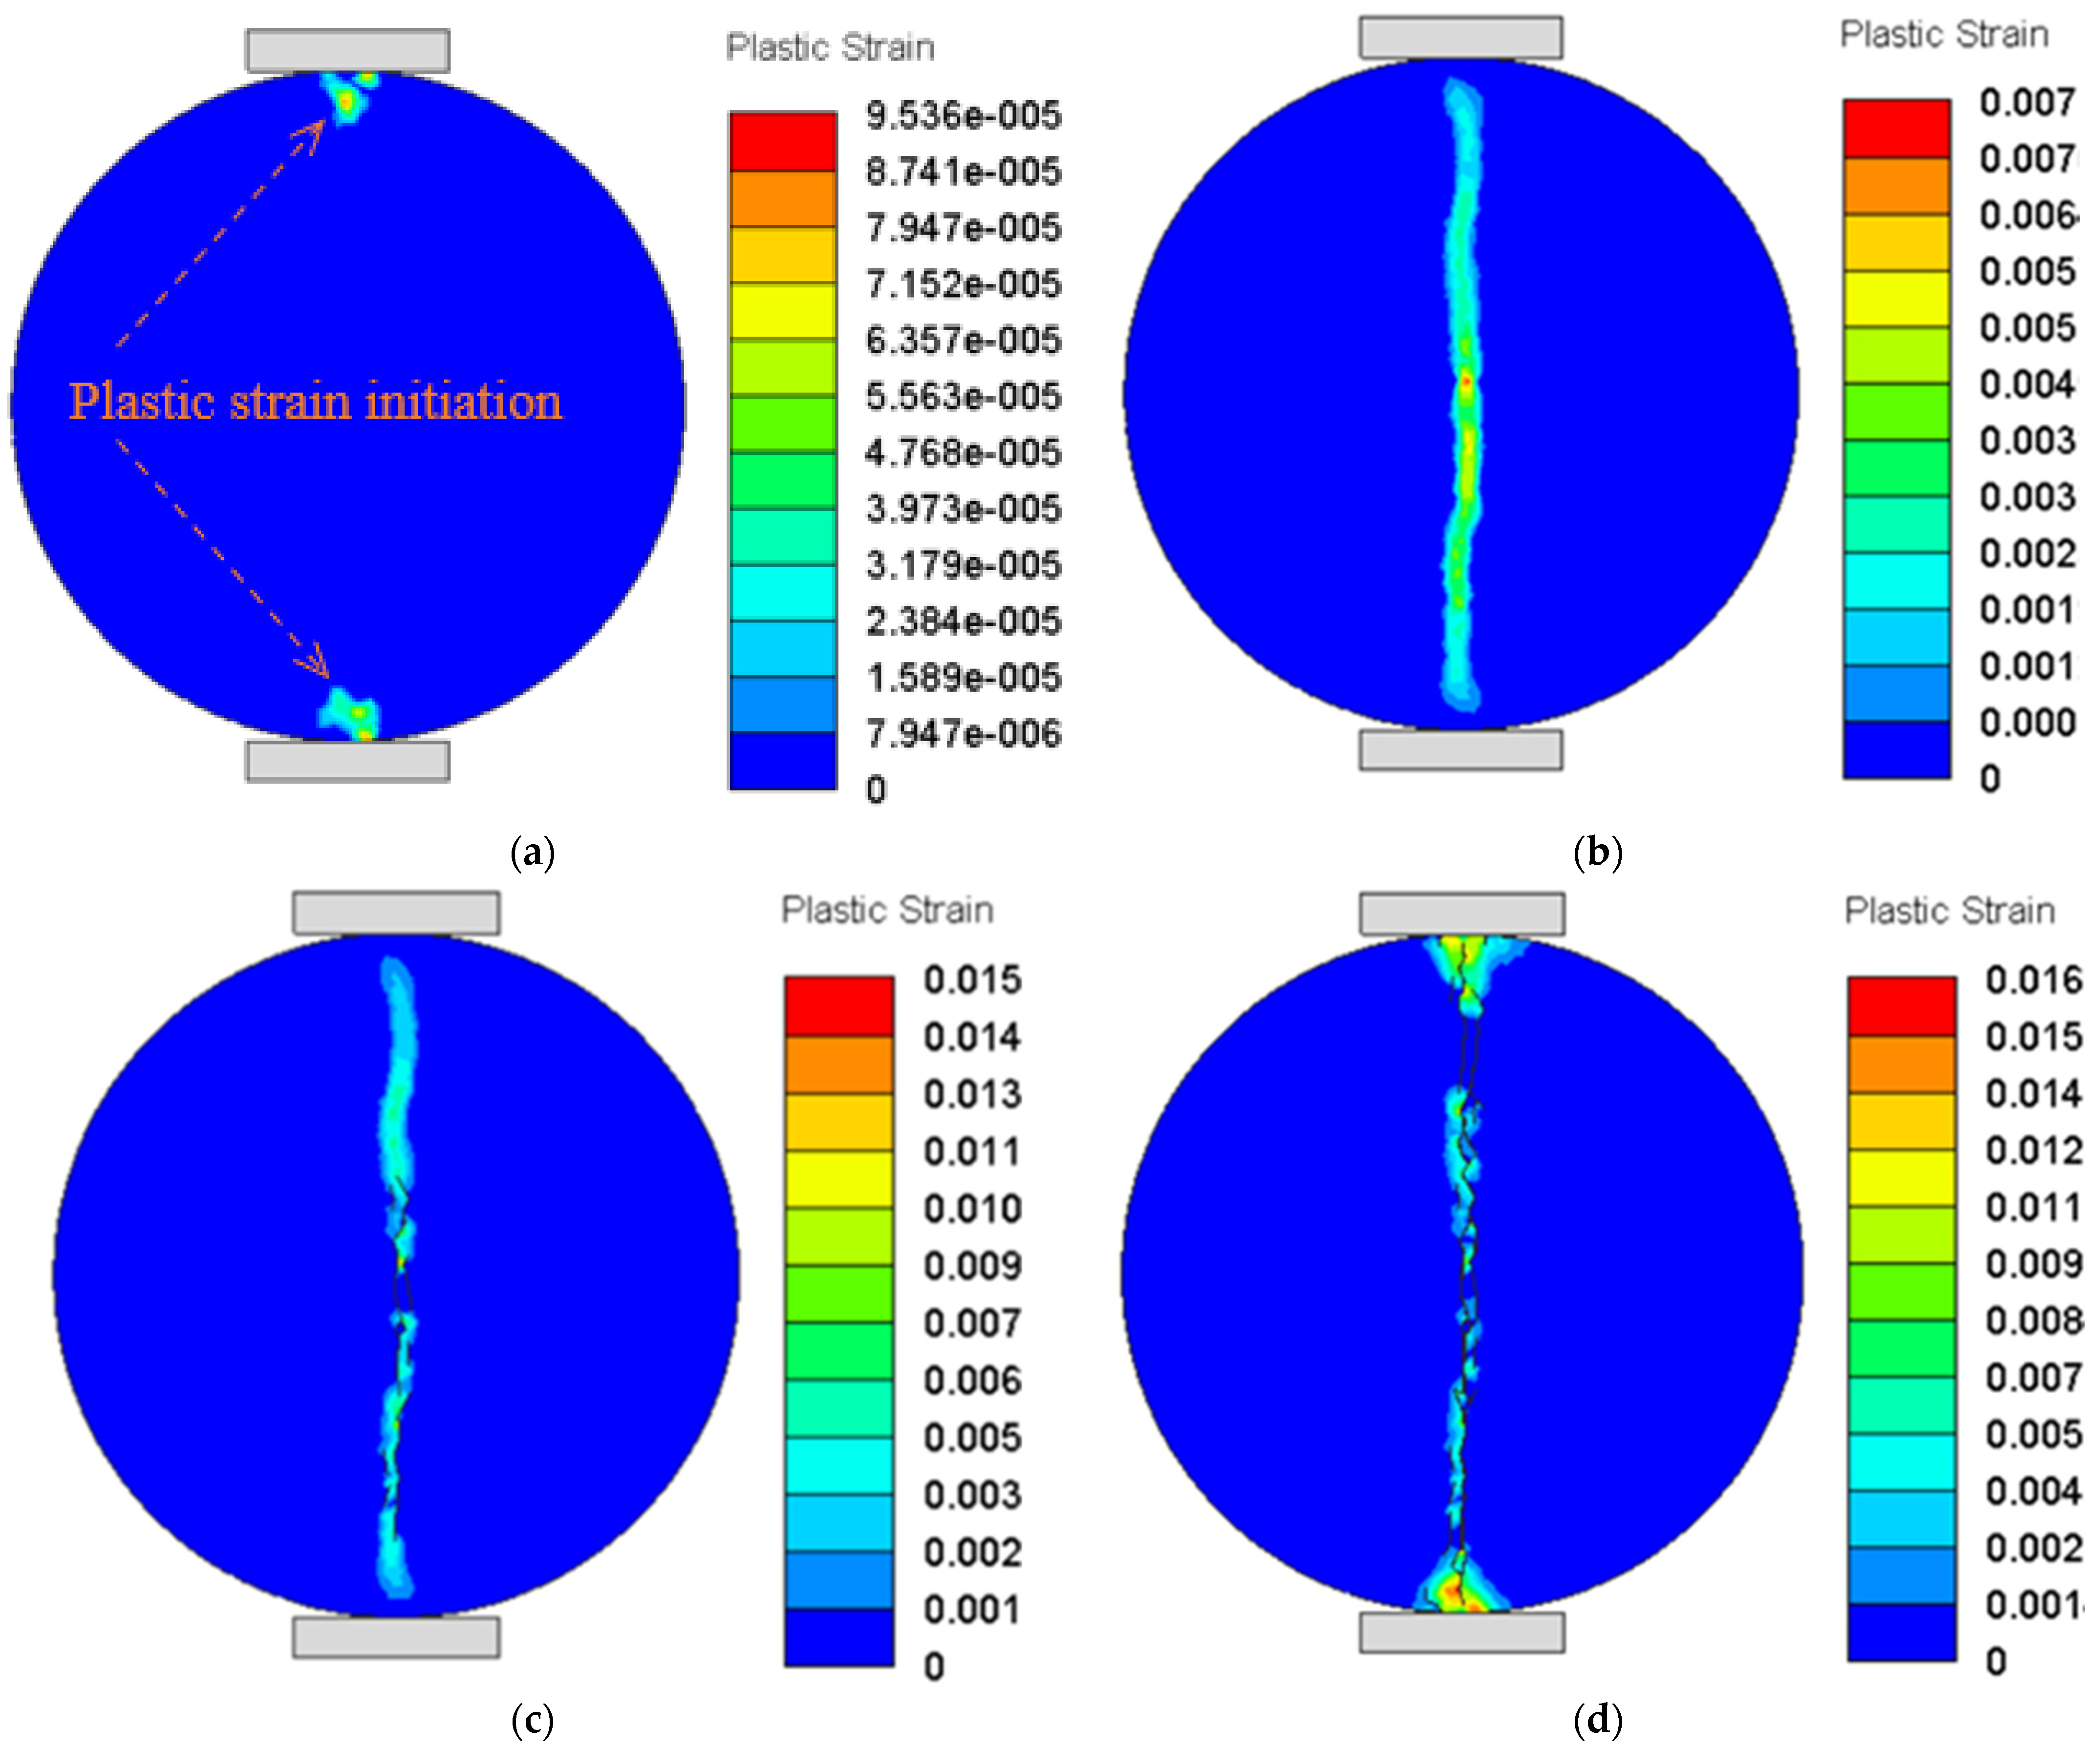
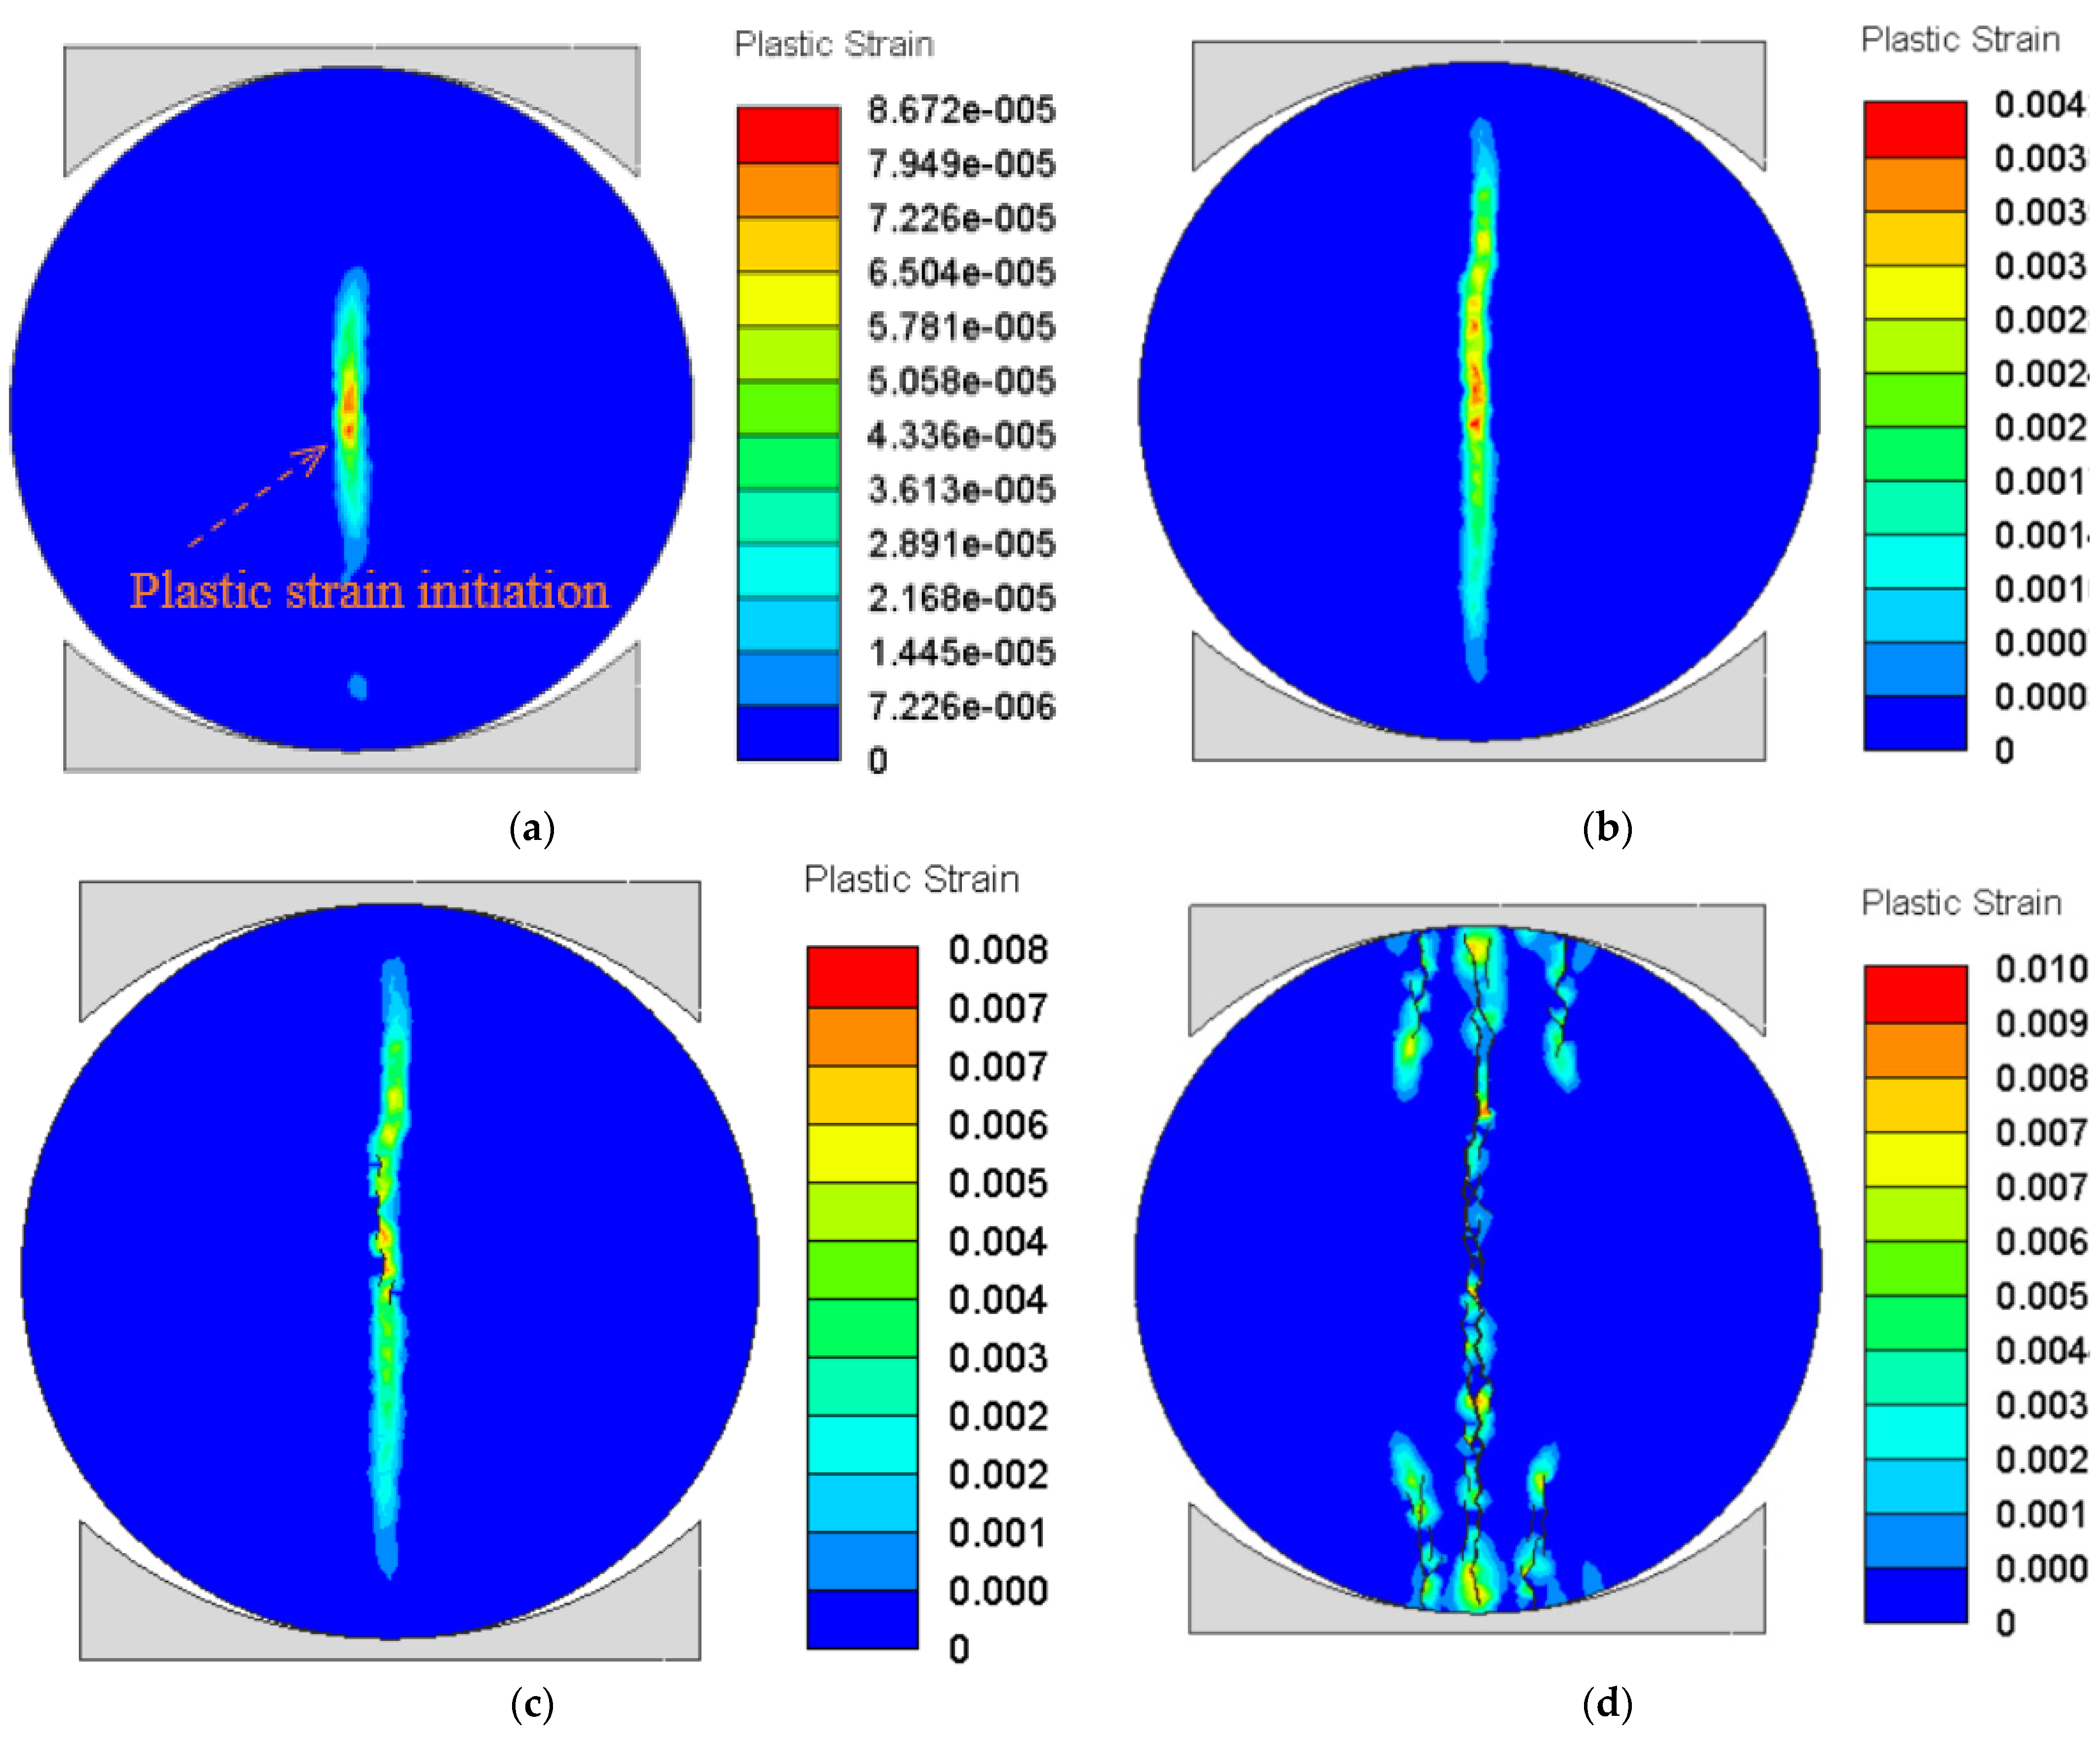
The Brazilian disc under the Type I test mainly suffered tensile failure and small shear failure at the end. The Brazilian disc under the Type II test mainly suffered tensile failure and an obvious conical shear failure zone at the end. The Brazilian disc under the Type III test mainly suffered tensile failure, and obvious secondary cracks are associated on both sides of the main tensile crack.
(2)
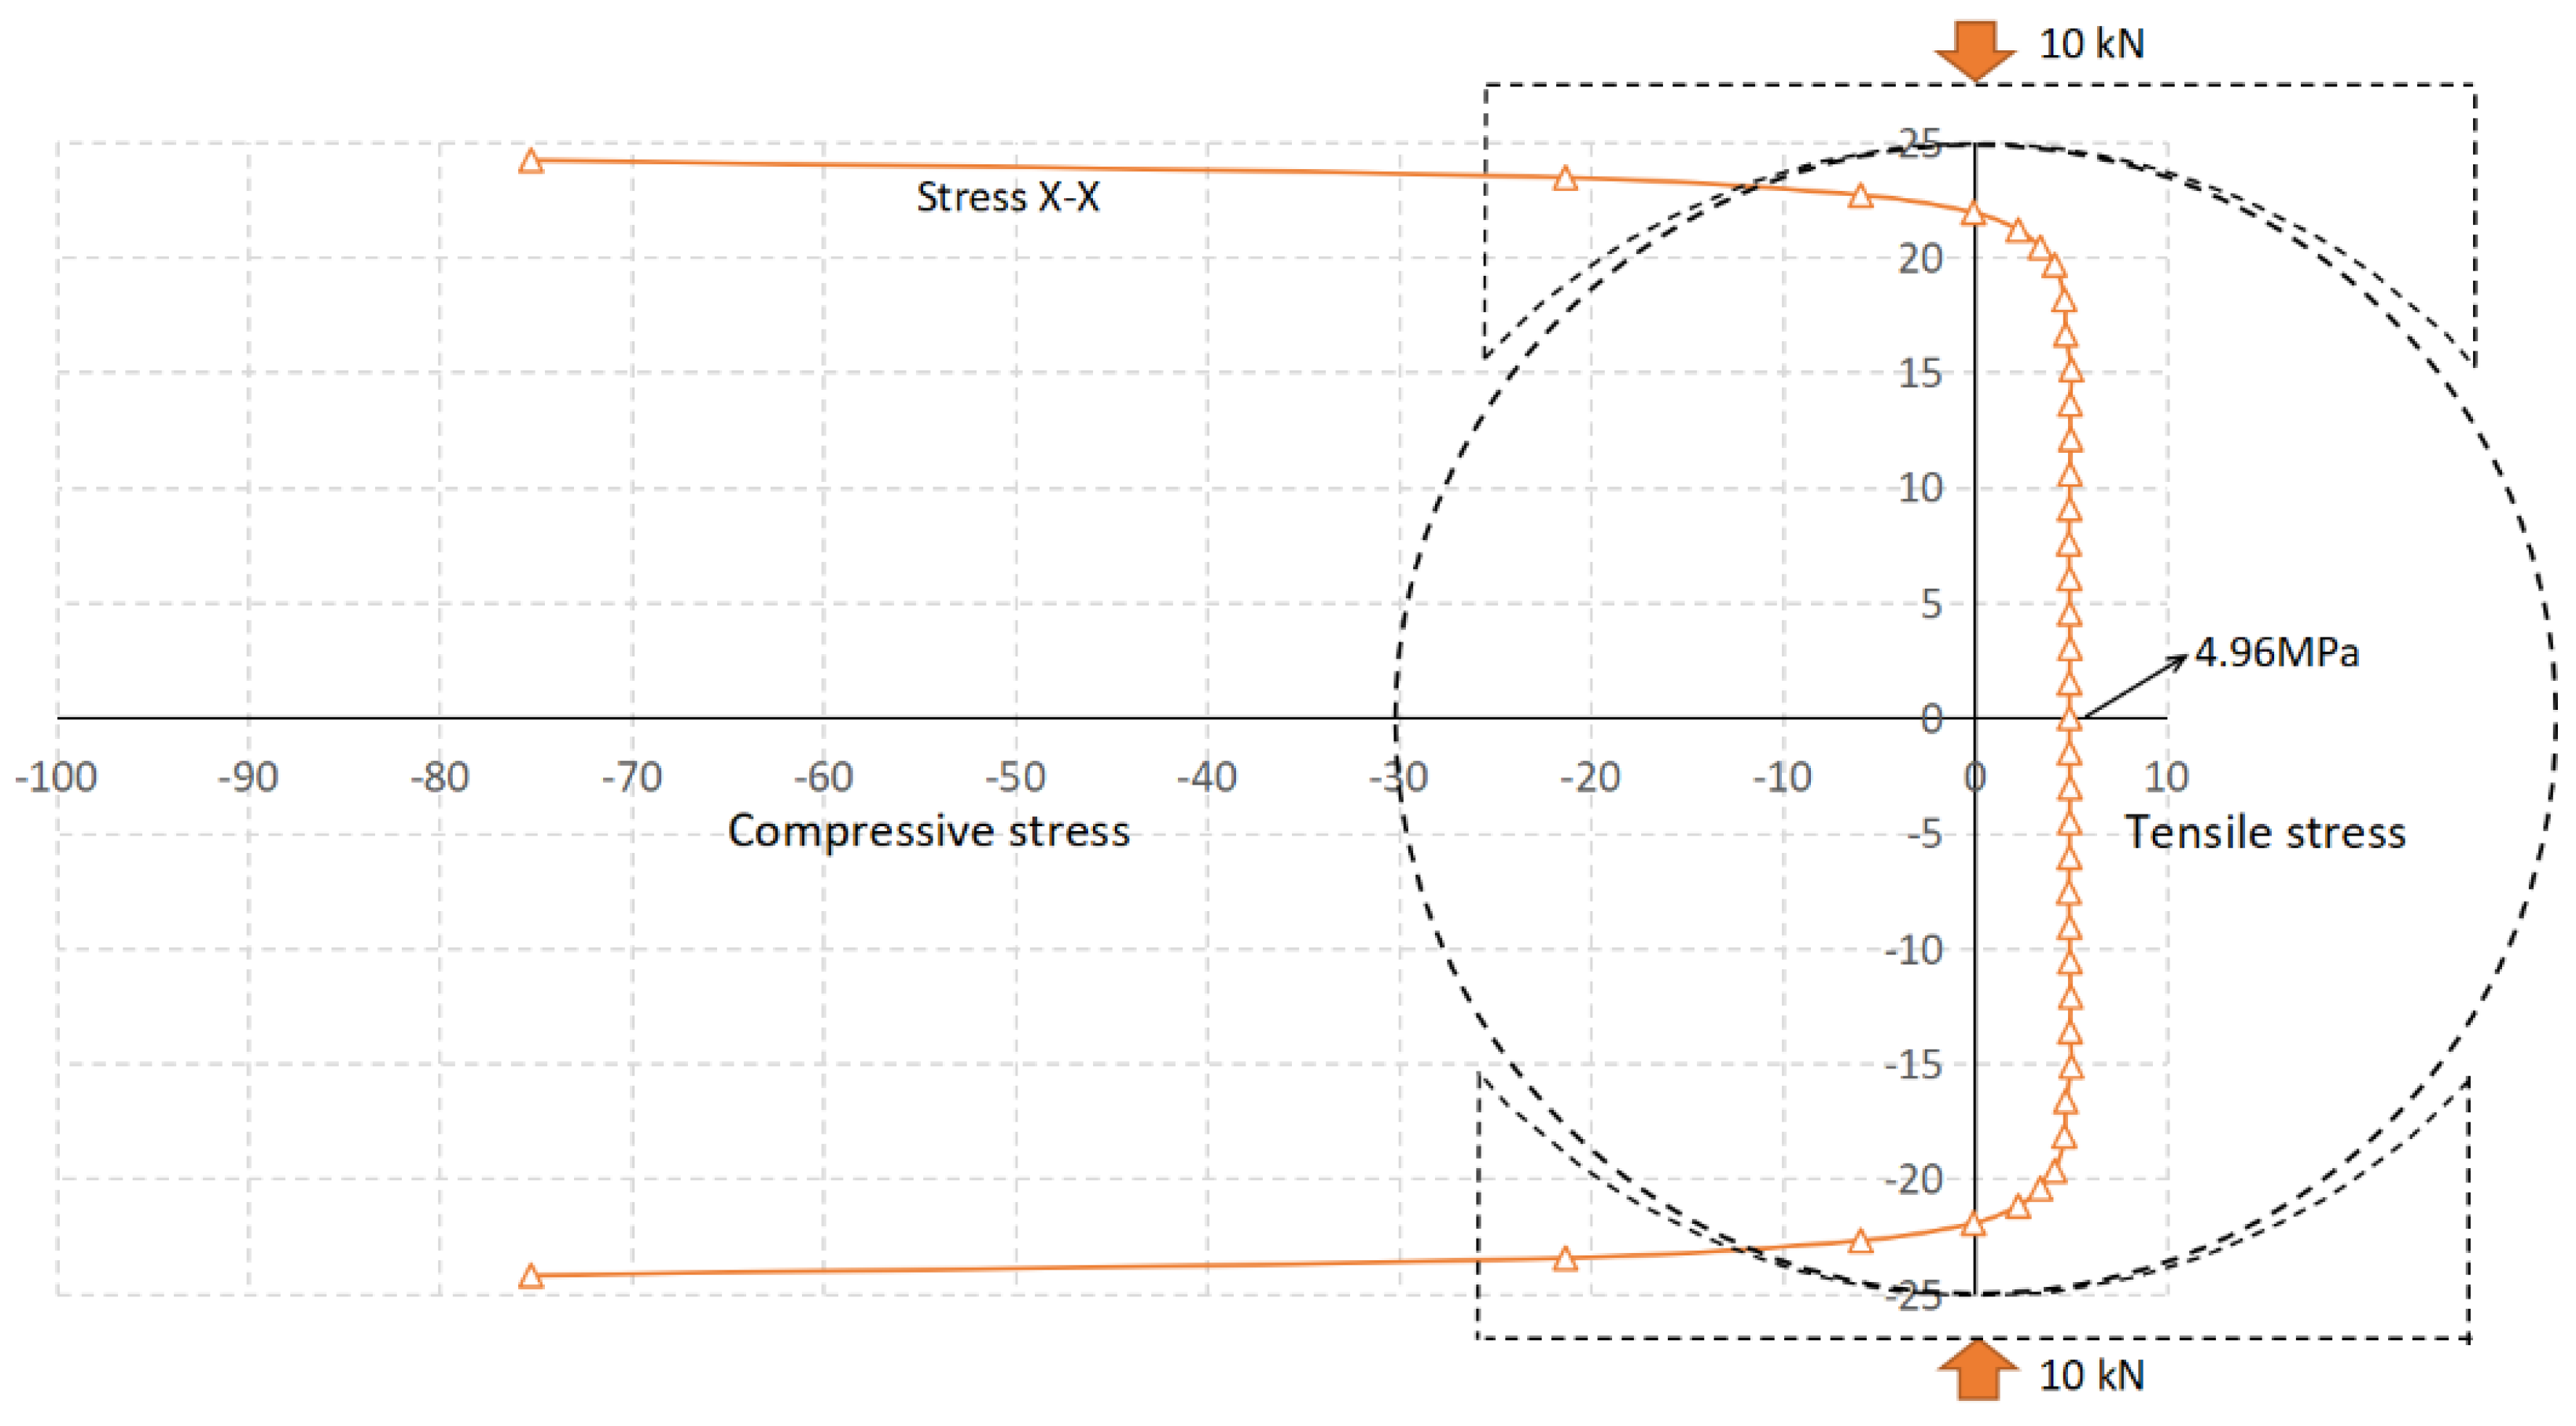
The maximum tensile stress value is located within 18mm (0.7 times the disc radius) of the center of the disc under different loading configurations. Therefore, the Brazilian disc test is valid only where the crack initiation point is within 18 mm of the vertical range of the disc center, which means that the crack initiation is located in the area of maximum tensile stress.
(3)
In the Type I test, the invalid tensile strength is obtained because the crack initiation and plastic strain point is at the end of the disc. The crack initiation points of the Type II and Type III tests are all within the center of the disc, and the valid tensile strength can be obtained. The tensile strength test results under different loading configurations show that the error of the Type I test is 13%, while the errors of the Type II and Type III tests are both 1%.
(4)
The plastic strain of the Type III test is also initiated at the center of the disc, and the plastic strain of the Type II test is initiated at the end of the disc. It can be considered that the Type III test is better than the Type II. In summary, the curved jaws loading (Type III) is the most suitable for measuring the tensile strength of brittle materials such as rock, followed by the flat platens loading (Type II). The small diameter rods loading (Type I) testing is not suitable for testing the tensile strength of materials.

Author Contributions

Conceptualization, P.X.; methodology, P.X.; software, P.X.; validation, P.X., G.Z. and H.L.; formal analysis, H.L. funding acquisition, G.Z. All authors have read and agreed to the published version of the manuscript.

Funding

This research was funded by the State Key Research Development Program of China (No. 2018YFC0604606).

Institutional Review Board Statement

Not applicable.

Informed Consent Statement

Not applicable.

Data Availability Statement

The data presented in this study are available on request from the corresponding author.

Conflicts of Interest

The authors declare no conflict of interest.

Appendix A

The influence of mesh size on the loading curve for the Brazilian testing is shown in Figure A1, Figure A2 and Figure A3. It can be seen that the mesh size has little effect on the loading curve. Considering that a smaller mesh size is conducive to obtain a more accurate damage zone and crack propagation, a mesh size of 0.5 mm is set to analyze the fracture process of Brazilian discs under different loading configurations.
Figure A1. The influence of mesh size on the loading curve for the Type I Brazilian testing.
Mathematics 10 02681 g0a1
Figure A2. The influence of mesh size on the loading curve for the Type II Brazilian testing.
Mathematics 10 02681 g0a2
Figure A3. The influence of mesh size on the loading curve for the Type III Brazilian testing.
Mathematics 10 02681 g0a3

References

  1. Dan, D.Q.; Konietzky, H.; Herbst, M. Brazilian tensile strength tests on some anisotropic rocks. Int. J. Rock Mech. Min. Sci. 2013, 58, 1–7. [Google Scholar] [CrossRef]
  2. Zhou, J.; Zhang, L.Q.; Yang, D.X.; Braun, A.; Han, Z.H. Investigation of the Quasi-Brittle Failure of Alashan Granite Viewed from Laboratory Experiments and Grain-Based Discrete Element Modeling. Materials 2017, 10, 835. [Google Scholar] [CrossRef]
  3. Zhu, Q.Q.; Li, D.Y.; Han, Z.Y.; Li, X.B.; Zhou, Z.L. Mechanical properties and fracture evolution of sandstone specimens containing different inclusions under uniaxial compression. Int. J. Rock Mech. Min. Sci. 2019, 115, 33–47. [Google Scholar] [CrossRef]
  4. Tao, R.; Sharifzadeh, M.; Zhang, Y.; Feng, X.-T. Analysis of Mafic rocks Microstructure damage and failure Process under Compression Test Using Quantitative Scanning Electron Microscopy and Digital Images Processing. Eng. Fract. Mech. 2020, 231, 107019. [Google Scholar] [CrossRef]
  5. Xiao, P.; Li, D.; Zhao, G.; Liu, H. New criterion for the spalling failure of deep rock engineering based on energy release. Int. J. Rock Mech. Min. Sci. 2021, 148, 1–12. [Google Scholar] [CrossRef]
  6. Li, D.; Li, X.; Li, C.C. Experimental Studies of Mechanical Properties of Two Rocks Under Direct Compression and Tension. Chin. J. Rock Mech. Eng. 2010, 29, 624–632. [Google Scholar]
  7. Erarslan, N.; Liang, Z.Z.; Williams, D.J. Experimental and Numerical Studies on Determination of Indirect Tensile Strength of Rocks. Rock Mech. Rock Eng. 2012, 45, 739–751. [Google Scholar] [CrossRef]
  8. Hashiba, K.; Fukui, K. Effect of Water on the Deformation and Failure of Rock in Uniaxial Tension. Rock Mech. Rock Eng. 2015, 48, 1751–1761. [Google Scholar] [CrossRef]
  9. Li, H.B.; Zhao, J.; Li, T.J. Micromechanical modelling of the mechanical properties of a granite under dynamic uniaxial compressive loads. Int. J. Rock Mech. Min. Sci. 2000, 37, 923–935. [Google Scholar] [CrossRef]
  10. Wong, L.N.Y.; Einstein, H.H. Crack Coalescence in Molded Gypsum and Carrara Marble: Part 2-Microscopic Observations and Interpretation. Rock Mech. Rock Eng. 2009, 42, 513–545. [Google Scholar] [CrossRef]
  11. Xiao, P.; Li, D.; Zhao, G.; Zhu, Q.; Liu, H.; Zhang, C. Mechanical properties and failure behavior of rock with different flaw inclinations under coupled static and dynamic loads. J. Cent. South Univ. 2020, 27, 2945–2958. [Google Scholar] [CrossRef]
  12. Cai, M. Influence of intermediate principal stress on rock fracturing and strength near excavation boundaries-Insight from numerical modeling. Int. J. Rock Mech. Min. Sci. 2008, 45, 763–772. [Google Scholar] [CrossRef]
  13. Carneiro, F. A new method to determine the tensile strength of concrete. In Proceedings of the 5th Meeting of the Brazilian Association for Technical Rules (“Associacao Brasileire de Normas Tecnicas—ABNT”), Brazil, September 1943. [Google Scholar]
  14. Akazawa, T. New test method for evaluating internal stress due to compression of concrete: The splitting tension test. J. Jpn. Soc. Civ. Eng. 1943, 29, 777–787. [Google Scholar]
  15. Li, D.; Wong, L.N.Y. The Brazilian Disc Test for Rock Mechanics Applications: Review and New Insights. Rock Mech. Rock Eng. 2013, 46, 269–287. [Google Scholar] [CrossRef]
  16. Yu, Y.; Zhang, J.X.; Zhang, J.C. A modified Brazilian disk tension test. Int. J. Rock Mech. Min. Sci. 2009, 46, 421–425. [Google Scholar] [CrossRef]
  17. Erarslan, N.; Williams, D.J. Experimental, numerical and analytical studies on tensile strength of rocks. Int. J. Rock Mech. Min. Sci. 2012, 49, 21–30. [Google Scholar] [CrossRef]
  18. Komurlu, E.; Kesimal, A. Evaluation of Indirect Tensile Strength of Rocks Using Different Types of Jaws. Rock Mech. Rock Eng. 2015, 48, 1723–1730. [Google Scholar] [CrossRef]
  19. Aliabadian, Z.; Zhao, G.F.; Russell, A.R. Crack development in transversely isotropic sandstone discs subjected to Brazilian tests observed using digital image correlation. Int. J. Rock Mech. Min. Sci. 2019, 119, 211–221. [Google Scholar] [CrossRef]
  20. Hudson, J.; Brown, E.; Rummel, F. The controlled failure of rock discs and rings loaded in diametral compression. Int. J. Rock Mech. Min. Sci. Geomech. Abstr. 1972, 9, 241–248. [Google Scholar] [CrossRef]
  21. Swab, J.J.; Yu, J.; Gamble, R.; Kilczewski, S. Analysis of the diametral compression method for determining the tensile strength of transparent magnesium aluminate spinel. Int. J. Fract. 2011, 172, 187–192. [Google Scholar] [CrossRef]
  22. GB/T 50266-99; National Standards Compilation Group of People’s Republic of China. Standard for Tests Method of Engineering Rock Masses. China Plan Press: Beijing, China, 1999.
  23. Mellor, M.; Hawkes, I. Measurement of tensile strength by diametral compression of discs and annuli. Eng. Geol. 1971, 5, 173–225. [Google Scholar] [CrossRef]
  24. Li, D.; Li, B.; Han, Z.; Zhu, Q. Evaluation on Rock Tensile Failure of the Brazilian Discs under Different Loading Configurations by Digital Image Correlation. Appl. Sci. 2020, 10, 5513. [Google Scholar] [CrossRef]
  25. Sgambitterra, E.; Lamuta, C.; Candamano, S.; Pagnotta, L. Brazilian disk test and digital image correlation: A methodology for the mechanical characterization of brittle materials. Mater. Struct. 2018, 51, 19. [Google Scholar] [CrossRef]
  26. ISRM. Suggested methods for determining tensile strength of rock materials. Int. J. Rock Mech. Min. Sci. Geomech. Abstr. 1978, 15, 99–103. [Google Scholar] [CrossRef]
  27. Hondros, G. The evaluation of Poisson’s ratio and the modulus of materials of a low tensile resistance by the Brazilian (indirect tensile) test with particular reference to concrete. Aust. J. Appl. Sci. 1959, 10, 243–268. [Google Scholar]
  28. Yu, Y.; Yin, J.M.; Zhong, Z.W. Shape effects in the Brazilian tensile strength test and a 3D FEM correction. Int. J. Rock Mech. Min. Sci. 2006, 43, 623–627. [Google Scholar] [CrossRef]
  29. Markides, C.F.; Pazis, D.N.; Kourkoulis, S.K. Closed full-field solutions for stresses and displacements in the Brazilian disk under distributed radial load. Int. J. Rock Mech. Min. Sci. 2010, 47, 227–237. [Google Scholar] [CrossRef]
  30. Markides, C.F.; Kourkoulis, S.K. The Stress Field in a Standardized Brazilian Disc: The Influence of the Loading Type Acting on the Actual Contact Length. Rock Mech. Rock Eng. 2012, 45, 145–158. [Google Scholar] [CrossRef]
  31. Yanagidani, T.; Sano, O.; Terada, M.; Ito, I. The observation of cracks propagating in diametrically-compressed rock discs. Int. J. Rock Mech. Min. Sci. Geomech. Abstr. 1978, 15, 225–235. [Google Scholar] [CrossRef]
  32. Stirling, R.A.; Simpson, D.J.; Davie, C.T. The application of digital image correlation to Brazilian testing of sandstone. Int. J. Rock Mech. Min. Sci. 2013, 60, 1–11. [Google Scholar] [CrossRef] [Green Version]
  33. Wei, M.; Dai, F.; Xu, N.; Zhao, T.; Xia, K.W. Experimental and numerical study on the fracture process zone and fracture toughness determination for ISRM-suggested semi-circular bend rock specimen. Eng. Fract. Mech. 2016, 154, 43–56. [Google Scholar] [CrossRef]
  34. Nallathambi, P.; Karihaloo, B. Determination of the specimen size independent fracture toughness of plain concrete. Mag. Concr. Res. 1986, 38, 67–76. [Google Scholar] [CrossRef]
  35. Xu, S.; Reinhardt, H. Determination of double-K criterion for crack propagation in quasi-brittle materials, Part I: Experimental investigation of crack propagation. Int. J. Fract. 1999, 98, 111–149. [Google Scholar] [CrossRef]
  36. Mahabadi, O.K.; Cottrell, B.E.; Grasselli, G. An Example of Realistic Modelling of Rock Dynamics Problems: FEM/DEM Simulation of Dynamic Brazilian Test on Barre Granite. Rock Mech. Rock Eng. 2010, 43, 707–716. [Google Scholar] [CrossRef]
  37. Feng, F.; Li, X.; Luo, L.; Zhao, X.; Chen, S.; Jiang, N.; Huang, W.; Wang, Y. Rockburst response in hard rock owing to excavation unloading of twin tunnels at great depth. Bull. Eng. Geol. Environ. 2021, 80, 7613–7631. [Google Scholar] [CrossRef]
  38. Cai, M.; Kaiser, P.K. Numerical simulation of the Brazilian test and the tensile strength of anisotropic rocks and rocks with pre-existing cracks. Int. J. Rock Mech. Min. Sci. 2004, 41, 450–451. [Google Scholar] [CrossRef]
  39. Hamdi, P.; Stead, D.; Elmo, D. Damage characterization during laboratory strength testing: A 3D-finite-discrete element approach. Comput. Geotech. 2014, 60, 33–46. [Google Scholar] [CrossRef]
  40. Mitelman, A.; Elmo, D. Analysis of tunnel support design to withstand spalling induced by blasting. Tunn. Undergr. Space Technol. 2016, 51, 354–361. [Google Scholar] [CrossRef]
  41. Li, X.; Feng, F.; Li, D. Numerical simulation of rock failure under static and dynamic loading by splitting test of circular ring. Eng. Fract. Mech. 2018, 188, 184–201. [Google Scholar] [CrossRef]
  42. Feng, F.; Li, X.; Rostami, J.; Li, D. Modeling hard rock failure induced by structural planes around deep circular tunnels. Eng. Fract. Mech. 2019, 205, 152–174. [Google Scholar] [CrossRef]
  43. Xiao, P.; Li, D.; Zhao, G.; Liu, M. Experimental and Numerical Analysis of Mode I Fracture Process of Rock by Semi-Circular Bend Specimen. Mathematics 2021, 9, 1769. [Google Scholar] [CrossRef]
  44. Rockfield. ELFEN Explicit/Implicit Manual, V.R.S.L.; Rockfield: West Glamorgan, UK, 2013. [Google Scholar]
  45. Cai, M. Fracture Initiation and Propagation in a Brazilian Disc with a Plane Interface: A Numerical Study. Rock Mech. Rock Eng. 2013, 46, 289–302. [Google Scholar] [CrossRef]
  46. Li, D.; Li, B.; Han, Z.; Zhu, Q.; Liu, M. Evaluation of Bi-modular Behavior of Rocks Subjected to Uniaxial Compression and Brazilian Tensile Testing. Rock Mech. Rock Eng. 2021, 54, 3961–3975. [Google Scholar] [CrossRef]
  47. Klerck, P.A. The Finite Element Modelling of Discrete Fracture in Quasi-Brittle Materials. Ph.D. Thesis, University of Wales Swansea, Wales Swansea, UK, 2000. [Google Scholar]
Figure 1. The crack insertion procedure: (a) failure plane, (b) intra−element fracture, (c) inter−element fracture.
Mathematics 10 02681 g001
Figure 2. Mohr–Coulomb with Rankine tensile yield surface.
Mathematics 10 02681 g002
Figure 3. The stress−strain curve of discrete crack model.
Mathematics 10 02681 g003
Figure 4. Three Brazilian disc models and meshes under different loading configurations. (a) small diameter loading rods (Type I), (b) flat loading platens (Type II), and (c) curved loading jaws (Type III). Note: The loading rod of Type I is composed of a small semicircle and a small rectangle. The semicircle part contacts the disc to transmit the load, and the upper right corner of the rectangle is used to record the load–displacement data.
Mathematics 10 02681 g004
Figure 5. Load−displacement curves for the Type I Brazilian disc testing.
Mathematics 10 02681 g005
Figure 6. Load–displacement curves for the Type II Brazilian disc testing.
Mathematics 10 02681 g006
Figure 7. Load–displacement curves for the Type III Brazilian disc testing.
Mathematics 10 02681 g007
Figure 8. Failure process for the Type I Brazilian disc testing.
Mathematics 10 02681 g008
Figure 9. Failure process for the Type II Brazilian disc testing.
Mathematics 10 02681 g009
Figure 10. Failure process for the Type III Brazilian disc testing.
Mathematics 10 02681 g010
Figure 11. Location of stress monitoring line in Brazilian disc.
Mathematics 10 02681 g011
Figure 12. The stress X−X distribution in the monitoring line for Type I testing under external load of 10 kN.
Mathematics 10 02681 g012
Figure 13. The stress X−X distribution in the monitoring line for Type II testing under external load of 10 kN.
Mathematics 10 02681 g013
Figure 14. The stress X−X distribution in the monitoring line for Type III testing under external load of 10 kN.
Mathematics 10 02681 g014
Figure 15. The plastic strain evolution with load for the Type I testing: (a) 6.8 kN, (b) 20.6 kN, (c) 19.2 kN (post−peak), (d) 4.2 kN (post−peak).
Mathematics 10 02681 g015
Figure 16. The plastic strain evolution with load for the Type II testing: (a) 17.5 kN, (b) 22.0 kN, (c) 20.0 kN (post−peak), (d) 7.7 kN (post−peak).
Mathematics 10 02681 g016
Figure 17. The plastic strain evolution with load for the Type III testing: (a) 23.6 kN, (b) 23.9 kN, (c) 22.6 kN (post−peak), (d) 11.4 kN (post−peak).
Mathematics 10 02681 g017
Figure 18. The failure mode transition of Brazilian disc test with different loading configurations.
Mathematics 10 02681 g018
Figure 19. The failure mode of disc with different loading configurations in physical test [24].
Mathematics 10 02681 g019
Table 1. Material properties adopted in Brazilian test.
NameGranite DiscLoading Platen
Young’s modulus (E, GPa)43.2211.00
Poisson’s ratio (ν)0.230.29
Shear modulus (G, GPa)17.5-
Density (ρ, Ns2/mm4)2.8 × 1097.84 × 109
Cohesion (c, MPa)50-
Friction   angle   ( φ )34°-
Tensile   strength   ( σ t , MPa)12.0-
Fracture energy (Gf, N/mm)0.05-
Discrete contact parameters
Normal penalty (Pn, N/mm2)43,200211,000
Tangential penalty (Pt, N/mm2)432021,100
Friction (γ)0.10.1
Mesh size (mm)0.50.5
Contact typeNode−EdgeNode−Edge
Table 2. The tensile strength and error of three loading types.
Loading TypeP/kN α Tested Tensile Strength/MPaActual Tensile Strength/MPaError
Type I20.7010.512.013%
Type II23.8012.11%
Type III24.1612.11%
Publisher’s Note: MDPI stays neutral with regard to jurisdictional claims in published maps and institutional affiliations.

