Article

Smartphone Market Analysis with Respect to Brand Performance Using Hybrid Multicriteria Decision Making Methods

1
School of Economics and Management, Nanchang Vocational University, 308 Provincial Road, Anyi County, Nanchang 330500, China
2
Department of Management Sciences, Tamkang University, No.151 Yingzhuan Rd., Tamsui District, New Taipei 25137, Taiwan
*
Author to whom correspondence should be addressed.
Mathematics 2022, 10(11), 1861; https://doi.org/10.3390/math10111861
Submission received: 20 April 2022 / Revised: 17 May 2022 / Accepted: 24 May 2022 / Published: 29 May 2022
(This article belongs to the Topic Multi-Criteria Decision Making)

Abstract

:
In this era of information explosion, smartphones have become a necessary device in our daily life. In order to select a better smartphone, most users try to collect more attributes to help them purchase their own smartphones, including the brand image from the advertisements, features from the specifications, word-of-mouth from their peers, and the average sales from some secondary data webs. In order to assist the users to evaluate the brand performance from the market attributes, in this paper, we selected nine smartphone brands and used multi-criteria decision-making methods to rank the smartphones’ functions. We first use TOPSIS to evaluate word-of-mouth, together with average sales collected from the website of each brand, and the brand image obtained by the use of questionnaires. Finally, we summarize the final rankings of these smartphone brands. The brand performance analysis shows that our proposed hybrid method can significantly derive the overall rankings of smartphone brands.

1. Introduction

Most users replace their smartphones when brand manufacturers roll out the new generations with new features, and then they arrange for the old ones to be reused or recycled. In our daily life, without smartphones, we almost cannot forward the information to our community, transact in e-commerce, or provide health information during the COVID-19 pandemic. Therefore, the number of smartphone users has been increasing significantly, and most consumers are presented with a cornucopia of choices in smartphones, and how to evaluate the satisfaction of a smartphone brand has become an important concern for consumers. Rahim et al. [1] concluded that product features, brand name, and social influence have a significant relationship with purchasing intention. In South Korea, the most important smartphone attribute is brand, and the next purchasing of users depends not only on their brand loyalty but also on the satisfaction of their high innovation [2]. In addition, most consumers indicate that price is a quality-signaling cue, which reflects the conventional wisdom that “you get what you pay for” [3]. In online shopping, customers tend to compare the objective prices with reference prices and then form their perceptions of price [4]. Price, as a heuristic cue, is more readily observable than quality [5]. Obviously, smartphones with better functions, word-of-mouth, and brand image do not imply better sales because price is also a significant criterion for sales. Thus, we believe that if the global average sales of a particular brand of smartphones are higher than average, this meant that this particular brand is perceived as a good brand, providing high brand performance. Therefore, in this study we also adopt average sales as an evaluated criterion for brand performance.
The brand is an important attribute for consumers when selecting products in the field of marketing research, and thus manufacturing motivates consumers to interact with smartphone advertisements and stimulates their decisions to purchase. However, there still are the other attributes that can be included to provide more information for smartphone selection, which is still lacking in theoretical approaches to formulate the synthesis of performance analysis, which can help to understand the digital technologies implementation in marketing. In order to cope with this problem, we consider extending the theory of marketing approaches and defining the conceptual framework of the assessment of the multicriteria decision-making models for the marketing theory of brand performance analysis. Therefore, in order to propose the brand performance procedure, we define the attributes of functions, word of mouth, brand image, and average sales to formulate brand performance analysis. Then, the research procedure can proceed as follows: firstly, we choose the more common smartphone market as our focus, and searched through the literature to find the qualitative and quantitative characteristics of functions of these phones to construct the evaluation criteria for conducting the VIKOR method to evaluate the selected brands of smartphone. Next, we use the quantitative analysis method TOPSIS to analyze the word of mouth from the evaluation of experts, where the selected criteria are defined by the i-Buzz Research Center. Finally, we then designed a questionnaire that captured all the above information. Data are then collected from experts and analyzed. Results are used to construct a SMARTROC method to obtain the total brand performance of each smartphone brand, and finally to rank these brands by the results of functions, word-of-mouth, brand image, and average sales.
Based on the above discussion, the conceptual framework of the assessment of the multicriteria decision-making models for the marketing theory of brand performance analysis is shown in Figure 1.

2. Literature Reviews

In this modern age, people have been accustomed to using smartphones in their daily lives, and thus they occupy a huge portion of the consumer market. Smartphone users not only consider the price and features of the smartphone but also its emotional word-of-mouth and brand image. However, the smartphone warranty period usually covers only one year, most consumers have to do their due diligence in selecting their mobile phones with higher involvement. For high-involvement product purchases, consumers require multiple sources of information and gladly receive advice and evaluation from others in order to minimize uncertainty and risk of their purchase decision. Past studies have mostly focused on the frameworks of smartphone systems and/or functions, such as comparing different operating systems [6,7,8], evaluating operating systems using fuzzy MCDM model [9], analyzing the functions of a smartphone [10,11], discussing aesthetic attributes of products [12] and classifying smartphone users reactions [13,14]. Analyzing and measuring word-of-mouth is quite valuable in helping companies and consumers make decisions [15]. Product word-of-mouth is embedded in customer reviews and ratings, and then we can transform textual communication information into quantitative measures. Hyrynsalmi et al. [16] use quantitative analysis methods such as statistical analyses of reviews to assess the product word-of-mouth and predict sales. Zhang and Lu [17] indicate that the emotion gap in consumer product reviews significantly affects product sales. Archak et al. [18] decompose textual reviews into segments and formulate product features, and they use these new feature measurements to predict sales. Ghose and Ipeirotis [19] construct multiple measurements, including subjectivity, readability, and spelling errors, to predict the effect of reviews on sales and their perceived usefulness. Keller [20] summarizes that brand image encompasses consumers’ perceptions from brand associations in the memory. Therefore, brand image can be defined as the collection and combination of ideas, feelings, and attitudes to the products received from consumers [21,22]. A positive brand image is key in attracting consumers to make a purchase when the need arises. Brand image can help consumers process or recall product information and can act as product differentiation or brand extension, and this may increase consumers’ purchases [23,24]. Grewal et al. [25] pointed out that the more brand awareness, the more the perceived quality will be positive. Brand management enables a company’s products to be more value-added. This not only helps to increase the possibilities of higher profits for the company, but it also enables consumers to distinguish the products quickly from their competitors. Aaker [26] pointed out that the consistency of brand image is a very important business investment as it not only consolidates the loyalty of its core customers but also plays an important role in developing new product segmentation. A great brand not only attracts consumers but also retains the confidence and loyalty of its customers. To sum up, the brand is the most important criterion when consumers make a decision to buy a product, but the amount of sales of the product depends mostly on the satisfaction of those who currently own the brand. Therefore, brand performance is a good decision-making tool for the smartphone brand to evaluate the degree of satisfaction that most customers have with their next purchase.

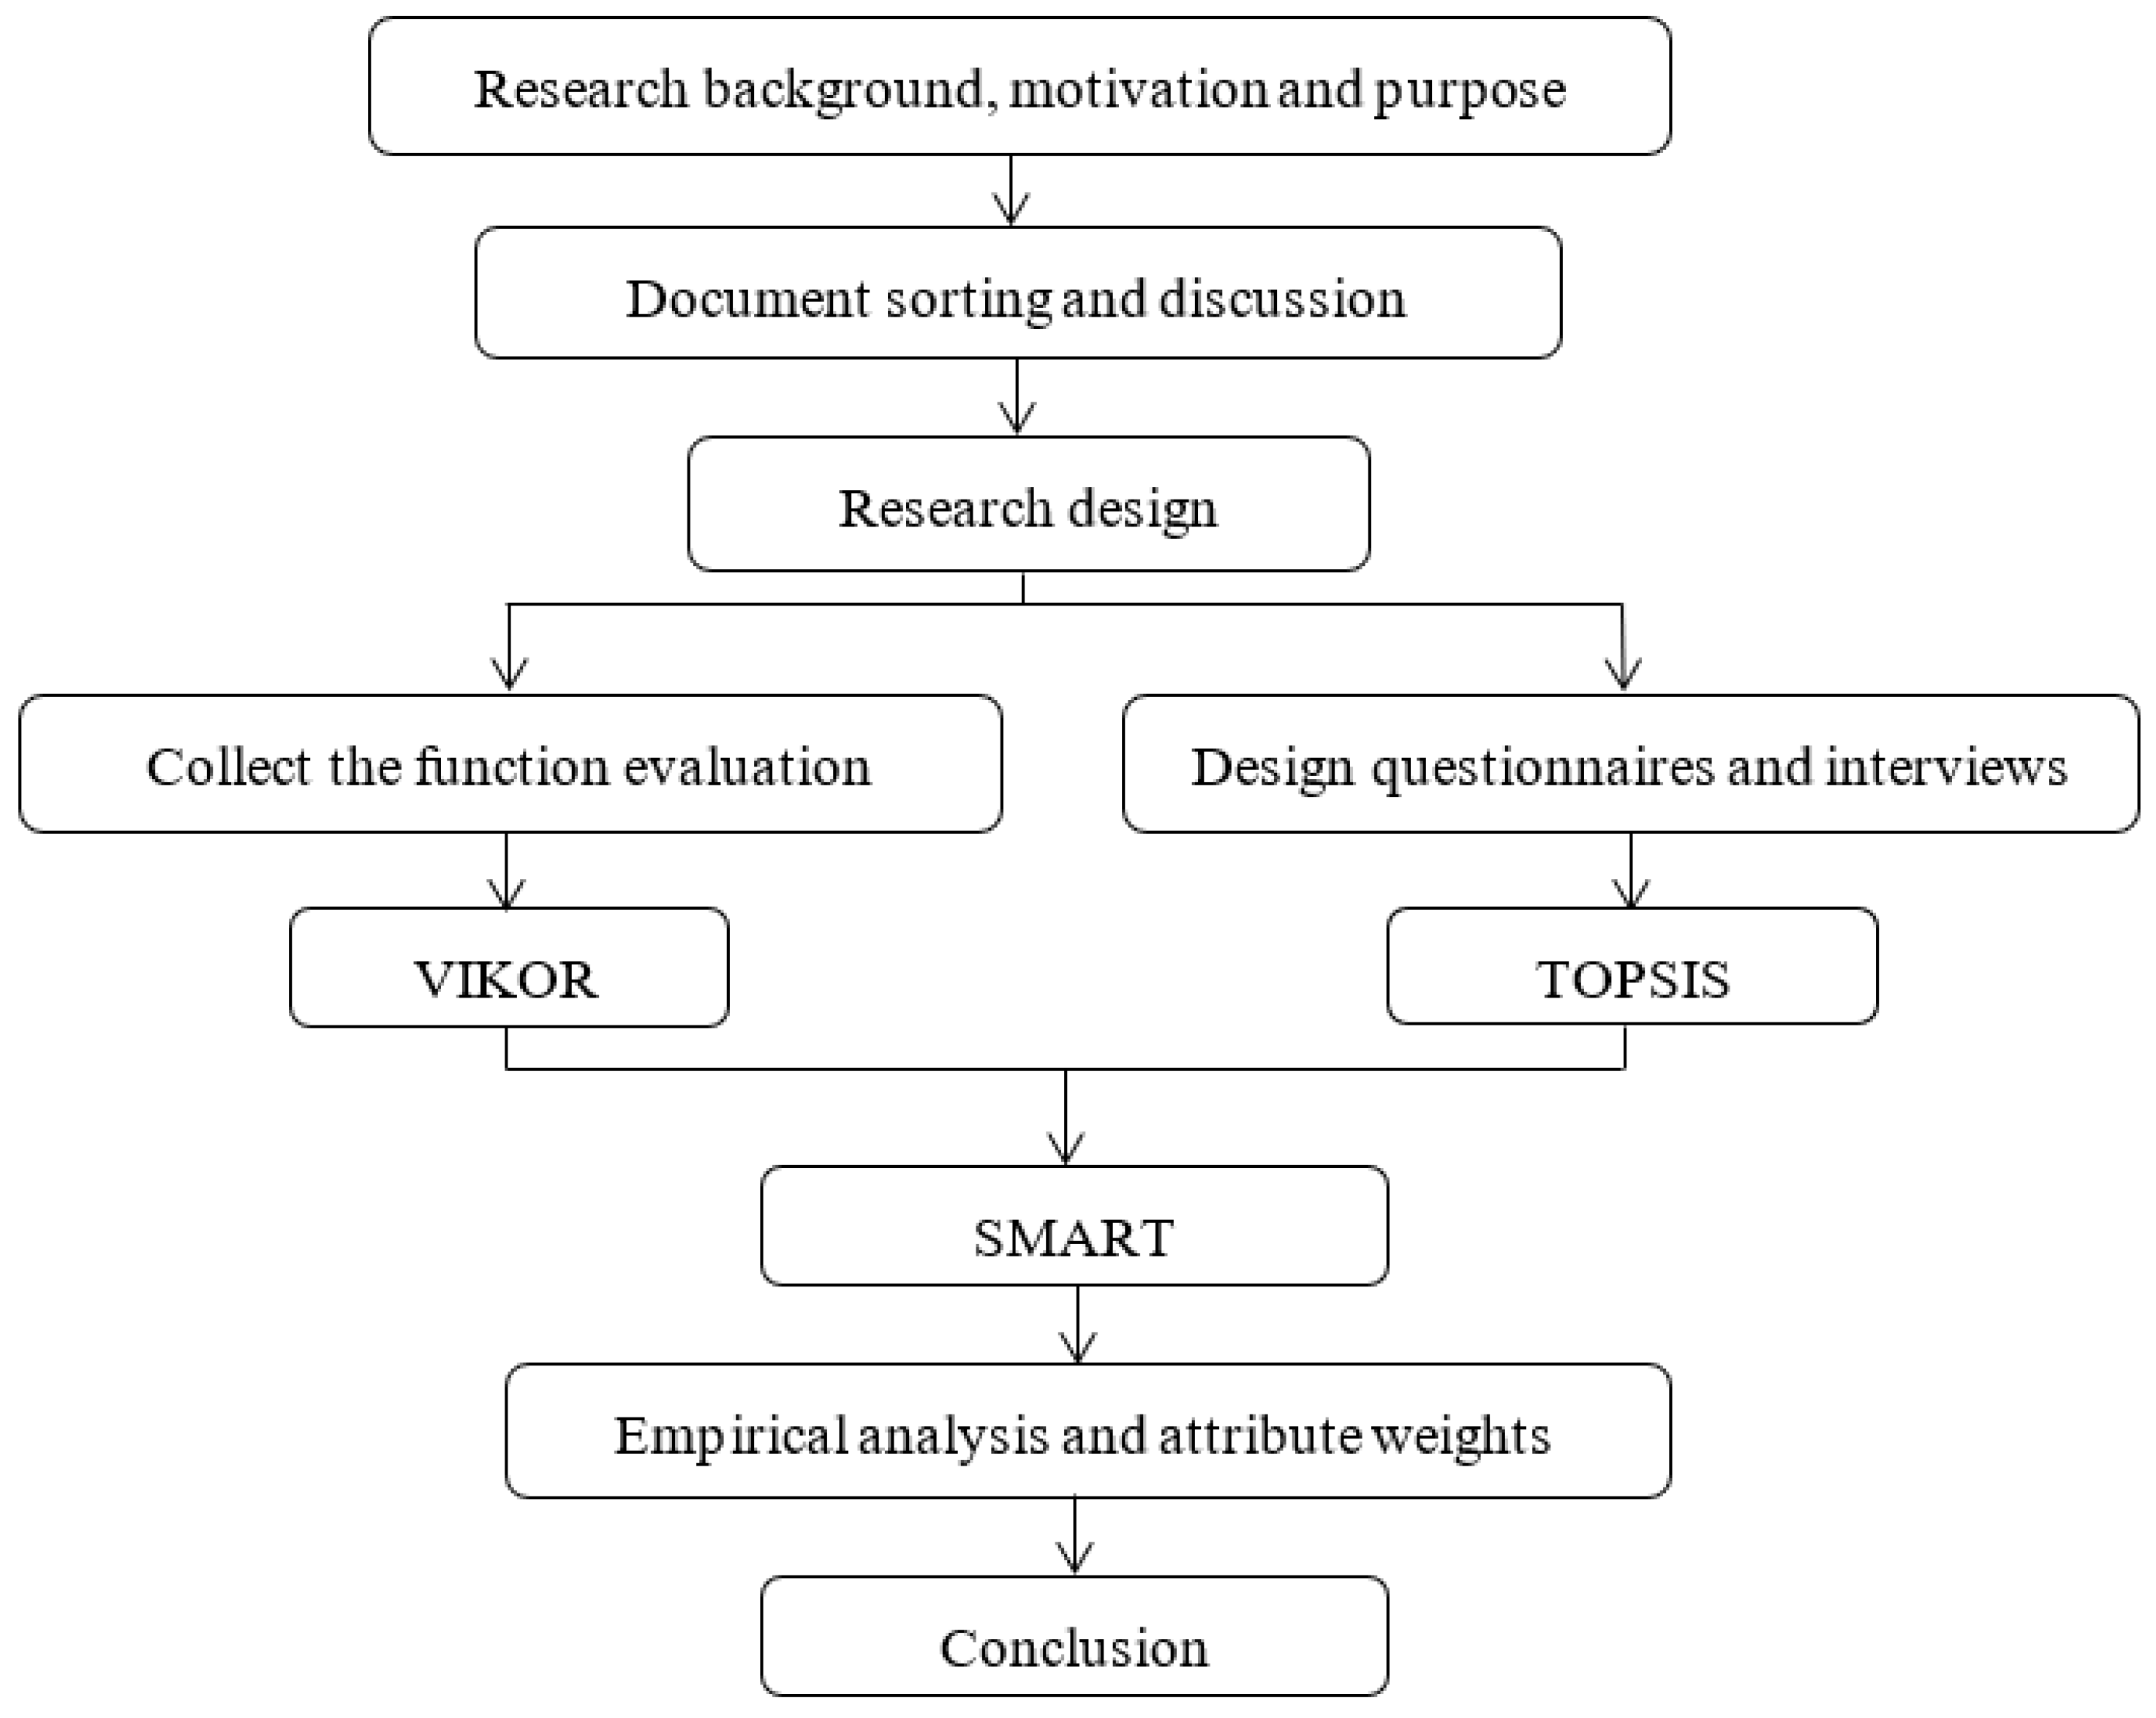
3. Research Methodologies

In terms of function, because of the choice in this study of a variety of brands to be explored for the smartphone function, it requires the use of a variety of smartphone brands’ users’ comments. Therefore, this study collects the evaluations from ten store managers who work in the mobile communication shop for the selected nine smartphone brands. In terms of word-of-mouth, this study required those who use social networks, forums, and other platforms to discuss smartphones or who use the web to watch evaluators. Therefore, the study found that, of those who use the Internet to research 3C product evaluation, the total number is 15. In both studies, nine kinds of smartphone brands, respectively, are selected for comparison.

3.1. Shannon’s Entropy

Shannon’s entropy provides objective weights with which to solve uncertainty information because it uses only the information from indicators. The first step is to measure the entropy of each candidate attribute and then extend the information delivery for the entire decision-making situation. Finally, compare the entropy of each criterion and calculate the weight relative to each other. The steps are as follows:
Step 1 Evaluation criteria for standardization:
f i j = x i j i = 1 n x i j 2 ,   i = 1 ,   2 , , n .     j = 1 , 2 , , m
where i is evaluation criteria, j is evaluation alternatives.
Step 2 Calculate the entropy of each criterion:
e i = K i = 1 n f i j log f i j ,   i = 1 ,   2 , , n
where K = 1 log n is a constant to ensure all the e i is between 0 and 1.
Step 3 Determine the weight of each criterion:
w i = 1 e i i = 1 n ( 1 e i ) , i = 1 ,   2 , , n

3.2. The VIKOR Model

VIKOR is a compromise multi-attribute decision making proposed by Opricovic [27], where a positive ideal solution indicates the alternative with the highest value while a negative ideal solution indicates the alternative with the lowers value. The objective is to maximize group utility while minimizing individual regrets, as the steps are illustrated as follows:
Step 1 Construction of decision matrix.
Step 2 Determine the positive ideal solution F+ and the negative ideal solution F values of all criteria:
f + = m a x j f i j ,   i = 1 ,   2 , , n
f = m i n j f i j ,   i = 1 ,   2 , , n
Step 3 Computation of the values Sj and Rj:
S j = i = 1 n w i ( f i + f i j ) / ( f i + f i )
R j = m a x i [ w i ( f i + f i j ) / ( f i + f i ) ]
In the equation, Sj represents the group utility, Rj represents the individual regret, and w i is the relative weights among the various assessment criterion, ( f i + f i j ) / ( f i + f i )   represents the distance closeness of the positive ideal solution. At this time, when Sj value is smaller or Rj value is larger, the alternative j is better.
Step 4 Compute the values Qj:
Q j = v ( S j S + ) S S + + ( 1 v ) ( R j R + ) R R +
where S + = m i n j S j ,   S = m a x j S j ,   R + = m i n j R j ,   R = m a x j R j .
When the value of mechanism coefficient v is greater than 0.5, it represents the preference to pursue the group utility; when the value of v is less than 0.5, it means the individual has attached importance.
Step 5 Rank the preference order by the Qj value: the smaller the value of Qj, the better result. With that, each Qj size can be ranked accordingly.

3.3. The TOPSIS Model

TOPSIS method [28] is proposed to find an alternative that is nearest to the positive ideal solution and the farthest from the negative ideal solution, where the positive ideal solution has the maximum benefit or minimum cost; on the other hand, the minimum benefit or maximum cost is a negative ideal solution. TOPSIS can be evaluated by following the decision matrix, with m alternatives and n attributes:
D = [ x 11 x 12 x 1 j x 1 n x 21 x 22 x 2 j x 2 n         x i 1 x i 2 x i j x i n     x m 1 x m 2 x m j x m n ]
The intersection of each alternative and criteria is given as xij. Follow the steps below to find the optimal alternative:
Step 1 Original values normalization: Normalization aims to eliminate comparability and consistency between indicators and units. Let rij be the element of normalization decision matrix R, represented as Equation (10), and we can calculate rij using Equation (11).
R = [ r 11 r 12 r 1 j r 1 n r 21 r 22 r 2 j r 2 n         r i 1 r i 2 r i j r i n     r m 1 r m 2 r m j r m n ]
r i j = x i j i = 1 m x i j 2
Step 2 Calculate the weighted normalized decision matrix: Let matrix V be the weighted normalized decision matrix expressed as follows:
V = [ w 1 r 11 w 2 r 12 w j r 1 j w n r 1 n w 1 r 21 w 2 r 22 w j r 2 j w n r 2 n         w 1 r i 1 w 2 r i 2 w j r i j w n r i n     w 1 r m 1 w 2 r m 2 w j r m j w n r m n ]
where vector w = ( w 1 , w 2 , , w n ) is weight value of the decision criterion, while w j is the relative weight of the j the criterion, and j = 1 n w j = 1 .
Step 3 Determine the positive ideal solution A+ and the negative ideal solution A values as below:
A + = ( v 1 + , v 2 + , , v m + ) = m i n i v i j , i = 1 , 2 , , m
A = ( v 1 , v 2 , , v m ) = m a x i v i j , i = 1 , 2 , , m
Step 4 Calculate the distance between each alternative with the positive ideal solution ( S i + ) and with a negative ideal solution ( S i ):
S i + = j = 1 n ( v i j v j + ) 2 , i = 1 ,   2 , , m
S i = j = 1 n ( v i j v j ) 2 , i = 1 ,   2 , , m
where S i + is the distance between i th evaluation target and the positive ideal solution, S i is the distance between i th evaluation target and the negative ideal solution.
Step 5 Calculate relative closeness C i :
C i = S i S i + S i ,   0 < C i < 1 , i = 1 ,   2 , , m
Step 6 Rank the alternatives: The best alternative is the one with the greatest relative closeness value C i , in which it means an alternative that is the nearest to a positive ideal solution and the farthest from a negative ideal solution.

3.4. SMART–ROC Method

SMART was proposed by Edwards [29], as a simple multi-attribute assessment decision making. This method is based on linear additive or simple multiplicative models for aggregating single criterion evaluation. The SMART model is most appropriate for an analysis where identified alternatives are distinct. The steps used in this study are illustrated below:
Step 1 Define the problem and decision-makers.
Step 2 Determine the decision element and objective decision-making: By clarifying the decision elements, especially the objective decision-making to describe the situation, and finally, defined real objective decision-making.
Step 3 Elaboration viable alternative: Sources of the alternatives can be divided into two categories, one is the past experience of decision-makers or the decision-group, and the other is the experience of others.
Step 4 Confirm the relevant attribute of viable alternative evaluation: Deconstructing the objectives to secondary and sub-objectives and establishing the target level architecture.
Step 5 Rank the attributes according to the degree of importance: Rank n attributes according to the degree of importance using subjective value.
Step 6 Give the relative weight by the degree of importance of each attribute.
Step 7 Weight normalization.
Step 8 Measure the value of the alternative in each of the attributes: After evaluating the attributes and their weights, the assessment attributes are evaluated with a value between 0 and 100 as follows:
Maximizing   attribute :   u j ( x i j ) = x i j m i n i { x i j } m a x i { x i j } m i n i { x i j } × 100 , j
Minimization   attribute : u j ( x i j ) = m a x i { x i j } x i j m a x i { x i j } m i n i { x i j } × 100 , j
Step 9 Find the best alternative: The best alternative is selected based on the simple additive weighting method (SAW) and find the highest utility value among the subjective utility Ui of the i-th alternative as follows:
U i = j = 1 n w j U j ( x i j )
SMART–ROC is used to improve SMART on step 6 and step 7. Evaluate the importance of assessment attributes using the swing weighting method, the weight value through the gravity method is w i = 1 n k = i n 1 k . The essential in determining weight in the ROC method is the order of weight and the number of attributes.

4. Data Analysis and Results

This study aims to explore the brand performance of selected brand smartphones by functions, brand image, word of mouth, and average sales. First, we chose nine brand smartphones as research indicators, and we used the VIKOR model to rank the smartphone functions of the nine brand smartphones; next, we used TOPSIS to evaluate the word of mouth with average sales from the website of each brand smartphone, and the brand image obtained by the use of questionnaires. Finally, we used the SMARTROC method to calculate the final rankings of these brand smartphones.

4.1. The VIKOR Model

In terms of function, 31 items were selected from the seven types of attributes separately for the nine brands in our questionnaire. The function mean scores of the selected brand smartphones were calculated from the original data items and shown in Table 1.
Step 1 Calculate the weight of evaluation attributes:
Let the selected 31 functions be the evaluation items, for objective evaluation, we use the average scores of items to evaluate the attribute weights using the entropy method. Original values are normalized using Equation (1), and we calculated the entropy value using Equation (2), before calculating the weight using Equation (3), the values are shown in Table 2. We placed these weights into the VIKOR model to evaluate the smartphone functions.
Step 2 Determine the positive ideal solution F+ and the negative ideal solution ( F ) values of all criteria: Find the positive ideal solution and the negative ideal solution of every criterion from Table 1 using Equations (4) and (5).
Step 3 Computation of the values Sj and Rj: This study uses entropy to determine the relative weights. We input the weights into the VIKOR model, calculate the group utility Sj and the individual regret Rj using Equation (6), and we can find the values of S+, S, R+, R from Table 3.
Step 4 Compute the values Qj: After determining the group utility Sj and the individual regret Rj, we then are able to compute Qj using Equation (8), subsequently, we substitute the v value as 0.5 into the equation. In Table 4, the smaller the value Qj, the better result. As S+ represents the maximized group utility and R+ represents the minimized individual regret; thus, the smaller the value Qj, the closer it is to the maximized group utility and the minimized individual regret.
From the above results, we can find that Brand C has the smallest Qj value whose function is better than the other brands, and Brand H and Brand E are ranked second and third. Therefore, the VIKOR method can be used to derive useful information to evaluate the functional differences.

4.2. The TOPSIS Method

In this step, derived from the i-Buzz Research Center, we select nine features to evaluate the word of mouth of smartphone brands. Then, the nine types of brand mean scores are obtained and shown in Table 5.
Step 1 Normalization: We first normalize the values in Table 5.
Step 2 Calculate the weight of evaluation criteria: Let these nine word-of-mouth items be the evaluation criteria, and use the entropy method to calculate their weight. Original values are normalized using Equation (1), before calculating the entropy value using Equation (2). We can then calculate the weights using Equation (3), the values obtained are shown in Table 6. Therefore, we use these weights in the TOPSIS method to facilitate the evaluation of word of mouth.
Step 3 Calculate the weighted normalized decision matrix: We use the entropy method to find the weight of each criterion.
Step 4 Determine the positive ideal solution A+ and the negative ideal solution A values: Find the positive ideal solution and the negative ideal solution of every criterion using Equations (13) and (14).
Step 5 Calculate the distance between each alternative with the positive ideal solution ( S i + ) and with a negative ideal solution ( S i ).
Step 6 Calculate the relative closeness of each alternative to the ideal solution C i : Calculate the relative closeness of each alternative to the ideal solution using Equation (17), the results are shown in Table 7, where the bigger the value C i , the greater preference for alternatives.
In Table 7, Brand A has the greatest value of Ci, which implies the word-of-mouth of Brand A is better than the others. Compared to function and word-of-mouth, the best brand by different attributes is different. Therefore, using more attributes can derive more sufficient information to evaluate brand performance.

4.3. The SMART Model

Using the assessment attributes of brand performance, we set the attribute weight according to the surveyed order of each attribute from the SMART ROC method, the weight for each attribute is shown in Table 8. Normalize the assessment criterion using Equations (18) and (19), before converting the values of assessment attributes to [0, 100] criterion. Add them up to get the average, and then multiply the weight of assessment attributes. The brand performance of the brand is obtained by summing them up, the results are shown in Table 9. In addition, in the questionnaire of the TOPSIS process, we also survey the brand image of the selected smartphone brands. The ranking orders from first to last are listed as follows: Brand A, Brand C, Brand G, Brand H, Brand E, Brand I, Brand B, Brand D, and Brand F. Therefore, the score of brand images are normalized as shown in the fourth row of Table 9. Then, the average sales for each smartphone brand are adopted from IDC in Taiwan which are listed in the fifth row of Table 9. Finally, we can rank the smartphone brands by their brand performance; the results are shown in Table 10.
In Table 9, Brand A has the greatest value of brand performance which implies the total weighting values of Brand A is better than the others, and we also can find Brand C, Brand H, and Brand G are ranked second, third, and fourth. Significantly, Brand A dominates the other brands in the attributes of word-of-mouth and brand image, whereas the performance in the function and average sales are not the greatest. In addition, the Brand C dominates the others in the attribute of function but is worst in the average sales; therefore, the brand performance is worse than Brand A. Compared to Brands H and G, Brand H just significantly dominates Brand G in function, but Brand H is worse than Brand G in the other attributes. By considering more attributes in brand performance, we can extend the marketing analysis with more sufficient information.

4.4. Sensitivity Analysis and Discussion

This study hopes to make the weight selection more objective, and then we add the weight calculated by entropy to obtain the average weight as in Table 11. Normalize the assessment attributes using Equations (18) and (19), before converting the value of assessment attributes to [0, 100] criterion. Add them up to get the average, and then multiply the weight of assessment attributes. Table 12 shows the brand performance of the brands. Rank smartphone brands by their brand performance; the results are shown in Table 13.
After adjusting the objective weights to the selected attributes, as shown in the last row of Table 12, we can find that the brand performance values are all different from the last row of Table 9, whereas the ranked order for the selected brands is almost the same except Brands G and H as shown in Table 13. However, the gap between Brands G and H is shortened when the objective weights for the attributes are used. Thus, after weighting, brands with a better brand image performed better. The results show that the customers who buy their favorite brand of smartphone are most affected by the brand’s image. Therefore, we can find the smartphone brand is perceived to be more important than the smartphone functions and average sales. We suggest that when consumers make a decision to buy a product, brand performance is a good decision-making tool for the smartphone brand to evaluate the degree of satisfaction for most customers to their next purchase. In this study, we use some factors to rank smartphones by the SMART method for decision analysis. They are transparent to the decision-maker’s thought processes. Multi-attribute decision analysis tools are able to assist decision-makers in making preferences and in quantifying these values for ranking comparison.
In the future, the use of digital technologies to organize operational processes in different environments is considered effective and efficient [30]. Only using one attribute to evaluate the brand values might not be enough. According to Khalid and Naumova [31], more attributes should be considered since the COVID-19 pandemic. These programs and applications in a smartphone may include 3D printing, computer-aided design and manufacturing, product life cycle management, customer relationship management programs, virtual assistance, artificial intelligence, and so on. Addressing these new technologies during the learning process of future professionals allows for enhancing the digital development of smartphones. Therefore, in this study, we do not only consider the attributes of brand marketing, but also we extend the marketing approaches and define the conceptual framework of the assessment of the multicriteria decision-making models for the marketing theory of brand performance analysis to consider the possibility in the future.
In this study, we propose a framework that is limited by the proposed models, including VIKOR, TOPSIS, and SMART–ROC to assess brand performance with both quantitative and qualitative data. Future research should focus on (1) expanding the testing of MCDM models and choosing the best MCDM models for brand performance analysis, (2) establishing comprehensive threshold values and decision criteria according to various hardware specifications and software evaluation standards, and (3) incorporating more consumers’ subjective criteria to enhance the usability of the proposed model.

5. Conclusions

Brand loyalty does not imply the next purchase to the same brand, strong satisfaction can cause differences in purchase behavior [2]. The scientific novelty of our research proposes an MCDM framework to evaluate the brand performance analysis, which tries to evaluate the satisfaction of the smartphone brands with respect to brand performance. We use the VIKOR model and the TOPSIS method to analyze smartphone functionalities and word-of-mouth. Then, we use the SMART method to rank the brand performance for each smartphone using the attributes of functionalities, word-of-mouth, brand image, and average sales. We find that the top-tier smartphone brands are A, C, G, H, and E. The results show that brand image will significantly affect the brand’s smartphone performance. Therefore, from the point of view of brand performance, smartphone manufacturers should not only focus on innovating the functions of software and hardware but also on developing the functions of easy operation and a better interface for embedding the brand image. However, the consumer buying decision process is very complicated, from the order of the average weight of attributes, the brand performance is based on brand image, function, word-of-mouth, and average sales. The results of this study can remind the marketing managers should have some positive to improve the consumer the brand effect. In addition to discussions through academic research, we can take some coping strategies to enhance the consumer brand performance. For example, marketing managers can enhance the product knowledge of consumers by retailers and to promote their own brand sales. This will not only reduce the perceived risk of consumers before purchase but also enhance the loyalty of its core customers and plays an important role in developing new product segmentation.

Author Contributions

Formal analysis, Y.-Y.H.; Methodology, Y.-Y.H.; Software, L.L.; Supervision, R.-C.T.; Validation, R.-C.T.; Writing—original draft, L.L. All authors have read and agreed to the published version of the manuscript.

Funding

Financial support from Ministry of Science and Technology with project no. MOST 107-2410-H-032-032.

Conflicts of Interest

The authors declare no conflict of interest.

References

  1. Rahim, A.; Safin, S.Z.; Kheng, L.K.; Abas, N.; Ali, S.M. Factors Influencing Purchasing Intention of Smartphone among University Students. Procedia Econ. Financ. 2016, 37, 245–253. [Google Scholar] [CrossRef] [Green Version]
  2. Kim, J.; Lee, H.; Lee, J. Smartphone preferences and brand loyalty: A discrete choice model reflecting the reference point and peer effect. J. Retail. Consum. Serv. 2019, 52, 101907. [Google Scholar] [CrossRef]
  3. Erickson, G.M.; Johansson, J.K. The Role of Price in Multi-Attribute Product Evaluations. J. Consum. Res. 1985, 12, 195–199. [Google Scholar] [CrossRef]
  4. Kim, J.; Lee, S.; Ahn, H.; Seo, D.; Seo, D.; Lee, J.; Choi, C. Accuracy evaluation of a smartphone-based technology for coastal monitoring. Measurement 2013, 46, 233–248. [Google Scholar] [CrossRef]
  5. Yoon, S.; Oh, S.; Song, S.; Kim, K.K.; Kim, Y. Higher quality or lower price? How value-increasing promotions affect retailer reputation via perceived value. J. Bus. Res. 2014, 67, 2088–2096. [Google Scholar] [CrossRef] [Green Version]
  6. Tsaur, R.C.; Chen, I.F.; Chen, Y. Smartphone Market Analysis Using Dynamic Multi-Criteria Decision Methods. Int. J. Inf. Manag. Sci. 2016, 27, 41–60. [Google Scholar]
  7. Cho, Y.C.; Jeon, J.W. Current software platforms on mobile phone. In Proceedings of the International Conference on Control, Automation and Systems, ICCAS, Seoul, Korea, 17–20 October 2007; pp. 1862–1867. [Google Scholar] [CrossRef]
  8. Mehra, A.; Rajput, S.; Paul, J. Determinants of adoption of latest version smartphones: Theory and evidence. Technol. Forecast. Soc. Chang. 2021, 175, 121410. [Google Scholar] [CrossRef]
  9. Chen, C.C. Evaluating Operating Systems of Smart Phones through a Fuzzy MCDM Approach. Master’s Thesis, Southern Taiwan University of Science and Technology, Tainan, Taiwan, 2010. [Google Scholar]
  10. Kao, S.W. Using Multiple Criteria Decision Making to Select Smart Phone. Master’s Thesis, National Formosa University, Huwei, Taiwan, 2011. [Google Scholar]
  11. Chen, Y.-Y.H. Using Analytic Hierarchy Process to Select Smartphones—The Case Study in Central Taiwan. Master’s Thesis, National Formosa University, Huwei, Taiwan, 2012. [Google Scholar]
  12. Zeng, C.J. Product Aesthetic Attributes as Competitive Strategy—The Study of Smart Phones in Taiwan’s Market. Master’s Thesis, Tamkang University, New Taipei, Taiwan, 2009. [Google Scholar]
  13. Liu, C.C.; Huang, H.L. Using Q Methodology to Explore the Reaction Types of Smartphone Users. Electron. Commer. Stud. 2014, 12, 27–49. [Google Scholar]
  14. Liu, C.-J.; Liang, H.-Y. The Deep Impression of Smartphone Brand on the Customers’ Decision Making. Procedia-Soc. Behav. Sci. 2014, 109, 338–343. [Google Scholar] [CrossRef] [Green Version]
  15. Yang, C.C.; Tang, X.; Wong, Y.C.; Wei, C.-P. Understanding Online Consumer Review Opinions with Sentiment Analysis using Machine Learning. Pac. Asia J. Assoc. Inf. Syst. 2010, 2, 73–89. [Google Scholar] [CrossRef] [Green Version]
  16. Hyrynsalmi, S.; Seppänen, M.; Aarikka-Stenroos, L.; Suominen, A.; Järveläinen, J.; Harkke, V. Busting Myths of Electronic Word of Mouth: The Relationship between Customer Ratings and the Sales of Mobile Applications. J. Theor. Appl. Electron. Commer. Res. 2015, 10, 1–18. [Google Scholar] [CrossRef] [Green Version]
  17. Zhang, Q.; Lu, Y.W. Evaluation and analysis the quality of financial operation-to the 31 provinces and municipalities for example. J. Manag. Sci. Stat. Decis. 2012, 9, 64–73. [Google Scholar]
  18. Archak, N.; Ghose, A.; Ipeirotis, P. Deriving the Pricing Power of Product Features by Mining Consumer Reviews. Manag. Sci. 2011, 57, 1485–1509. [Google Scholar] [CrossRef] [Green Version]
  19. Ghose, A.; Ipeirotis, P. Estimating the Helpfulness and Economic Impact of Product Reviews: Mining Text and Reviewer Characteristics. IEEE Trans. Knowl. Data Eng. 2010, 23, 1498–1512. [Google Scholar] [CrossRef] [Green Version]
  20. Keller, K.L. Conceptualizing, measuring, and managing customer-based brand equity. J. Mark. 1993, 57, 1–22. [Google Scholar] [CrossRef]
  21. Schmitt, B. The consumer psychology of brands. J. Consum. Psychol. 2012, 22, 7–17. [Google Scholar] [CrossRef]
  22. Filieri, R.; Lin, Z. The role of aesthetic, cultural, utilitarian and branding factors in young Chinese consumers’ repurchase intention of smartphone brands. Comput. Hum. Behav. 2017, 67, 139–150. [Google Scholar] [CrossRef] [Green Version]
  23. Cretu, A.E.; Brodie, R.J. The influence of brand image and company reputation where manufacturers market to small firms: A customer value perspective. Ind. Mark. Manag. 2007, 36, 230–240. [Google Scholar] [CrossRef]
  24. Martins, J.; Costa, C.; Oliveira, T.; Gonçalves, R.; Branco, F. How smartphone advertising influences consumers’ purchase intention. J. Bus. Res. 2019, 94, 378–387. [Google Scholar] [CrossRef]
  25. Grewal, D.; Krishnan, R.; Baker, J.; Borin, N. The effect of store name, brand name and price discounts on consumers’ evaluations and purchase intentions. J. Retail. 1998, 7, 331–352. [Google Scholar] [CrossRef] [Green Version]
  26. Aaker, J. The malleable self: The role of self-expression in persuasion. J. Mark. Res. 1999, 36, 45–57. [Google Scholar] [CrossRef]
  27. Opricovic, S. Multicriteria Optimization of Civil Engineering Systems; Faculty of Civil Engineering: Belgrade, Serbia, 1998. [Google Scholar]
  28. Hwang, C.L.; Yoon, K. Multiple Attribute Decision Making: Methods and Applications; Springer: New York, NY, USA, 1981. [Google Scholar]
  29. Edwards, W. How to Use Multiattribute Utility Measurement for Social Decisionmaking. IEEE Trans. Syst. Man Cybern. 1977, 7, 326–340. [Google Scholar] [CrossRef]
  30. Barykin, S.Y.; Kapustina, I.V.; Sergeev, S.M.; Kalinina, O.V.; Vilken, V.V.; de la Poza, E.; Putikhin, Y.Y.; Volkova, L.V. Developing the physical distribution digital twin model within the trade network. Acad. Strateg. Manag. J. 2021, 20, 1–18. [Google Scholar]
  31. Khalid, B.; Naumova, E. Digital transformation SCM in view of COVID-19 from Thailand SMEs perspective. In Global Challenges of Digital Transformation of Markets; Nova Science Publishers: Hauppauge, NY, USA, 2021; pp. 49–66. [Google Scholar]
Figure 1. The framework of brand performance analysis.
Mathematics 10 01861 g001
Table 1. Original matrix of the function.
Attributes BrandABCDEFGHI
Items
Smartphone Size7.15.57.36.47.176.17.26.2
AppearanceWeight767.26.27.27.26.27.16.3
CPU7.15.97.16.16.76.66.17.26.2
MainboardRAM7.16.37.26.26.86.56.27.36.2
Radiator6.96.17.36.16.76.76.46.66
Sensors7.65.67.46.16.35.96.27.56.2
InputMain camera7.15.87.55.96.56.36.47.36.2
DeviceFront camera7.15.97.56.16.46.46.47.26.2
Light sensor7.35.87.45.86.46.36.67.46.3
Display size7.16.37.36.77.26.46.67.26
OutputDisplay resolution7.567.56.57.26.66.87.36
DeviceSpeakers7.46.17.16.476.36.576
Sound7.367.46.376.777.25.7
Battery capacity7.26.27.16.76.96.76.67.26
BatteryBattery life7.36.46.86.4776.57.25.9
PerformanceTalk time7.66.66.86.36.87.26.67.15.8
Standby time7.46.7766.67.36.77.35.5
Operating system7.36.37.56.46.96.66.86.96.2
User interface76.37.36.56.56.96.57.16.4
SystemsDrivers7.26.17.46.17.16.46.87.16.2
Database mgmt7.867.56.26.96.76.86.96
Connectivity7.66.27.667.16.66.576.3
Download mgmt6.86.37.36.37.26.86.56.76.2
Word processing6.66.776.17.576.77.66.3
calendar6.76.37.26.37.37.16.77.56.1
Web browser6.76.97.56.67.476.77.16.1
AppliedMaps6.86.57.56.57.576.87.56.6
SoftwareClock7.26.57.56.57.46.76.67.46.3
Input method6.56.77.66.37.36.86.57.46.5
Data synchronization7.26.77.36.67.46.96.87.26.4
Multimedia6.66.87.46.77.27.16.77.46.7
Table 2. The weight of smartphone functions.
AttributesWeightAttributesWeight
Smartphone Appearance0.1800Battery Performance0.1305
Mainboard0.1123Systems0.1105
Input Device0.2256Applied Software0.0845
Output Device0.1521
Table 3. The group utility and the individual regret.
BrandABCDEFGHI
Sj0.12860.90320.03830.78740.31720.46880.63300.11830.8744
Rj0.05010.22560.03730.19870.14140.16500.14140.04510.1650
Table 4. The function evaluation value Qj..
BrandABCDEFGHI
Qj0.08621.00000.00000.86160.43770.58800.62030.06690.8225
Table 5. Original matrix of the word of mouth.
BrandABCDEFGHI
Criteria
Built-in function6.855.44.14.545.65.35.3
Support expansion4.85.75.84.74.646.15.55
Appearance design7.54.74.94.14.63.65.75.74.6
System6.65.24.94.14.645.55.54.3
Service75.24.34.34.13.94.94.94.2
Camera and quality7.655.64.14.13.96.46.33.6
Price4.26.24.94.24.14.55.54.86.2
Video7.355.54.14.54.25.96.34.2
Application6.85.15.244.43.85.85.44.7
Table 6. The word of mouth weight.
CriteriaWeight
Built-in function0.0832
Support expansion0.0535
Appearance design0.1456
System0.0825
Service0.1095
Camera and quality0.2093
Price0.0821
Video0.1325
Application0.1020
Table 7. The Ci value.
BrandABCDEFGHI
Ci0.39580.25130.26300.07850.11450.04070.33720.32200.1595
Table 8. The attribute weights.
ItemAssessment AttributesOrder of AttributeROC Weight
1Function20.2708
2Brand image10.5208
3Average sales40.0625
4Word of mouth30.1458
Table 9. The result by SMART–ROC analysis.
Evaluation AttributesWeightBrand Average Value
ABCDEFGHI
Function0.270891.380.00100.0013.8456.2341.2037.9793.3117.75
Word of mouth0.1458100.0059.3062.6110.6620.790.0083.5079.2233.45
Brand image0.5208100.0025.0087.5012.5050.000.0075.0062.5037.50
Average sales0.062571.725.0615.422.35218.482.52100.0010.3521.90
Total value 95.888221.982282.742311.959145.453311.314568.058270.015530.5825
Table 10. The ranking of brand performance.
BrandABCDEFGHI
Rank172859436
Table 11. The attribute weights.
ItemEvaluation AttributeEntropy WeightROC WeightAverage Weight
1Function0.33840.27080.2652
2Brand image0.25950.52080.4296
3Average sales0.06770.06250.1067
4Word of mouth0.33440.14580.1985
Table 12. The brand performance analysis by average weight analysis.
Evaluation AttributeWeightAverage Value
ABCDEFGHI
Function0.265291.380.00100.0013.8456.2341.2037.9793.3117.75
Word of mouth0.1985100.0059.3062.6110.6620.790.0083.5079.2233.45
Brand image0.4296100.0025.0087.5012.5050.000.0075.0062.5037.50
Average sales0.106771.725.0615.422.35218.482.52100.0010.3521.90
Total value 94.696523.051078.183411.407342.490811.195169.931468.425329.7939
Table 13. The ranking of brand performance.
BrandABCDEFGHI
Rank172859346
Publisher’s Note: MDPI stays neutral with regard to jurisdictional claims in published maps and institutional affiliations.

