1. Introduction
In this study, we address the problem of how to structure educational exercises that intend to make it easier for Computer Graphics (CG) students in self-study mode to learn Geometric Transformations (GTs). GTs are an important subject in education and have applications in many fields. It is an area of mathematics taught at all educational levels, from elementary to higher, especially in the areas of Science, Technology, Engineering, and Mathematics (STEM). In the United States, the Common Core State Standards (CCSS) initiative [
1] includes GTs from eighth grade. This standard proposes experimental verification of rotations, reflections, scales, translations, and understanding concepts about consistency and similarity between 2D figures using compositions of GTs. In middle school, the CCSS proposes to deepen the experimentation with transformations in the 2D plane. For attending these recommendations, various mathematics education studies address the theoretical-practical aspects of teaching GTs, aimed at the elementary and intermediate levels of education [
2,
3,
4,
5,
6,
7,
8]. Additionally, there is a generalized tendency to use the so-called Dynamic Geometry Software (DGS), such as Cabri [
9], Geometer’s Sketchpad [
10], and Geogebra [
11], among others. An advantage of DGS is that it provides students with a learning environment for exploration and experimentation. Numerous studies have analyzed the impact of DGS on teaching GTs from different perspectives [
9,
10,
12,
13,
14,
15,
16].
In higher education, particularly CG courses, the emphasis on teaching GTs is associated with the computational methods that allow rendering 2D and 3D scenes [
17,
18,
19]. In an introductory CG course, the study of transformations usually begins with translations, rotations, reflections, and scales, applied in isolation; this subject can be introduced in 2D and then extended to 3D. Later in the course, students can learn the composition of transformations. Once students are comfortable with these concepts, they approach the rendering pipeline in detail. We detected a gap in proposals explicitly focused on designing learning exercises for GTs in higher education and distance learning, which should comprehend: (1) 3D environments, (2) matrix representation, (3) rendering-oriented processing, (4) local and global coordinate systems, and (5) optimization of solutions (e.g., provide feedback about unnecessary complexity in a submitted solution). Even for in-person education, textbooks in this discipline generally focus only on two aspects of GTs: (1) their formal representation and mathematical treatment, and (2) their implementation in a programming language or software, leaving the teacher responsible for designing a learning strategy, without further guidance on structuring the practice.
Learning GTs in higher education is not a trivial task for many students. It is often necessary to use specialized tools such as physical models or 3D software that provides a sandbox for free experimentation and learning-by-doing, complementing other study materials. Some studies have addressed the degree of difficulty that some tasks related to GTs intrinsically have as humans approach them. For example, a study by [
20] found that translations, reflections, and rotations involve similar skill factors, which in order of difficulty are image recognition, transformations recognition, identification of transformations parameters, and image construction. A translation is the most effortless perceived transformation, followed by reflections and simple rotations [
21]. Similar results found in [
22] show that translations and horizontal or vertical reflections are the easiest to understand. A study on the classification of problem-solving strategies related to GTs [
23] utilized five types of questions which, in order of difficulty, were: (1) move, (2) reflect on a diagonal, (3) rotate, (4) make a composition of transformations, and (5) establish the sequence of transformations involved, given a figure in a “before” and “after” states. Together with an empirical observation in the classroom, these studies clarify that many students struggle to understand composite sequences of GTs; performing complex spatial abstractions demands a strong cognitive ability [
24].
From early 2020 until late 2021, when the COVID-19 pandemic made it mandatory for students to take classes at home, many educational strategies common in the classroom were no longer available; suddenly, students and teachers were using alternative tools through different platforms. In the specific case of the Autonomous University of Juarez City (UACJ by its Spanish name), some students dropped or failed the undergraduate course in CG due to the difficulty in “connecting” the theoretical aspect of GTs with their visual representation and effect on objects. Other students were frustrated with the available media, such as video conferences, digital sketch pads, or screen-shared multimedia presentations. These resources were perceived as insufficient to convey the visual content and provide the free experimentation demanded to fully understand GTs. Similar scenarios were common in higher education in different countries, academic programs, and individual courses [
25,
26].
As the situation progressed, we provided CG students with the early versions of two software prototypes originally envisioned to support an online version of the CG course, which the UACJ planned to offer in the future. The effect that these prototypes had on the students’ performance confirmed (intuitively, by the close following of our students) that video games were a good choice to motivate students at the time.
The research question we address in this study is whether students in self-study mode (not attending in-person classes) and using specially designed software tools can achieve a comparable GTs learning outcome to students taking a regular CG course in the classroom. A complementary question is whether the students’ visual-spatial abilities are trained to a comparable extent in both scenarios.
This paper summarizes the design foundations of two designed pieces of software and the findings from an empirical test held with undergraduate students using this software in Spring 2022 at the UACJ.
In the rest of this paper,
Section 2 introduces GTs, from a learning perspective, as they are usually treated in an introductory course in CG. It includes the matrix representation and the concept of composition of transformations.
Section 3 details a proposed framework to generate learning exercises based on a standardized pattern for building compositions of GTs. It is described how this pattern allows the optimization and comparison of solutions, automates the generation of exercises, and provides the basis to associate exercises with different degrees of difficulty. Additionally, in this section, we summarize the design and features of two software tools that embedded the framework and how they were used in the experimental test.
Section 4 describes the results after testing the tools with undergraduate students,
Section 5 discusses the results, and
Section 6 presents our conclusions and future work.
2. Geometric Transformations
In the context of a CG course, it is advantageous to study the matrix representation of GTs because it is the standard way in which the graphics accelerator hardware internally manipulates transformations [
27]. This treatment turns out to be a computationally efficient method for calculating the new positions of an object’s vertices after some transformation. This section briefly describes the 3D-transformations matrix format and addresses the composition of transformations and the notions of local and global coordinate systems. Instead of a mathematical emphasis, this section intends to provide an educational context, putting in perspective the learning exercises that will be addressed later in this work.
2.1. Matrix Representation and Single Transformation
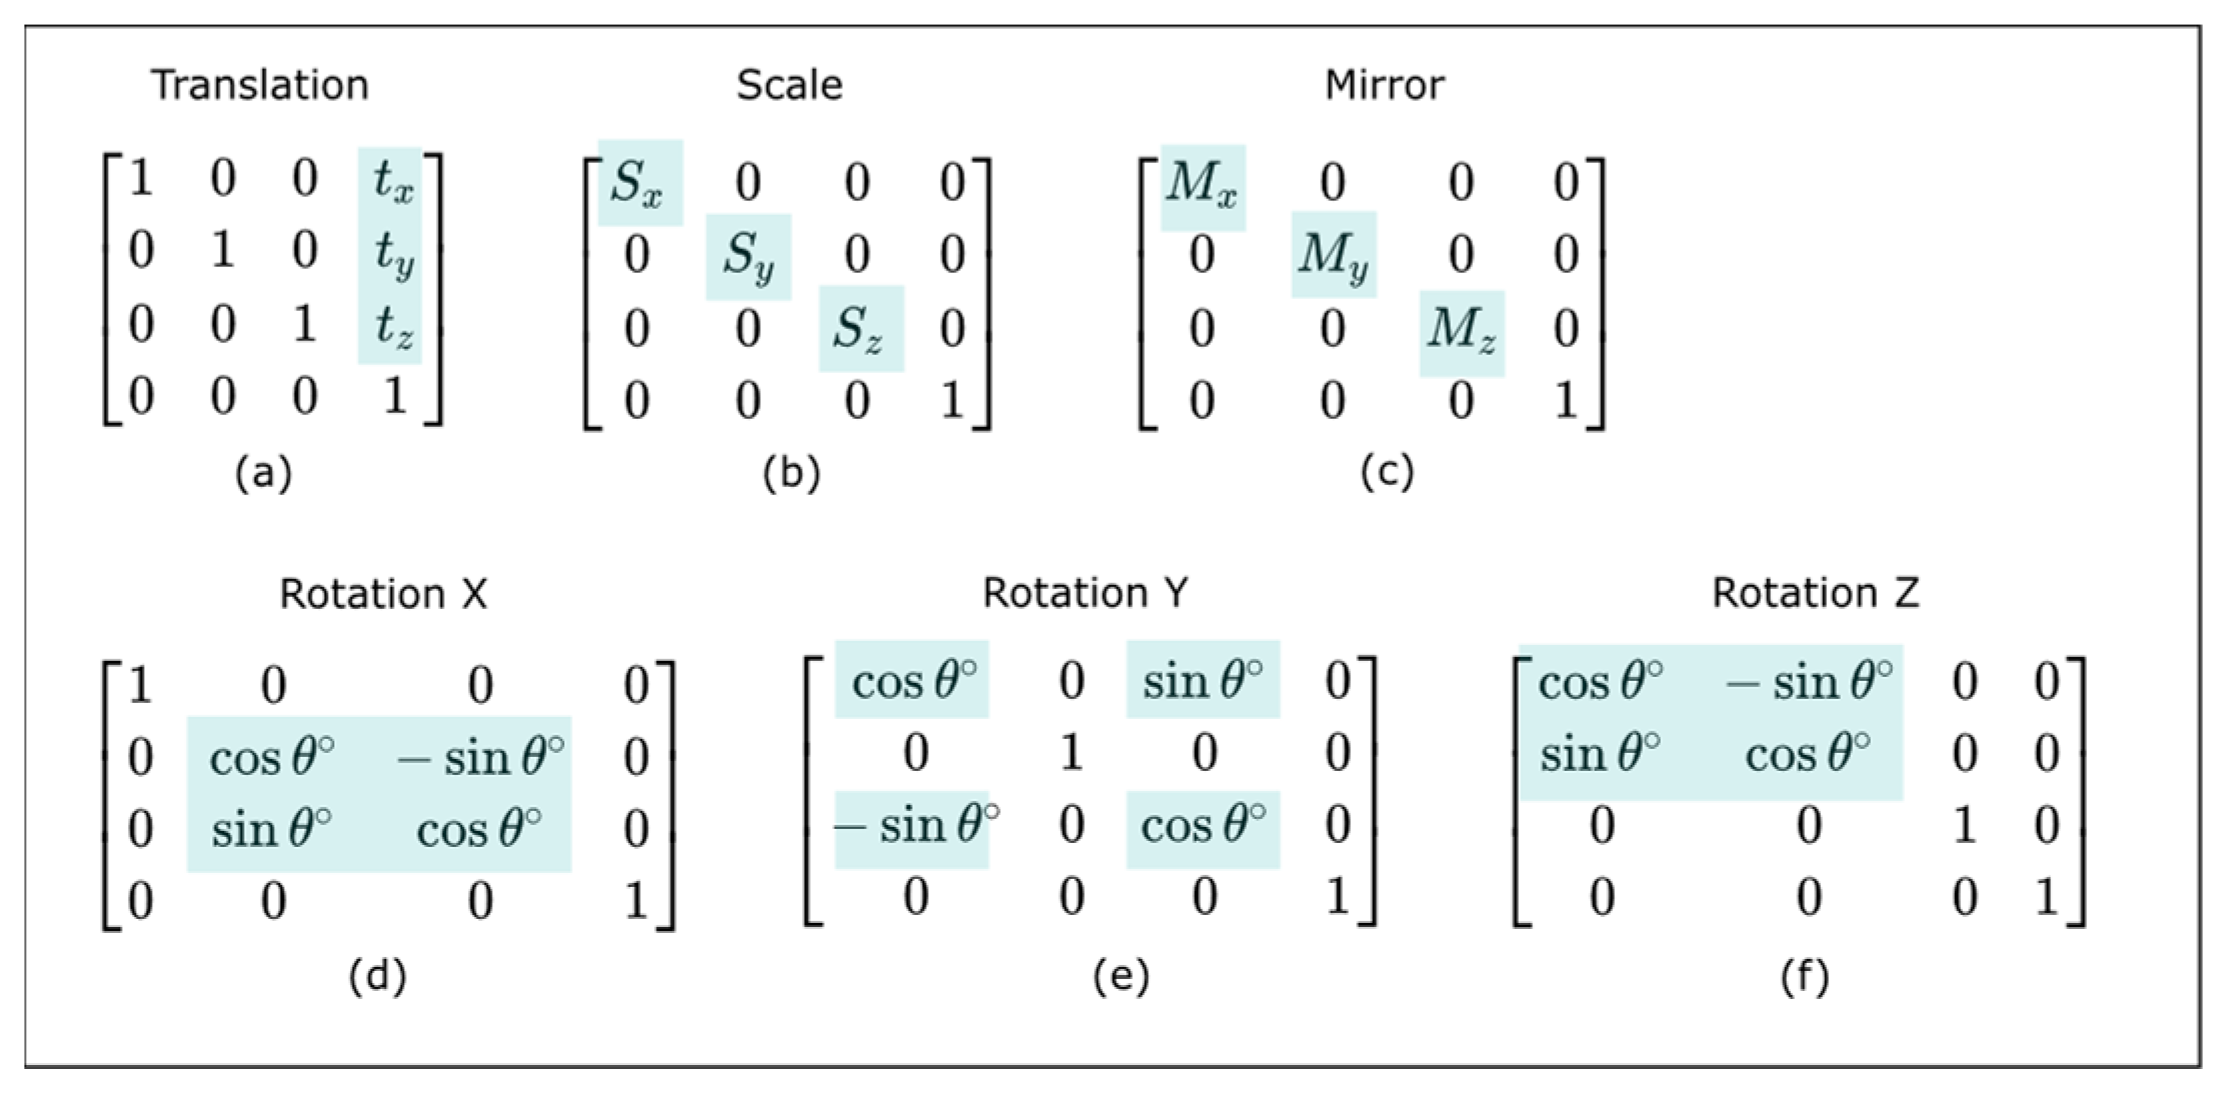
Matrices representing 3D transformations have a standard 4 × 4 format [
28]. Depending on the type of transformation, certain matrix positions have a specific meaning, while the rests are 1 s and 0 s (according to the identity matrix). The translation needs three distances tx, ty, and tz (
Figure 1a). Scale requires three factors Sx, Sy, and Sz (
Figure 1b). Mirror (reflection) also needs three factors, Mx, My, and Mz (
Figure 1c), which share the same matrix positions as the scale. A minus 1 factor indicates the mirror. Finally, three fundamental rotations are defined on the X, Y, and Z axes, respectively (
Figure 1d–f), where Ɵ indicates the rotation angle, measured in degrees.
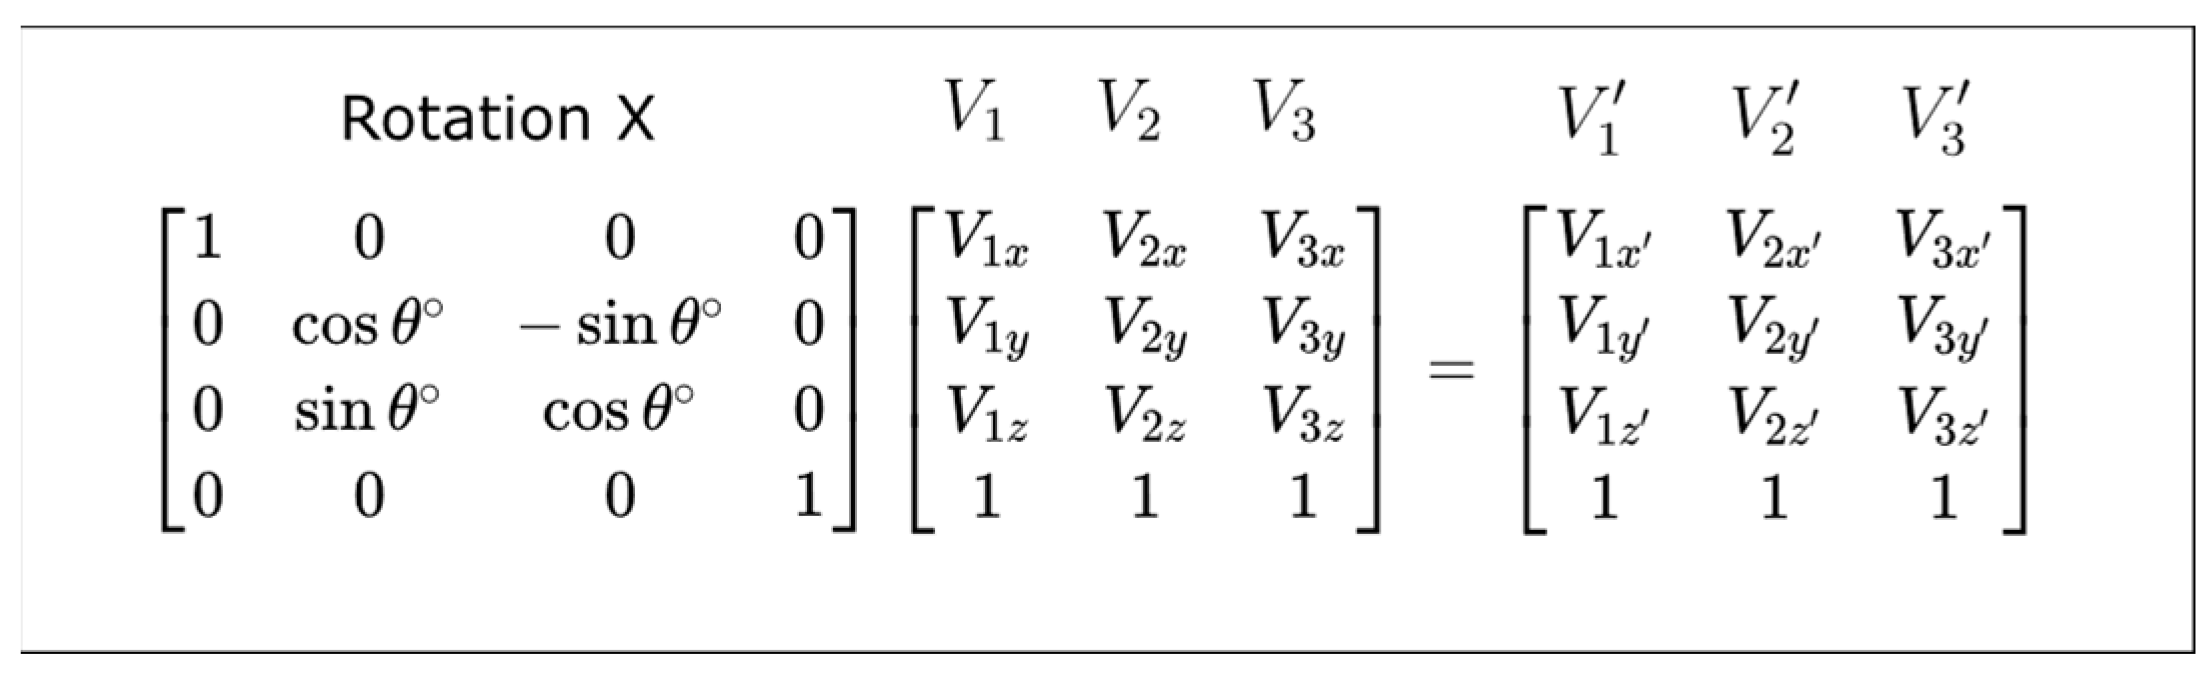
A vertex is represented with a 4 × 1 matrix. Vertex transformation is done when a transformation matrix multiplies a vertex matrix. Repeating this operation separately for each vertex can be avoided if the 4 × 1 format is extended to a 4 × N matrix, where N is the number of vertices. This notation allows a single multiplication and calculates all vertices simultaneously, as shown in
Figure 2, where an X-rotation is applied to vertices
V1,
V2,
V3, obtaining the transformed vertices
,
,
.
A single (not composite) transformation applies only one fundamental transformation (translation, rotation, scale, or mirror) to an object. This kind of exercise is usually straightforward and intuitive to understand by a student since the change in the object’s visual shape, from its original state to its final state, results from a single type of transformation.
2.2. Composite Sequences
Applying a single transformation can be generalized to multiple transformations (a composite sequence). For learning purposes, the sequence is calculated first (multiplying all transformation matrices in the sequence), and then the result is applied to the vertices matrix. There is no limit to how many transformations can be included in a sequence. However, the order in which transformations appear in a sequence is key to determining the vertices’ final state, given the non-commutative property of matrices multiplication. Thinking of the correct order of transformations in a sequence usually causes difficulties for students because it requires a higher level of abstraction than a single transformation. Students must be able to mentally imagine the cumulative effect of transformations in a specific order. Another difficulty a student commonly faces is the equivalence of composite sequences. There are different ways to achieve the same transforming effect on an object. Two or more sequences can be equivalent, even if they do not intuitively appear like that, as they may significantly differ in the number and type of utilized transformations.
2.3. Local and Global Coordinate Systems
When a 3D scene is built, various objects are usually placed in different locations and orientations relative to the same 3D space. The whole scene has a coordinate system, usually called “global”, which serves as a fixed reference for all the objects in the scene. On the other hand, each object can have its own coordinate system, usually called “local”, which defines its vertices in its own space. This distinction between local and global systems can create additional difficulty for students when defining a composite sequence. They must specify all the steps in the sequence by thinking “locally” or “globally”. When focused on the local system, matrices should be thought of from left to right, while in the other case, from right to left. What for one approach is the “first step”, for the other is the “last step”, and vice versa. The difference lies only in the cognitive process of thinking a sequence. Regardless of the case, the sequence of matrices will be the same after being written.
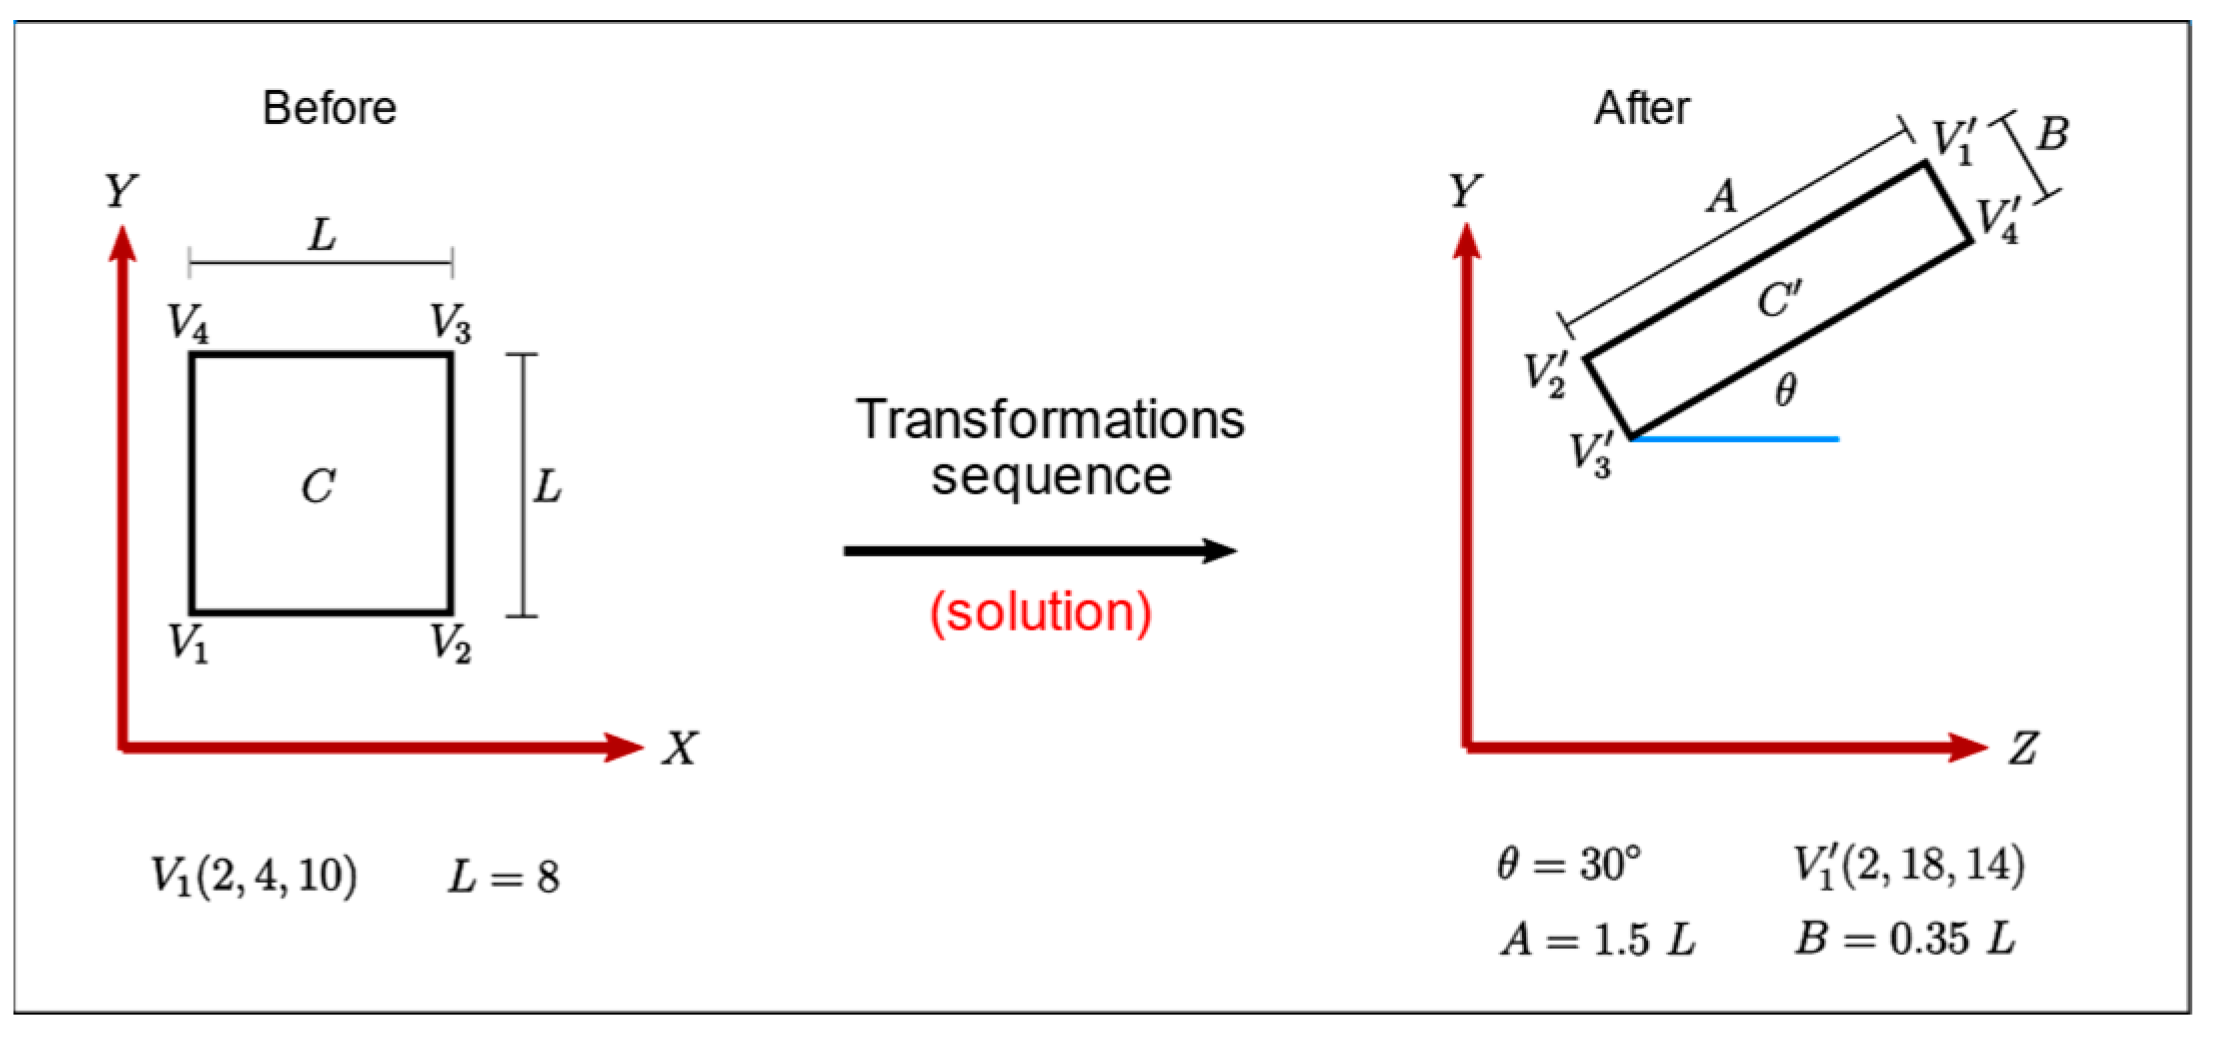
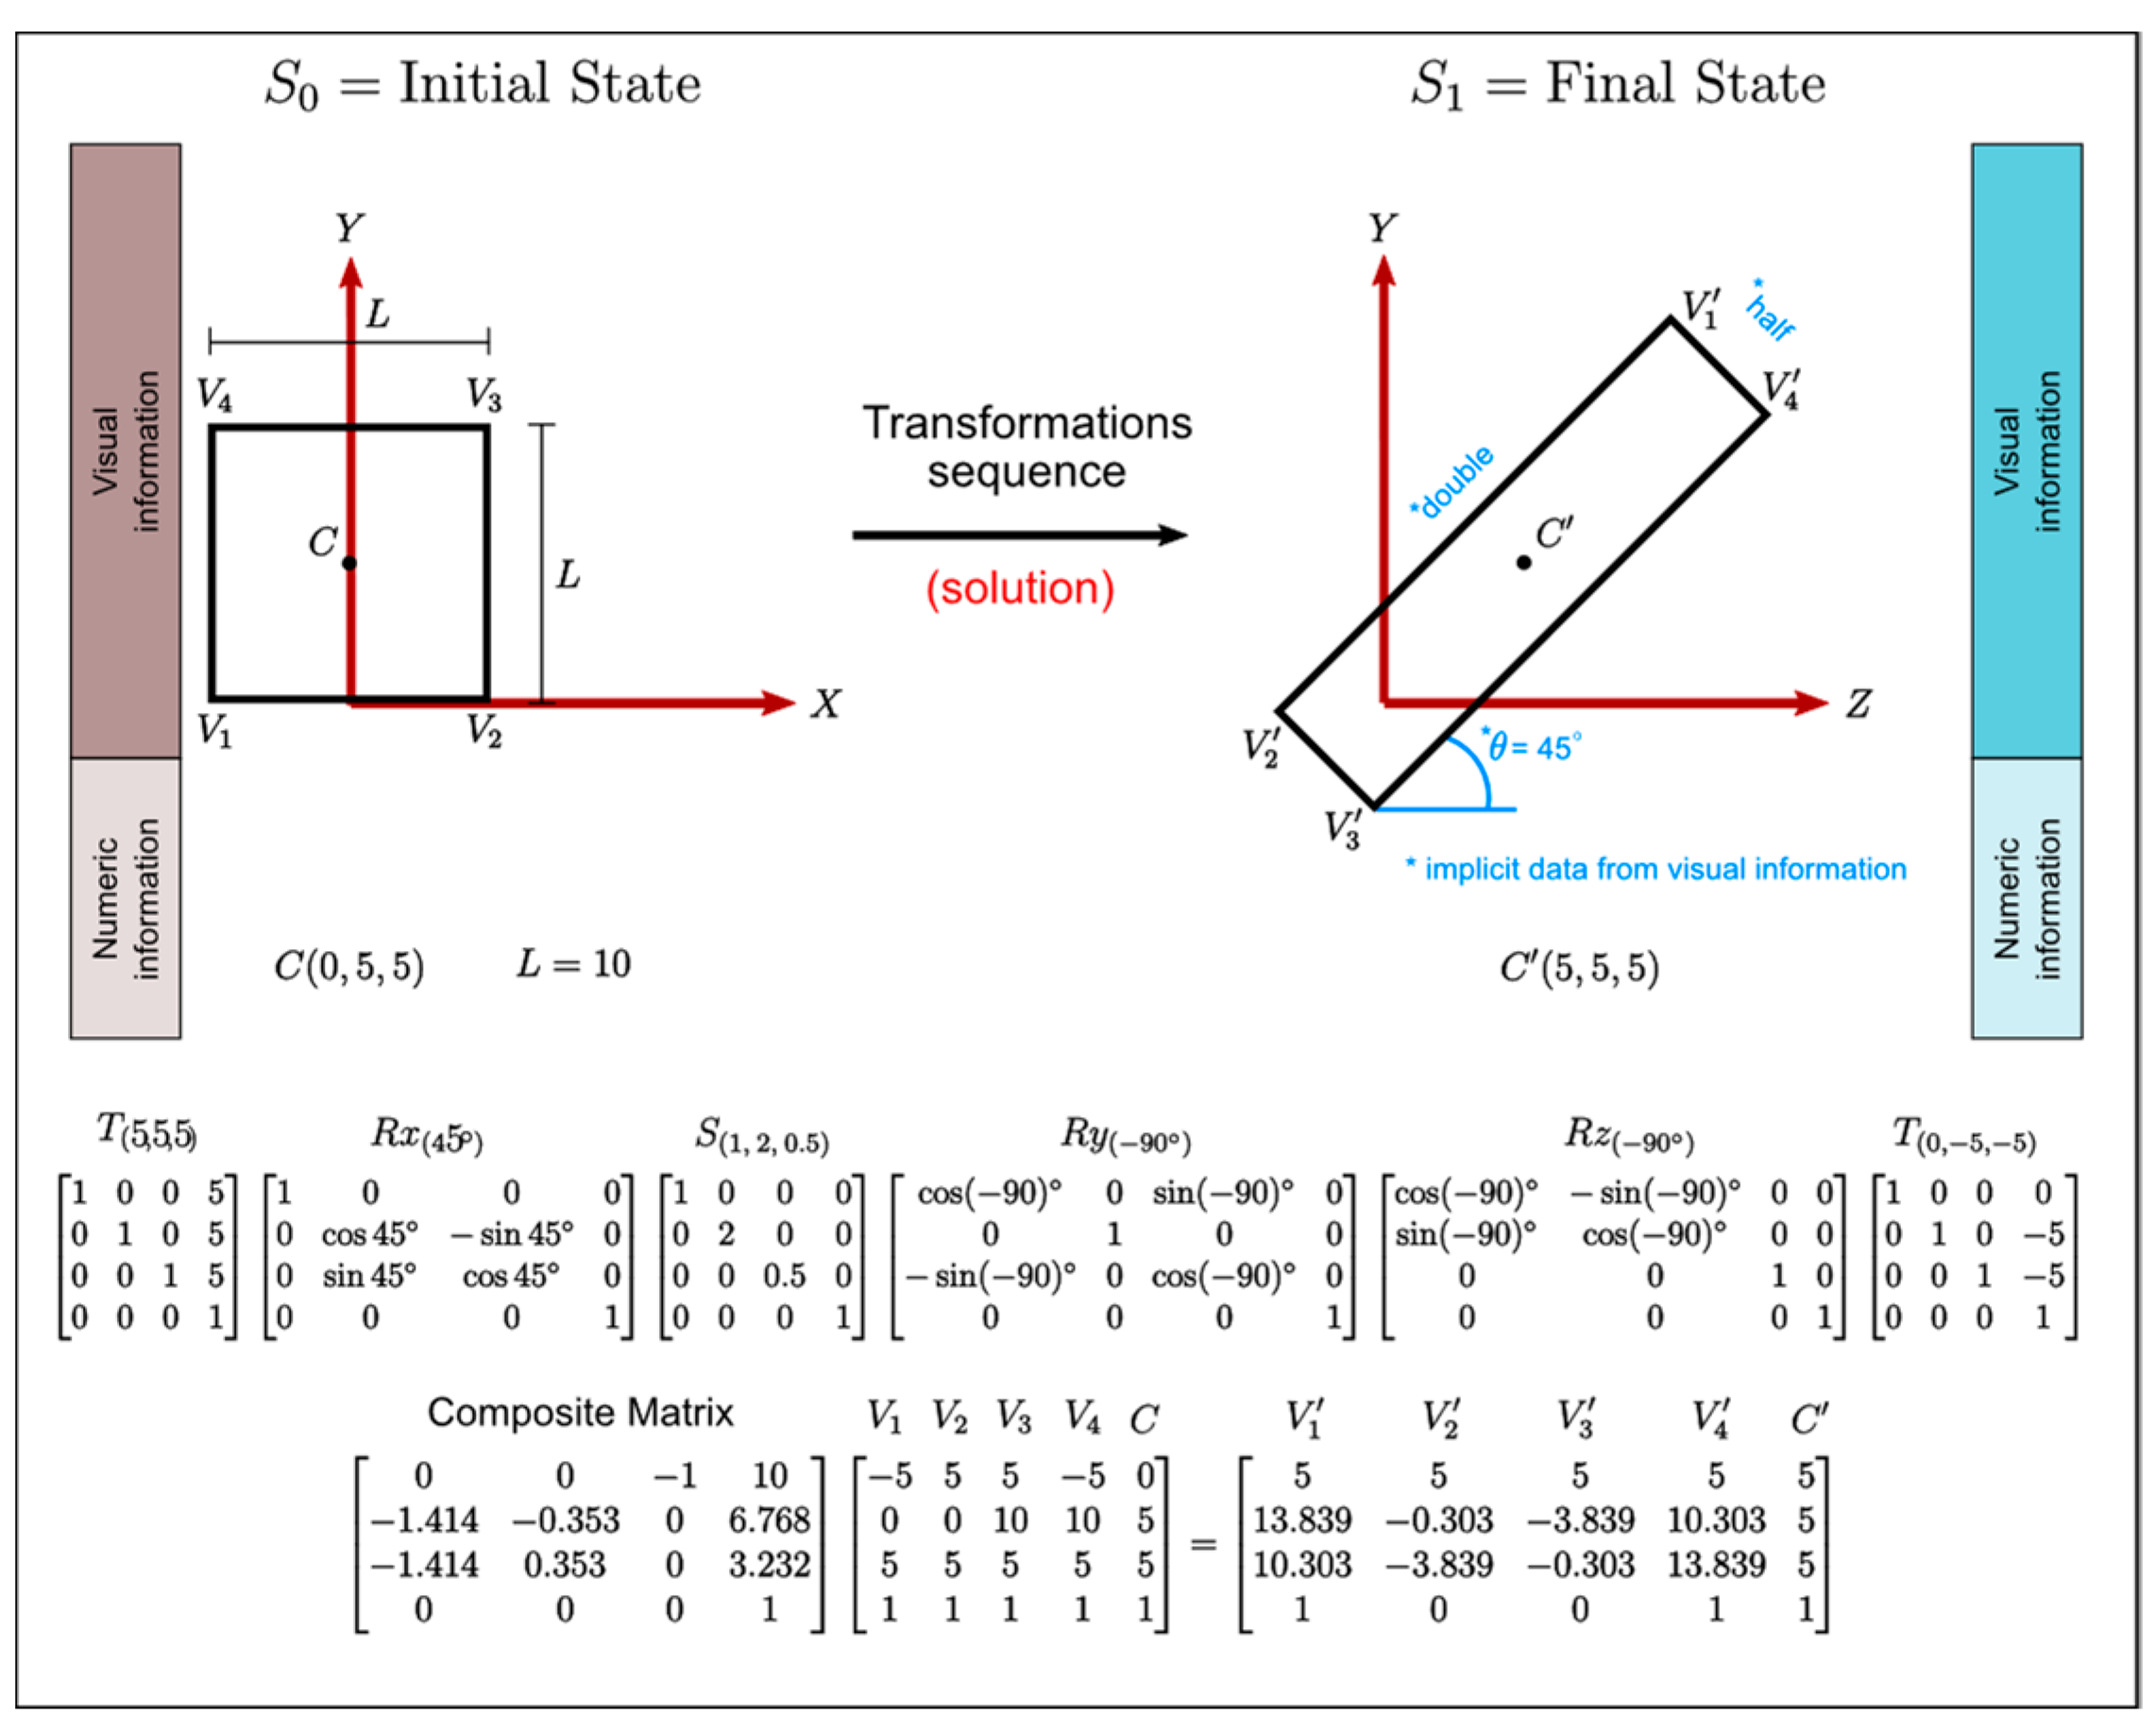
2.4. The “Before and After” Style of Learning Exercise
As an educational strategy for learning GTs, a commonly utilized exercise requires transforming an object from an initial to a final state [
29]; it has been classified as one of the most demanding learning activities involving GTs [
23].
Figure 3 shows a real example used in the classroom to introduce students to the concept of a composite sequence.
The solution is a sequence of matrices that also involves the computation of the composite matrix and the transformed vertices. The exercise provides enough information to lead the student to a solution. Still, alternative solutions (different sequences) commonly exist for the same exercise. Some students propose a solution using the explicit given information. In contrast, others tend to perform extra calculations to derive implicit information and then use it in the matrices sequence. Although any sequence that achieves the final state is correct, students are encouraged to find a sequence with few steps and use the explicit information in the exercise; this is usually associated with a good understanding of the core concepts and a neat logic to solve the problem.
3. Method
This section proposes a framework for designing learning exercises and classifying their solutions. It will allow us to define a standard pattern for the composition of transformations, simplify solutions to the minimum of essential steps, and provide feedback on how close or far an arbitrary solution is from the optimal. We also describe here how the model was implemented in two different educational tools. The first tool is a computer program that allows students to experiment freely with composite sequences and generate exercises of varying degrees of difficulty. The second tool is a card-based video game that provides a ludic environment to drill the GTs subject. These tools complement each other; the first one provides a sandbox to learn the analytical and formal matrices treatment, while the second one aims to consolidate the learning, in this case, by playing. Finally, we also explain the design of the empirical test conducted with undergraduate students to measure their performance in a series of GTs exercises after using the tools.
3.1. Base Conditions for the Definition of Learning Exercises
This work demonstrates that a wide variety of exercises with an educational purpose can be generated from a small set of cases involving restricted GTs, parameters, and states. One advantage of these restrictions is that it allows the definition of a general framework that characterizes a finite set of learning exercises and explains their common properties. Another advantage is that any solution in this set can be uniformly represented, both in its structure and complexity, highlighting its educational suitability. Additionally, the proposed restrictions will facilitate the automatic generation of exercises and a mechanized evaluation of solutions by software tools aimed at easing the GTs learning.
3.1.1. A Framework for Characterizing Learning Exercises and Their Solutions
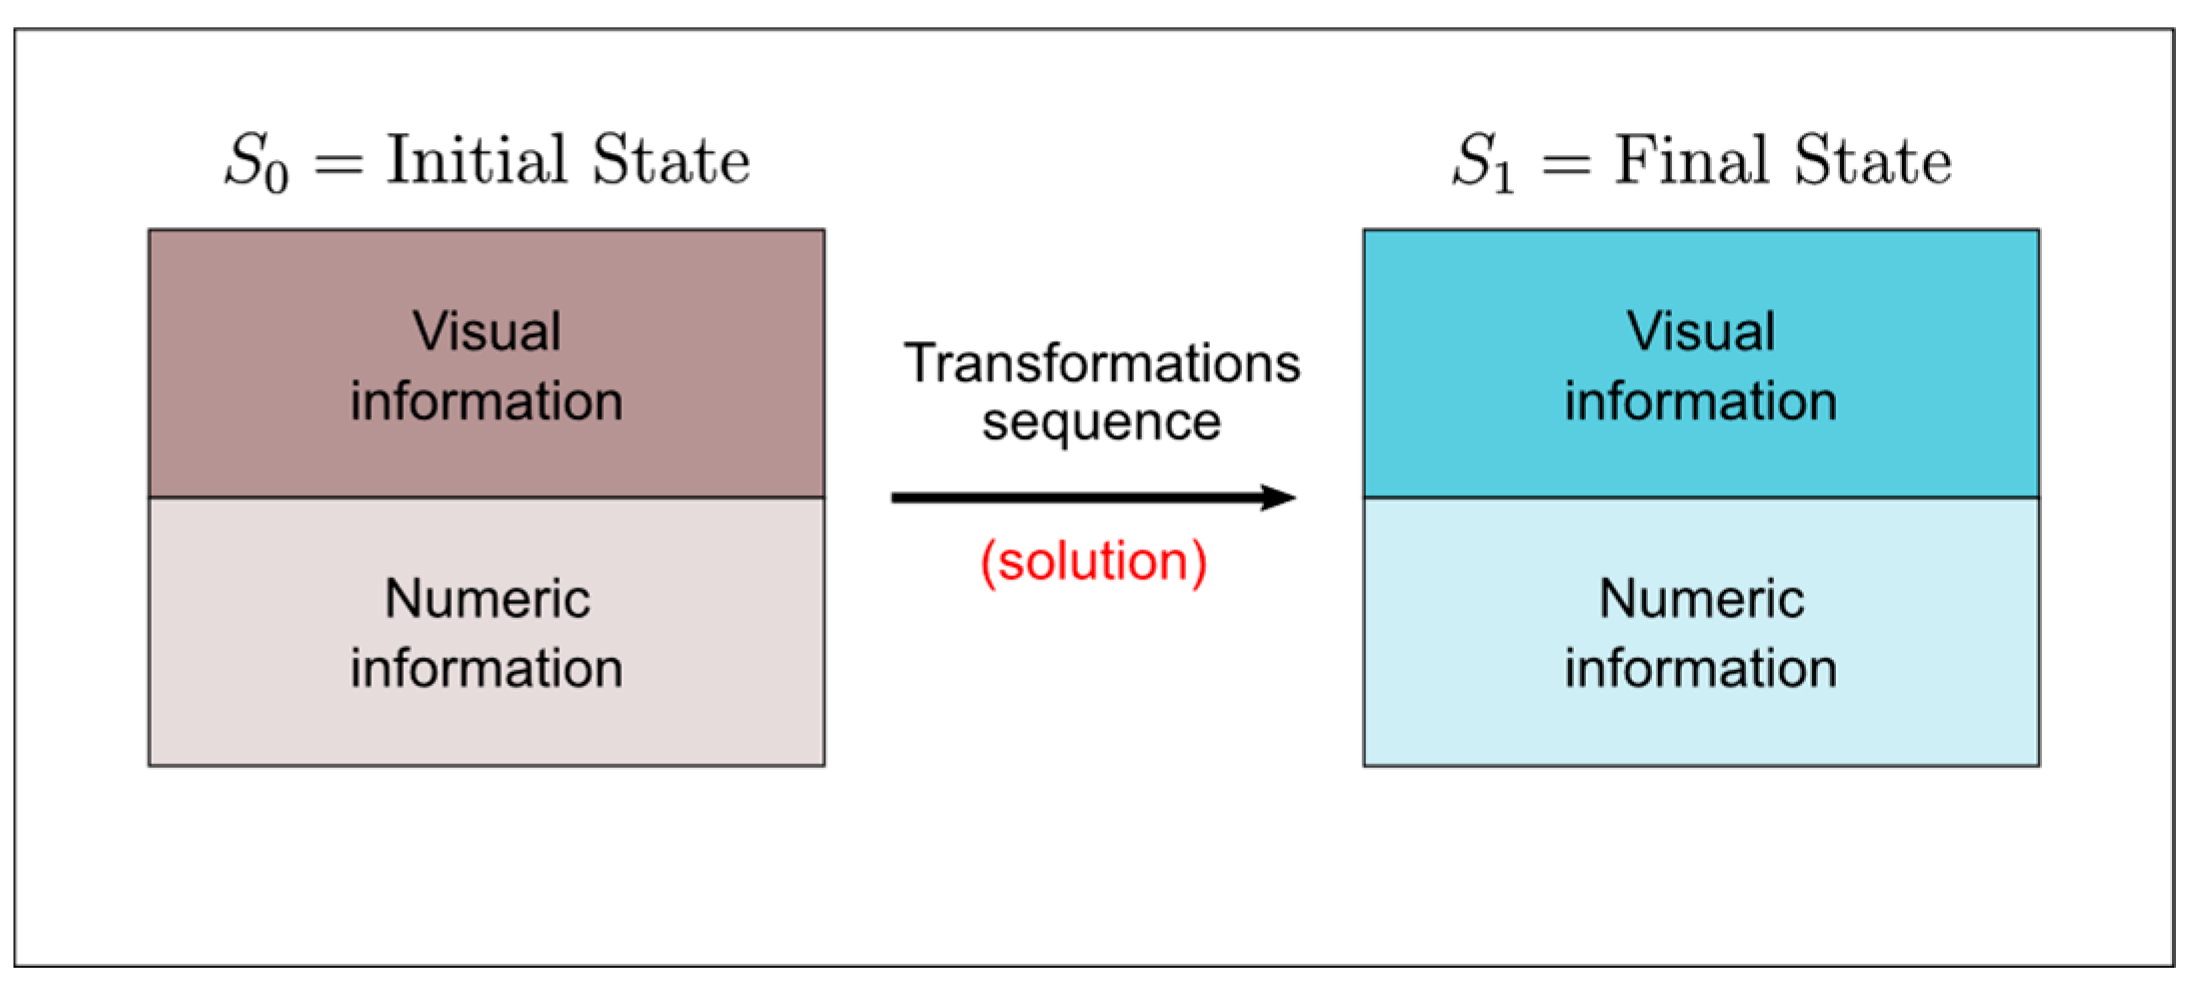
The proposed exercises include visual and numerical information of an object in a 3D coordinate system and ask for a solution, expressed as a composite sequence of transformations that change the object from an initial to a final state. The exercise provides the minimum necessary information to define both states unambiguously.
Figure 4 is a schematic representation of the proposed model. Relevant information should be provided as “visual information” (as much as possible) because the visual aspect is essential to understanding the effect of applying GTs.
The following is a list of seven different solutions (among many others) to the exercise shown in
Figure 3. The matrix representation is omitted to save space. Transformations appear abbreviated as T(tx, ty, tz), Raxis(degrees), M(mx, my, mz), and S(sx, sy, sz), where: (tx, ty, tz) are distances, (mx, my, mz) are reflections, and (sx, sy, sz) are scale factors, in their respective axes. Additionally, the numbers directly recognizable from the exercise description (explicit numeric information) are highlighted in red.
T(2, 18, 14) ∙ Ry(−90°) ∙ Rz(30°) ∙ M(−1, −1, 1) ∙ S(1.5, 0.35, 1) ∙ T(−2, −4, −10)
T(2, 18, 14) ∙ Rx(−30°) ∙ S(1, 0.35, 1.5) ∙ Ry(−90°) ∙ Rz(180°) ∙ T(−2, −4, −10)
T(2, 18, 14) ∙ Ry(−90°) ∙ Rz(210°) ∙ S(1.5, 0.35, 1) ∙ T(−2, −4, −10)
T(2, 18, 14) ∙ Rx(60°) ∙ S(1, 1.5, 0.35) ∙ Ry(−90°) ∙ Rz(−90°) ∙ T(−2, −4, −10)
T(2, 18, 14) ∙ Ry(−90°) ∙ T(1.898, 2.712, −10) ∙ Rz(210°) ∙ S(1.5, 0.35, 1)
T(12, 20.712, 15.898) ∙ Ry(−90°) ∙ Rz(210°) ∙ S(1.5, 0.35, 1)
Rx(60°) ∙ T(12, 24.124, −9.988) ∙ S(1, 0.75, 0.0875) ∙ Ry(−90°) ∙ Rz(−90°) ∙ S(2, 4, 1)
These sequences raise the question: which solution is better? From a mathematical point of view, they are all equivalent, as they produce the correct result. Some CG textbooks suggest a sequence with the pattern Translation-Rotation-Scale (TRS transformation) [
30] for the general problem of an “instance transformation”. In a quick survey held in the classroom, students were asked to choose their preferred solution to the problem, given the seven solutions shown in the previous list. A 92% of students preferred solution 1, giving arguments such as “logical”, “clarity”, “similarity to exercise description”, and “easier to understand”, among others. This perception suggests that the best composite sequence is not necessarily the one with fewer steps or strictly following a TRS transform. It highlights a gap between a mathematical-only approach and an educational approach. We propose the following framework to classify, intuitively, a solution as the “preferred” one:
Each step in the composite sequence should be a “basic” one.
The “basic” steps are translations, scales, reflections (mirror), rotation X, rotation Y, and rotation Z. Students understand better the scales and reflections as separate transformations, according to the visual effect on the object; despite the fact that they could be written as just one matrix if they are contiguous in a sequence (from a mathematical point of view). Additionally, rotations should be separated by axis because they become meaningless for students if they appear combined in a single rotation matrix. On the other hand, translations, scales, and reflections are well understood as basic steps, no matter if they involve one or more axes at once; for instance, T(4, 6, 2), S(2, 0.5, 1), or M(−1,−1, 1), are generally perceived well as a “single” step.
Transformations in the sequence should appear in the TRS order, but they should be expressed as “basic” steps. It then becomes a T∙R3∙R2∙R1∙M∙S order, where R1, R2, and R3 are a permutation of Rx, Ry, and Rz (although not every exercise requires the three rotations). We call this sequence the “extended TRS” order. Additionally, if the object is out of the origin (in its initial conditions), the translation necessary to place it at the origin should appear as an additional step in the sequence. The extended TRS order becomes T1∙R3∙R2∙R1∙M∙S∙T0, where T0 translates the object to the origin, and T1 translates it to its final location.
Numerical information provided in the exercise should be explicitly identifiable in the matrices’ content as much as possible. Students easily identify these numbers with the exercise’s description and requirements.
If two or more equivalent sequences fit the “basic” steps principle and the extended TRS pattern, the sequence with fewer steps is the best candidate for the “preferred” solution.
3.1.2. Reducing Cases in Transformations’ Parameters
The variety of transformations’ parameters can be limited to a few intentionally simple cases. One advantage of this approach is that, given the simplicity of the selected cases, some numerical information could be implicitly embedded in the visual information, if desired. We propose a small set of possibilities for transformations, restricted to only those shown in
Table 1. The total options available are 21 rotations, 3 reflections, 6 scales, and 6 translations.
The exercise in
Figure 3 can be rewritten to meet these restrictions. The new version (see
Figure 5) does not lose the essence or complexity of the old version. If students are aware of the implemented restrictions, data written in blue can potentially be omitted in
Figure 5 and still be inferred from the visual information. The solution is expressed following the extended TRS pattern.
3.1.3. Reducing the Number of Object Views to Specific Symmetries
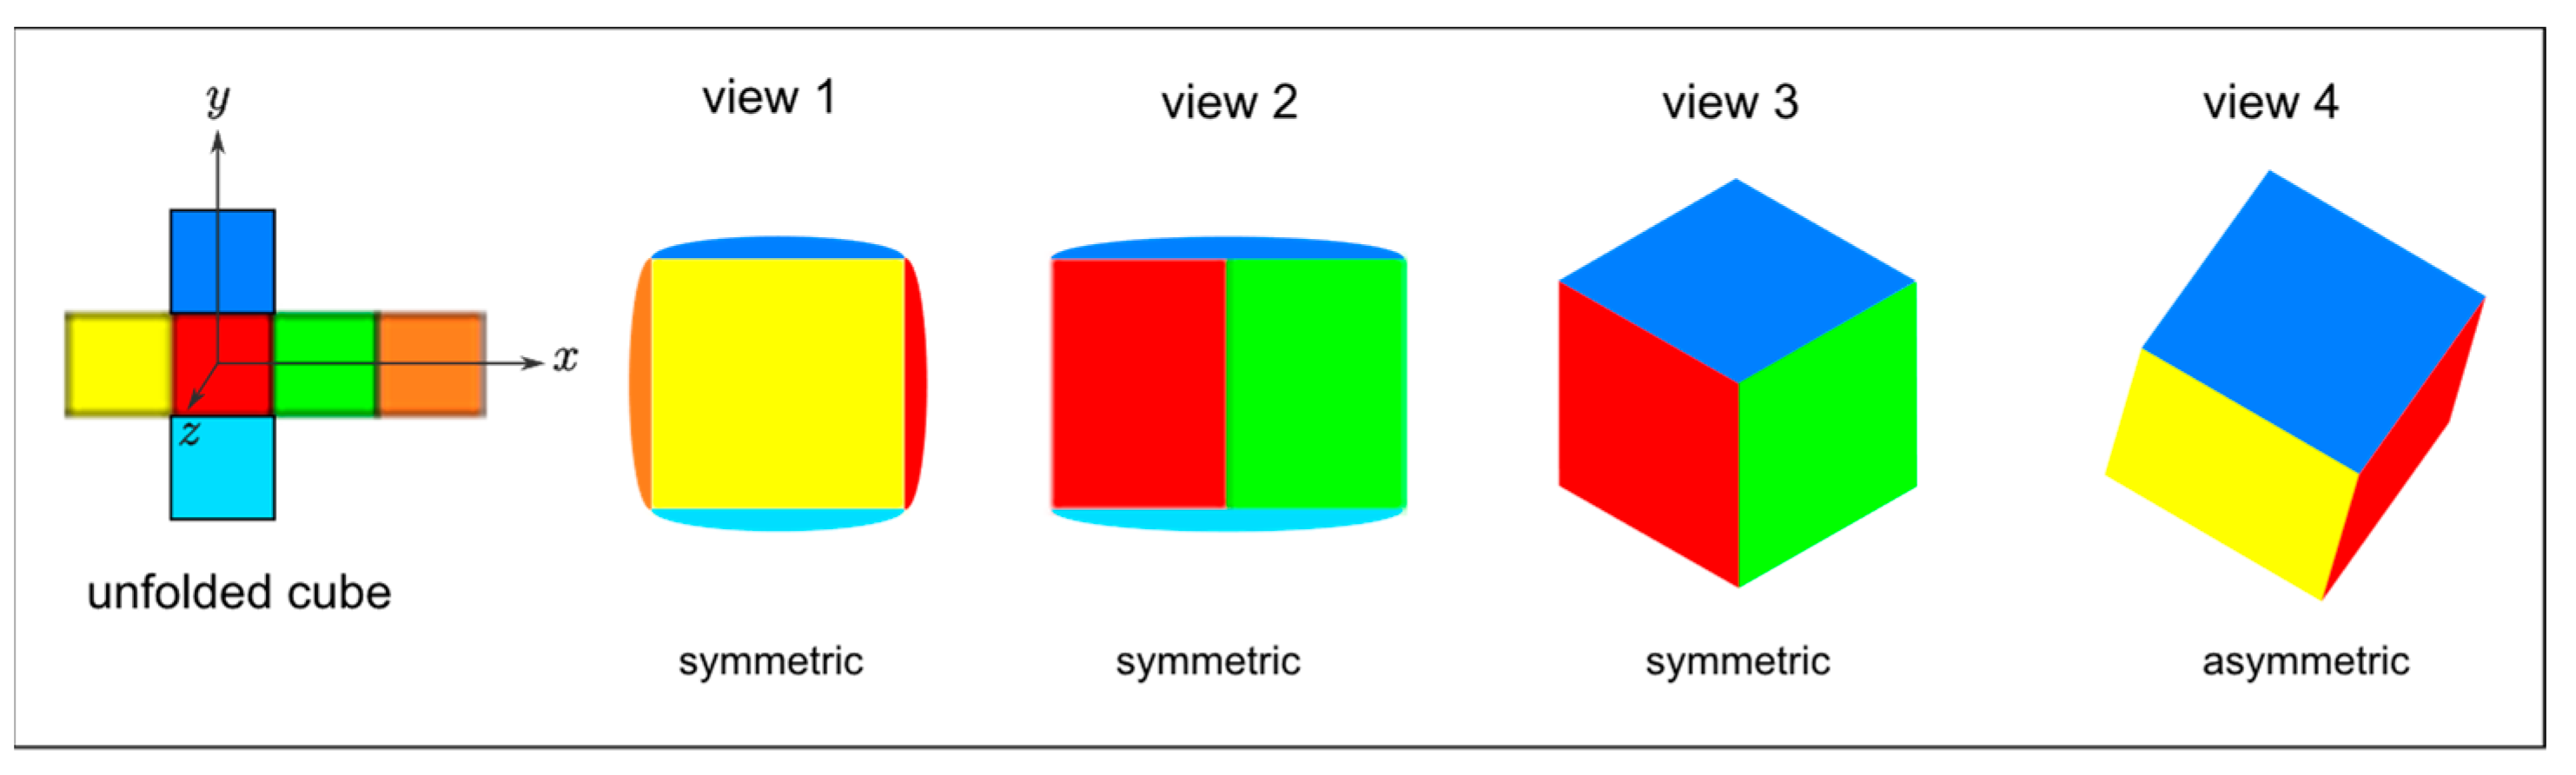
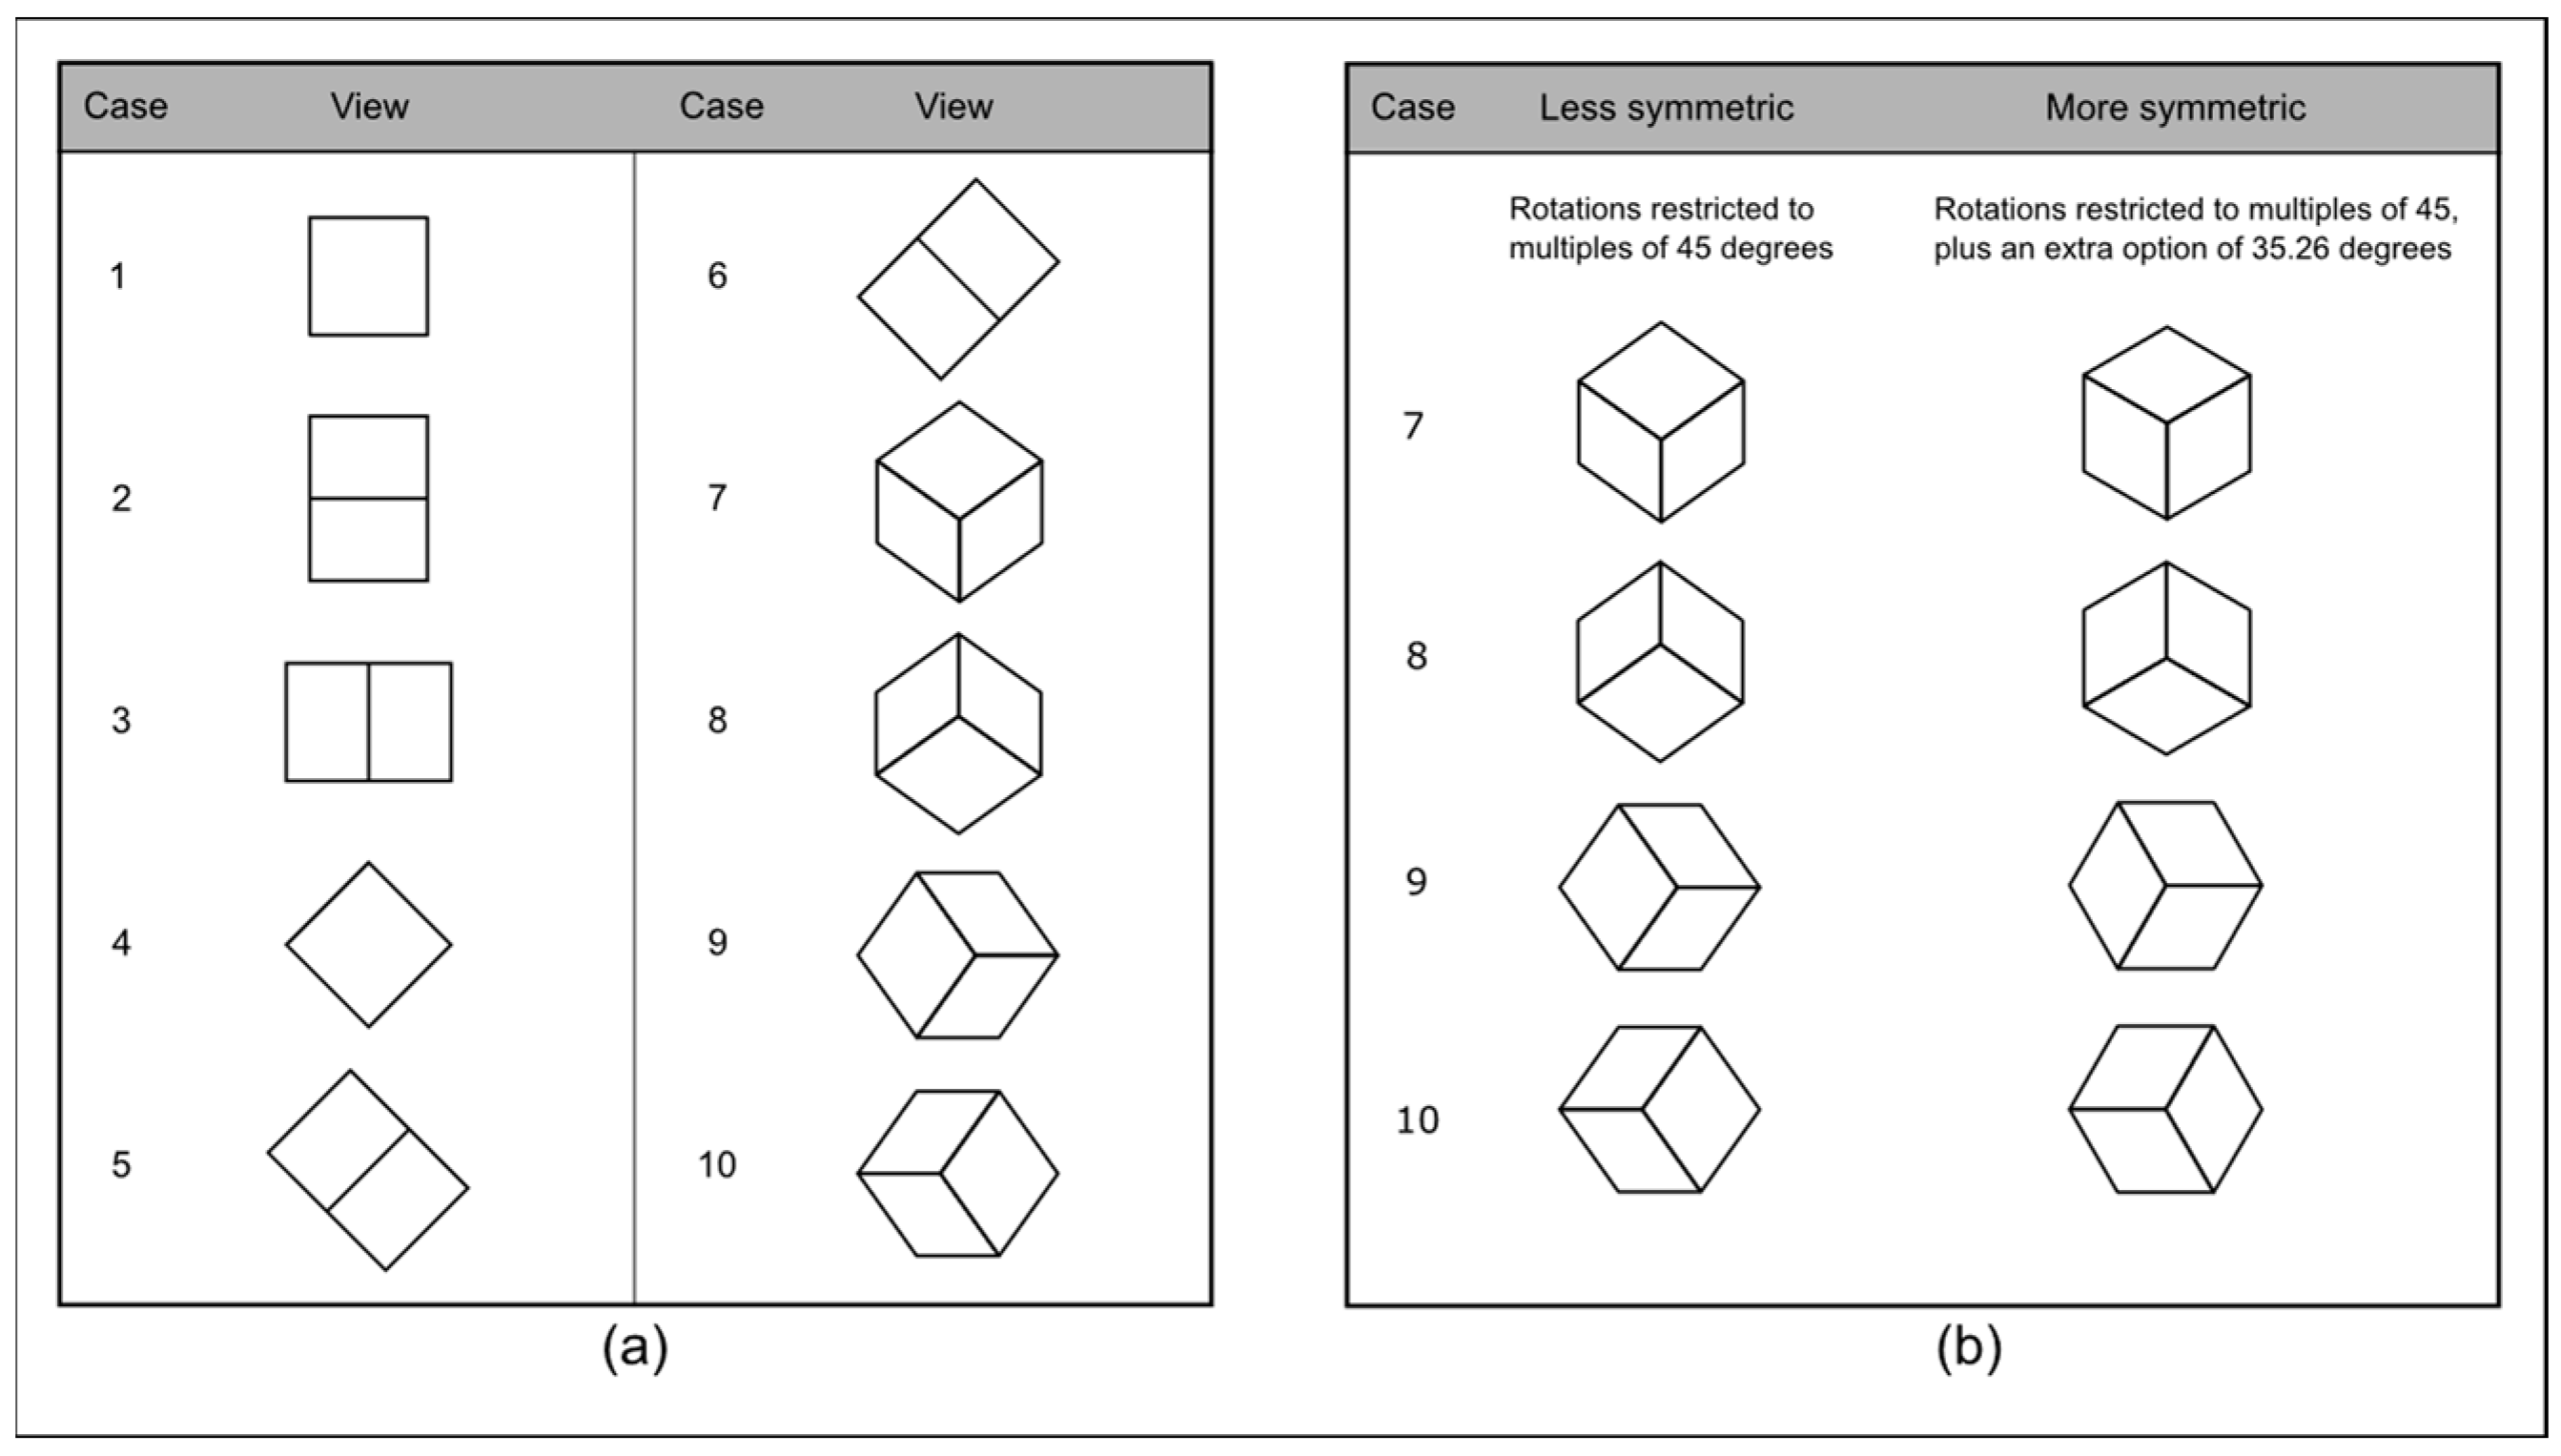
In the rest of this work, the object to be transformed is always a cube, which has the advantage of being a fully symmetrical geometric body. An additional aspect of the intrinsic complexity of the scenarios utilized in learning exercises is the variety of states (views) that an object can take when transformed. The degree of symmetry should be appropriate to infer the rotations involved from the initial state intuitively.
Figure 6 shows how some views have an easy-to-understand symmetry while others do not.
In the specific case of view 4, unlike the other three, it does not have an intuitive symmetry because faces appear in different sizes, the rotation angles are difficult to quantify, and the edges do not appear aligned to any of the principal axes. The next step in our work is to ensure that such asymmetric views are not a part of a learning exercise. In
Figure 6, frontal views included a small area with the colors of adjacent faces; otherwise, the same view might have multiple interpretations. Unfortunately, the restriction of using only multiples of 45° in any rotation has two drawbacks. Firstly, not all views considered symmetrical in
Figure 6 can be generated under those conditions (e.g., view 3). Secondly, some views that we decided to consider “asymmetrical” may result from the composition of 45° rotations (e.g., view 4).
Figure 7a shows the chosen views in this work.
Figure 7b compares cases 7, 8, 9, and 10, showing a slight symmetry loss that arises by avoiding the 35.26° rotations required by some perfectly symmetrical views, such as view 3 in
Figure 6.
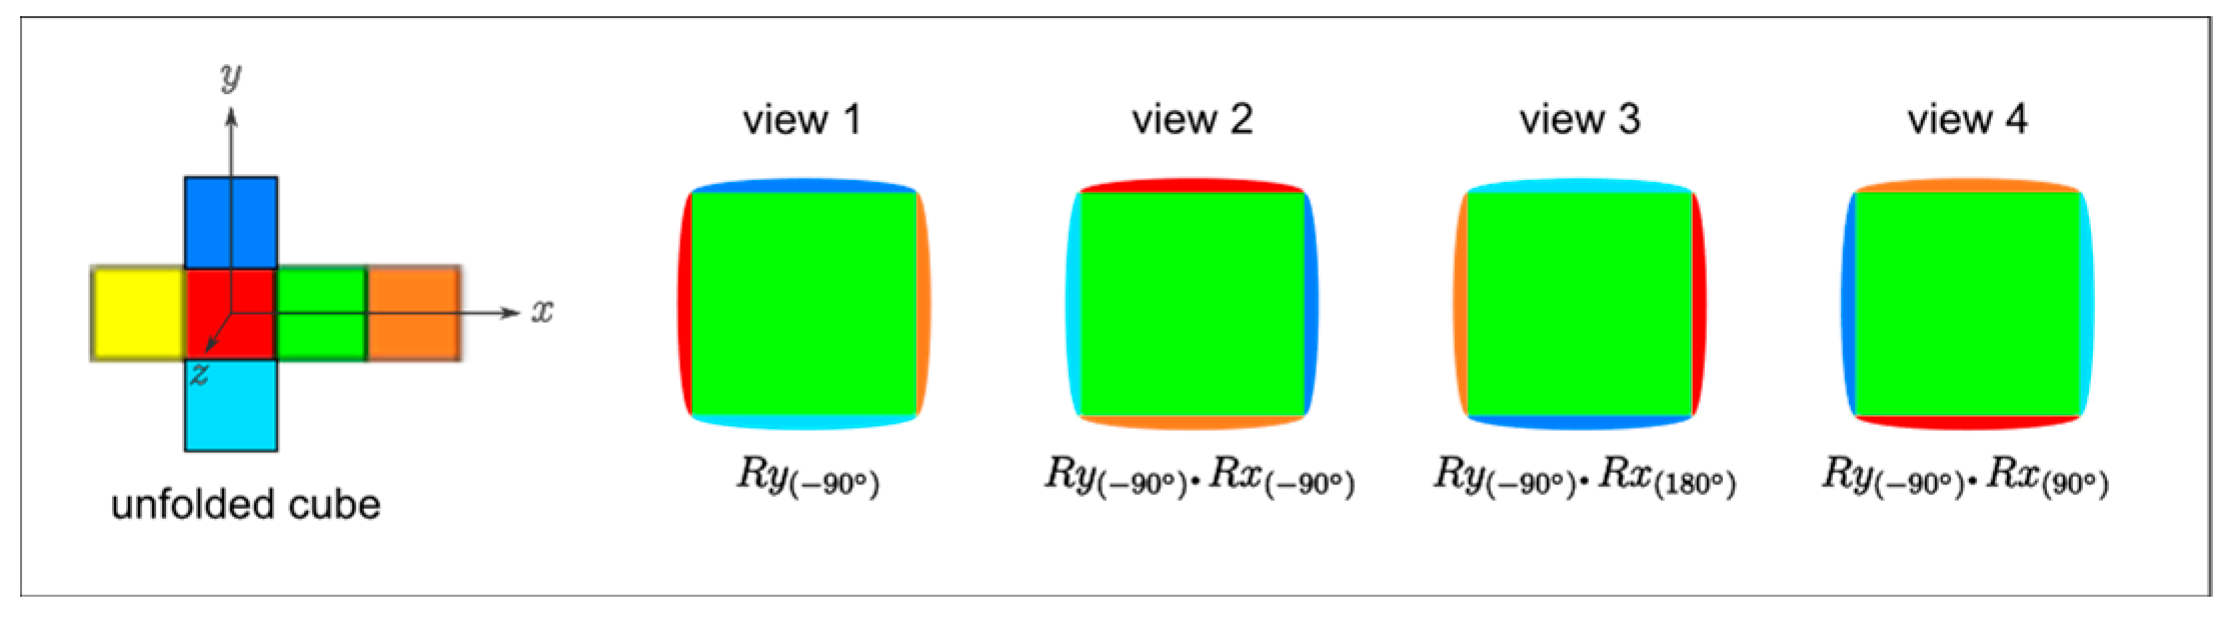
3.2. States Available for the Generation of Learning Exercises
With the predefined restrictions for transformations (
Section 3.1.2) and symmetry (
Section 3.1.3), we are now able to quantify the number of states (views) available for the learning exercises. There are 24 possible states for each symmetry case (see all 10 cases in
Figure 7a) by considering the cube and colors shown in
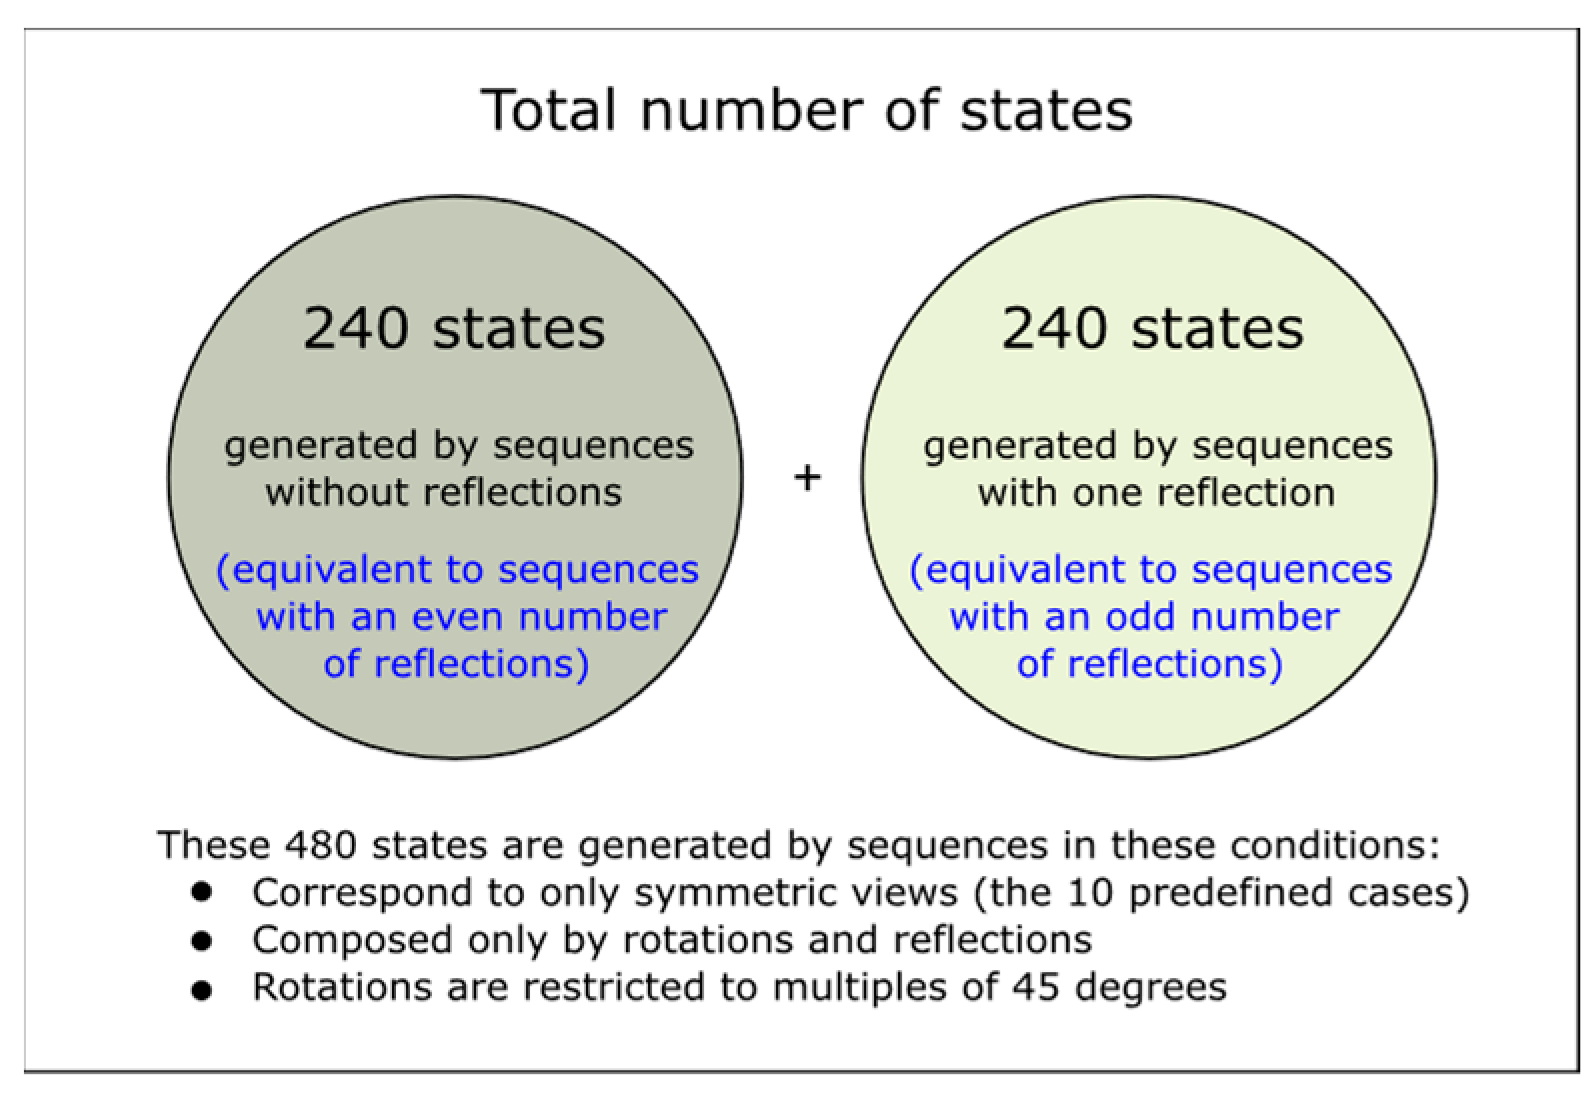
Figure 8. These 24 states result from the different orientations of how faces can appear in a view. For example, four possible views have a green front face (symmetry case 1). Similar views are possible when other faces are oriented to the front. Under these considerations, there are 240 different states (24 states/case × 10 cases).
The presence of reflections doubles the number of states per case. It becomes 480 possible states (48 states/case × 10 cases). The 480 possible states are divided into two mutually exclusive sets;
Figure 9 summarizes their characteristics. Although the number of states is finite (480), an infinite number of sequences generate those states.
Section 3.3 will address converting an arbitrary sequence that generates one of these 480 states into the extended TRS pattern used to characterize the learning exercises. Additional states can be generated from these 480 base states by allowing scales and translations in a sequence.
Even with all the proposed restrictions in place (object, views, and parameters), the number of states is broad enough (see
Section 3.4.1) to generate learning exercises of varying degrees of complexity that allow the student to understand the subject of GTs properly.
3.3. Automatic Exercises Generation and Solutions Feedback
The proposed exercises aim at two objectives: (1) facilitate the automatic generation of exercises by a random selection of parameters while keeping in control of complexity, and (2) provide automatic feedback about the solution’s quality. In the following, we define the methods to achieve both objectives.
3.3.1. Automated Generation of Exercises with a Controlled Degree of Complexity
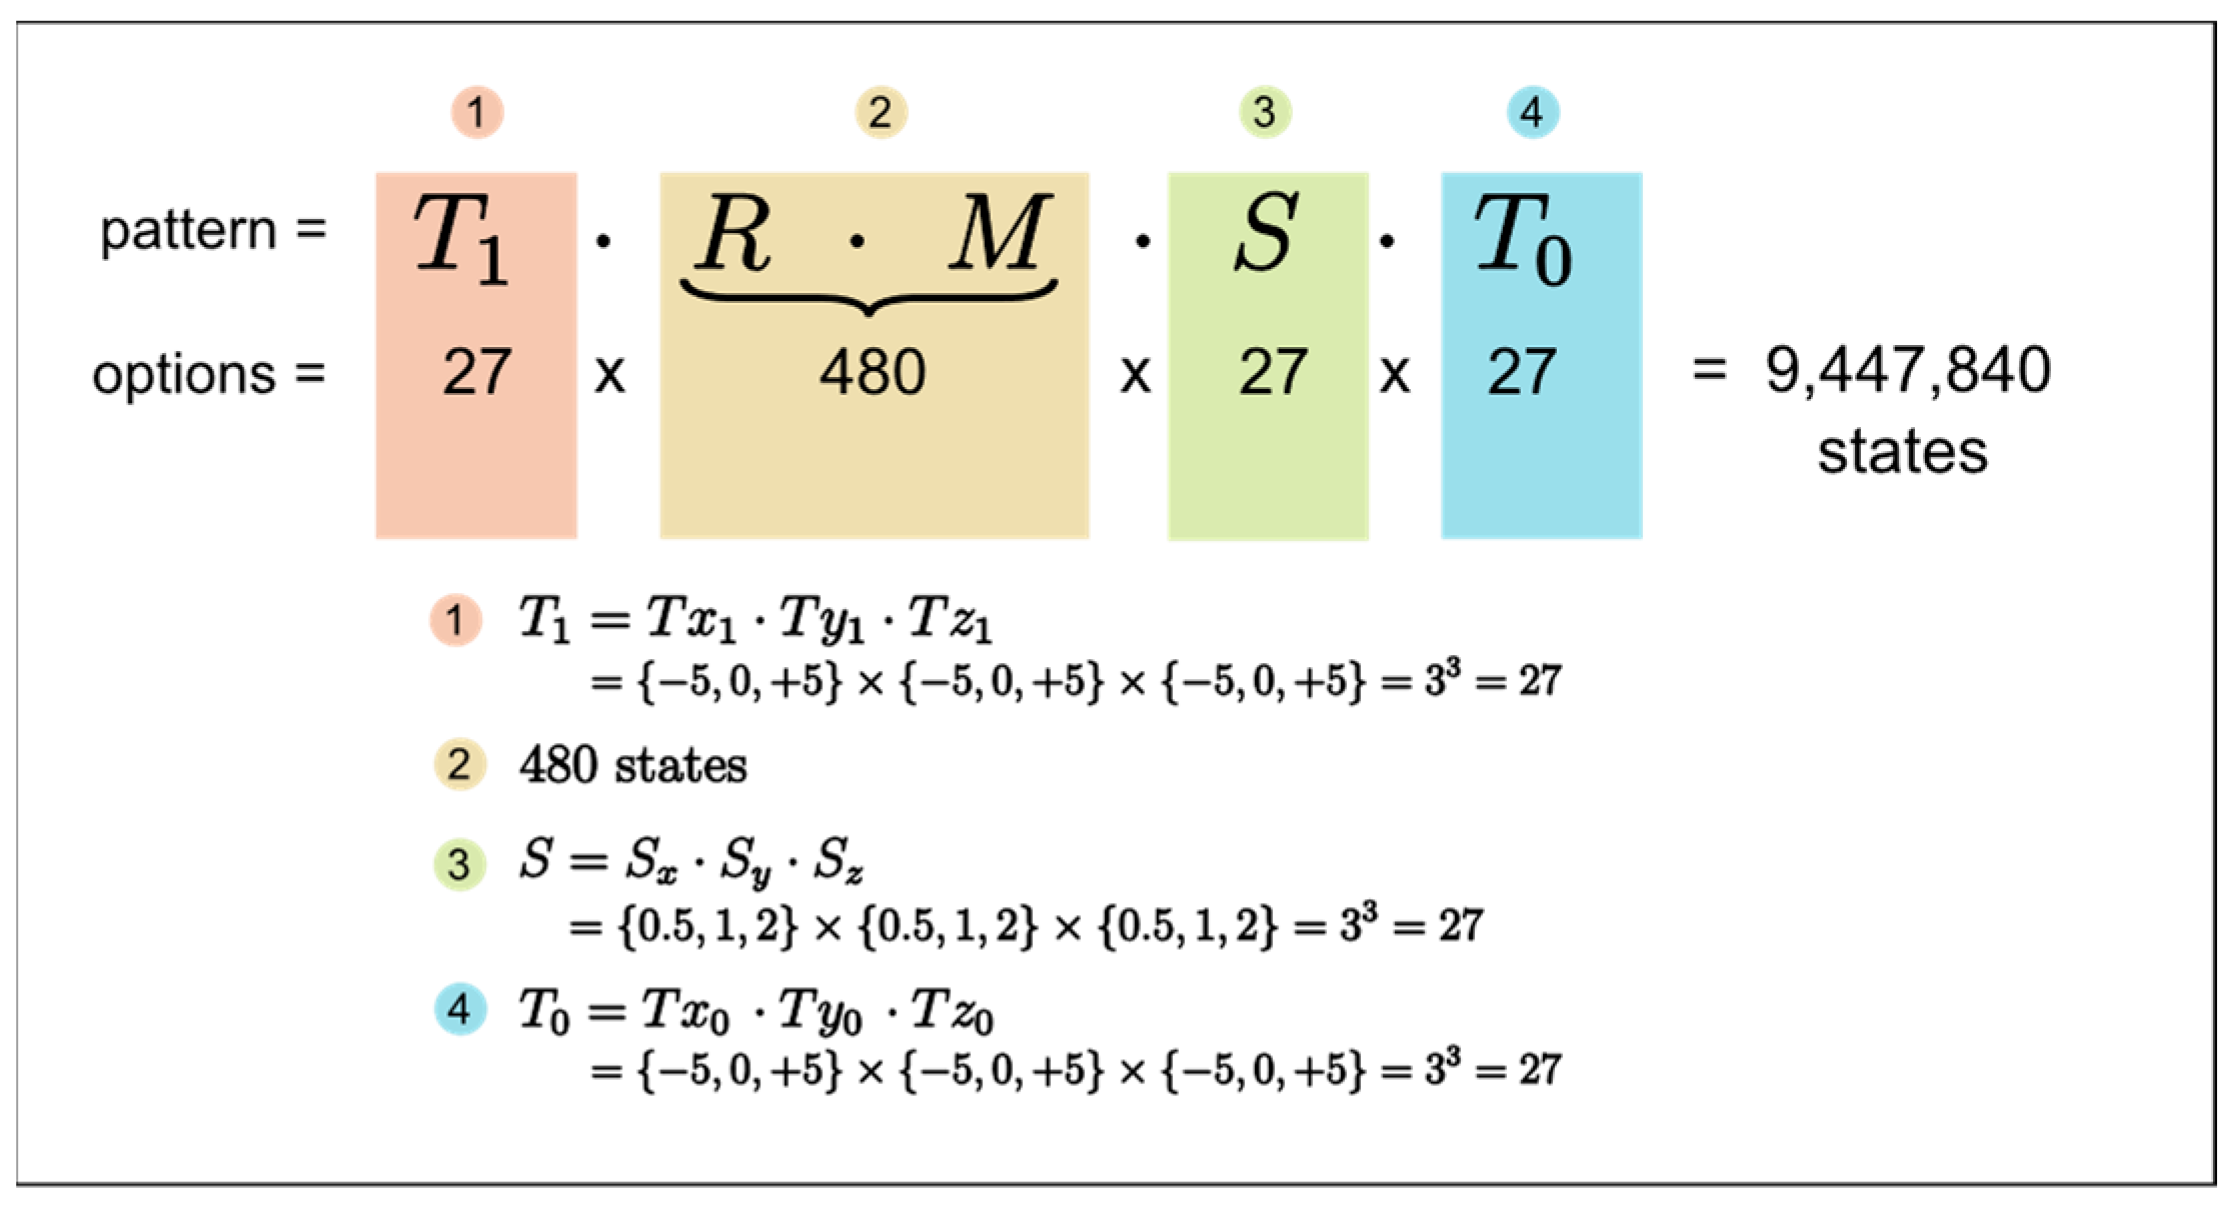
With the extended TRS pattern chosen to represent solutions, different learning exercises can be automatically generated by replacing each element in the pattern with random values for the predefined cases. According to
Table 1 (
Section 3.1.2), 36 possible transformations are being considered, which once distributed in the pattern gives the possibilities shown in
Figure 10, that is, 9,447,840 different states (or exercises).
One advantage of the pattern is that it eases the complexity selection by including or excluding the pattern components. For example, the simplest complexity level may include only translations. The next level may require rotations in multiples of 90°. Then, rotations could be extended to multiples of 45°. Upper complexity levels may require rotations and reflections simultaneously. Scales can increase complexity if combined with rotations and reflections, or they can be an intermediate level if required alone. Even more complex sequences can involve all the pattern components in a single exercise.
3.3.2. Automatic Feedback on Solutions in Real-Time
When a student is solving an exercise, it is desirable to have a feedback mechanism about how “best” a solution is according to the exercise description. A student should know if there is a different, more straightforward way of expressing the solution. This feedback can be given in real-time while the solution is still under construction, informing whether current steps look good (or bad) or if unnecessary and redundant steps are detected in the sequence. Two methods are necessary to automate the feedback. First, a method to detect whether any two solutions are equivalent; this lets a student know whether a solution is correct or not, comparing it against the exercise’s “preferred” solution. Second, a method to take an arbitrary sequence and convert it into one equivalent and compliant with the extended TRS pattern, allowing a systematic sequences analysis.
3.4. Software Tool 1: Geometric Transformations Visualizer
A software tool, the Geometric Transformations Visualizer (GTV), implemented the proposed model of exercises and was developed using the C# language. In GTV, the object transformed is a cube with its faces displayed in different colors to ease the visual recognition of position and orientation in the 3D space. In addition, faces are slightly curved to provide visual clues and avoid ambiguity in interpreting some views. There are two modes of using GTV: (1) The software generates exercises with a chosen complexity level, and students try to solve them; the software confirms when a solution is reached or provides the solution if the user fails. (2) GTV also provides students with a free experimentation environment where no exercises are generated. There is the freedom to add transformations to the sequence to visualize the cube’s individual and accumulated effects. Real-time feedback is provided as soon as a step is added. GTV has the 240 views (without reflections) discussed in
Section 3.2 and their corresponding composite matrices, already precalculated and stored in an SQLite database. Another 915 equivalent combinations were also included in the database to speed up the analysis. In the case of reflections, their presence is analytically processed; for this reason, the complementary set of 240 views (with reflections) is not embedded in the database.
3.4.1. System Architecture
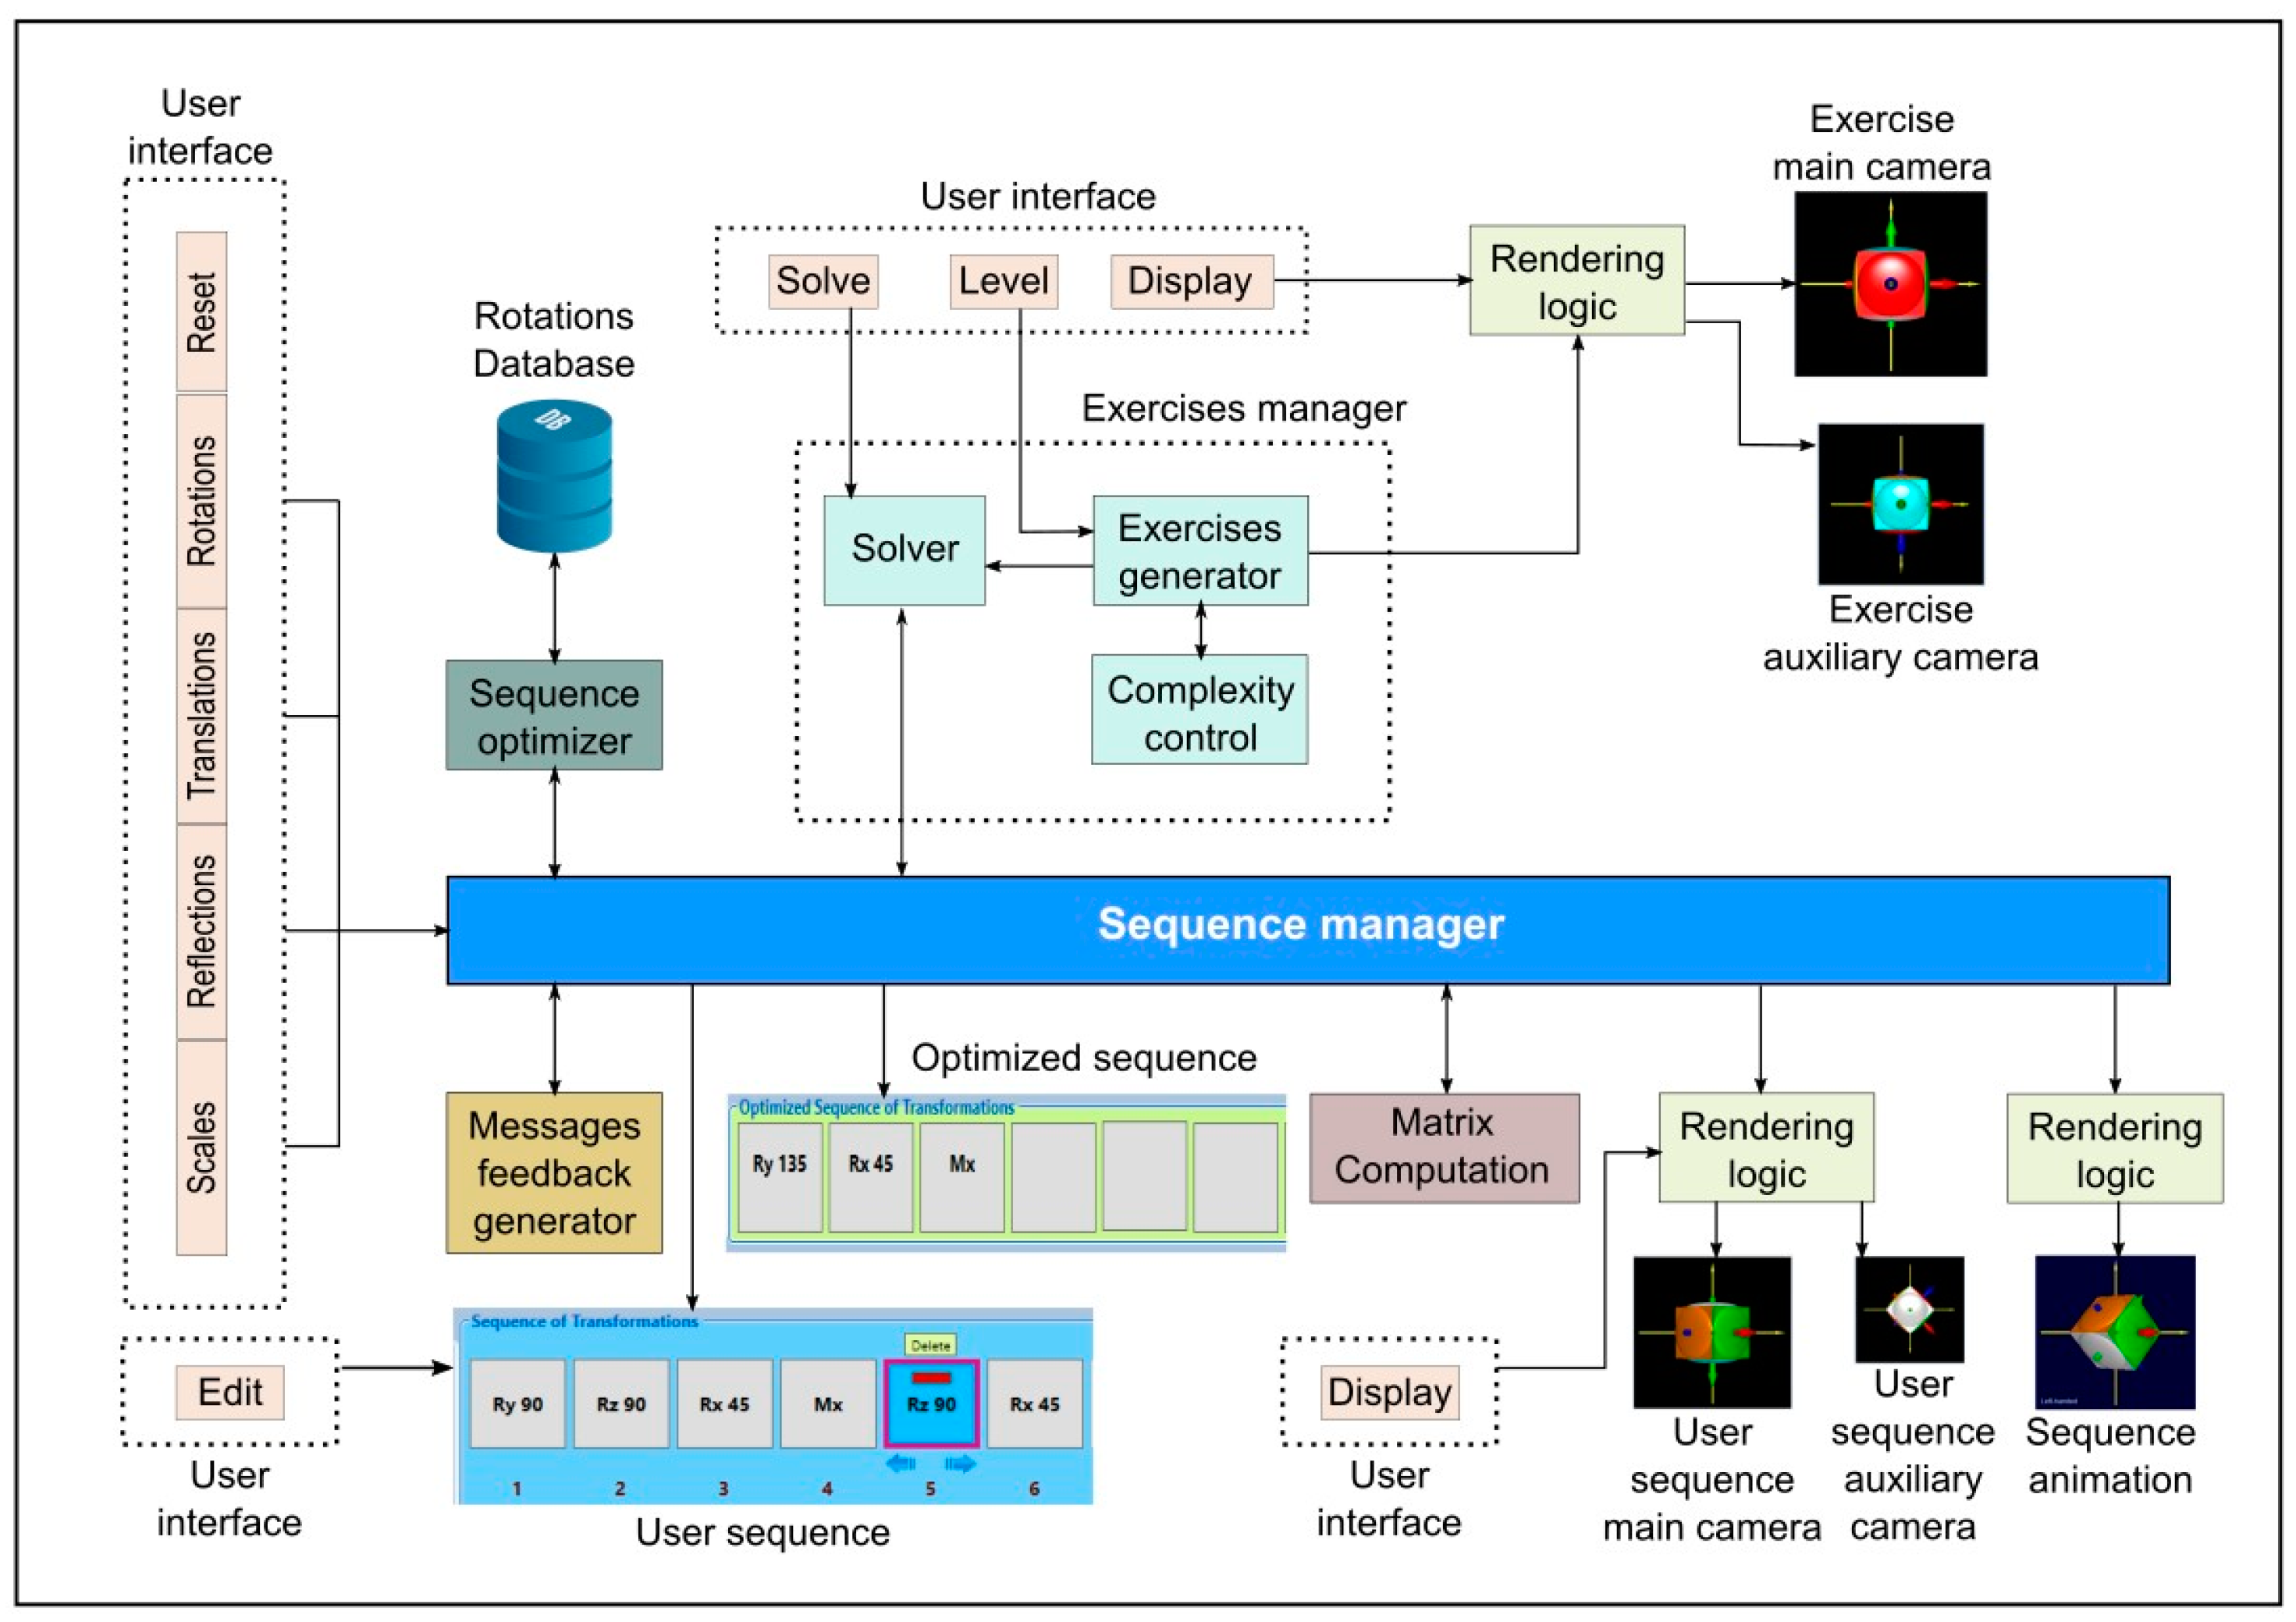
The system architecture is depicted in
Figure 11. There is a central element in the system, the sequence manager, which maintains two sequences, the one given by the user and the one optimized by GTV. Every step added into the sequence is instantly updated, which leads to instant feedback and rendering.
The sequence optimizer is responsible for updating the system sequence after each change in the user sequence. GTV continuously queries the database to ensure that the sequence complies with the predefined symmetrical views. The sequence optimizer also performs an alternative procedure for the non-symmetric views or when the coordinate system loses orthogonality. The feedback message generator analyzes the user sequence offering a series of explanations about sequence compliance with the extended TRS pattern; it also alerts when unnecessary or redundant steps are in the sequence or when axes lose orthogonality. The exercise manager assigns a degree of complexity to an exercise based on the type of transformations required to solve it. Exercises are dynamically created (they are not fixed or precompiled) by assigning random values to the allowed parameters. The exercise manager also coordinates the rendering of the system-suggested solution if the user gives up and requests it; otherwise, it alerts the user when a solution is reached.
3.4.2. GTV Interface
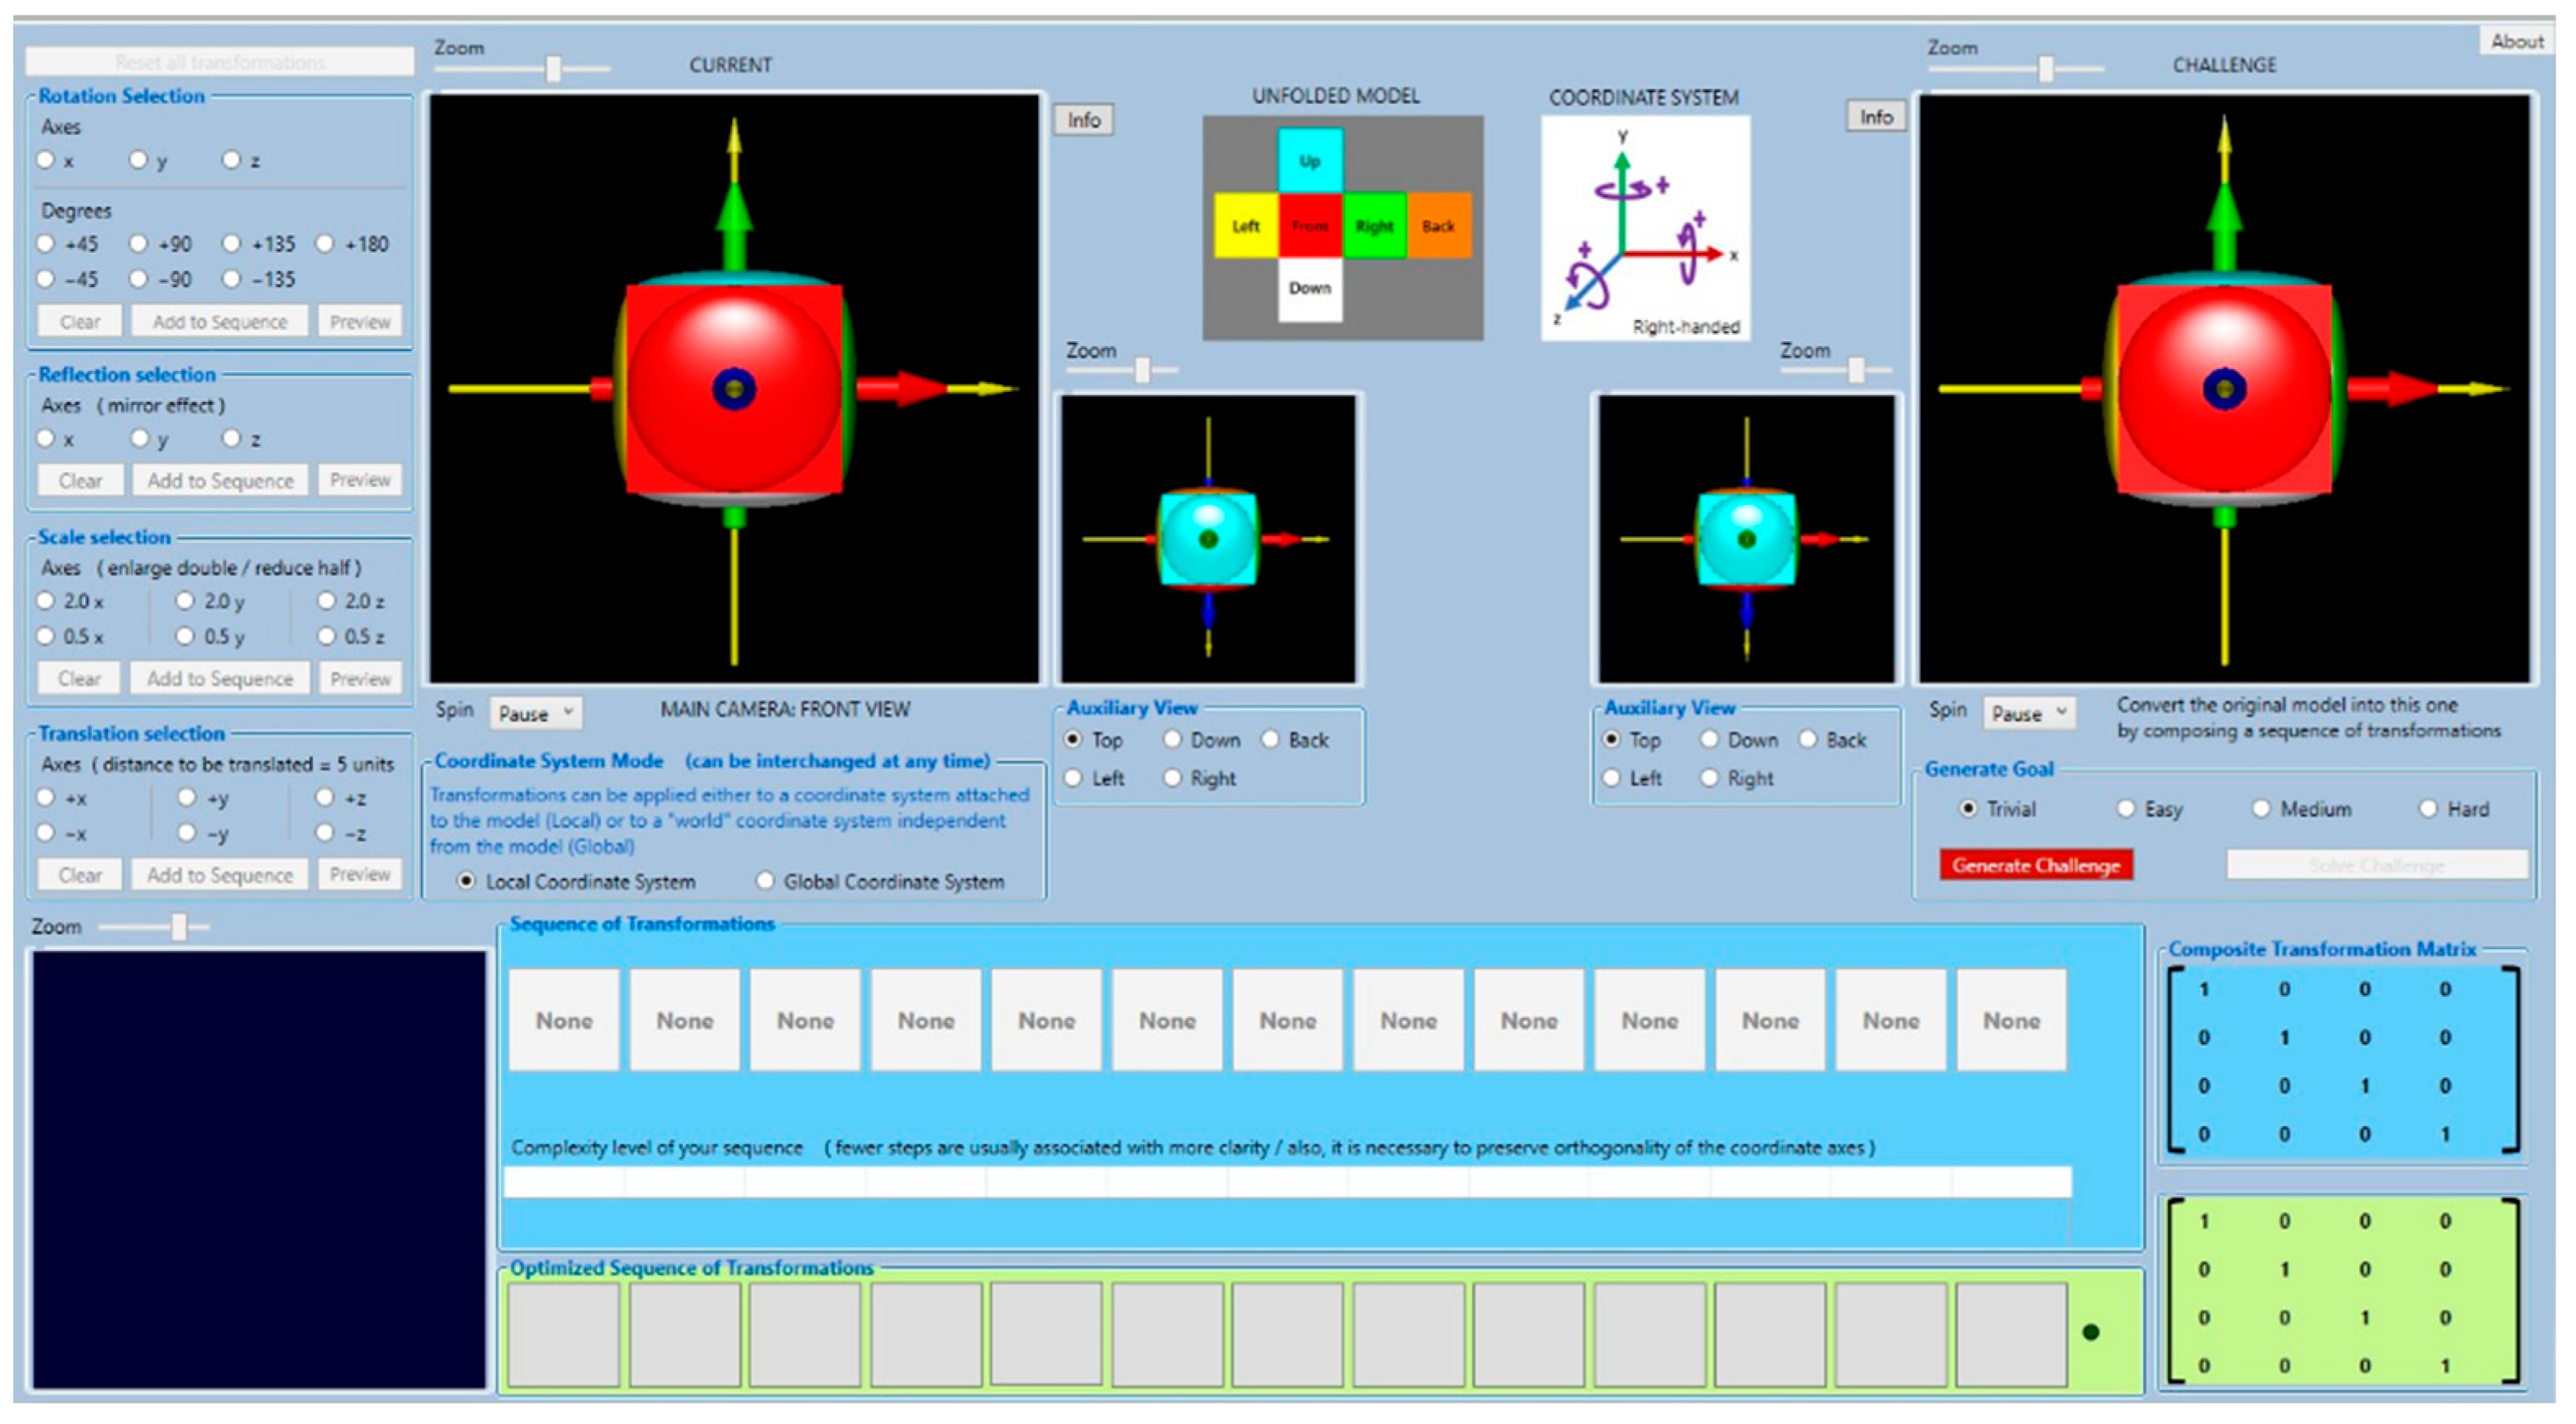
GTV interface (
Figure 12) is divided into the following main areas: (1) Selection of transformations added into the sequence. This selection corresponds precisely to the options described in
Section 3. (2) Rendering area of the cumulative effect of transformations on the object. It includes two renderings, the main view and a customizable auxiliary view. (3) Rendering area for displaying an animation, step by step, with the effect of each transformation in the sequence. (4) Generation of exercises. It includes a rendering area that displays the goal and another area to choose the exercise complexity and launch it. (5) Area for displaying the sequences of transformations. It displays two sequences of matrices, the composed by the user and the automatically generated by the GTV. This area also includes both a region for displaying the feedback messages and a color-coded bar that visually informs the user about the solution’s “quality” from a learning point of view. An extra feature in the interface allows selecting a “local” or “global” mode, which determines how the steps in the sequence are treated, from left to right or from right to left.
3.5. Software Tool 2 (Video Game): Geometric Transformations Cards
The second tool is a cards videogame called GTCards [
31], which was also designed according to the exercises model described in this work and developed in the Unity engine [
32]. This section describes its main interface, game mechanics, difficulty levels, and game elements design.
3.5.1. Main Interface
The game interface presents an object to be transformed and a series of cards in random order that are used to build a solution.
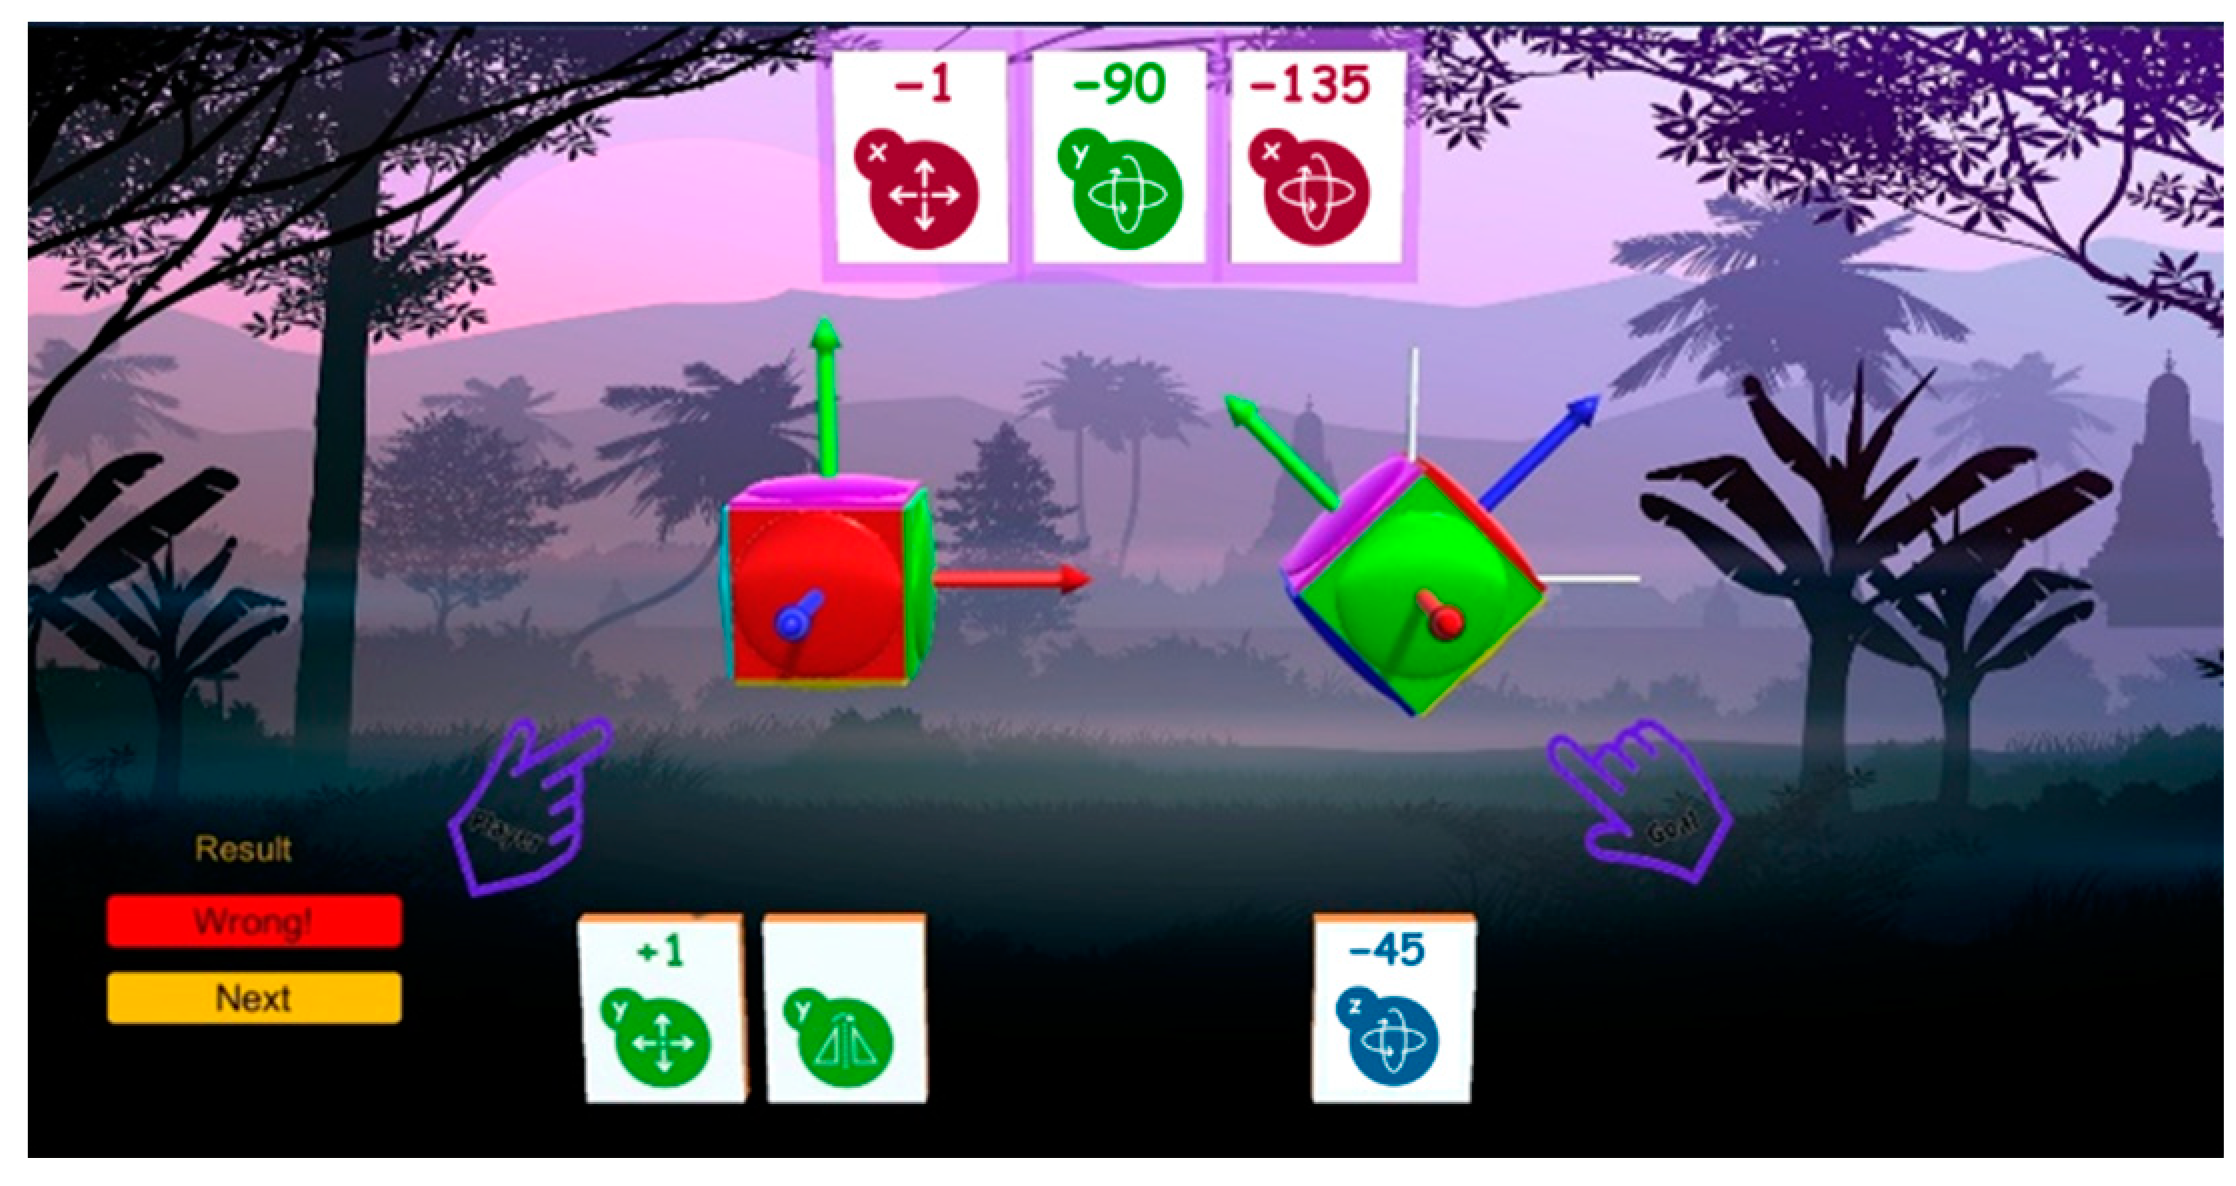
Figure 13 shows the main interface, which is divided into the following main areas:
The goal zone: In this area, a cube is visualized after some random transformations are applied; this is the “goal”. The challenge is to figure out the correct ordering of the cards to build a sequence of steps to transform the object from its initial state to the “goal state”.
The player zone: In this zone, when a new level starts, the cube appears in its initial state (without transformations). When the player drags cards from the deck into the sequence zone, the cube changes its state according to the transformations involved and the ordering of the cards.
The deck: This zone is automatically populated with cards at the beginning of a round (an exercise). The game’s engine automatically chooses the type of cards and their number according to the complexity level at the time. Once the cards appear in the deck, the player can pick them up from this area and drop them into the sequence zone.
The player dynamically decides the cards and their ordering during the round. The sequence is built step by step by moving cards from the deck into the sequence zone. The player can always change a partially built sequence by removing cards from the sequence zone and returning them to the deck.
3.5.2. Visual Clues
The graphic design of the cards provides plenty of visual information regarding the GT associated with a specific card. Some visual clues are embedded in the design to present a cleaner interface with little numerical information displayed. However, hidden information can be consulted through a menu if a goal is not entirely understood. Some examples of the available visual clues are the following: (1) A slight perspective projection highlights scales, mainly in the Z direction; it also helps to better identify translations in this axis. (2) The cube design, which includes a geometric pattern, highlights scales because this pattern looks distorted in their presence. (3) Giving each cube’s face a different color helps recognize the rotations. (4) All transformations (mainly rotations and reflections) are better recognized with the included visualization of the coordinate system, with different colors assigned to each axis.
3.5.3. Game Mechanics
When a round begins, the player must pick up as many cards from the deck zone as card slots appear in the sequence zone. It means that the player knows in advance how many cards compose the solution but does not know either which ones or their ordering. The player fills slots by dragging and dropping cards as the solution is being built step by step. When all the slots are occupied, the sequence is complete, and its animation is started by playing step by step the cumulative effect on the cube of the transformations depicted in the cards, from left to right. At the same time, the game’s engine evaluates the solution, and the round ends with a message telling the player whether the solution was correct or not. When the solution is correct, the score is updated, and a new goal (exercise) of a similar or higher degree of difficulty is proposed; otherwise, the previous exercise is reloaded in its initial conditions with exactly the same options (cards) in the deck zone.
To favor active thinking from the player when solving the challenges, the score is lowered with each successive attempt to solve the same exercise. In this way, the highest score corresponds to the first attempt. This strategy motivates the player to actively think about the solution and intends to avoid the “minimal effort” of randomly choosing cards just to fill the sequence slots and seeing what happens (correct or not), which would have a minimal learning outcome.
In addition to the aforementioned policies, the elapsed time when solving an exercise is also taken into account for both scoring and placing a time limit to complete the solution. This pressure element is configured with caution (neither a significant reduction in score nor a much limited time) to avoid the player’s random solutions just to escape penalizations.
The game’s engine provides diverse levels of difficulty that can be gradually unlocked, from easier to harder. Although the levels of difficulty are predefined, the generation of exercises is performed by randomly assigning transformations into the extended TRS pattern. This feature makes much improbable the repetition of exercises during long periods of using the game.
3.5.4. Difficulty Levels
The proposed mechanics allows a flexible adjustment in the exercise’s difficulty by configuring some elements, such as
The solution has a predefined number of slots, and the deck zone has a predefined number of cards. The arithmetic difference of these numbers is associated with the degree of difficulty. For example, there are only 6 permutations if the solution zone has three slots and the deck has three cards. Instead, there are 720 permutations if the sequence has three slots and the deck has ten cards. Each permutation represents a candidate solution (either correct or incorrect); that is, having a bigger number of options is associated with a greater overall exercise complexity.
The complexity of a solution is directly related to its involved transformations. Lower complexities, for example, result after applying few (maybe only one) and easily perceived transformations, such as translations or very simple rotations. Instead, higher complexities arise by mixing scales, reflections, and rotations, in a specific order. Even with the same type of transformation, different degrees of difficulty can be defined. For example, rotations of 90 degrees are more easily perceived than rotations of 45 degrees.
As discussed earlier, limiting the available time to finish a problem impacts its difficulty because decisions need to be made faster. However, in this proposal, this factor is considered optional due to its opposition, to some extent, to the main goal of the serious game (learning). It is preferable that students carefully analyze and provide a reasoned solution instead of acting on impulse just to avoid the time expiration.
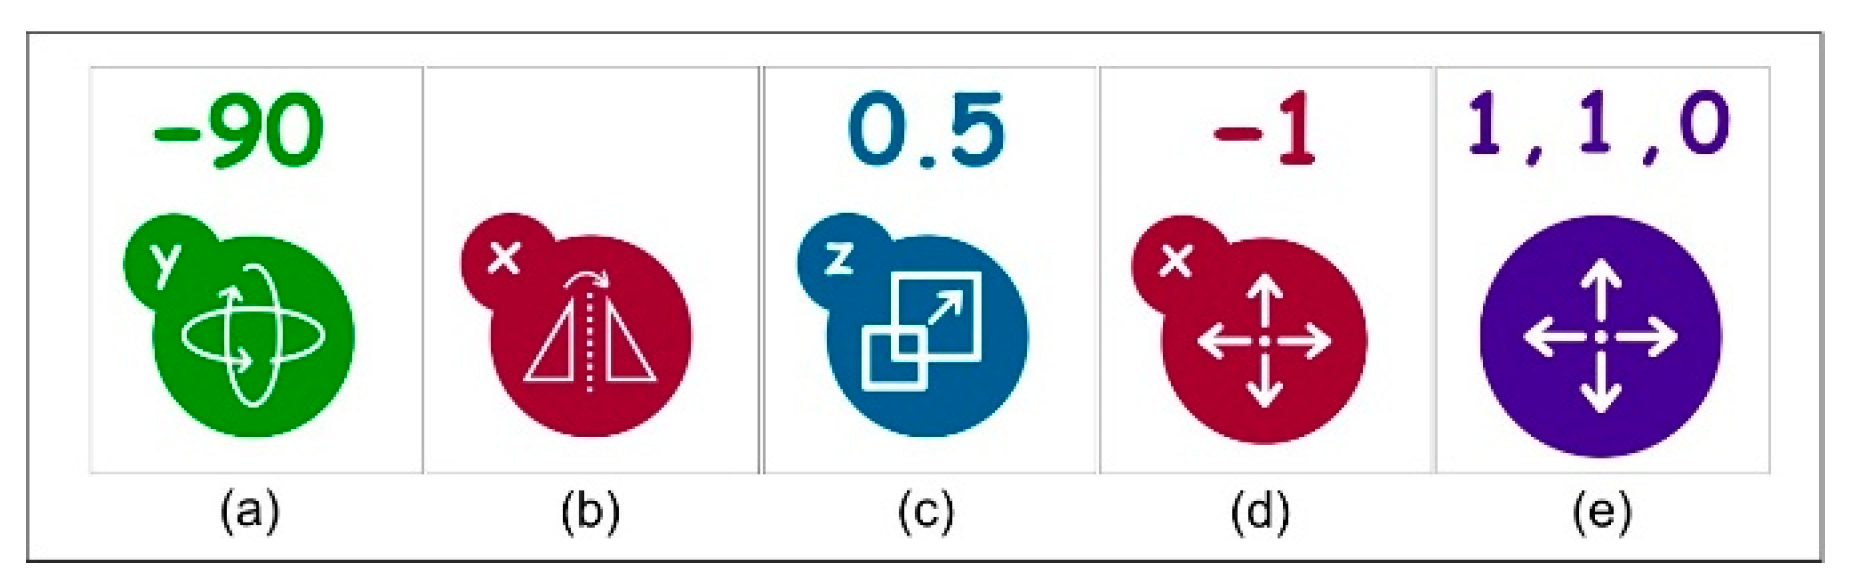
3.5.5. Cards Design
As part of the visual clues, that is, favoring the visual information, the cards’ design (see
Figure 14) has intuitive icons that suggest its associated transformations, similar to those found in design software and other applications. Colors also have specific meanings, for example, red is associated with transformations involving axis X, green with axis Y, and blue with axis Z. Purple is a special case indicating that the card involves more than one axis at once, that is, simultaneous translations, scales, or reflections. In addition to figures and colors, letters and numbers complement the information. Letters explicitly denote the axes and numbers the degrees, factors, distances, or presence of reflections, depending on the card type.
3.6. The Empirical Test
In this section, we detail the empirical test held with undergraduate students that used the software tools developed in this study (GTVisualizer and GTCards) to support the self-study of GTs. We describe the participants, the research strategy, and the recollection of data.
3.6.1. The Participants
Participants in our study were students from the UACJ enrolled in the Computer Systems Engineering program during the Spring 2022 term. They were in their third year at the university. The CG group was integrated with 15 students enrolled in the Computer Graphics course. The non-CG group was integrated with 19 students enrolled in other courses. The age of students was from 19 to 31 for the CG group and 18 to 26 for the non-CG group. The students’ gender is, in general, heavily biased toward males in the Computer Systems program at the UACJ, so it is consistent with the ratios of 6/19 and 2/15 (females/males) in our experimental (non-CG) and control (CG) groups, respectively. For our experimental group, we wanted to test the tools with students that had no previous knowledge or training in GTs, simulating a real situation where students were studying at home in asynchronous mode. For this reason, we invited students who had never taken the undergraduate CG course offered by the university.
3.6.2. Research Design
We designed our research to be an empirical study (quasi-experiment) to test three different cases, as described as follows:
Case 1: Measure whether the non-CG and CG groups had a similar performance in a test evaluating GTs knowledge (the GTs Test in this study). The test was the same for both groups. We selected an independent t-test to compare whether there was statistical evidence that the mean score obtained in the GTs Test by both groups was significantly different. Regarding the estimation of the effect size, we calculated Cohen’s d for this case.
Case 2: Measure whether the performance solving the exercises generated by the software tools and the performance on the GTs Test were correlated. We selected a bivariate analysis to test the strength of association between the scores obtained by each student in these tasks. This analysis was only performed on the non-CG group (experimental group).
Case 3: Measure whether the study of GTs had an impact on the visual-spatial abilities of students. We selected a paired t-test (pre-test/post-test) to compare the performance of students in the Purdue Spatial Visualization Test (PSVT). The same analysis was independently performed on both the CG and the non-CG groups. The effect size, in this case, was estimated through Cohen’s d for each group.
3.6.3. Recollection of Data
The recollection of data was divided into three stages: (1) recording the students’ scores obtained in the exercises generated by the software tools, (2) the scores obtained in the GTs Test, and (3) the scores obtained in both the pre-test and post-test phases of the PSVT. The first stage was held only for the non-CG group, while the other two stages were for both the CG and non-CG groups. All the recollected data were captured from paper into a worksheet and prepared to be analyzed in the statistical software (PSPP). The effect size was calculated from standard formulas available in the literature [
33]. We describe the recollection of data here:
Scores obtained in exercises generated by the software tool: We held four sessions of two hours each in the Computer Lab for the non-CG group to use the software tools. In the first session, they received twenty minutes of a general introduction to the subject of GTs, just to provide background but without any explanation of the methodology and formal treatment of transformations composition. After the introduction, they spent another ten minutes reviewing and understanding the GTVisualizer interface with the help of the instructor. Students were aware that during the rest of the session, they were not allowed to ask questions or clarify doubts about GTs, neither with fellow students nor with the instructor; their only “teacher” would be the software. For the rest of the session, they explored by themselves the software features, understood the matrices format, created their own sequences compositions, and solved exercises generated by the software. In the other three sessions, students used the second tool, the GTCards game, to try to solve the auto-generated challenges. The conditions of these last sessions were similar to those in the first one, with no communication with other students or the instructor to simulate a real scenario where they were alone at home using the software and learning GTs. At the end of each session, students were provided with a series of exercises that were previously generated by the software tools. All students solved the same exercises in a synchronous manner. Students were provided with answer sheets to record their responses.
Scores obtained in the GTs Test: We wanted to compare the performance of both groups on the subject of GTs by answering a written test. We prepared 20 problems, including eight on general GTs knowledge and 12 about solving a series of “before and after” exercises, similar in structure and complexity to the exercises typically solved in the classroom in the CG course. Due to time constraints, the answers to the “before and after” exercises were of simple selection (given five possible answers) instead of performing calculations to get the transformed vertices, as usually is required in the regular course. We wanted to compare the “normal” learning strategies held in the classroom versus the proposed framework (materialized in the two software tools). Similar performance of students in both groups would suggest that tools are suitable to support the self-study of GTs and would be appropriate to be incorporated as supporting tools in a distance-learning syllabus of CG.
Scores obtained in the PSVT: We applied the PSVT, developed by Guay [
34], as a complementary test. PSTV is a multiple-choice test suitable for individuals 13 or older and has been used in engineering and sciences disciplines for more than 40 years to empirically measure the cognitive ability related to visual-spatial intelligence. The PSVT has been recognized [
35] as a test with empirical reliability and validity evidence. We wanted to learn whether a similar impact on these abilities would be triggered by the “normal” coursework and study materials available for the CG students compared with the new software tools used by the non-CG students. We prepared a multimedia presentation with sixty problems; thirty problems on “rotations” and thirty problems on “views”, as supplied in the PSVT. Each slide in the self-paced animation corresponded to a single problem, and students had a fixed time (40 s) to synchronously solve each problem. The assigned time per problem was set according to the PSVT recommendation of twenty minutes per section.
4. Results
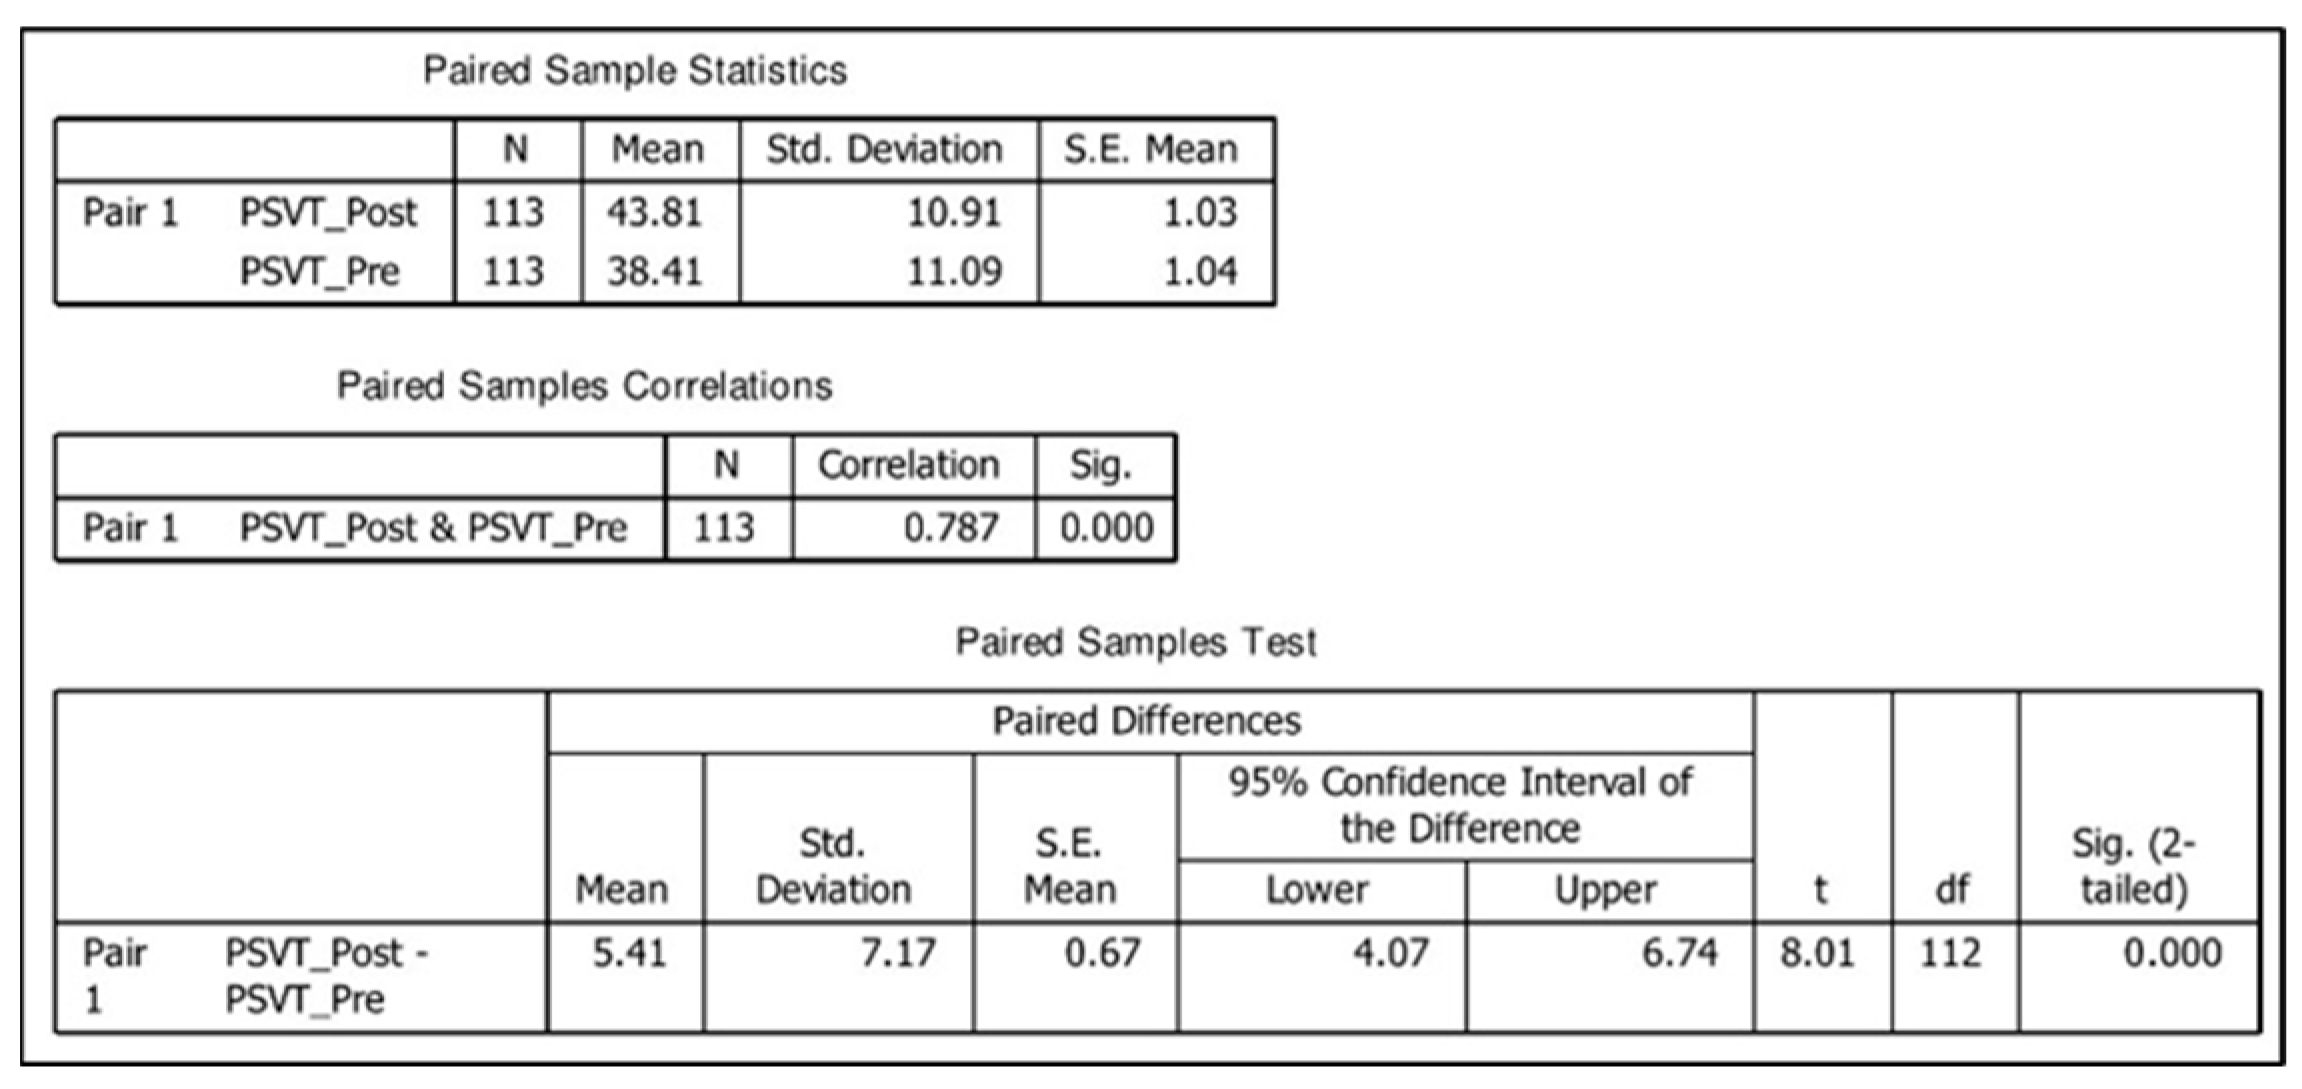
In this section, we detail the empirical test results held with undergraduate students that used the two software tools developed to support the self-learning of GTs. Regarding the PSVT, a paired
t-test was performed on recollected data for both the CG and the non-CG groups. The first group (CG) included PSVT historical records (2017 and 2018) from a previous study [
36], in addition to the present 2022 data, for a total of 113 records. The null hypothesis was that the mean score in the PSVT remained the same in the pre-test (before studying GTs) and the post-test (after studying GTs).
Figure 15 shows that the mean score increased from 38.41 to 43.81 with
t113 = 8.01 and
p < 0.001, so we rejected the null hypothesis. Cohen’s
d (effect size) was calculated as 0.491 from the means and standard deviations in
Figure 15.
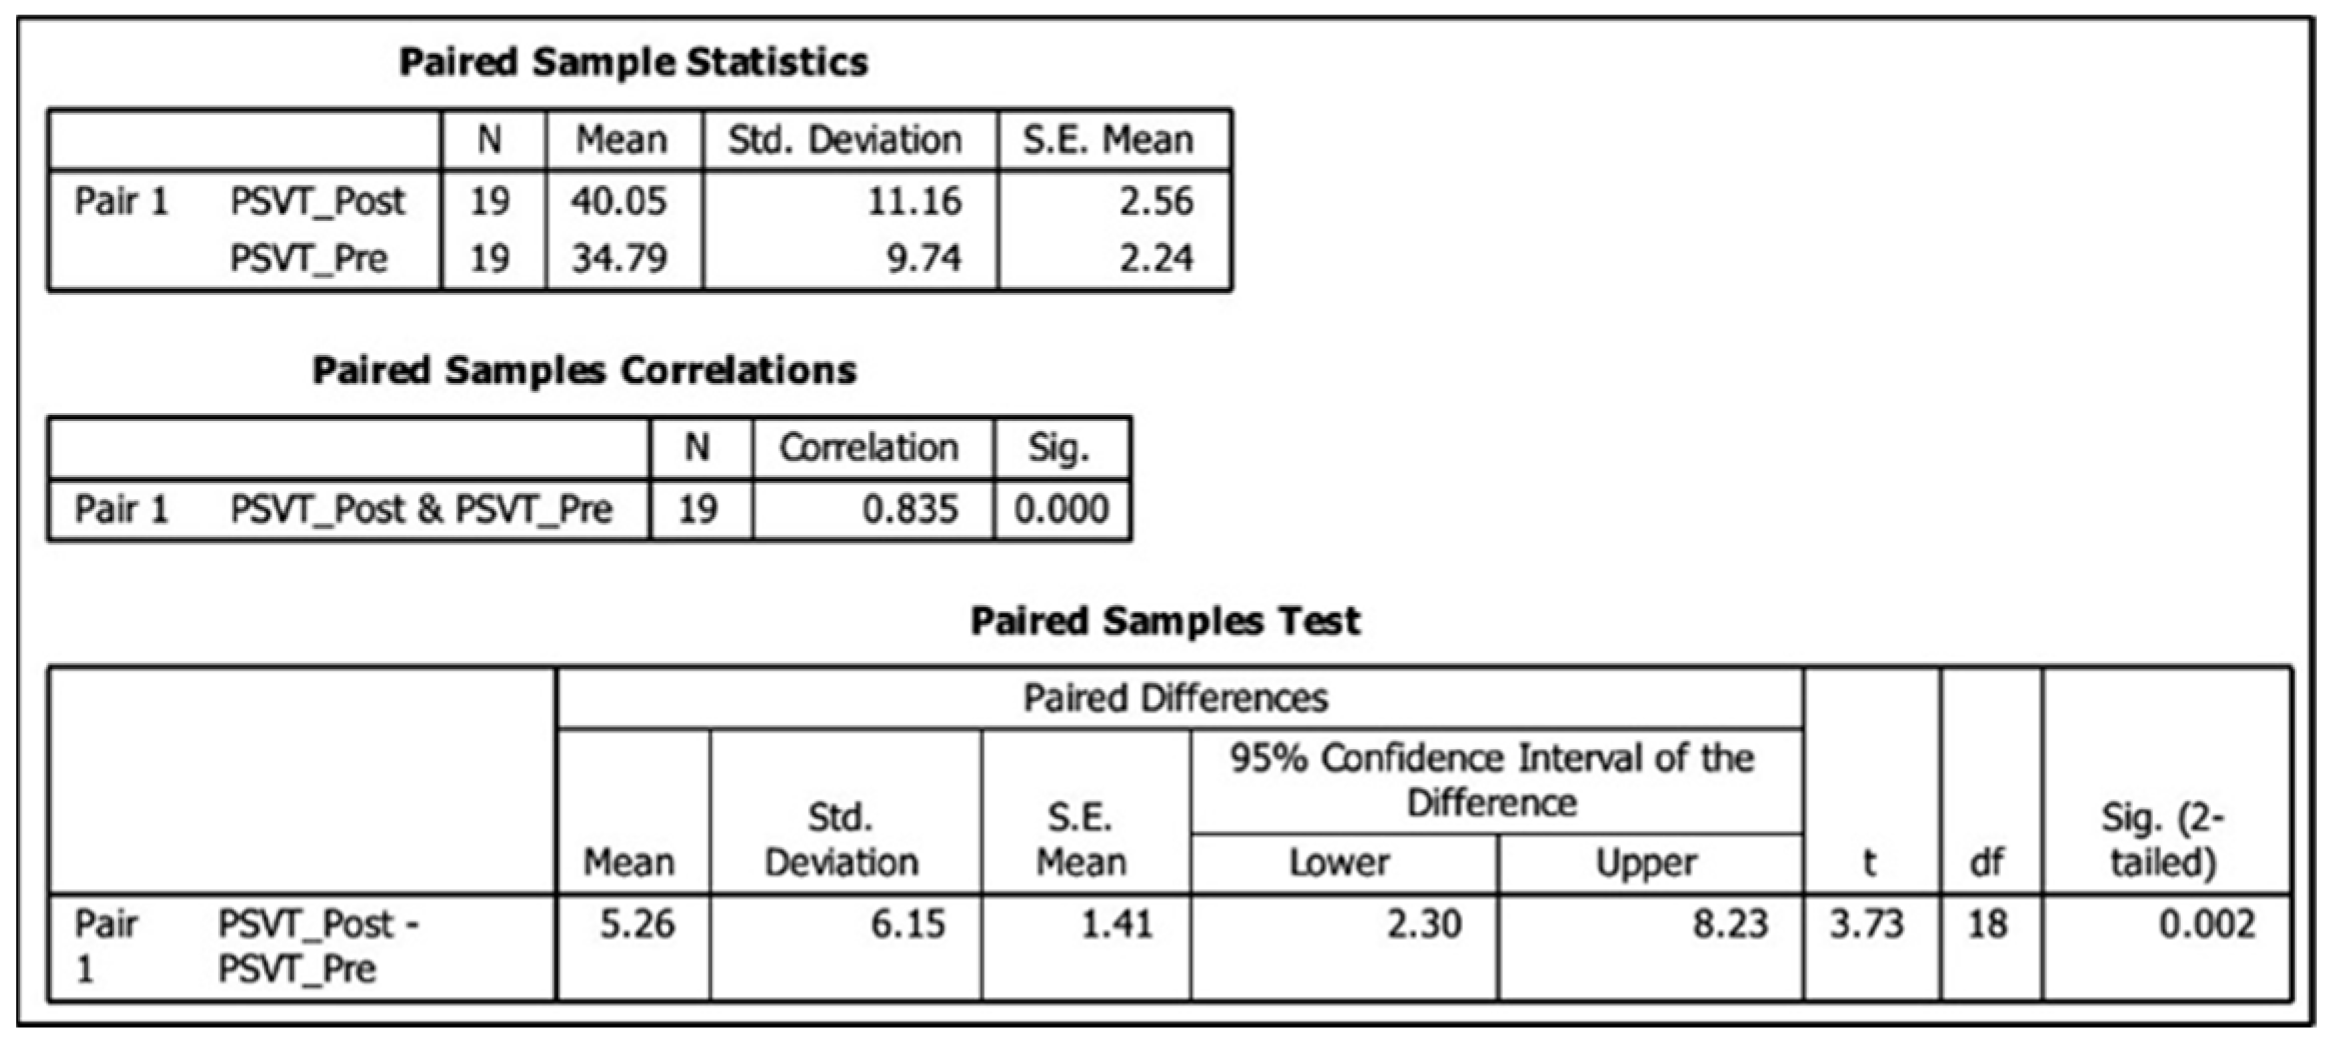
A similar test was performed on the non-CG group before and after intensive sessions using the software tools.
Figure 16 shows the results of the test. In this case, the mean score increased from 34.79 to 40.05 with
t19 = 3.73 and
p < 0.003, so we also rejected the null hypothesis. Cohen’s
d (effect size) was calculated as 0.502 from the means and standard deviations in
Figure 16.
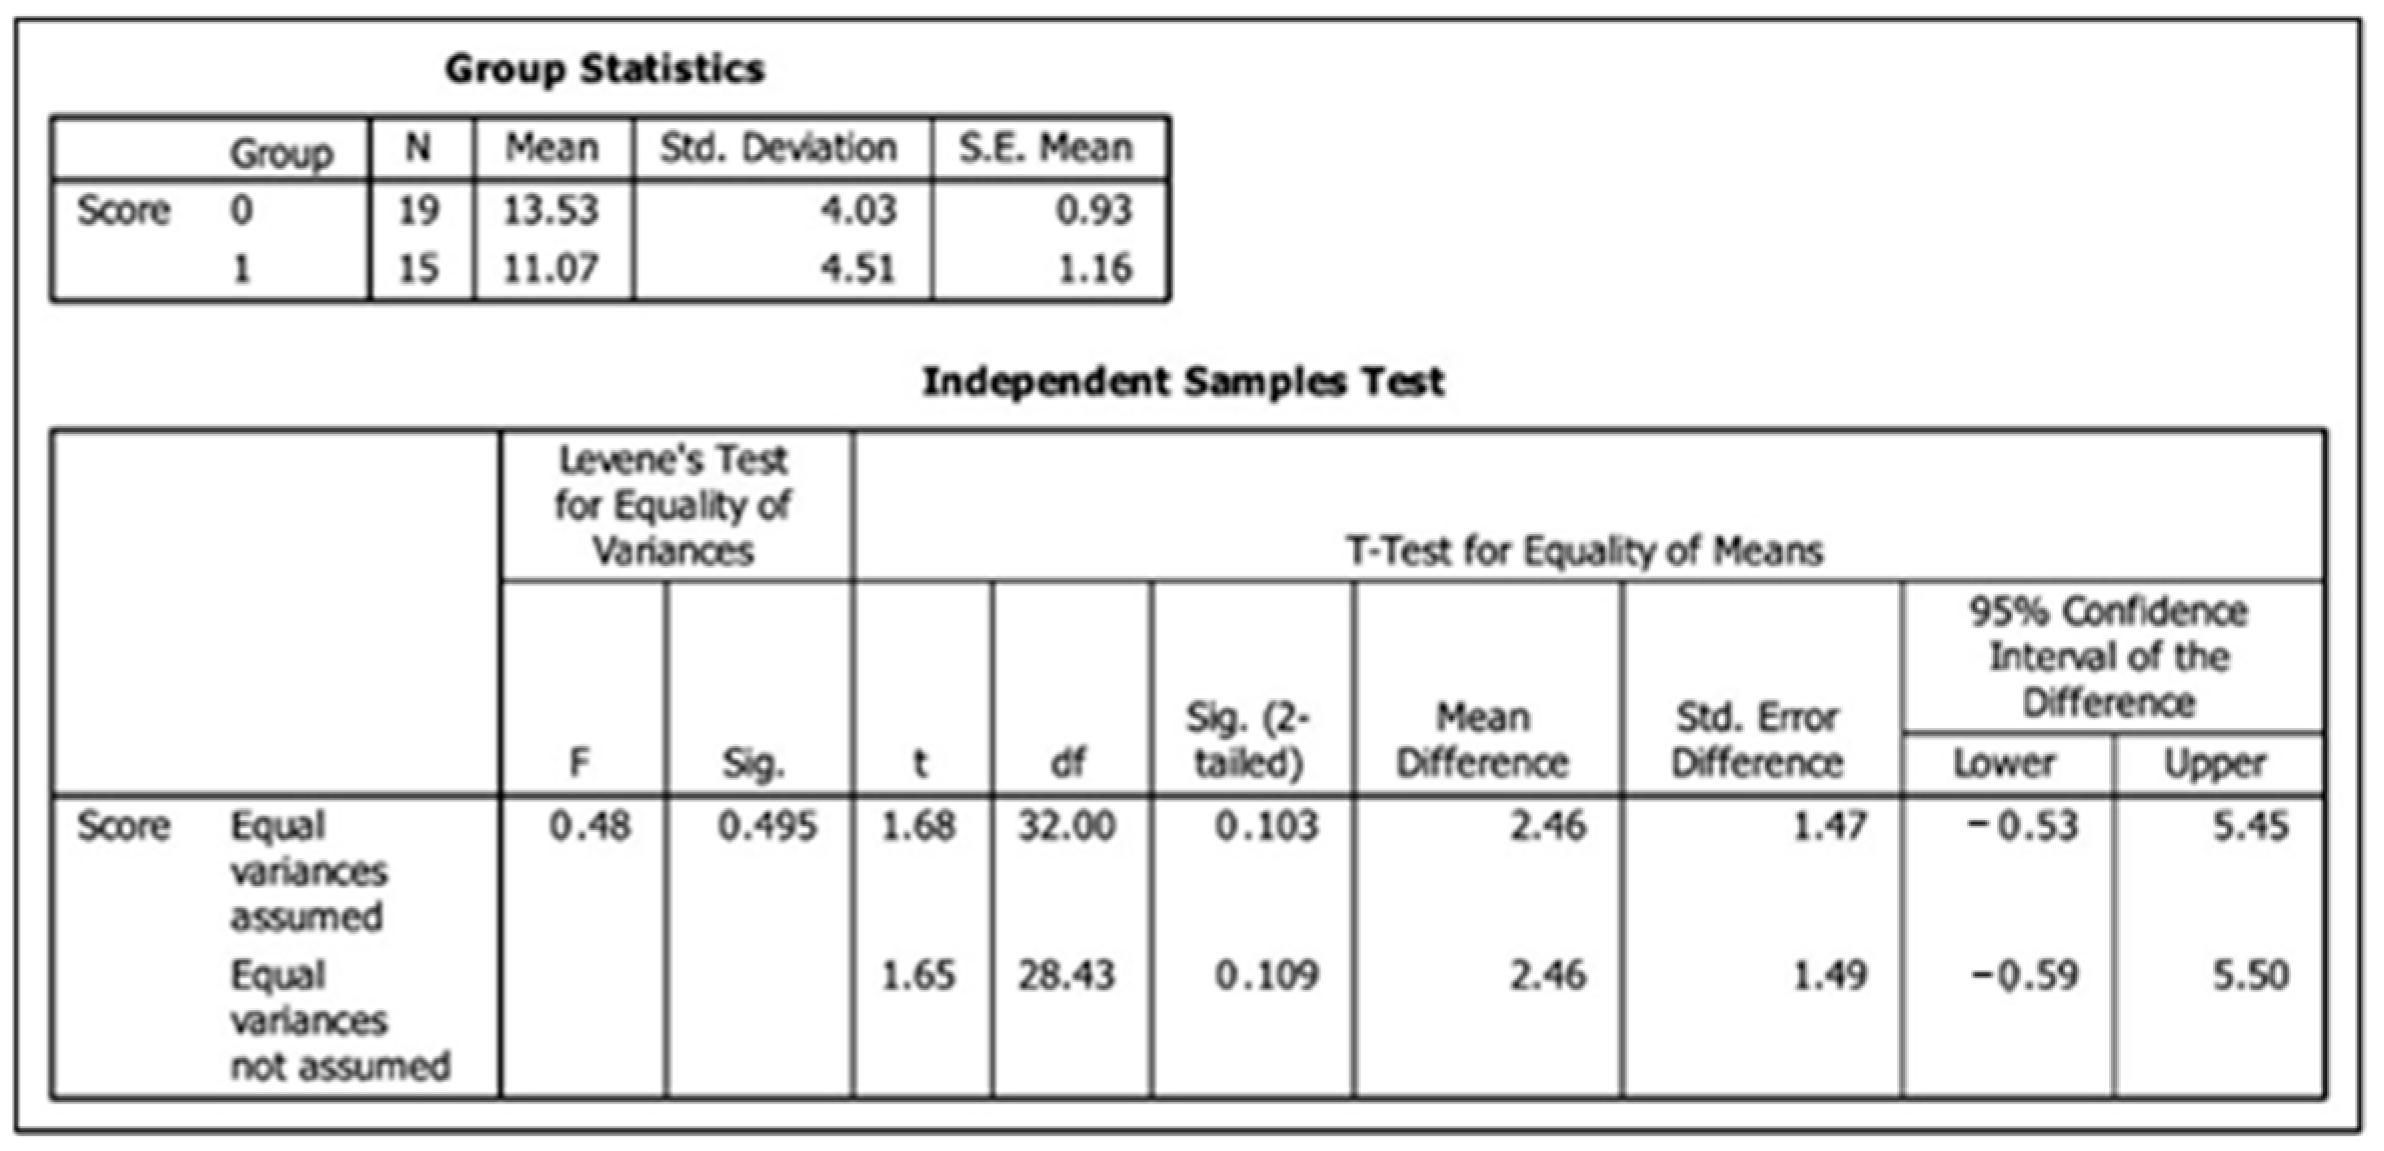
Regarding students’ performance on the GTs Test, we applied it to the CG group and the non-CG group; we performed an independent t-test on data to compare the mean score in both groups to see if there was a significant difference. The null hypothesis was that the mean score in the GTs Test was not significantly different when receiving the “normal” classroom instruction or when only using the software tools.
Figure 17 shows that we can assume equality of variances as it was assessed by Levene’s Test (
p = 0.495), which in turn leads to an interpretation of a no significant difference (
p = 0.103) between the GTs Test’s mean scores in both groups; this implies accepting the null hypothesis. Cohen’s
d (effect size) for this independent t-test was calculated as 0.58 from value t = 1.68 and sample sizes of 19 and 15 in
Figure 17.
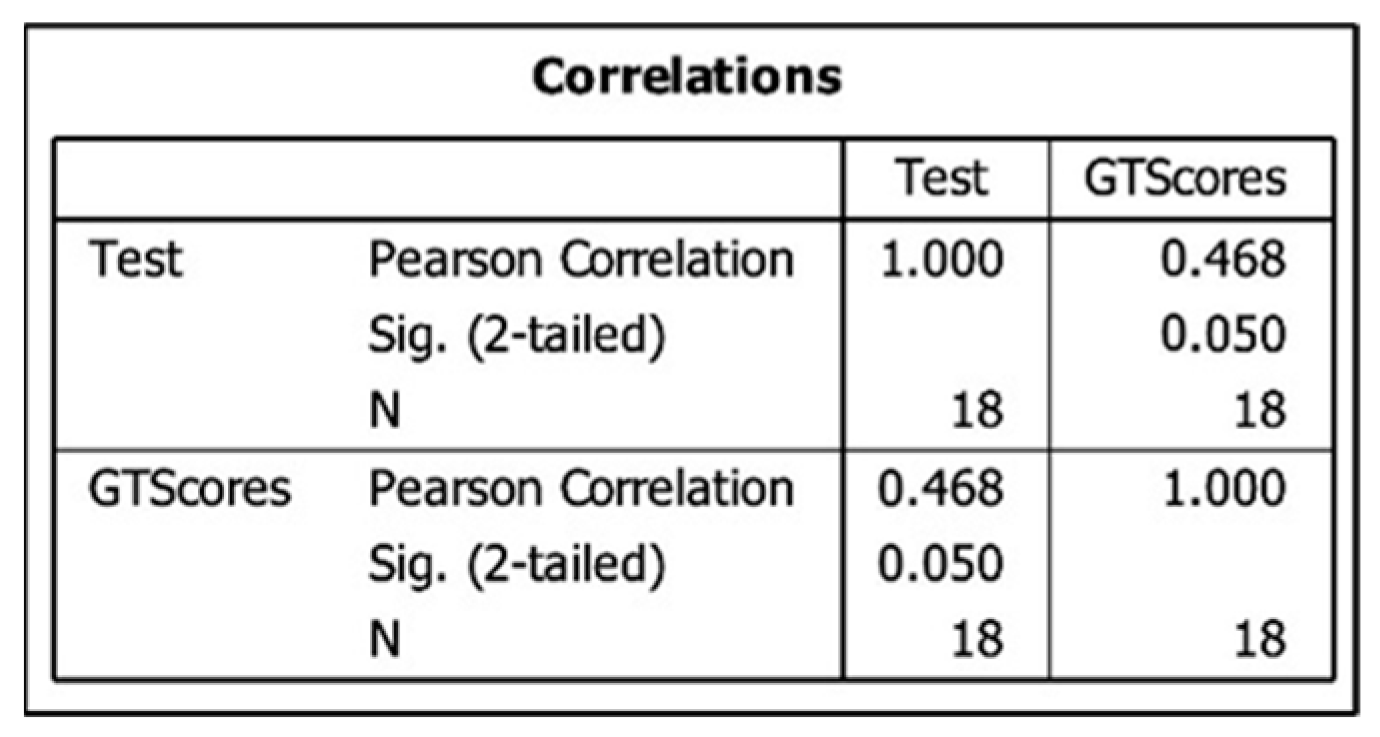
We also performed a bivariate correlation analysis on the scores obtained by the non-CG students in the GTs Test and the scores this group obtained in the software-generated exercises while learning and practicing GTs with the software tools.
Figure 18 shows the results of this analysis, with a moderate positive correlation (0.468) between these scores with a significance of
p = 0.05.
5. Discussion
After developing two educational tools based on the proposed framework and testing them with undergraduate non-CG students, we provide our interpretation of the results in this section. In the particular case of interpreting the effect sizes, we are using Hattie’s interpretation [
37], which considers values of Cohens’
d = 0.4 as “the average that summarizes the typical effect of all possible influences in education”; this means that values of d > 0.4 include those educational strategies that have a higher effect and make a difference above the average results.
The PSVT results suggest that visual-spatial abilities can be trained through the study and practice of GTs, either in the classroom (in person) or in self-study mode. Other studies had provided similar results in traditional classroom environments [
36,
38,
39,
40,
41,
42,
43,
44,
45], so we added additional evidence that it may also occur in the self-study case. The rejection of the null hypothesis and the effect sizes of d = 0.491 and d = 0.502 in the CG and non-CG groups, respectively, support our conclusions.
Regarding the students’ performance on the GTs Test, our findings suggest that although a significant difference was not found between the scores obtained by the CG and the non-CG groups, this is, in fact, a positive indication of the learning potential of the software tools. Our main research question was about whether the use of the tools would favor a learning outcome on GTs comparable with the one obtained with the regular instruction in the classroom. The statistical result of “no significant difference” means that both educational strategies are, in effect, comparable. The real justification for the tools is to support learning GTs in distance education, not necessarily to outperform the learning outcome of classroom (in-person) instruction.
We found it interesting that students with no previous knowledge of CG and applied GTs received similar results in the test as students taking the regular course. Certainly, we expected that the tools would be able to potentiate the students’ GTs learning, but we believed, before the experiment, that numerous and longer sessions of using the tools would be necessary to achieve concrete results. In our experiment conditions, students did not have unlimited time to use the software tools; the sessions were controlled in duration and restricted from interaction and feedback with other students or the instructor to simulate a real isolated and self-study condition. Even more, part of the sessions was “wasted” solving pre-selected software exercises to later have a point of comparison with the GTs Test (the correlations analysis); this time was subtracted from the time dedicated to the exploration, experimentation, and learning, with the tools.
Regarding the moderate correlation found between the students’ scores obtained in the training exercises and in the GTs Test (the non-CG group), we believe that a more realistic measurement can be obtained if the evaluations (scheduled at the end of the training sessions) are held starting from the second session, leaving out of evaluation the first session. It is probably better to wait until students are more familiar with the tools’ interface, grasp the basic GTs concepts, and better understand the exercises’ nature. Otherwise, a bad early performance in the exercises may unfairly affect the overall correlation.
Our results should be interpreted accordingly with some limitations. (1) Regarding the experimental design, it only included students from the UACJ and test materials of the introductory CG course offered at this university. Therefore, the results should be interpreted in this local environment. Although the syllabus of this course is based on similar courses offered in other universities and replicates the standard treatment of GTs in CG textbooks, further studies should be addressed to extrapolate results and arrive at more general conclusions. (2) We waited until students were back in-person to perform the experimental test; we preferred to simulate the self-study mode in a controlled environment instead of releasing the tools to students without knowing how exactly they would use them. Therefore, it was only a simulation of the real scenario where the tools will be used. (3) Mainly due to the former limitation, we could not have a significant sample of students. We were restricted by the number of CG students enrolled in Spring 2022; moreover, 15 of them consented to participate in the experiment. On the other hand, more non-CG students were available, but we did not want a big difference in the sample size between both groups.
Extending the testing to more participants is necessary to increase the measurements’ reliability. In addition, it is necessary to test the same tools with CG students; that is, answer the question: will the “normal” learning strategies plus the usage of the tools increase the students’ performance in the CG course? Former CG students informally used the software during the COVID-19 lockdown, but current CG students only used the “classroom” strategies in this study. Inviting non-CG students to our experiment allowed us to better simulate not receiving the normal instruction in the classroom and, therefore, the isolation and distance-learning factors.
6. Conclusions and Future Work
We developed a standardized framework to support a specific style of exercise we called “before and after”, commonly used to teach GTs at different educational levels. We directed the framework applicability to higher education, particularly CG, where GTs are extensively treated with a matrix representation as an efficient method to formalize composite sequences of transformations. We demonstrated that this framework could be embedded in diverse software tools such as the GTVisualizer and GTCards, among other possibilities. A central focus of this study was to enable tools suitable for distance learning, either synchronous or asynchronous, as the forced situation lived with the prolonged COVID-19 pandemic and its repercussion on education. The developed tools were designed to complement each other; GTVisualizer is focused on the early contact with GTs, emphasizing the matrix format and the local and global coordinate systems to build composite sequences. Instead, GTCards is a video game to continue drilling GTs concepts in a ludic environment. Our empirical test on undergraduate students suggests that both tools are adequate to distance learning environments due to similar results between students learning GTs in the classroom (without the tools) and students in a simulated self-study mode (with the tools). The experiment outcome confirmed our intuitive perception that during the COVID-19 lockdown, the software tools were helpful for students enrolled in CG at the time. In fact, a change in students’ performance and engagement in the course was evident after using the tools in late 2021, compared with the frustration of earlier students. Tools were made available to students for the first time in Spring 2021 once the early prototypes were ready.
These results open the opportunity to design, implement, and offer an online version of the CG classroom course; the availability and use of learning tools such as those proposed in this work may attenuate some disadvantages of the self-study mode when learning GTs. Students in the distance-learning modality may be closer to the advantages held by in-person students who can use many resources, physical models, presential explanations, and guided exercises that have been available for many years in the classroom to help learn GTs.
Regarding the future work, we provide here a list of issues we consider relevant to continuing this study:
As mentioned in the results section, a long-term test with larger sample sizes and encompassing more academic terms (semesters) should be performed to validate the current results.
Diverse computational techniques can be experimented with to “tune” the software tools. For example: (1) Adjust the difficulty degree associated with exercises to increase the “naturality” of how students perceive the increasing complexity as they advance their learning. (2) The real-time feedback when student builds composite sequences can be improved. (3) The video game can be enhanced with strategies to increase engagement and fun without sacrificing its main “serious” objective.
Convert current tools from prototypes to more “consumable” learning tools with embedded analytics and higher availability. This change would provide helpful feedback on the learning outcomes in a broader spectrum with students with diverse needs and backgrounds.


