Article

MST-RNN: A Multi-Dimension Spatiotemporal Recurrent Neural Networks for Recommending the Next Point of Interest

1
School of Computer and Science, Harbin Institute of Technology, Weihai 264209, China
2
Network Center, Shanxi Medical University, Taiyuan 030607, China
*
Authors to whom correspondence should be addressed.
Mathematics 2022, 10(11), 1838; https://doi.org/10.3390/math10111838
Submission received: 10 March 2022 / Revised: 7 May 2022 / Accepted: 19 May 2022 / Published: 27 May 2022
(This article belongs to the Special Issue Mathematical Foundations of Deep Neural Networks)

Abstract

:
With the increasing popularity of location-aware Internet-of-Vehicle services, the next-Point-of-Interest (POI) recommendation has gained significant research interest, predicting where drivers will go next from their sequential movements. Many researchers have focused on this problem and proposed solutions. Machine learning-based methods (matrix factorization, Markov chain, and factorizing personalized Markov chain) focus on a POI sequential transition. However, they do not recommend the user’s position for the next few hours. Neural network-based methods can model user mobility behavior by learning the representations of the sequence data in the high-dimensional space. However, they just consider the influence from the spatiotemporal dimension and ignore many important influences, such as duration time at a POI (Point of Interest) and the semantic tags of the POIs. In this paper, we propose a novel method called multi-dimension spatial–temporal recurrent neural networks (MST-RNN), which extends the ST-RNN and exploits the duration time dimension and semantic tag dimension of POIs in each layer of neural networks. Experiments on real-world vehicle movement data show that the proposed MST-RNN is effective and clearly outperforms the state-of-the-art methods.

1. Introduction

With the rapid development of communication technology and the increasing popularity of location-aware Internet of Vehicle services, the next-Point-of-Interest (POI) recommendation has gained significant research interest [1,2], which can predict where drivers will go next from their sequential movements. Through the next-POI analysis, the sequence data can tell service providers where a driver will go for the next few hours, which is very useful for business systems. For example, if the service provider knows that a user is going to a shopping mall at noon, they will recommend a fashionable clothing store and suitable restaurant with parking spaces nearby. Moreover, such an analysis can also be beneficial for social management, such as when a crowd gathered will appear at holidays.
Nowadays, many scholars are currently conducting research on issues of a spatial–temporal sequence analysis, which can be called the POI (Point of Interest) recommendation [3,4]. Given a user’s sequential movements, a POI recommendation can predict the next destination of the user accurately. Matrix factorization (MF) [5,6] and a Markov chain (MC)-based model [7] are early methods to solve the problem of a spatial–temporal sequence analysis. MF-based methods factorize a user-item rating matrix into two low-rank matrices and extend the rating matrix to be time-aware and location-aware. MC-based methods predict the next position of a user based on the past position sequences in which a transition matrix can be fixed and illustrate the probability of a position based on the past positions. The factorizing personalized Markov chain (FPMC) [8] is a combination of MF and MC methods and achieves good performance in next location prediction. However, these machine learning-based methods concentrate on the POI transition mechanism, making it hard to handle users’ positions for the next few hours.
Recently, a neural networks-based method [9,10] has been successfully applied in a sequence analysis and shows a promising performance compared with machine learning-based methods. A personalized ranking metric embedding (PRME) [9] model maps users and POIs into the embedding vector space and adds the spatial and temporal factors to the sequence transfer matrix. Recurrent neural networks (RNNs) [10] employ historical POIs to predict the next location. A spatial–temporal recurrent neural network (ST-RNN) [11] extends the RNN and employs the time-specific transition matrix and distance-specific transition matrices to handle continuous geographical distances between locations and time intervals with nearby POIs in modeling sequential data. Although the above NN-based methods have achieved satisfactory results in a short time, they still explore the POI from the dimension of a sequence and ignore many important information dimensions in users’ POI data, such as the duration time at a POI and the semantic tags of POIs. At first, the duration time indicates the user’s interest in the POI. For instance, if a person spends 4 h at a museum and stays at the cinema for five minutes, it is clear that the user prefers museums. Secondly, semantic tags of POIs can also reveal users’ visiting rules. For example, when a person leaves a museum, he or she will not visit a place with similar functions in a short time.
In this paper, to better model spatiotemporal information and semantic tags in next-POI recommendations, we propose a novel method called multi-dimension spatial–temporal recurrent neural networks (MST-RNNs). Inspired by the ST-RNN model, the MST-RNN considers spatiotemporal information as the continuous feature dimension first and models these sequential elements in an almost fixed time period. What is more, the MST-RNN considers duration time as an indicator of a user’s preference dimension. The longer the duration time is, the more interested the user is. In addition, the MST-RNN utilizes the tag dimension of POIs to learn the rule of POI changes.
The main contributions of this paper are as follows:
  • We propose a novel MST-RNN model to learn the rule of next-POI changes from spatial, temporal, and semantic dimensions.
  • We consider the duration time of a user as a new indicator in next-POI recommendations, which can measure the user’s preference dimension.
  • We add a tag regularization item for exploring the semantic dimension of POI changes, which presents a novel perspective on the next-POIs recommendation.
  • We detail the specific learning process of the proposed models and present the tuning steps of the hyperparameter.
  • Experiments conducted on real-world vehicle trajectory data show that the proposed MST-RNN is effective and clearly outperforms the state-of-the-art methods.
The rest of the paper is organized as follows. In Section 2, we introduce the brief related works for the location-aware recommendation. In Section 3, we mainly discuss more details about the MST-RNN model, including the model structure and inferring process. In Section 4, we design the experiments to evaluate the MST-RNN and analyze the experimental results from different perspectives. We also make a choice of parameters. Finally, we draw conclusions in Section 5.

2. Related Works

Location recommendation or prediction has attracted many scholars to invest in research. In this section, we review several types of models related to this topic.
The earliest recommendation or prediction theory is the collaborative filtering algorithm [3,12], which obtains recommendation results by studying similar preference characteristics between user groups and item groups. Matrix factorization [13] is an improvement of the collaborative filtering series methods. It treats individual users and items as vectors, proposes a user–item preference matrix, and trains the parameters in the matrix through the existing user–item interaction data. The product approximates the preference matrix to produce the recommendation result. The tensor factorization further considers the time factor [14]. This model slices time and generates a three-dimensional tensor in the latent space through factorization. However, limited by the representation ability, the matrix factorization series of models is not good at predicting user behavior.
Considering the sequential characteristics of POI prediction, an MC-based model is a natural idea [15,16]. Under this model, a probability transition matrix was defined to represent the probability of user behavior. Combined with the theory of the factorization model, an improved MC model is proposed. The FPMC (personalized factorized Markov chain) is verified to be a better model for predicting the next POI [8]. The model uses vectors to express the transition to and from a certain state and generates a transition matrix in the form of a vector inner product. However, the FPMC only considers the linear relationship in the state transition and assumes that the factors are independent of each other. Such processing limits the ability of the model.
Metric learning-based models are also a good idea [17,18,19]. They embed items in a low-dimensional vector space and characterize the relationship between items through Euclidean distance, which can be used to study the laws in the data. PRME (personalized ranking-based metric embedding) [9] is a state-of-art model. The model defines two latent vector spaces, one to characterize the sequence transfer and one to characterize user preferences. The weighted sum of two vector spaces of the same dimension is used as the optimization goal of the model. This model is a good model for users to transfer between multiple POIs, taking into account time and space factors. Taking into account the limitations of linear space representation parameters, a hyperbolic space measurement method is proposed [20,21]. Hyperbolic space is a space under non-Euclidean geometry which can effectively solve the problem that the structure of complex patterns is limited by the dimensions of European space [22,23]. Under the hyperbolic space model, the distance measurement and differential calculation are different from those in linear space. The improved method of this model has wide applicability.
As deep learning has become popular, RNN-based models have received widespread attention. An RNN can efficiently characterize the serialization features in the model [24,25,26] and was the first to study the semantic model of word embedding [27], showing good predictive ability. The RNN model is different from the general neural network model. Its output layer is not only affected by the current input layer but also by the past output layer [10,26]. However, the model assumes time independence, which is different from the real scenario predicted by a POI. The ST-RNN model is a reasonable modeling method [11]. It takes time and space factors as hidden layers, and it expresses the model parameters under different inputs in the form of fragmentation and interpolation.

3. Model

In this section, a detailed description of the proposed models will be introduced. We first define the problem and show the baseline of the ST-RNN model. Then, the proposed SDT-RNN and MST-RNN will be introduced. Finally, we illustrate the learning process of the model.

3.1. Problem Definition

For user u and location v, p u R d and q v R d represent the hidden vectors of user u and location v. Each position v can be regarded as a POI and has corresponding coordinates of latitude and longitude, which can be denoted as ( x v , y v ) . P denotes a set of users, and Q denotes a set of POIs. For each user u, Q u = { q t 1 u , q t 2 u , } represents the history of where they have been and q t i u denotes where they are at time t i .
According to the above symbol definition, a specific definition of predicting the next POI task can be described. Given the history of all users Q U = { Q u 1 , Q u 2 , } , the task is to predict a set of POIs for a specified user u where they might go next.

3.2. Baseline Model

The model of RNN is often used to deal with problems with serialization characteristics in which the network will remember the previous information and apply it to the calculation of the current output. Then, the nodes between the hidden layers are no longer unconnected but connected, and the input of the hidden layer not only includes the output of the input layer but also includes the output of the hidden layer at the previous moment. Hence, a hidden layer can be computed by vector representation as:
h t k u = f ( M q t k u + C h t k 1 u ) ,
In Equation (1), h t k u represents the latent vector of user u at time t k , q t k k u denotes the latent vector of the POI u visits at time t k , C is the parameter matrix used to connect the sequential signals of the previous status. M is the transition matrix for newest input elements to represents the current behavior of the user. The activation function f ( x ) is a s i g m o d function f ( x ) = 1 / ( 1 + e x ) , where x represents the output of linear neural unit in RNN.
Because RNN only models the user’s historical trajectory information, it ignores the significant factors of temporal and spatial. For example, if a user visits two POIs adjacently, the length of the time interval between them has different effects on the prediction task. Obviously, this time-related information cannot be well described by the RNN model, which may lead to poor performance. In addition, the spatial distance factor cannot be ignored. For POI access records that are adjacent in time sequence, the distance between POIs is a critical factor, whereas different distances should show different user preferences in the model.
Considering above problems, Ref. [11] proposed the ST-RNN model. Given a user u and a time t, their representation can be computed as:
h t , q t u u = f ( q t i u Q u , t w < t i < t S q t u q t i u T t t i q t i u + C h t w , q t w u u ) ,
In Equation (2), S q t u q t i u and T t t i replace the matrix M in (1). w is defined as the width of time window. If the latent vector of user u at time t needs to be calculated. The period before t needs to be divided into many grids by w. Elements in the same grid represent user u visited multiple POIs in this time period. Therefore, T t t i denotes the time-specific transition matrix for the time interval t t i before current time t. For different time intervals t t i , the parameters of matrix T t t i will also be different. S q t u q t i u denotes the distance-specific transition matrix for the geographical distance between q t u and q t i u according to the coordinate. q t u denotes the POI of user u at time t and corresponds to a coordinate represented by latitude and longitude. The geographical distance between two coordinates L can be calculated as:
L = R arccos [ sin x t u sin x t i u + cos x t u cos x t i u cos ( y t u y t i u ) ]
where x t u denotes the latitude of the POI user u at time t and y t u denotes the longitude, respectively. R denotes the radius of the earth.
For special cases, if the history is not long enough so that the predicted time t is less than w, h t w , q t w u u in (2) should be replaced by h 0 u = h 0 , which denotes the initial status. The time constraint of the summation term is 0 < t i < t . The initial status of all the users will be the same and generated by Gaussian distribution in the implementation. This is because the user has no history at the initial moment and appears to have the same preference.

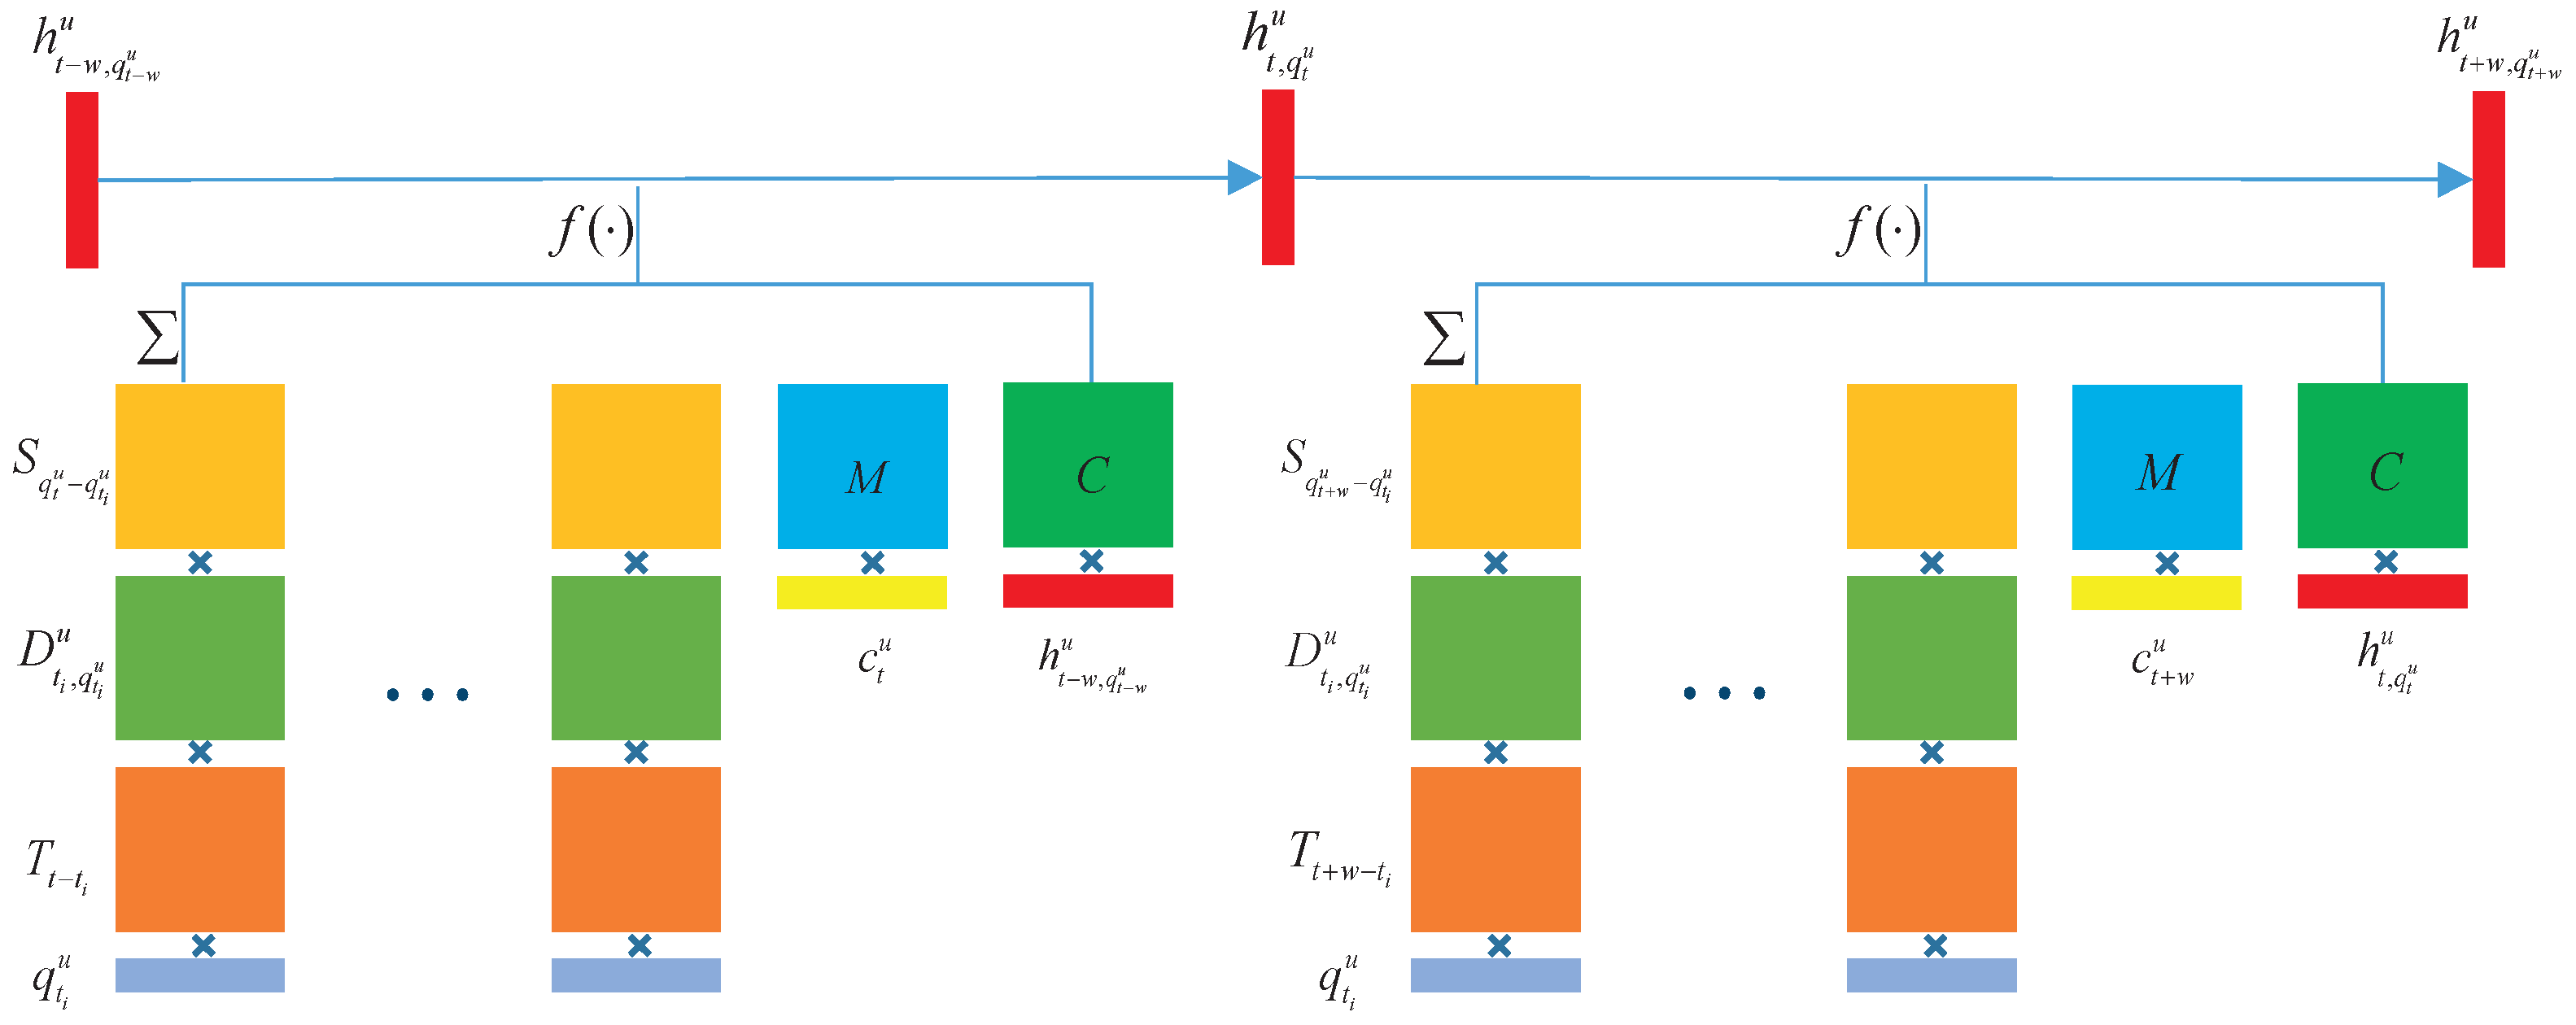
3.3. Proposed Models

Although the ST-RNN model can handle temporal and spatial information at the same time, it also ignores a lot of useful information from temporal and semantic dimensions. Actually, the ST-RNN model defines temporal factor as a continuous-time dimension in which user u arrived at location v at time t. In a real scenario, however, the duration time of user u at position v is also important and worth considering. Different duration time in the same POI may imply user’s preference information. For a POI, the fact that some users stay for a long time indicates they are more interested than users staying for a short time. Let d denote duration time that one user stays at a POI and D t , q t u u denotes the duration time that user u stays at the location q t u reached at time t. Naturally, we can replace T t t i in (2) with D t , q t u u to obtain another form of h t , q t u u :
h t , q t u u = f ( q t i u Q u , t w < t i < t S q t u q t i u D t i , q t i u u q t i u + C h t w , q t w u u )
The network using Equation (4) can be called SD-RNN (spatial duration recurrent neural network), which only considers the duration time of the user in a given POI in the temporal dimension.
However, some experiment results show that using duration time alone in SD-RNN can improve a few prediction performances. In addition, the arrival time and duration time of a user visiting a certain POI can be regarded as independent variables that do not interfere with each other. Hence, we add both factors on the basis of Equation (4) as the duration-specific transition matrix. Then, Equation (4) should be written as:
h t , q t u u = f ( q t i u Q u , t w < t i < t S q t u q t i u D t i , q t i u u T t t i q t i u + C h t w , q t w u u )
Using Equation (5), the SD-RNN network has been changed to SDT-RNN (spatial duration–temporal recurrent neural network), which can make the best of temporal and spatial information of sequence data.
Except for temporal and spatial factors, we find that every POI has its own semantic tags, such as industry category, popularity, etc. The tag can be obtained from the interface of the map-related API and used to assist the POI prediction. For example, after leaving the workplace, a user wants to shop at a mall or entertainment venue for a period of time before returning home. These tags do reverse the semantic rule of POI changes. Let c t u represent the latent vector of the industry category for the POI visited by user u at time t. M represents the parameter matrix for industry category transfer. Then, we can add a tag regularization item in Equation (5):
h t , q t u u = f ( q t i u Q u , t w < t i < t S q t u q t i u D t i , q t i u u T t t i q t i u + M c t u + C h t w , q t w u u )
Using Equation (6), we obtain multi-dimension spatial–temporal recurrent neural networks (MST-RNNs). Figure 1 shows the diagram of the proposed MST-RNN model in which different matrices or vectors are represented by different colors. Obviously, considering duration time and semantic tags are significant factors for POI prediction, it is necessary to involve them in our model. Similar to time-specific transition matrices in ST-RNN, we incorporate the spatiotemporal transition matrices and the semantic matrices for different distances between POIs. These transition matrices capture intention properties that affect driver behavior. In MST-RNN, all spatiotemporal information of a user can be obtained by multiplying the transfer matrix. Then, spatiotemporal matrix and semantic matrix are summed and transformed by the S i g m o d function to obtain the hidden vector of the next state.
After training MST-RNN model, the prediction can be generated by calculating an inner product of the hidden vector for user and POIs. The prediction of whether user u will go to POI v at time t can be calculated as:
o u , t , v = ( θ h t , q v u + ( 1 θ ) p u ) T q v
where q v is the permanent representation of POI v. p u denotes the permanent representation of user u and h t , q v u represents interests under the specific contexts of user u. θ is used as a weight parameter to balance the influence of the user’s range of interest activities and specific spatial and temporal contexts on the prediction results.

3.4. Generation of Transition Matrix

The parameters of the transition matrix S , T , D mentioned in the model depend on specific real values. Because the set of real numbers is an infinite set, it is obviously impossible to establish a one-to-one corresponding transition matrix for each real number that appears in the data. Therefore, length of time and geographical distance can be divided into discrete bins, respectively. Only the transition matrices corresponding to the upper and lower bounds will be trained in the model. The transition matrix corresponding to other values can be calculated by linear interpolation by combining the transition matrix of the upper bound and the lower bound. Given U p ( t ) and L o w ( t ) represent the upper bound and lower bound of time interval t, the time-specific transition matrix T t for time interval t can be computed as:
T t = T L o w ( t ) ( U p ( t ) t ) + T U p ( t ) ( t L o w ( t ) ) U p ( t ) L o w ( t )
Similarly, given U p ( d ) and L o w ( d ) represent the upper bound and lower bound of duration time d, the duration-specific transition matrix D d for duration time d can be computed as:
D d = D L o w ( d ) ( U p ( d ) d ) + D U p ( d ) ( d L o w ( d ) ) U p ( d ) L o w ( d )
Finally, given U p ( l ) and L o w ( l ) represent the upper bound and lower bound of geographical distance l, the distance-specific transition matrix S l for geographical distance l can be computed as:
S l = S L o w ( l ) ( U p ( l ) l ) + S U p ( l ) ( l L o w ( l ) ) U p ( l ) L o w ( l )
This calculation method solves the problem of modeling continuous values. In this way, any real value can correspond to a unique transition matrix.
The matrices’ parameters M and C do not depend on specific values related to spatial and temporal contexts. M implies the inherent law of user’s transferring between POIs of different industry categories. M is multiplied by c t u to obtain the transfer effect of the POI of user u at time t to the previous position. Multiplying the matrix C with the latent user vector generated in the previous step is a common way to model historical information in RNN.

3.5. Parameter Inference

The learning process of the model MST-RNN needs to be introduced in this section, which extends BPR (Bayesian personalized ranking) [28] and BPTT (back propagation through time) [29].
BPR provides a framework for a personalized ranking algorithm based on Bayesian posterior optimization. It assumes that all users prefer items they have interacted with over items that have not been recorded. Mathematically, it is necessary to maximize the following probability:
p ( u , t , v v ) = f ( o u , t , v o u , t , v )
where v is a POI that user u has never visited. f ( x ) is the same as before, selected as the s i g m o d function. According to the negative log-likelihood, the following functional expression is obtained:
J = u , t , v v ln ( 1 + e ( o u , t , v ) o u , t , v ) + λ 2 Θ 2
where Θ = { P , Q , S , D , T , M , C } denotes all the parameters to be learned. λ is a parameter that controls the weight of the regularization term. The partial derivative of J with respect to the latent vector of user and POI can be calculated as:
J p u = u , t , v v ( 1 θ ) ( q v q v ) e ( o u , t , v o u , t , v ) 1 + e ( o u , t , v o u , t , v ) + λ p u J q v = u , t , v v ( θ h t , q v u + ( 1 θ ) p u ) e ( o u , t , v o u , t , v ) 1 + e ( o u , t , v o u , t , v ) + λ q v J q v = u , t , v v ( θ h t , q v u + ( 1 θ ) p u ) e ( o u , t , v o u , t , v ) 1 + e ( o u , t , v o u , t , v ) + λ q v J h t , q v u = u , t , v v θ q v e ( o u , t , v o u , t , v ) 1 + e ( o u , t , v o u , t , v ) J h t , q v u = u , t , v v θ q v e ( o u , t , v o u , t , v ) 1 + e ( o u , t , v o u , t , v )
Incorporating the back propagation through time algorithm, the corresponding gradients of all parameters in the hidden layer can be further learned. Given the derivation J with respect to h t , q t u , the following derivations can be obtained:
J S q t u q t i u = ( f ( · ) J h t , q t u ) ( D t i , q t i u u T t t i q t i u ) T J D t i , q t i u u = ( S q t u q t i u ) T ( f ( · ) J h t , q t u ) ( T t t i q t i u ) T J T t t i = ( S q t u q t i u D t i , q t i u u ) T ( f ( · ) J h t , q t u ) ( q t i u ) T J q t i u = ( S q t u q t i u D t i , q t i u u T t t i ) T ( f ( · ) J h t , q t u ) J M = ( f ( · ) J h t , q t u ) ( c t u ) T J c t u = M T ( f ( · ) J h t , q t u ) J C = ( f ( · ) J h t , q t u ) ( h t w , q t w u u ) T J h t w , q t w u u = C T ( f ( · ) J h t , q t u )
Finally, SGD (stochastic gradient descent) can be employed to estimate the model parameters because all gradients can be calculated. Repeat this process until all parameters converge.

4. Experimental Results and Analysis

In this section, we conduct a series of experiments to prove the effectiveness of the MST-RNN in predicting the next-POI problem. We first introduce the specific composition of the dataset and the details of the data preprocessing. Then, we compare the MST-RNN model with other state-of-the-art methods. Finally, the choice of parameters is analyzed.

4.1. Vehicle Trajectory Dataset

To verify the performance of the proposed model, we conduct vehicle trajectory datasets, which consist of billions of trajectory records within a time span of 4 months. Each record contains one identification, one latitude, and longitude at time t. These records are collected by IoT devices in the vehicles. When the device is turned on and working normally, a piece of data is generated about every two seconds. The trajectory generated by the same vehicle identification is regarded as a user’s behavior. After sorting into chronological order, we can obtain the sequential trajectory of a vehicle.
However, in a vehicle’s trajectory, one latitude and longitude cannot be seen as a POI directly. We should convert each user’s trajectory to the POI format because the proposed MST-RNN model needs previous POI sequences to predict the next POI of users. Firstly, we define the stay points of a vehicle as POIs of a user. When the vehicle is running, the device works normally, and a piece of data should be collected in 2 s. When the vehicle is stopping, the device is turned off, and data will not be collected until the vehicle is started again. Therefore, one stay point will be obtained by calculating the interval between two adjacent pieces of data. When the interval is long enough, it can be judged that the user has reached the stay point. At the same time, the arrival time will be recorded. The duration time at the stay point is the time interval between the two data. Another situation of the POI calculation is that the vehicle stays at a certain location (latitude and longitude) for a long time, but the device still uploads data every two seconds. In this scenario, the positions of two adjacent pieces of data will be monitored, and if the location is the same, the information of the previous piece of data should be recorded. Then, we monitor the subsequent data flow until the location changes. Such two pieces of data also constitute a POI. Considering that a user may not park at the same location when they go to the same destination multiple times, we should cluster POIs in the close area. We employ the DBSCAN (density-based spatial clustering of applications with noise) [30] method, and the clusters of points with close positions are regarded as the same POI.
After extracting the POI sequences of the users, the MST-RNN also needs the tag information of the POIs. We will obtain the industry category of the POI through the interface provided by the map developer platform. Finally, in order to prevent the sparse POI distribution from affecting the experiment and not lose its representativeness, we selected the vehicle trajectory of Xiamen city as the experimental scene, which involved more than 800 users and 4000 POIs, a total of more than 100,000 activity records.

4.2. Experimental Settings

In the experiment, the first 50% of each user’s trajectory is used for training, then 30% of the data for testing, and the remaining 20% of the data as the validation set to tune parameters. The regulation parameter is set as λ = 0.05 .
Then, we selected several metrics as the basis for evaluating experimental results. Recall@k and F1-score@k are two prevalent metrics for the POI recommendation task, where the @k means that these recommendation algorithms will return a predicted list, which includes k-relevant predicted targets. If the next POI appears in the predicted list, the evaluation score for the experiment will be added. The value of k is selected as 1, 5, and 10. A larger value means a better performance. MAP (Mean Average Precision) and AUC (Area under the ROC curve) are two global evaluations for prediction tasks. The larger the value, the higher the quality of the model.
We compare the MST-RNN with several well-known methods for the next-POI prediction:
  • MF [13]: The MF model extends the traditional collaborative filtering recommendation and performs well on the user–item matrix.
  • FPMC [8]: The Markov chain is a classical sequential model, which extends the Markov chain model by introducing a personalized transfer matrix.
  • PRME [9]: This model embeds users’ information and the POI information into the user preference space and sequence transfer space, where it takes the spatial and temporal factors into consideration.
  • RNN [10]: An RNN is an excellent model in the field of temporal prediction. It performs word embedding and ad-click prediction very well.
  • ST-RNN [11]: This method models temporal and spatial factors and extends the basic RNN model.
  • ST-LSTM [26]: Spatiotemporal-LSTM is a variant of an ST-RNN, which can capture the spatiotemporal relation from the two directions forward and backward.

4.3. Analysis of Experimental Results

Table 1 represents the performance comparison of these models evaluated by the recall, F1-score, MAP, and AUC. As can be seen, the proposed MST-RNN model achieves the best performance (marked in bold) compared with other baseline methods. Specifically, the traditional MF methods obtained poor performance, and the FPMC model performs better than the MF because the FPMC is modeled according to sequence characteristics and takes personalization into consideration. The PRME model adopts the mechanism of metric learning to model user preferences and sequence transfer, which is an improvement compared to the FPMC. For neural network-based methods, the RNN makes full use of the historical information in the training process and achieves better results than machine learning-based models (MF, FPMC, and PRME). The ST-RNN models the temporal and spatial contexts at the same time and has made great improvements compared to the RNN. The ST-LSTM model has achieved better results than the ST-RNN and can capture the spatiotemporal relation from the two directions, forward and backward.
From Table 1, we also see that the modeling of the duration time (SD-RNN) can achieve a similar performance to the ST-RNN (arriving time). When the duration time and arriving time work together, the performance of the SDT-RNN can make significant progress. Combining the tag attributes of a POI, the MST-RNN model has also made a significant improvement over the previous SDT-RNN. This phenomenon means that users’ POI transfer process contains potential rules, which can be influenced by industry information (hidden in tags).

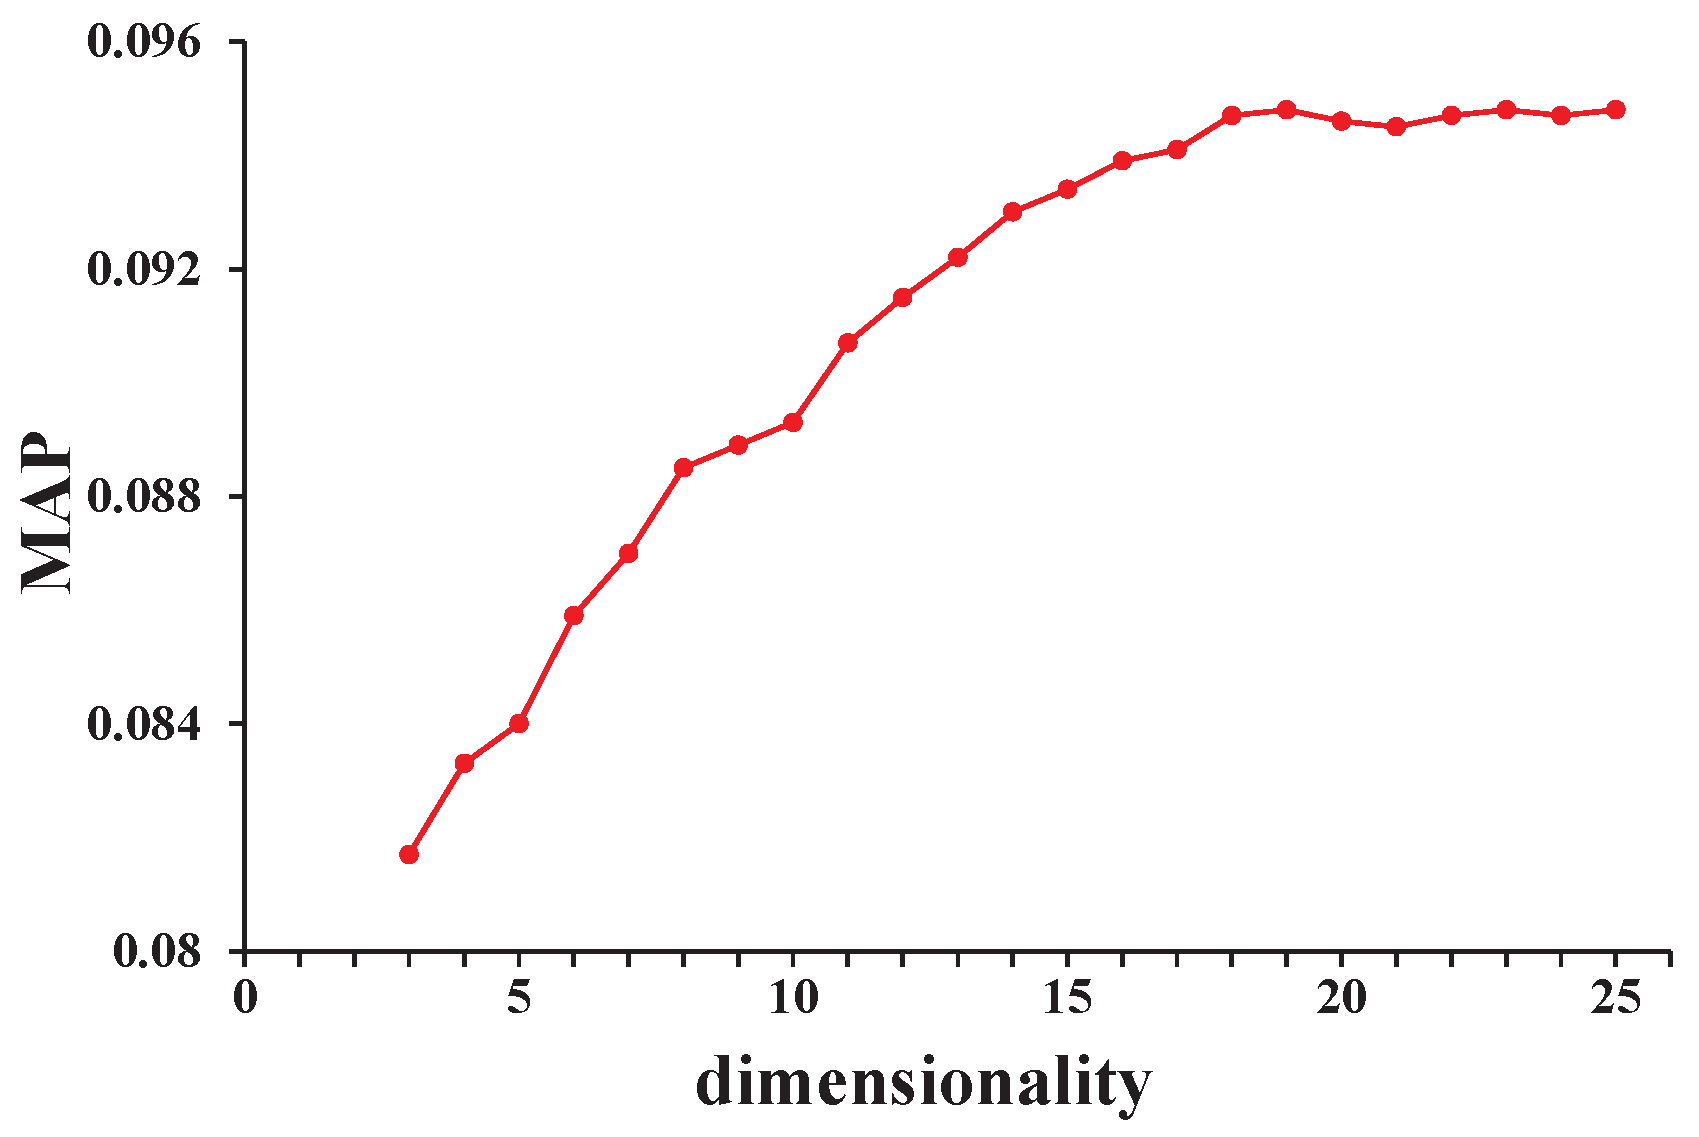
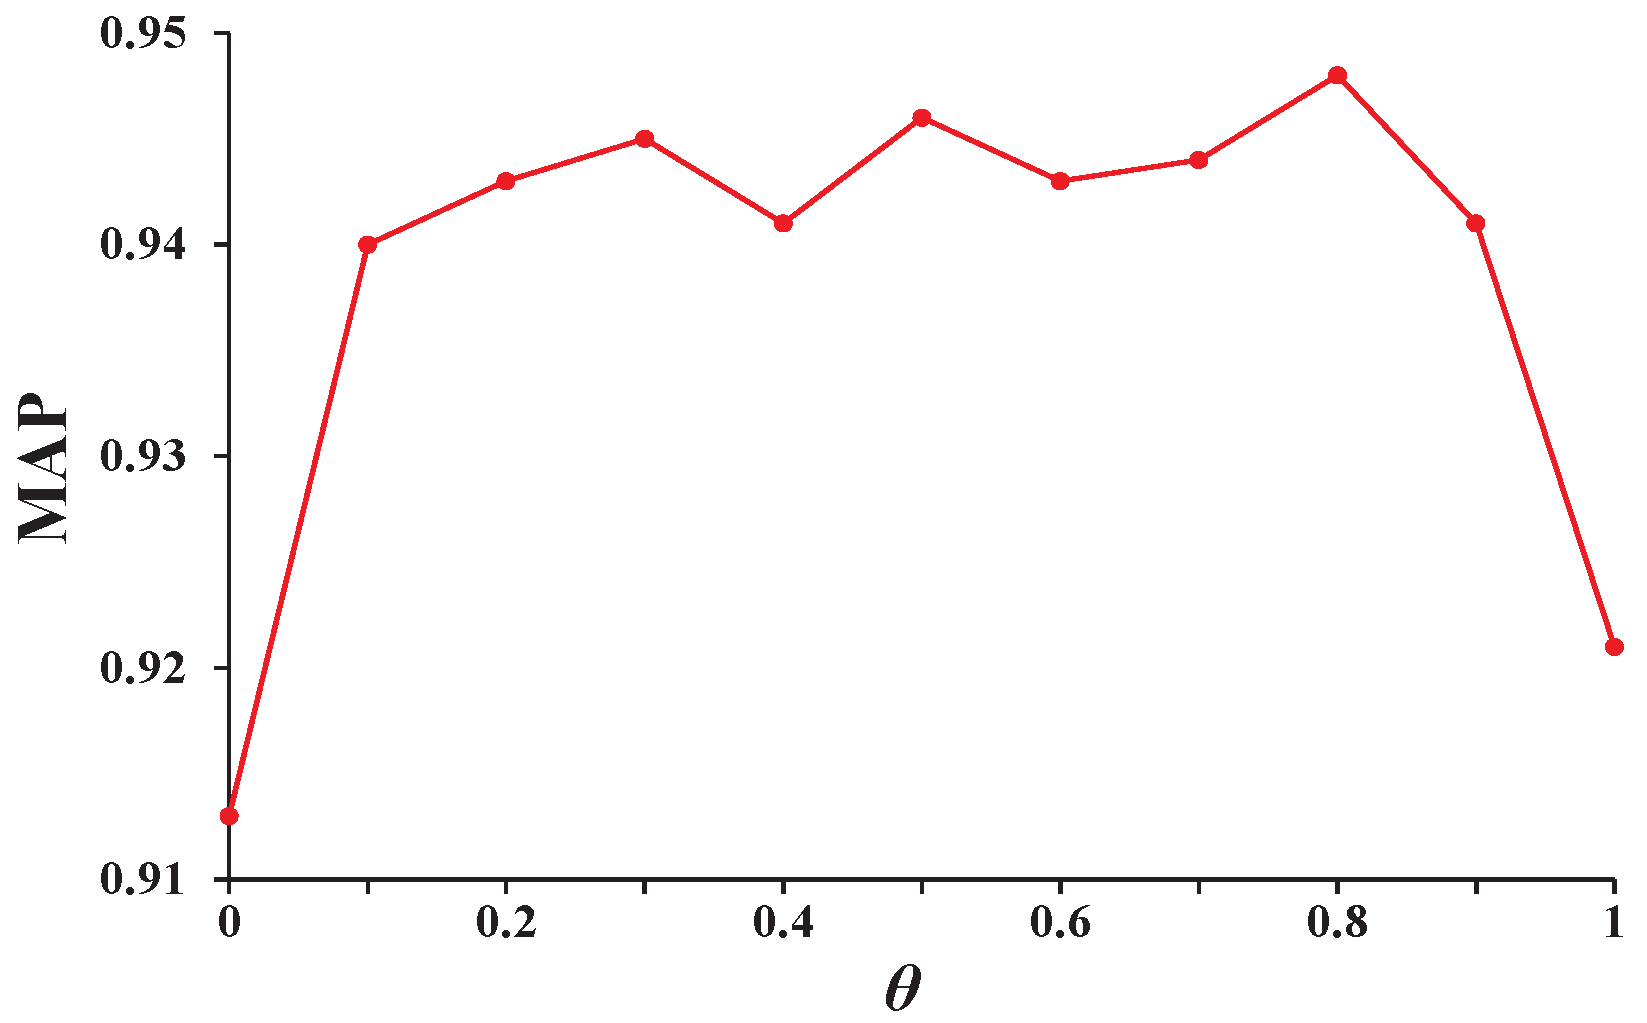
4.4. Analysis of Hyperparameters

Table 2 presents the model’s performance under varying width of time window widths. It can provide adequate guidance for parameter selection. The dimensionality is set to be d = 20 and weight in Equation (7) is set to be θ = 0.5 . We can clearly find that the best window width is w = 6 h. Under the condition of w = 6 h, all metrics except recall@1 perform best. When w = 12 h, recall@1 shows better results. However, this does not affect the choice of w, because the recall@1 in the case of w = 6 h is also a better result than other models.
In order to explore the impact of dimensionality on the results and select ideal parameters, we set w = 6 h, θ = 0.5 , and study the metrics of the MAP with varying dimensionality. Figure 2 shows a clear result. We can find that the MAP shows an overall upward trend with the increase in dimensionality. However, its rising speed is getting slower and slower. When d takes a value after 20, the value of the MAP basically no longer changes. According to the usual principle, when the performance is basically the same, choose a simpler model. Therefore, we recommend d = 20 as the most suitable parameter in dimensionality.
Figure 3 shows the discussion of parameter θ . Combining the previous results, we set d = 20 and w = 6 h, then calculate the MAP with varying θ . We can see that the model is not sensitive to the choice of θ . As long as the value of θ is not too close to 0 or 1, the model will perform well. This parameter is to weight the user preference and the real-time temporal and spatial contexts’ influence on the prediction. Setting θ to 0 or 1 is equivalent to ignoring the influence of a part of the latent vector. Therefore, we recommend choosing a compromise value that is θ = 0.5 .

5. Discussion and Conclusions

With the enhancing ability to collect information on Internet-of-Vehicle services, more and more drivers’ behavior contexts have been collected. Spatial, temporal, and semantic tag contexts describe the essential dimensions for the drivers’ destination, i.e., the next POI. These dimensions are fundamental for modeling drivers’ intention in practical applications. Conventional methods can hardly fuse multi-dimension information in a unified computing framework and always employ context-aware-based methods to handle the multi-context of users, i.e., Context Dimension Tree (CDT [31]). However, the CDT method is a rules-based approach that cannot process trajectory data. In this paper, we propose a novel multi-dimension spatial–temporal recurrent neural network (MST-RNN) to predict the next POI of drivers. Firstly, the MST-RNN extends the ST-RNN model and employs a transition matrix to handle the continuous temporal and spatial features in a recurrent neural network. Secondly, the MST-RNN considers duration time as an indicator of a user’s preference information and employs duration transition matrices to fix it. Finally, the MST-RNN utilizes tag regularization items for exploring the semantic rule of POI changes. Experiments conducted on real-world vehicle trajectory data show that the proposed MST-RNN is effective and clearly outperforms the state-of-the-art methods.
Although the MST-RNN handles the multi-dimension context in a unified objective function and achieves good performance in recommending the POI, the spatiotemporal and semantic dimensions are still independent components. Multi-dimensions in the MST-RNN are incorporated with regularization items. In the future, we will further explore the deep fusion method of multiple dimensions space, e.g., spatiotemporal embedding, semantic embedding, and user preference embedding.

Author Contributions

Writing—original draft preparation, C.L.; methodology, C.L.; formal analysis, Z.Z.; data curation, D.L.; writing—review and editing, D.C. All authors have read and agreed to the published version of the manuscript.

Funding

This work was supported in part by the National Natural Science Foundation of China (No. 61902090, 61832004) and the Natural Science Foundation of Shandong Province (No. ZR2020KF019).

Institutional Review Board Statement

Not applicable.

Informed Consent Statement

Not applicable.

Data Availability Statement

Not applicable.

Conflicts of Interest

The authors declare no conflict of interest.

References

  1. Li, H.; Ge, Y.; Hong, R.; Zhu, H. Point-of-interest recommendations: Learning potential check-ins from friends. In Proceedings of the 22nd ACM SIGKDD International Conference on Knowledge Discovery and Data Mining, San Francisco, CA, USA, 13–17 August 2016; pp. 975–984. [Google Scholar]
  2. Li, X.; Cong, G.; Li, X.L.; Pham, T.A.N.; Krishnaswamy, S. Rank-geofm: A ranking based geographical factorization method for point of interest recommendation. In Proceedings of the 38th International ACM SIGIR Conference on Research and Development in Information Retrieval, Santiago, Chile, 9–13 August 2015; pp. 433–442. [Google Scholar]
  3. Ye, M.; Yin, P.; Lee, W.C.; Lee, D.L. Exploiting geographical influence for collaborative point-of-interest recommendation. In Proceedings of the 34th International ACM SIGIR Conference on Research and Development in Information Retrieval, Beijing, China, 24–28 July 2011; pp. 325–334. [Google Scholar]
  4. Yuan, Q.; Cong, G.; Ma, Z.; Sun, A.; Thalmann, N.M. Time-aware point-of-interest recommendation. In Proceedings of the 36th International ACM SIGIR Conference on RESEARCH and Development in Information Retrieval, Dublin, Ireland, 28 July–1 August 2013; pp. 363–372. [Google Scholar]
  5. Cheng, C.; Yang, H.; King, I.; Lyu, M. Fused matrix factorization with geographical and social influence in location-based social networks. In Proceedings of the AAAI Conference on Artificial Intelligence, Toronto, ON, Canada, 22–26 July 2012; pp. 17–23. [Google Scholar]
  6. Lian, D.; Zhao, C.; Xie, X.; Sun, G.; Chen, E.; Rui, Y. GeoMF: Joint geographical modeling and matrix factorization for point-of-interest recommendation. In Proceedings of the 20th ACM SIGKDD International Conference on KNOWLEDGE Discovery and Data Mining, New York, NY, USA, 24–27 August 2014; pp. 831–840. [Google Scholar]
  7. Cheng, C.; Yang, H.; Lyu, M.R.; King, I. Where you like to go next: Successive point-of-interest recommendation. In Proceedings of the Twenty-Third International Joint Conference on Artificial Intelligence, Beijing, China, 3–9 August 2013; pp. 2605–2611. [Google Scholar]
  8. Rendle, S.; Freudenthaler, C.; Schmidt-Thieme, L. Factorizing personalized Markov chains for next-basket recommendation. In Proceedings of the 19th International Conference on World Wide Web, Raleigh, NC, USA, 26–30 April 2010; pp. 811–820. [Google Scholar]
  9. Feng, S.; Li, X.; Zeng, Y.; Cong, G.; Chee, Y.M.; Yuan, Q. Personalized ranking metric embedding for next new poi recommendation. In Proceedings of the IJCAI’15 Proceedings of the 24th International Conference on Artificial Intelligence, Buenos Aires, Argentina, 25–31 July 2015; pp. 2069–2075. [Google Scholar]
  10. Zhang, Y.; Dai, H.; Xu, C.; Feng, J.; Wang, T.; Bian, J.; Wang, B.; Liu, T.Y. Sequential click prediction for sponsored search with recurrent neural networks. In Proceedings of the AAAI Conference on Artificial Intelligence, Québec City, QC, Canada, 27–31 July 2014; pp. 1369–1375. [Google Scholar]
  11. Liu, Q.; Wu, S.; Wang, L.; Tan, T. Predicting the next location: A recurrent model with spatial and temporal contexts. In Proceedings of the AAAI Conference on Artificial Intelligence, Phoenix, AZ, USA, 12–17 February 2016; pp. 194–200. [Google Scholar]
  12. Chen, X.; Zeng, Y.; Cong, G.; Qin, S.; Xiang, Y.; Dai, Y. On information coverage for location category based point-of-interest recommendation. In Proceedings of the AAAI Conference on Artificial Intelligence, Austin, TX, USA, 25–29 January 2015; pp. 37–43. [Google Scholar]
  13. Koren, Y.; Bell, R.; Volinsky, C. Matrix Factorization Techniques for Recommender Systems. Computer 2009, 42, 30–37. [Google Scholar] [CrossRef]
  14. Xiong, L.; Chen, X.; Huang, T.K.; Schneider, J.; Carbonell, J.G. Temporal Collaborative Filtering with Bayesian Probabilistic Tensor Factorization. In Proceedings of the SIAM International Conference on Data Mining, Columbus, OH, USA, 29 April–1 May 2010; pp. 211–222. [Google Scholar]
  15. Zhao, S.; Zhao, T.; Yang, H.; Lyu, M.R.; King, I. STELLAR: Spatial-temporal latent ranking for successive point-of-interest recommendation. In Proceedings of the AAAI Conference on Artificial Intelligence, Phoenix, AZ, USA, 12–17 February 2016; pp. 315–321. [Google Scholar]
  16. Li, X.; Han, D.; He, J.; Liao, L.; Wang, M. Next and next new POI recommendation via latent behavior pattern inference. ACM Trans. Inf. Syst. (TOIS) 2019, 37, 1–28. [Google Scholar] [CrossRef] [Green Version]
  17. Lu, Y.S.; Huang, J.L. GLR: A graph-based latent representation model for successive POI recommendation. Future Gener. Comput. Syst. 2020, 102, 230–244. [Google Scholar] [CrossRef]
  18. Qiao, Y.; Luo, X.; Li, C.; Tian, H.; Ma, J. Heterogeneous graph-based joint representation learning for s and POIs in location-based social network. Inf. Process. Manag. 2020, 57, 102151. [Google Scholar] [CrossRef]
  19. Ying, H.; Wu, J.; Xu, G.; Liu, Y.; Liang, T.; Zhang, X.; Xiong, H. Time-aware metric embedding with asymmetric projection for successive POI recommendation. World Wide Web 2019, 22, 2209–2224. [Google Scholar] [CrossRef]
  20. Vinh Tran, L.; Tay, Y.; Zhang, S.; Cong, G.; Li, X. HyperML: A boosting metric learning approach in hyperbolic space for recommender systems. In Proceedings of the 13th International Conference on Web Search and Data Mining, Houston, TX, USA, 3–7 February 2020; pp. 609–617. [Google Scholar]
  21. Feng, S.; Tran, L.V.; Cong, G.; Chen, L.; Li, J.; Li, F. HME: A Hyperbolic Metric Embedding Approach for Next-POI Recommendation. In Proceedings of the 43rd International ACM SIGIR Conference on Research and Development in Information Retrieval, Virtual Event China, Xi’an, China, 25–30 July 2020; pp. 1429–1438. [Google Scholar]
  22. Bronstein, M.M.; Bruna, J.; LeCun, Y.; Szlam, A.; Vandergheynst, P. Geometric deep learning: Going beyond euclidean data. IEEE Signal Process. Mag. 2017, 34, 18–42. [Google Scholar] [CrossRef] [Green Version]
  23. Chamberlain, B.P.; Hardwick, S.R.; Wardrope, D.R.; Dzogang, F.; Daolio, F.; Vargas, S. Scalable hyperbolic recommender systems. arXiv 2019, arXiv:1902.08648. [Google Scholar]
  24. Altaf, B.; Yu, L.; Zhang, X. Spatio-temporal attention based recurrent neural network for next location prediction. In Proceedings of the 2018 IEEE International Conference on Big Data (Big Data), Seattle, WA, USA, 10–13 December 2018; pp. 937–942. [Google Scholar]
  25. Li, R.; Shen, Y.; Zhu, Y. Next point-of-interest recommendation with temporal and multi-level context attention. In Proceedings of the 2018 IEEE International Conference on Data Mining (ICDM), Singapore, 17–20 November 2018; pp. 1110–1115. [Google Scholar]
  26. Zhao, P.; Zhu, H.; Liu, Y.; Li, Z.; Xu, J.; Sheng, V.S. Where to go next: A spatio-temporal lstm model for next poi recommendation. arXiv 2018, arXiv:1806.06671. [Google Scholar]
  27. Mikolov, T.; Chen, K.; Corrado, G.; Dean, J. Efficient estimation of word representations in vector space. arXiv 2013, arXiv:1301.3781. [Google Scholar]
  28. Rendle, S.; Freudenthaler, C.; Gantner, Z.; Schmidt-Thieme, L. BPR: Bayesian Personalized Ranking from Implicit Feedback; UAI: Arlington, VA, USA, 2009; pp. 452–461. [Google Scholar]
  29. Rumelhart, D.E.; Hinton, G.E.; Williams, R.J. Learning representations by back-propagating errors. Nature 1986, 323, 533–536. [Google Scholar] [CrossRef]
  30. Ester, M.; Kriegel, H.P.; Sander, J.; Xu, X. A density-based algorithm for discovering clusters in large spatial databases with noise. In Proceedings of the Second International Conference on Knowledge Discovery and Data Mining, Portland, OR, USA, 2–4 August 1996; pp. 226–231. [Google Scholar]
  31. Casillo, M.; Colace, F.; Pascale, F.; Lemma, S.; Lombardi, M. Context-aware computing for improving the touristic experience: A pervasive app for the Amalfi coast. In Proceedings of the 2017 IEEE International Workshop on Measurement and Networking, Naples, Italy, 27–29 September 2017; pp. 1–7. [Google Scholar]
Figure 1. Diagram of MST-RNN model.
Mathematics 10 01838 g001
Figure 2. MAP performance of MST-RNN with varying dimensionality d.
Mathematics 10 01838 g002
Figure 3. MAP performance of MST-RNN with varying parameter θ .
Mathematics 10 01838 g003
Table 1. Performance comparison evaluated by recall, F1-score, MAP, and AUC.
Recall@1Recall@5Recall@10F1-Score@1
MF0.01130.03650.05620.0113
FPMC0.01760.05260.07830.0176
PRME0.02060.06330.08670.0206
RNN0.02670.07490.10210.0267
ST-RNN0.03120.08870.11030.0312
ST-LSTM0.03560.09370.11920.0356
SD-RNN0.03040.08960.10820.0304
SDT-RNN0.03590.09650.12310.0359
MST-RNN0.03670.09840.12570.0367
F1-Score@5F1-Score@10MAPAUC
MF0.01980.01770.04890.6379
FPMC0.02470.02230.06230.6822
PRME0.03510.03100.07550.7011
RNN0.04250.03640.08420.7293
ST-RNN0.05400.04770.08830.7319
ST-LSTM0.05880.05190.09140.7493
SD-RNN0.05330.04650.08790.7311
SDT-RNN0.06010.05270.09270.7525
MST-RNN0.06090.05360.09460.7611
Table 2. Performance of MST-RNN with varying window width w evaluated by recall, F1-score, MAP, and AUC.
wRecall@1Recall@5Recall@10MAPAUC
3 h0.03490.09320.11620.08910.7562
6 h0.03670.09840.12570.09460.7611
12 h0.03920.09610.12060.09140.7584
1 d0.03310.09560.11950.09060.7577
2 d0.03240.09530.12030.09110.7569
3 d0.03280.09550.11980.09070.7563
Publisher’s Note: MDPI stays neutral with regard to jurisdictional claims in published maps and institutional affiliations.

