

Benefits of FAIMS to Improve the Proteome Coverage of Deteriorated and/or Cross-Linked TMT 10-Plex FFPE Tissue and Plasma-Derived Exosomes Samples
 , , and
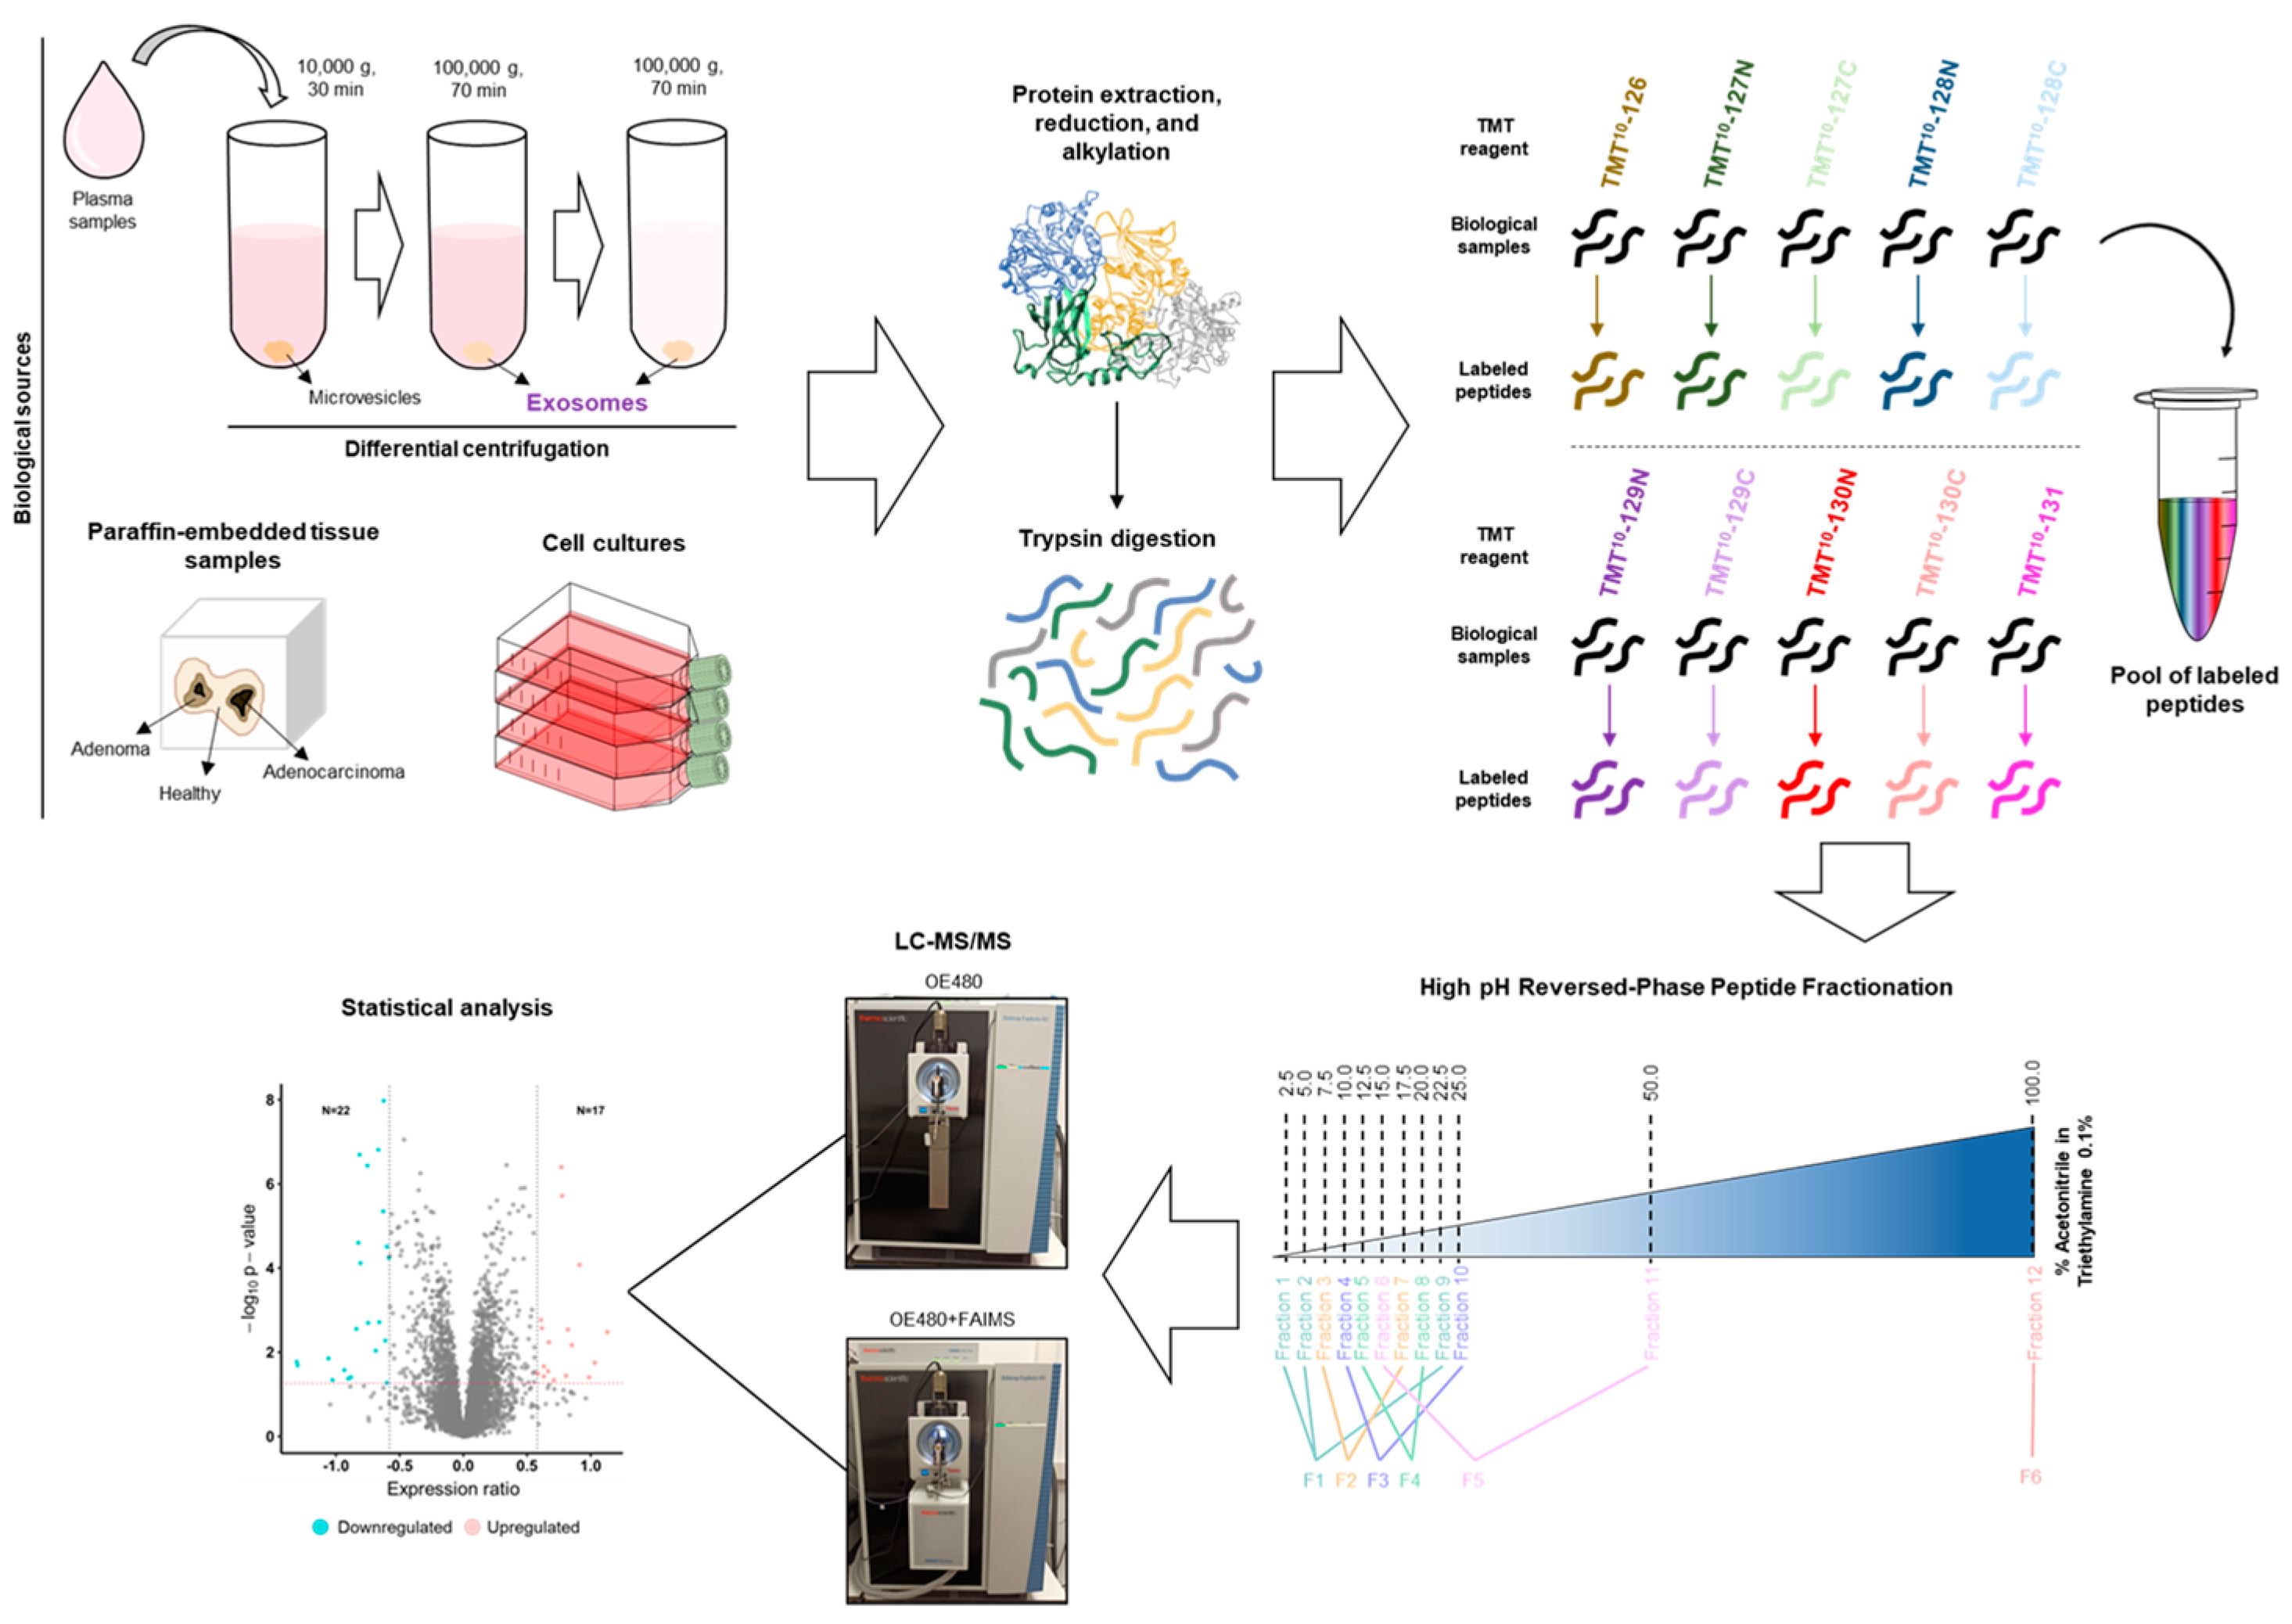
Abstract
:1. Introduction
2. Materials and Methods
2.1. Human Samples
2.2. CRC Cells and Transfection
2.3. Plasma Exosome Isolation and Purification
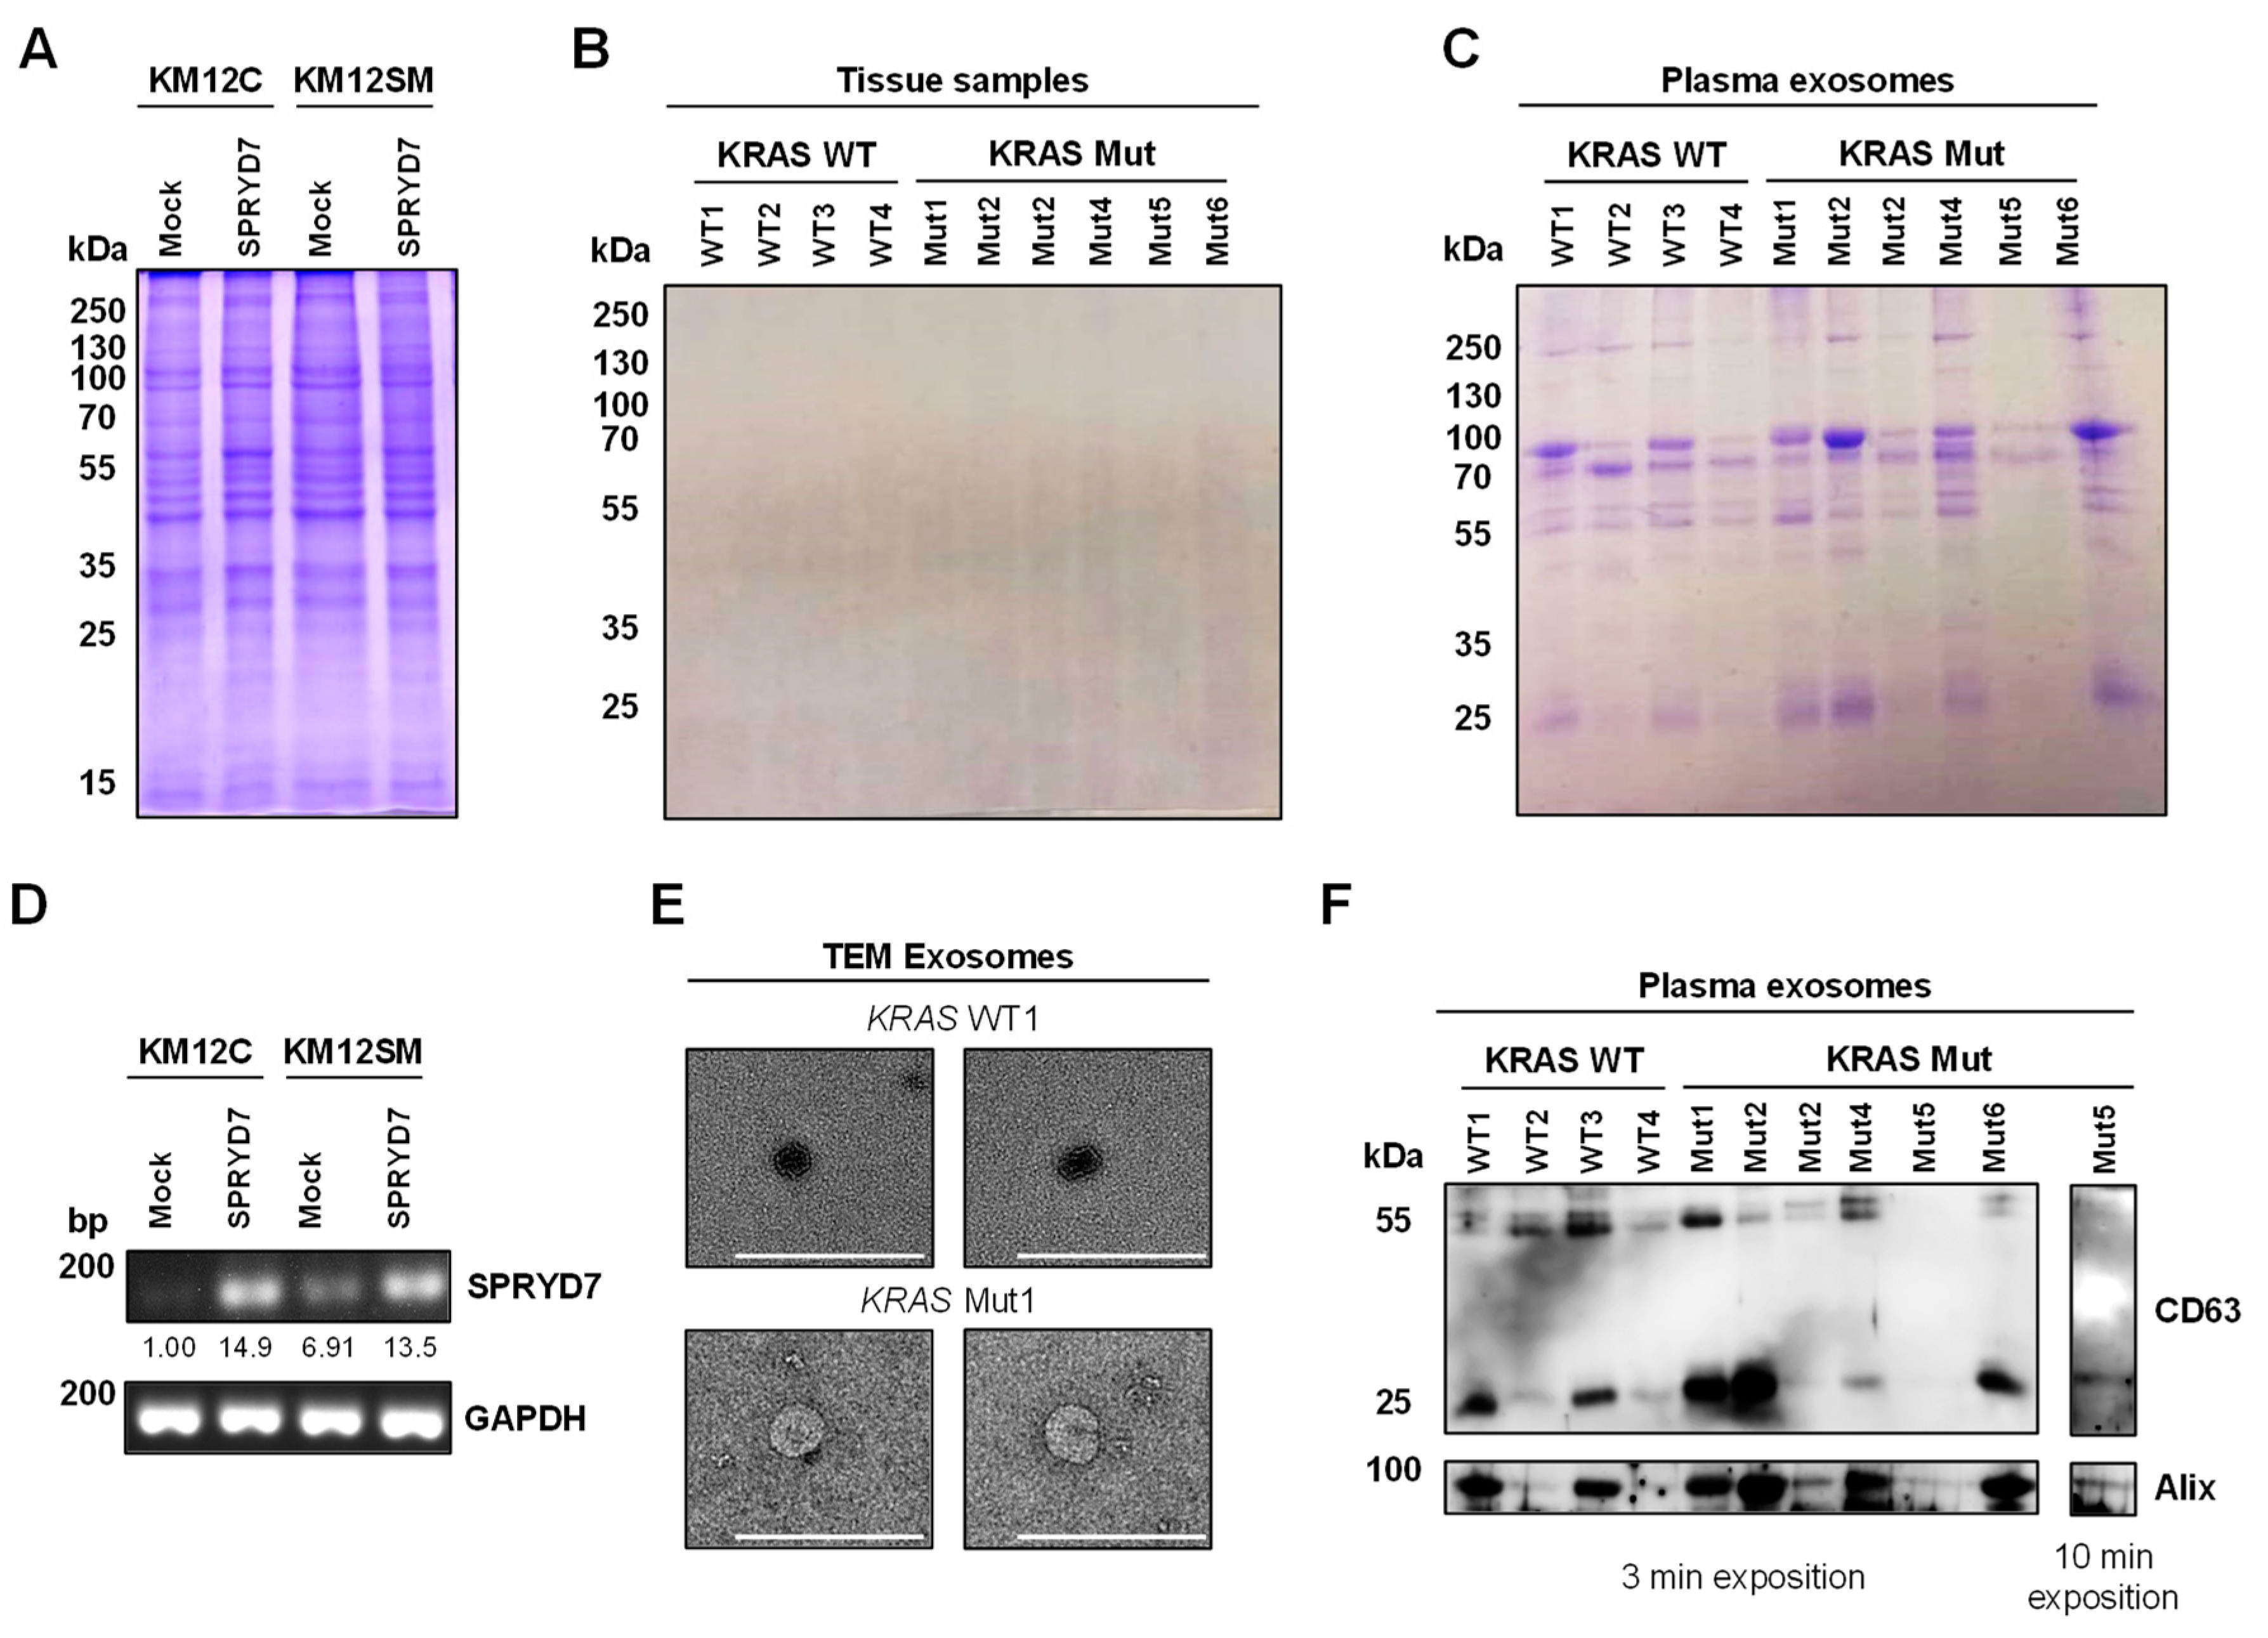
2.4. Transmission Electron Microscopy
2.5. Protein Extraction and Quantification
2.6. Western Blot
2.7. RNA Extraction, cDNA Synthesis, and PCR
2.8. 10-Plex TMT Labeling
2.9. LC-MS/MS Analysis
2.10. Data Analysis and Statistical Analysis
3. Results
3.1. Proteomics Analysis of Paired FFPE and Exosome Protein Extracts for the Identification of Dysregulated Proteins Involved in Colorectal Cancer
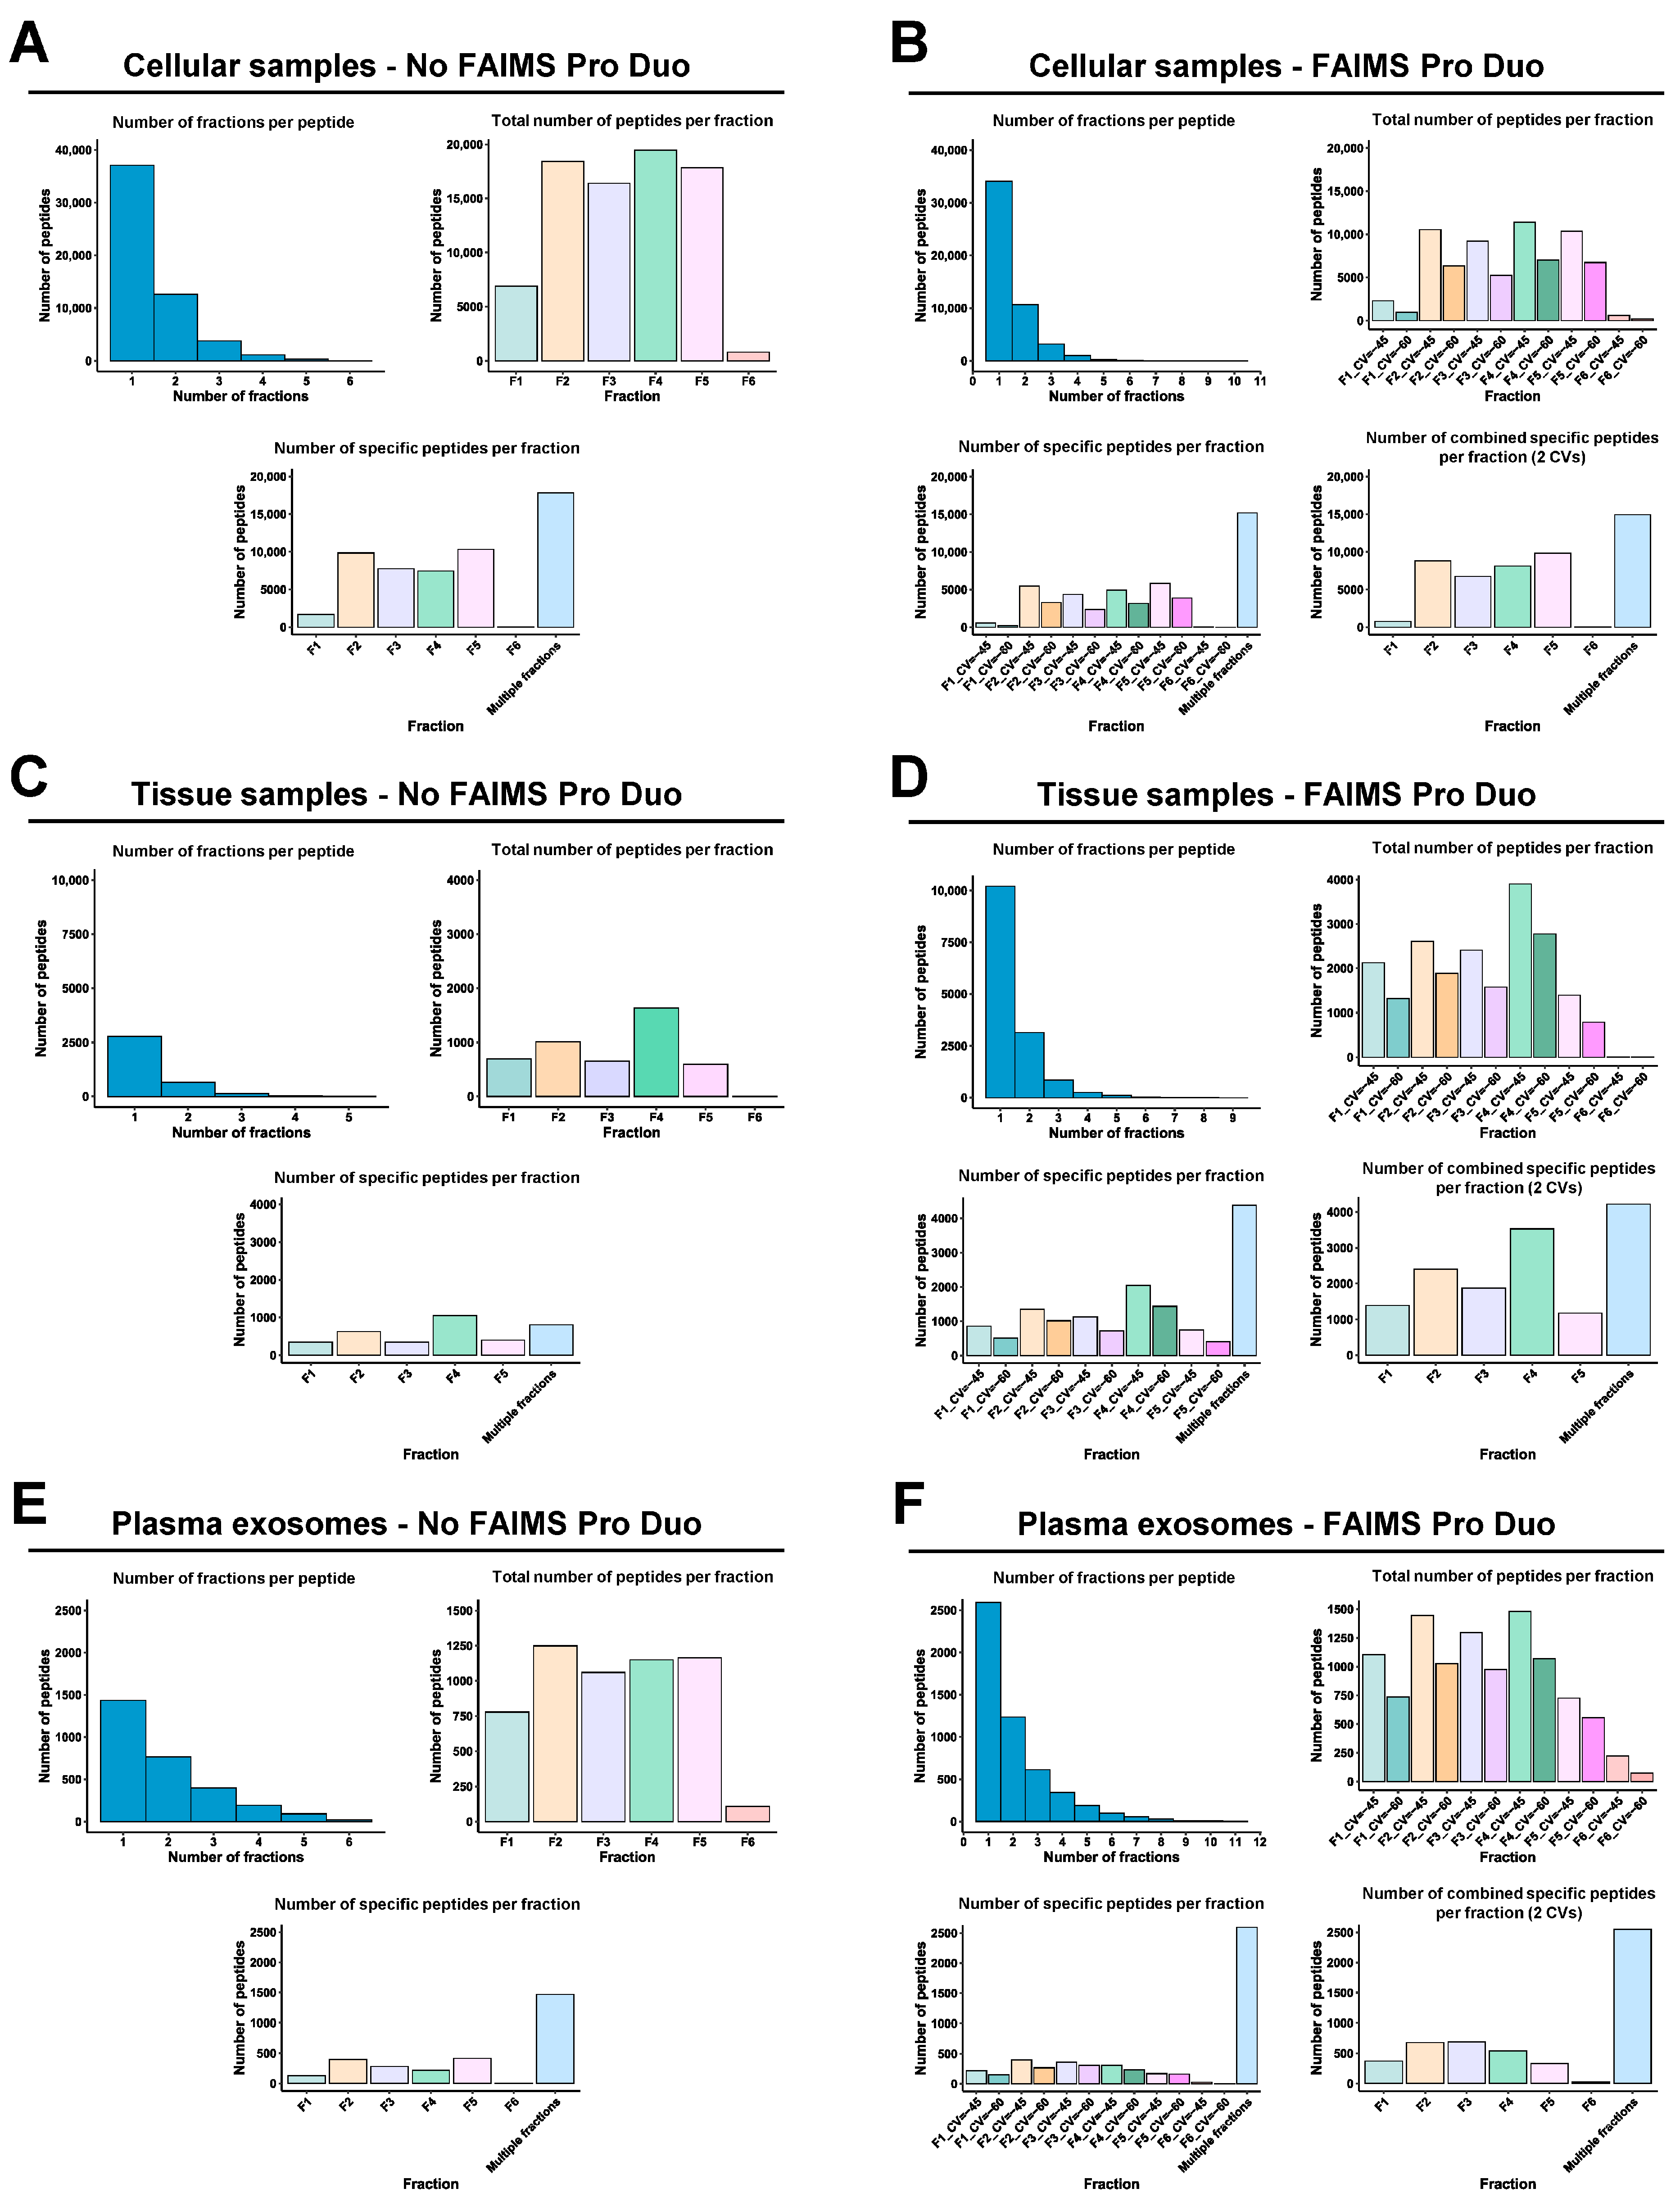
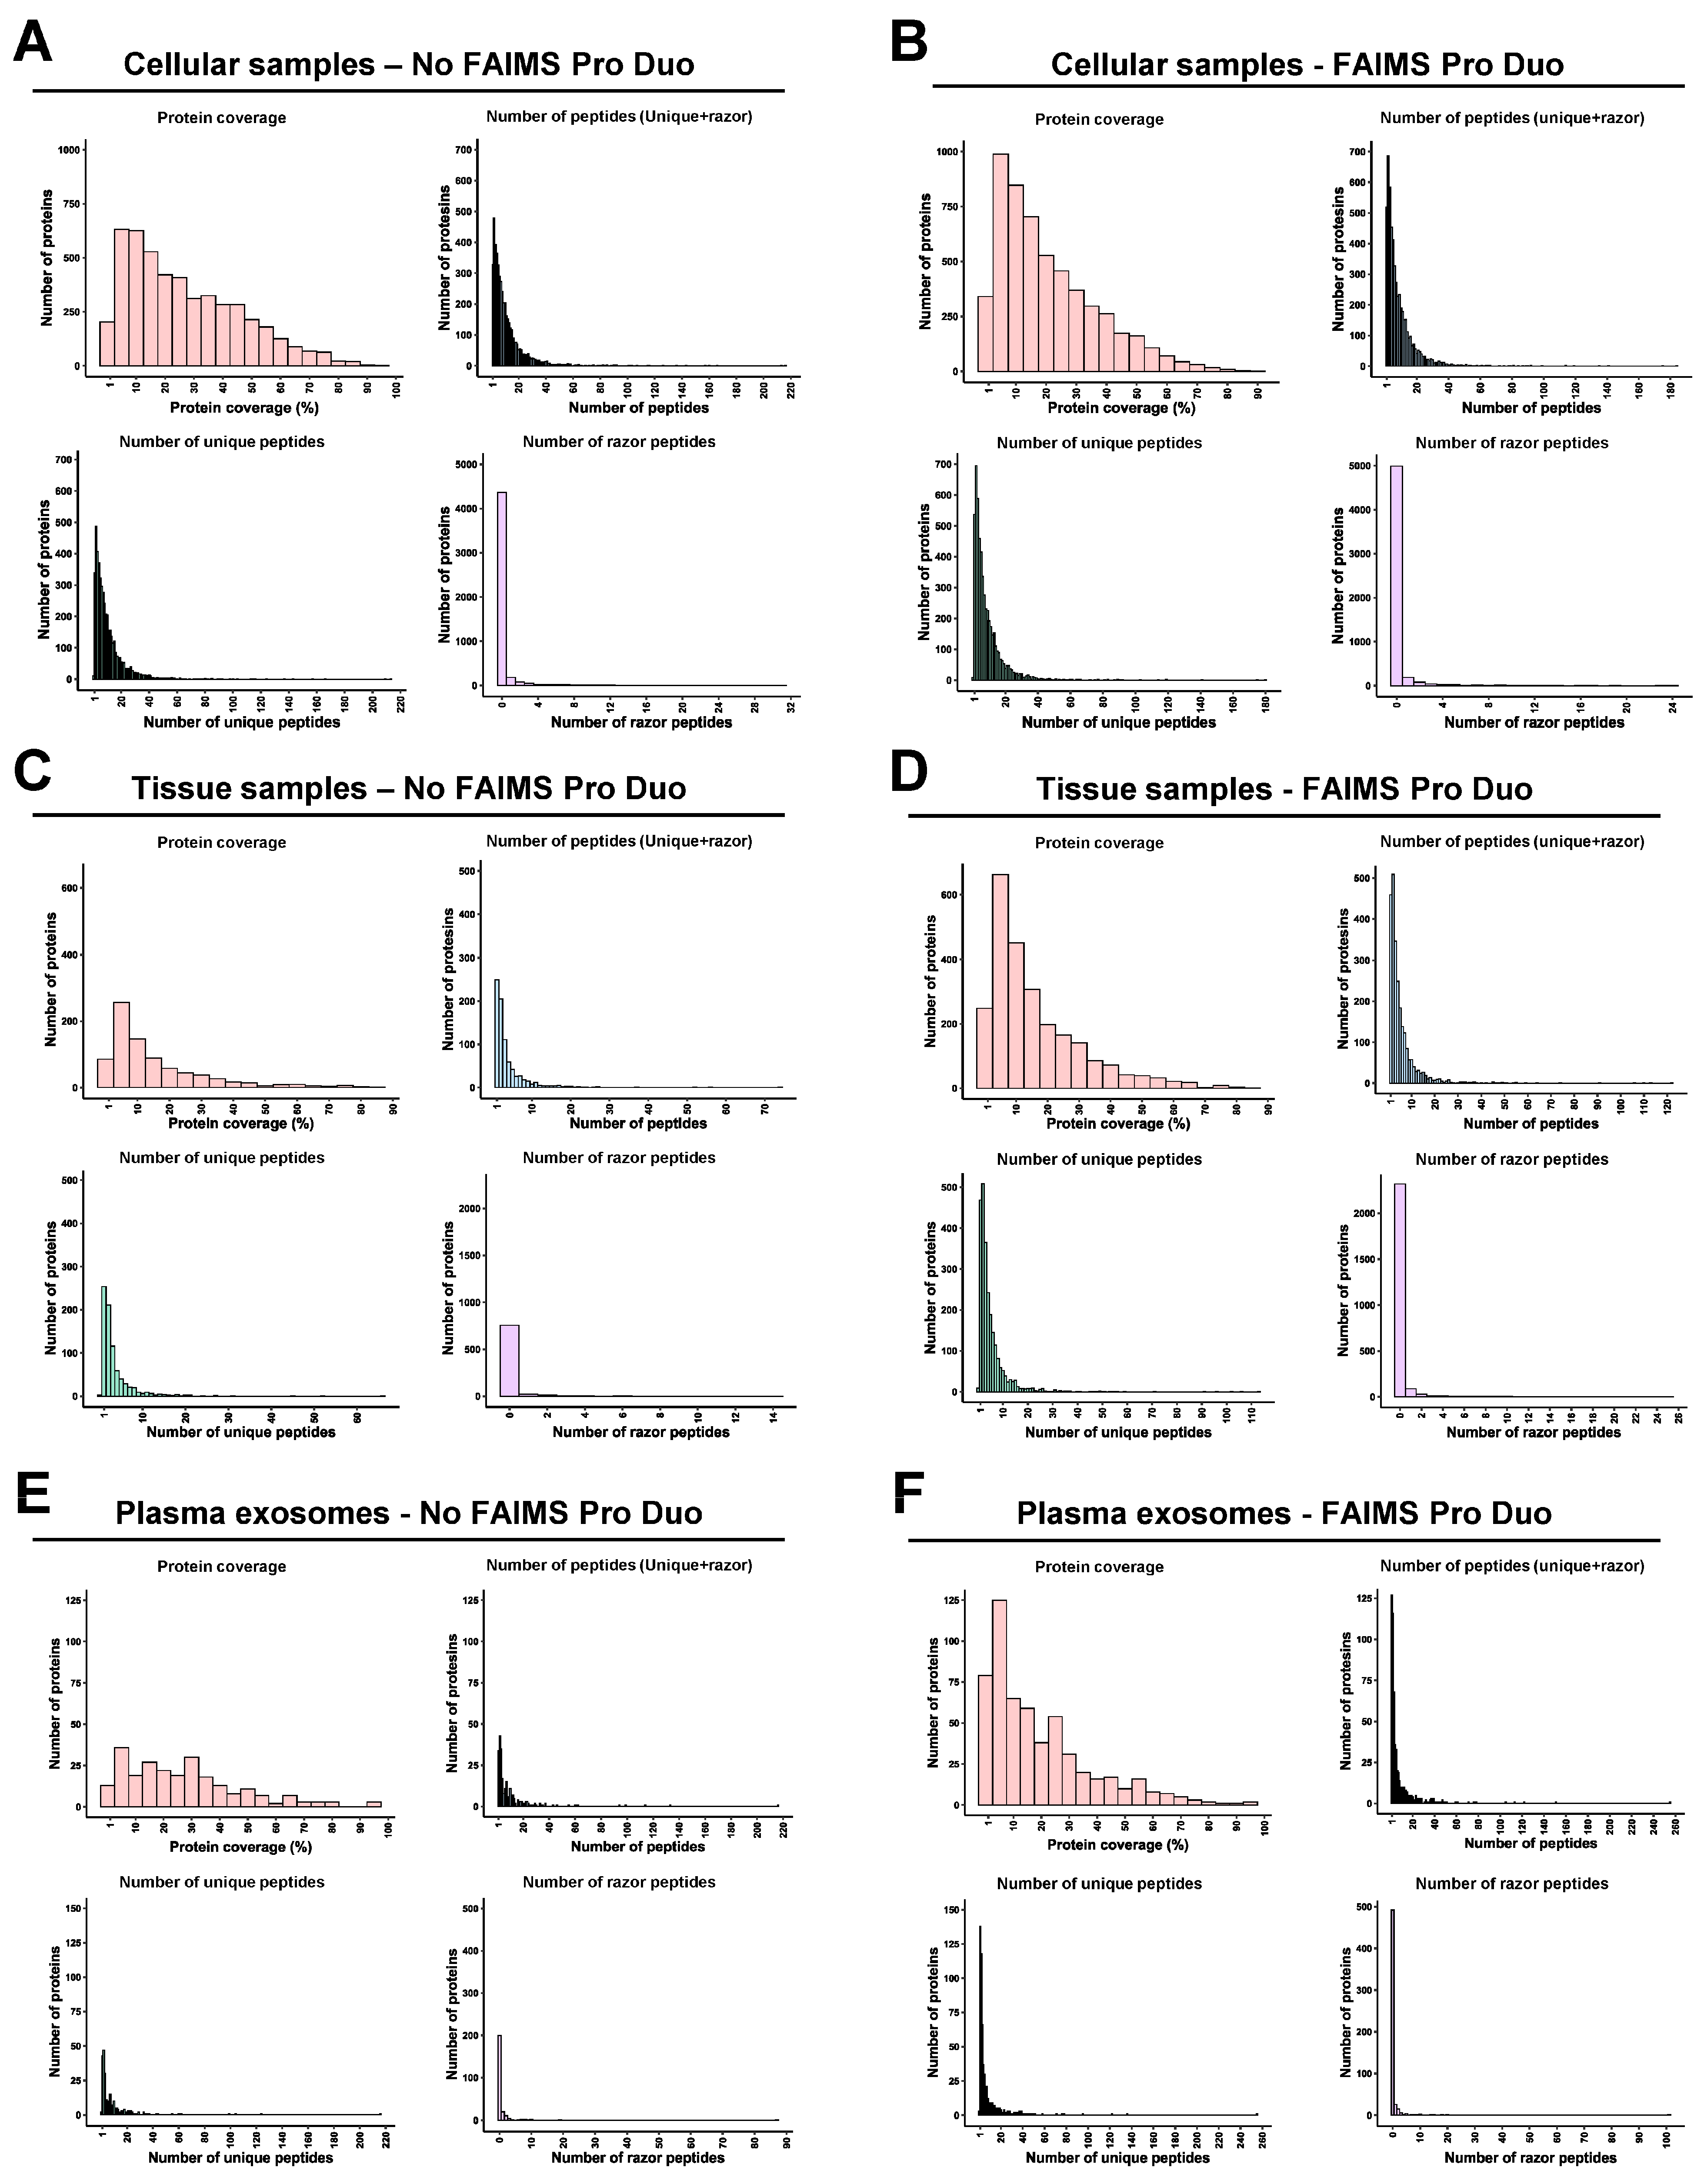
3.2. LC-MS/MS Analysis of Protein Samples
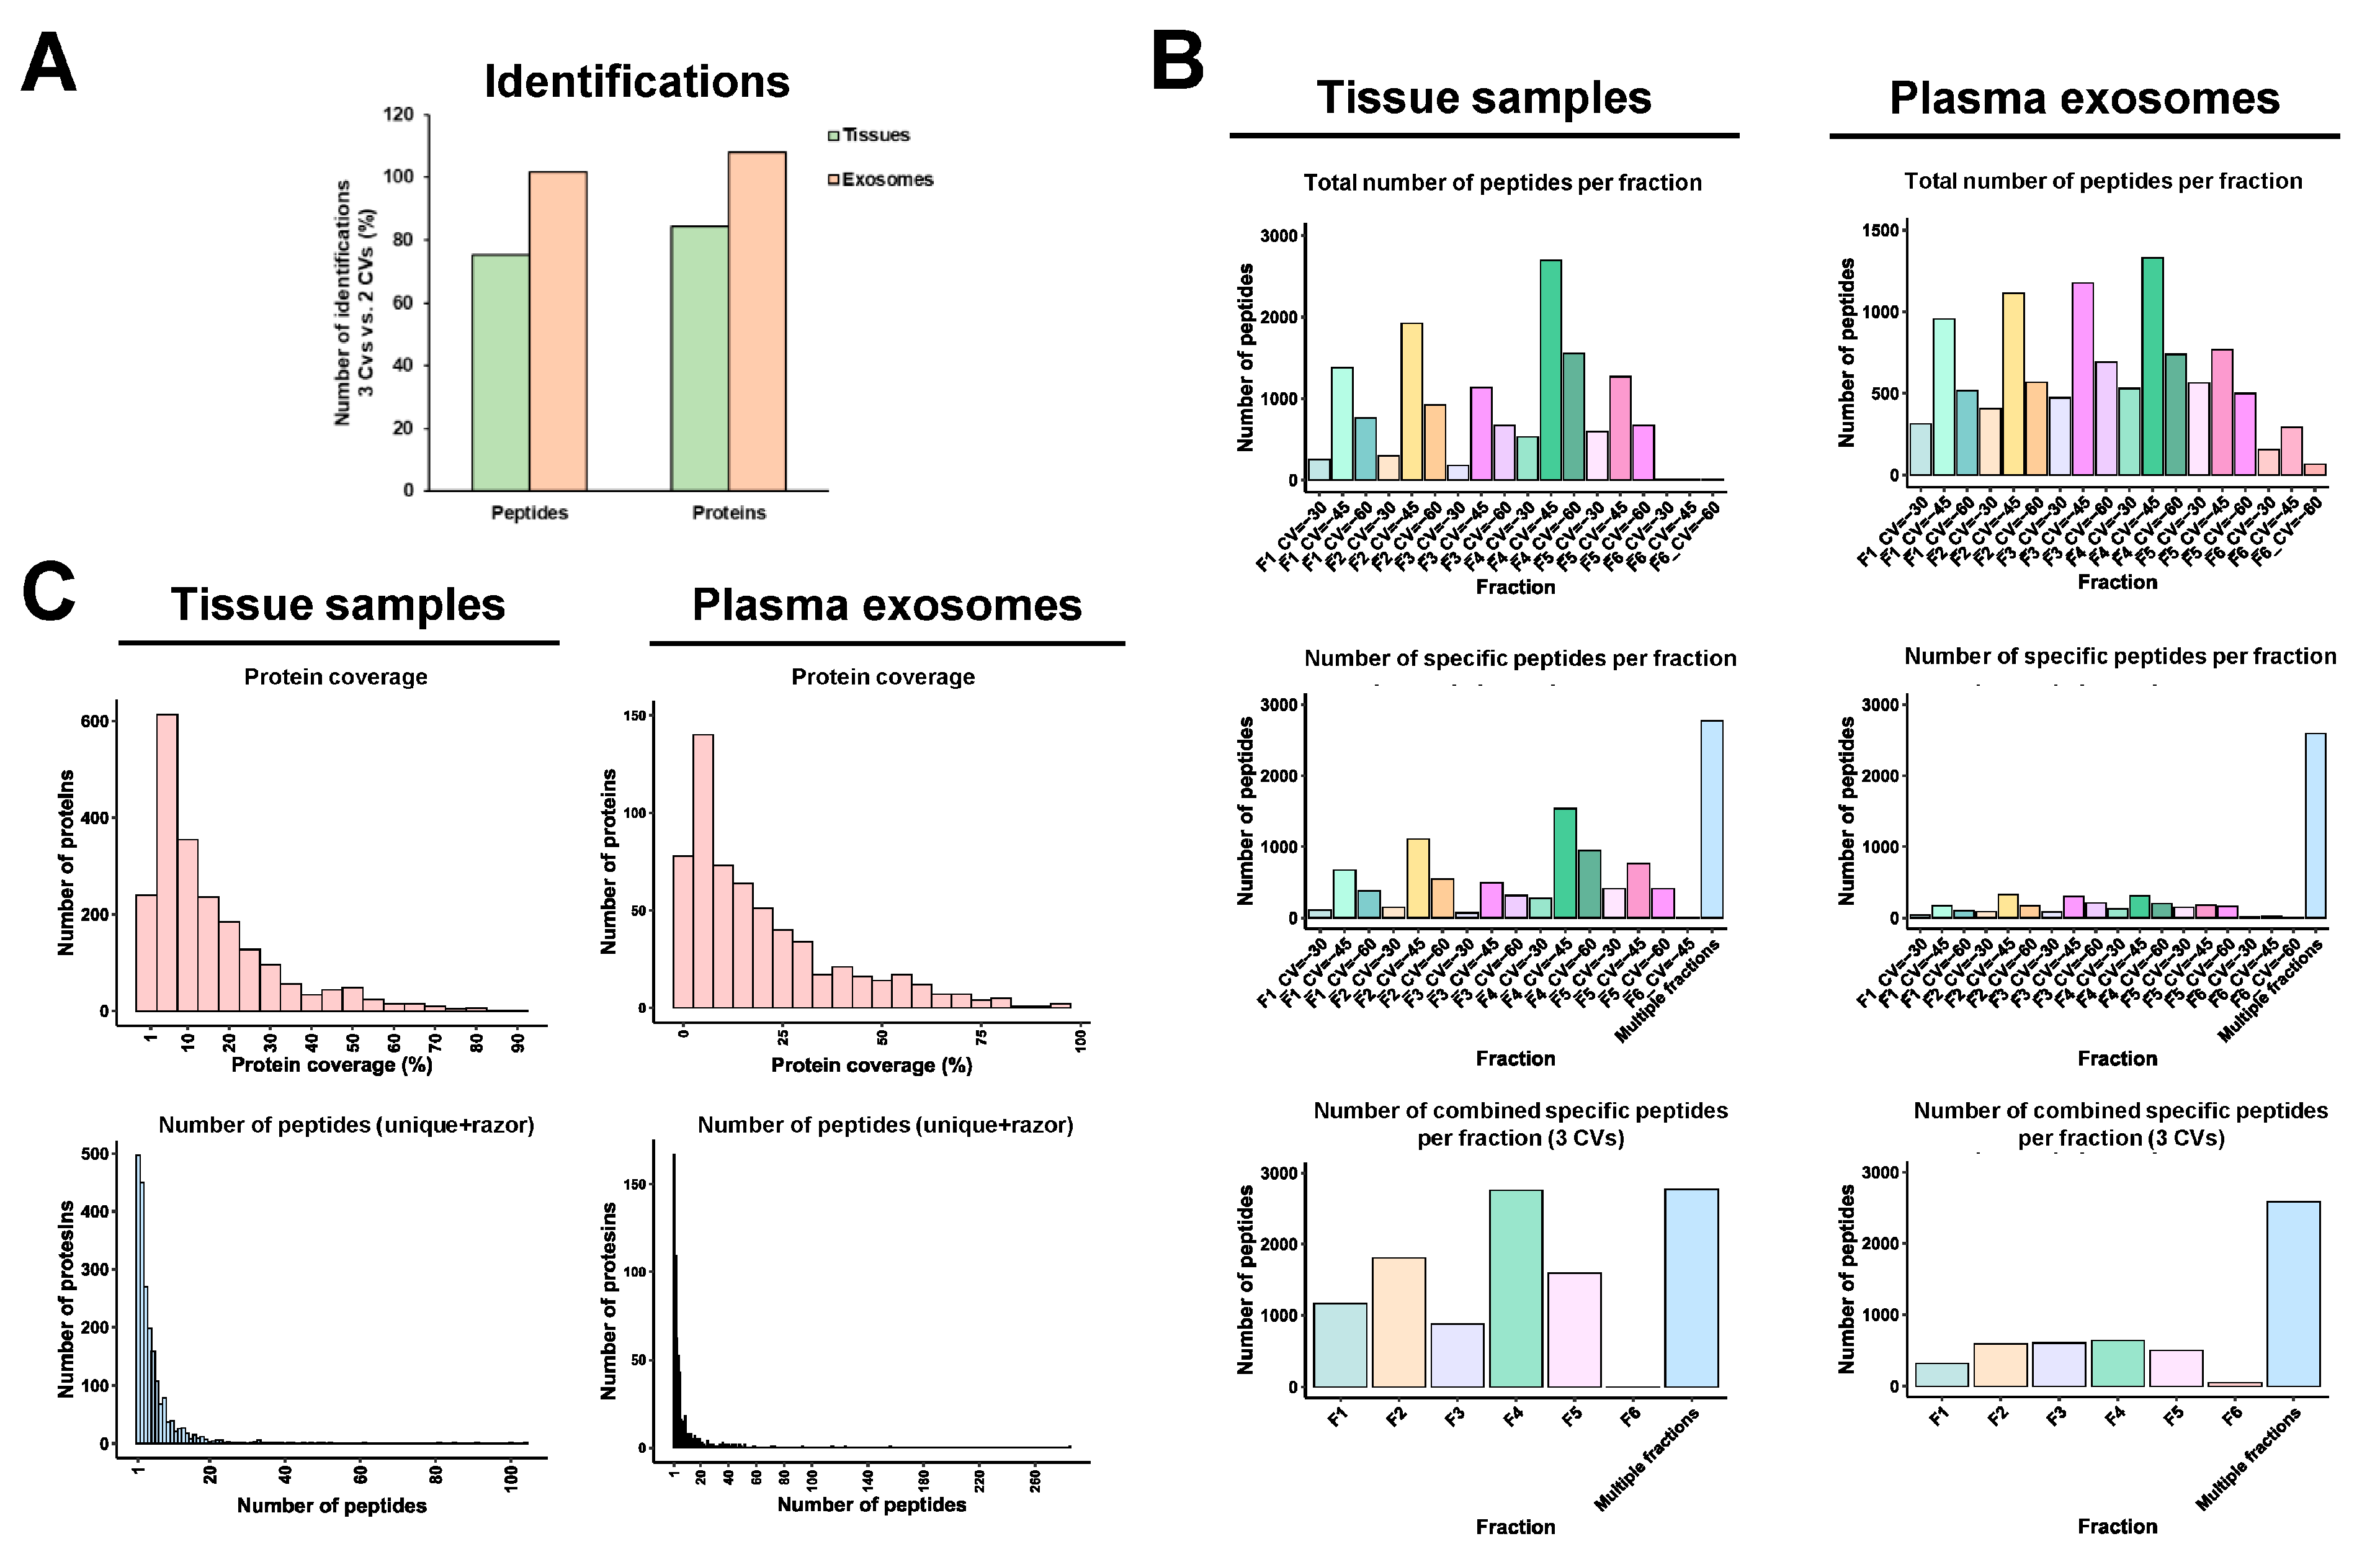
3.3. FAIMS Analyses with Two or Three CVs
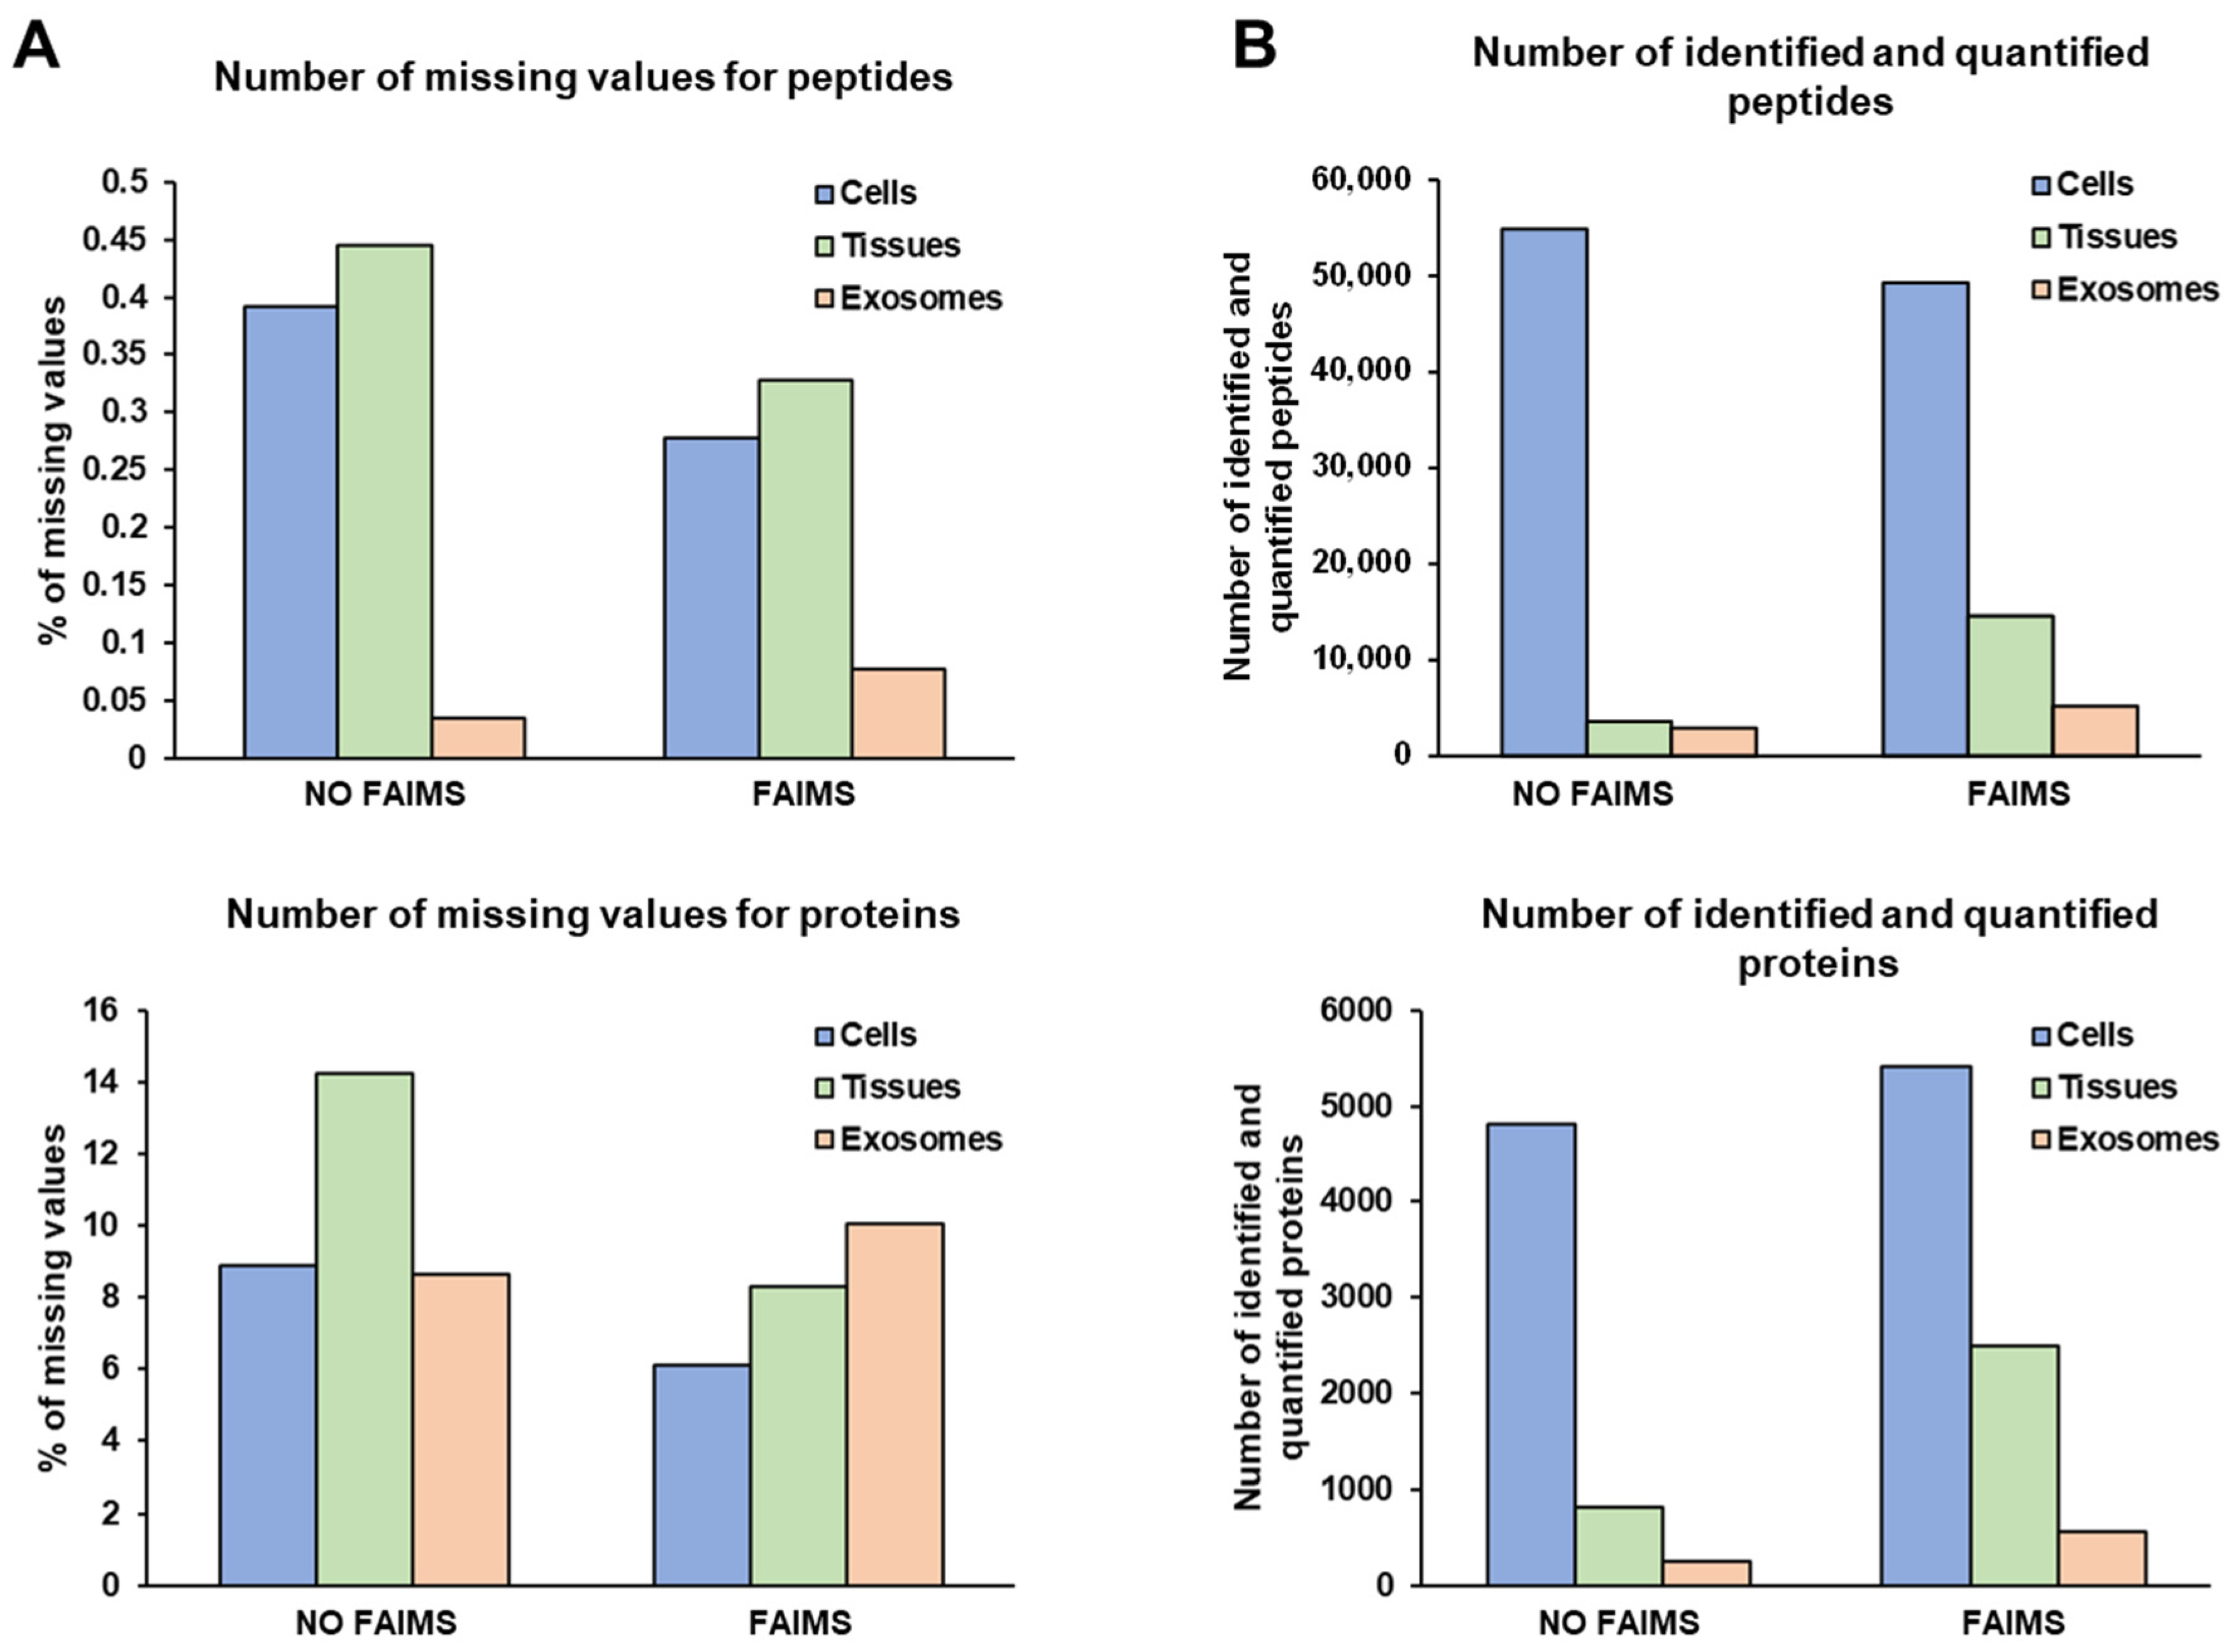
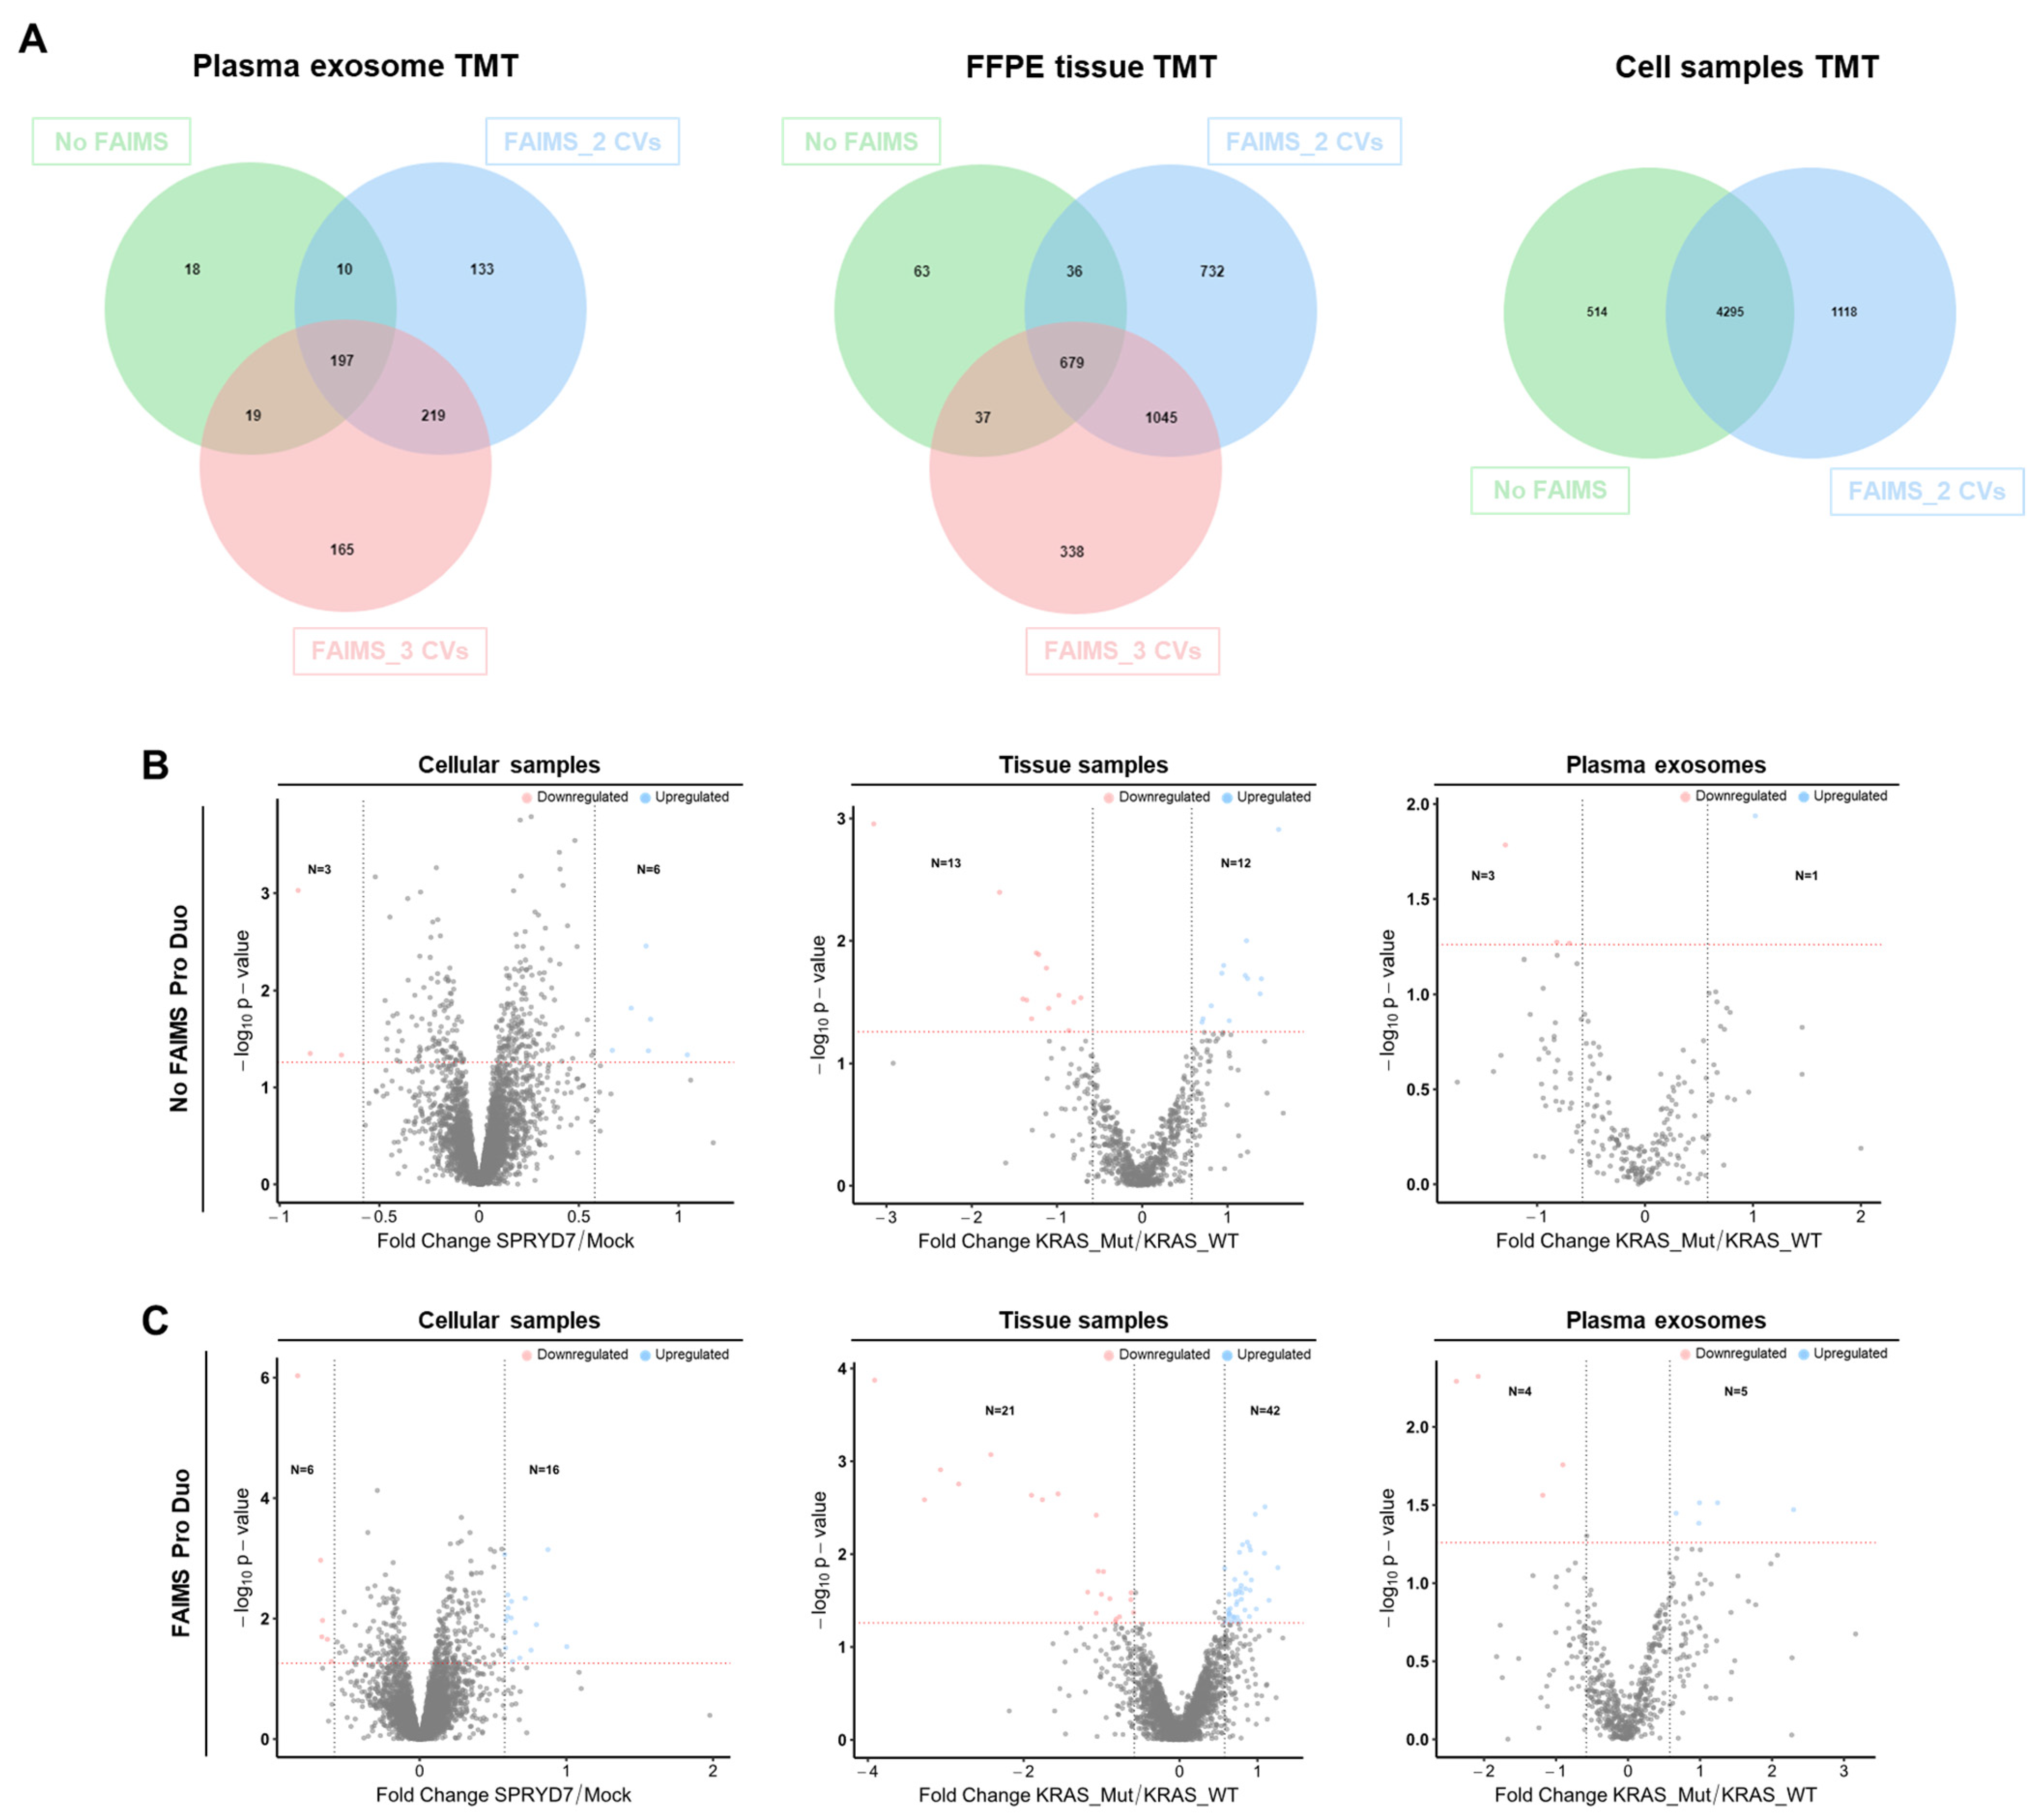
3.4. Improvement in the Identification of Dysregulated Proteins Due to FAIMS
3.5. Role of FAIMS in the MS Analysis of Non-Cross-Linked or Non-Deteriorated Protein Samples
4. Discussion
5. Conclusions
Supplementary Materials
Author Contributions
Funding
Institutional Review Board Statement
Informed Consent Statement
Data Availability Statement
Acknowledgments
Conflicts of Interest
References
- Hughes, C.S.; McConechy, M.K.; Cochrane, D.R.; Nazeran, T.; Karnezis, A.N.; Huntsman, D.G.; Morin, G.B. Quantitative Profiling of Single Formalin Fixed Tumour Sections: Proteomics for translational research. Sci. Rep. 2016, 6, 34949. [Google Scholar] [CrossRef]
- Coscia, F.; Doll, S.; Bech, J.M.; Schweizer, L.; Mund, A.; Lengyel, E.; Lindebjerg, J.; Madsen, G.I.; Moreira, J.M.; Mann, M. A streamlined mass spectrometry-based proteomics workflow for large-scale FFPE tissue analysis. J. Pathol. 2020, 251, 100–112. [Google Scholar] [CrossRef]
- Buczak, K.; Ori, A.; Kirkpatrick, J.M.; Holzer, K.; Dauch, D.; Roessler, S.; Endris, V.; Lasitschka, F.; Parca, L.; Schmidt, A.; et al. Spatial Tissue Proteomics Quantifies Inter- and Intratumor Heterogeneity in Hepatocellular Carcinoma (HCC). Mol. Cell. Proteom. 2018, 17, 810–825. [Google Scholar] [CrossRef] [PubMed]
- Dapic, I.; Baljeu-Neuman, L.; Uwugiaren, N.; Kers, J.; Goodlett, D.R.; Corthals, G.L. Proteome analysis of tissues by mass spectrometry. Mass Spectrom. Rev. 2019, 38, 403–441. [Google Scholar] [CrossRef]
- Hughes, C.S.; Moggridge, S.; Muller, T.; Sorensen, P.H.; Morin, G.B.; Krijgsveld, J. Single-pot, solid-phase-enhanced sample preparation for proteomics experiments. Nat. Protoc. 2019, 14, 68–85. [Google Scholar] [CrossRef] [PubMed]
- Muller, T.; Kalxdorf, M.; Longuespee, R.; Kazdal, D.N.; Stenzinger, A.; Krijgsveld, J. Automated sample preparation with SP3 for low-input clinical proteomics. Mol. Syst. Biol. 2020, 16, e9111. [Google Scholar] [CrossRef] [PubMed]
- Colombo, M.; Raposo, G.; Thery, C. Biogenesis, secretion, and intercellular interactions of exosomes and other extracellular vesicles. Annu. Rev. Cell Dev. Biol. 2014, 30, 255–289. [Google Scholar] [CrossRef] [PubMed]
- Vader, P.; Breakefield, X.O.; Wood, M.J. Extracellular vesicles: Emerging targets for cancer therapy. Trends Mol. Med. 2014, 20, 385–393. [Google Scholar] [CrossRef]
- Montero-Calle, A.; Aranguren-Abeigon, I.; Garranzo-Asensio, M.; Poves, C.; Fernández-Aceñero, M.J.; Martínez-Useros, J.; Sanz, R.; Dziaková, J.; Rodriguez-Cobos, J.; Solís-Fernández, G.; et al. Multiplexed biosensing diagnostic platforms detecting autoantibodies to tumor-associated antigens from exosomes released by CRC cells and tissue samples showed high diagnostic ability for colorectal cancer. Engineering 2021, 7, 1393–1412. [Google Scholar] [CrossRef]
- Wee, I.; Syn, N.; Sethi, G.; Goh, B.C.; Wang, L. Role of tumor-derived exosomes in cancer metastasis. Biochim. Biophys. Acta Rev. Cancer 2019, 1871, 12–19. [Google Scholar] [CrossRef]
- Syn, N.; Wang, L.; Sethi, G.; Thiery, J.P.; Goh, B.C. Exosome-Mediated Metastasis: From Epithelial-Mesenchymal Transition to Escape from Immunosurveillance. Trends Pharmacol. Sci. 2016, 37, 606–617. [Google Scholar] [CrossRef] [PubMed]
- Babaei, G.; Asghari Vostakolaei, M.; Rajabi Bazl, M.; Gholizadeh-Ghaleh Aziz, S.; Gholipour, E.; Nejati-Koshki, K. The role of exosomes in the molecular mechanisms of metastasis: Focusing on EMT and cancer stem cells. Life Sci. 2022, 310, 121103. [Google Scholar] [CrossRef] [PubMed]
- Steinbichler, T.B.; Dudas, J.; Riechelmann, H.; Skvortsova, I.I. The role of exosomes in cancer metastasis. Semin. Cancer Biol. 2017, 44, 170–181. [Google Scholar] [CrossRef]
- Torres Iglesias, G.; Fernandez-Fournier, M.; Botella, L.; Piniella, D.; Laso-Garcia, F.; Carmen Gomez-de Frutos, M.; Chamorro, B.; Puertas, I.; Tallon Barranco, A.; Fuentes, B.; et al. Brain and immune system-derived extracellular vesicles mediate regulation of complement system, extracellular matrix remodeling, brain repair and antigen tolerance in Multiple sclerosis. Brain Behav. Immun. 2023, 113, 44–55. [Google Scholar] [CrossRef] [PubMed]
- Friedrich, C.; Schallenberg, S.; Kirchner, M.; Ziehm, M.; Niquet, S.; Haji, M.; Beier, C.; Neudecker, J.; Klauschen, F.; Mertins, P. Comprehensive micro-scaled proteome and phosphoproteome characterization of archived retrospective cancer repositories. Nat. Commun. 2021, 12, 3576. [Google Scholar] [CrossRef]
- Kim, Y.J.; Sweet, S.M.M.; Egertson, J.D.; Sedgewick, A.J.; Woo, S.; Liao, W.L.; Merrihew, G.E.; Searle, B.C.; Vaske, C.; Heaton, R.; et al. Data-Independent Acquisition Mass Spectrometry To Quantify Protein Levels in FFPE Tumor Biopsies for Molecular Diagnostics. J. Proteome Res. 2019, 18, 426–435. [Google Scholar] [CrossRef] [PubMed]
- Hebert, A.S.; Prasad, S.; Belford, M.W.; Bailey, D.J.; McAlister, G.C.; Abbatiello, S.E.; Huguet, R.; Wouters, E.R.; Dunyach, J.J.; Brademan, D.R.; et al. Comprehensive Single-Shot Proteomics with FAIMS on a Hybrid Orbitrap Mass Spectrometer. Anal. Chem. 2018, 90, 9529–9537. [Google Scholar] [CrossRef]
- Bekker-Jensen, D.B.; Martinez-Val, A.; Steigerwald, S.; Ruther, P.; Fort, K.L.; Arrey, T.N.; Harder, A.; Makarov, A.; Olsen, J.V. A Compact Quadrupole-Orbitrap Mass Spectrometer with FAIMS Interface Improves Proteome Coverage in Short LC Gradients. Mol. Cell. Proteom. 2020, 19, 716–729. [Google Scholar] [CrossRef] [PubMed]
- Winter, D.L.; Wilkins, M.R.; Donald, W.A. Differential Ion Mobility-Mass Spectrometry for Detailed Analysis of the Proteome. Trends Biotechnol. 2019, 37, 198–213. [Google Scholar] [CrossRef]
- Rosting, C.; Yu, J.; Cooper, H.J. High Field Asymmetric Waveform Ion Mobility Spectrometry in Nontargeted Bottom-up Proteomics of Dried Blood Spots. J. Proteome Res. 2018, 17, 1997–2004. [Google Scholar] [CrossRef] [PubMed]
- Cooper, H.J. To What Extent is FAIMS Beneficial in the Analysis of Proteins? J. Am. Soc. Mass Spectrom. 2016, 27, 566–577. [Google Scholar] [CrossRef]
- Swearingen, K.E.; Hoopmann, M.R.; Johnson, R.S.; Saleem, R.A.; Aitchison, J.D.; Moritz, R.L. Nanospray FAIMS fractionation provides significant increases in proteome coverage of unfractionated complex protein digests. Mol. Cell Proteom. 2012, 11, M111.014985. [Google Scholar] [CrossRef] [PubMed]
- Barderas, R.; Villar-Vazquez, R.; Fernandez-Acenero, M.J.; Babel, I.; Pelaez-Garcia, A.; Torres, S.; Casal, J.I. Sporadic colon cancer murine models demonstrate the value of autoantibody detection for preclinical cancer diagnosis. Sci. Rep. 2013, 3, 2938. [Google Scholar] [CrossRef]
- Babel, I.; Barderas, R.; Díaz-Uriarte, R.; Martínez-Torrecuadrada, J.L.; Sánchez-Carbayo, M.; Casal, J.I. Identification of tumor-associated autoantigens for the diagnosis of colorectal cancer in serum using high density protein microarrays. Mol. Cell. Proteom. 2009, 8, 13. [Google Scholar] [CrossRef]
- Barderas, R.; Babel, I.; Diaz-Uriarte, R.; Moreno, V.; Suarez, A.; Bonilla, F.; Villar-Vazquez, R.; Capella, G.; Casal, J.I. An optimized predictor panel for colorectal cancer diagnosis based on the combination of tumor-associated antigens obtained from protein and phage microarrays. J. Proteom. 2012, 75, 4647–4655. [Google Scholar] [CrossRef]
- Montero-Calle, A.; Coronel, R.; Garranzo-Asensio, M.; Solis-Fernandez, G.; Rabano, A.; de Los Rios, V.; Fernandez-Acenero, M.J.; Mendes, M.L.; Martinez-Useros, J.; Megias, D.; et al. Proteomics analysis of prefrontal cortex of Alzheimer’s disease patients revealed dysregulated proteins in the disease and novel proteins associated with amyloid-beta pathology. Cell. Mol. Life Sci. 2023, 80, 141. [Google Scholar] [CrossRef]
- Garranzo-Asensio, M.; San Segundo-Acosta, P.; Martinez-Useros, J.; Montero-Calle, A.; Fernandez-Acenero, M.J.; Haggmark-Manberg, A.; Pelaez-Garcia, A.; Villalba, M.; Rabano, A.; Nilsson, P.; et al. Identification of prefrontal cortex protein alterations in Alzheimer’s disease. Oncotarget 2018, 9, 10847–10867. [Google Scholar] [CrossRef]
- Garranzo-Asensio, M.; Solis-Fernandez, G.; Montero-Calle, A.; Garcia-Martinez, J.M.; Fiuza, M.C.; Pallares, P.; Palacios-Garcia, N.; Garcia-Jimenez, C.; Guzman-Aranguez, A.; Barderas, R. Seroreactivity Against Tyrosine Phosphatase PTPRN Links Type 2 Diabetes and Colorectal Cancer and Identifies a Potential Diagnostic and Therapeutic Target. Diabetes 2022, 71, 497–510. [Google Scholar] [CrossRef]
- Solis-Fernandez, G.; Montero-Calle, A.; Sanchez-Martinez, M.; Pelaez-Garcia, A.; Fernandez-Acenero, M.J.; Pallares, P.; Alonso-Navarro, M.; Mendiola, M.; Hendrix, J.; Hardisson, D.; et al. Aryl-hydrocarbon receptor-interacting protein regulates tumorigenic and metastatic properties of colorectal cancer cells driving liver metastasis. Br. J. Cancer 2022, 126, 1604–1615. [Google Scholar] [CrossRef]
- Montero-Calle, A.; Lopez-Janeiro, A.; Mendes, M.L.; Perez-Hernandez, D.; Echevarria, I.; Ruz-Caracuel, I.; Heredia-Soto, V.; Mendiola, M.; Hardisson, D.; Argueso, P.; et al. In-depth quantitative proteomics analysis revealed C1GALT1 depletion in ECC-1 cells mimics an aggressive endometrial cancer phenotype observed in cancer patients with low C1GALT1 expression. Cell. Oncol. 2023, 46, 697–715. [Google Scholar] [CrossRef]
- Solis-Fernandez, G.; Montero-Calle, A.; Martinez-Useros, J.; Lopez-Janeiro, A.; de Los Rios, V.; Sanz, R.; Dziakova, J.; Milagrosa, E.; Fernandez-Acenero, M.J.; Pelaez-Garcia, A.; et al. Spatial Proteomic Analysis of Isogenic Metastatic Colorectal Cancer Cells Reveals Key Dysregulated Proteins Associated with Lymph Node, Liver, and Lung Metastasis. Cells 2022, 11, 447. [Google Scholar] [CrossRef]
- Pelaez-Garcia, A.; Barderas, R.; Batlle, R.; Vinas-Castells, R.; Bartolome, R.A.; Torres, S.; Mendes, M.; Lopez-Lucendo, M.; Mazzolini, R.; Bonilla, F.; et al. A proteomic analysis reveals that Snail regulates the expression of the nuclear orphan receptor Nuclear Receptor Subfamily 2 Group F Member 6 (Nr2f6) and interleukin 17 (IL-17) to inhibit adipocyte differentiation. Mol. Cell. Proteom. 2015, 14, 303–315. [Google Scholar] [CrossRef] [PubMed]
- van Ooijen, M.P.; Jong, V.L.; Eijkemans, M.J.C.; Heck, A.J.R.; Andeweg, A.C.; Binai, N.A.; van den Ham, H.J. Identification of differentially expressed peptides in high-throughput proteomics data. Brief. Bioinform. 2018, 19, 971–981. [Google Scholar] [CrossRef] [PubMed]
- Kammers, K.; Cole, R.N.; Tiengwe, C.; Ruczinski, I. Detecting Significant Changes in Protein Abundance. EuPA Open Proteom. 2015, 7, 11–19. [Google Scholar] [CrossRef] [PubMed]
- Pursiheimo, A.; Vehmas, A.P.; Afzal, S.; Suomi, T.; Chand, T.; Strauss, L.; Poutanen, M.; Rokka, A.; Corthals, G.L.; Elo, L.L. Optimization of Statistical Methods Impact on Quantitative Proteomics Data. J. Proteome Res. 2015, 14, 4118–4126. [Google Scholar] [CrossRef] [PubMed]
- Ting, L.; Cowley, M.J.; Hoon, S.L.; Guilhaus, M.; Raftery, M.J.; Cavicchioli, R. Normalization and statistical analysis of quantitative proteomics data generated by metabolic labeling. Mol. Cell. Proteom. 2009, 8, 2227–2242. [Google Scholar] [CrossRef]
- Garranzo-Asensio, M.; Rodriguez-Cobos, J.; San Millan, C.; Poves, C.; Fernandez-Acenero, M.J.; Pastor-Morate, D.; Vinal, D.; Montero-Calle, A.; Solis-Fernandez, G.; Ceron, M.A.; et al. In-depth proteomics characterization of ∆Np73 effectors identifies key proteins with diagnostic potential implicated in lymphangiogenesis, vasculogenesis and metastasis in colorectal cancer. Mol. Oncol. 2022, 16, 2672–2692. [Google Scholar] [CrossRef] [PubMed]
- Rodriguez-Salas, N.; Dominguez, G.; Barderas, R.; Mendiola, M.; Garcia-Albeniz, X.; Maurel, J.; Batlle, J.F. Clinical relevance of colorectal cancer molecular subtypes. Crit. Rev. Oncol. Hematol. 2017, 109, 9–19. [Google Scholar] [CrossRef]
- Barderas, R.; Babel, I.; Casal, J.I. Colorectal cancer proteomics, molecular characterization and biomarker discovery. Proteomics Clin. Appl. 2010, 4, 159–178. [Google Scholar] [CrossRef]
- Jimenez, C.R.; Knol, J.C.; Meijer, G.A.; Fijneman, R.J. Proteomics of colorectal cancer: Overview of discovery studies and identification of commonly identified cancer-associated proteins and candidate CRC serum markers. J. Proteom. 2010, 73, 1873–1895. [Google Scholar] [CrossRef]
- Lindhorst, P.H.; Hummon, A.B. Proteomics of Colorectal Cancer: Tumors, Organoids, and Cell Cultures—A Minireview. Front. Mol. Biosci. 2020, 7, 604492. [Google Scholar] [CrossRef] [PubMed]
- Wong, G.Y.M.; Diakos, C.; Hugh, T.J.; Molloy, M.P. Proteomic Profiling and Biomarker Discovery in Colorectal Liver Metastases. Int. J. Mol. Sci. 2022, 23, 6091. [Google Scholar] [CrossRef]
- Mendes, M.; Pelaez-Garcia, A.; Lopez-Lucendo, M.; Bartolome, R.A.; Calvino, E.; Barderas, R.; Casal, J.I. Mapping the Spatial Proteome of Metastatic Cells in Colorectal Cancer. Proteomics 2017, 17, 1700094. [Google Scholar] [CrossRef] [PubMed]
- Montero-Calle, A.; Gomez de Cedron, M.; Quijada-Freire, A.; Solis-Fernandez, G.; Lopez-Alonso, V.; Espinosa-Salinas, I.; Pelaez-Garcia, A.; Fernandez-Acenero, M.J.; Ramirez de Molina, A.; Barderas, R. Metabolic Reprogramming Helps to Define Different Metastatic Tropisms in Colorectal Cancer. Front. Oncol. 2022, 12, 903033. [Google Scholar] [CrossRef]
- Zecha, J.; Satpathy, S.; Kanashova, T.; Avanessian, S.C.; Kane, M.H.; Clauser, K.R.; Mertins, P.; Carr, S.A.; Kuster, B. TMT Labeling for the Masses: A Robust and Cost-efficient, In-solution Labeling Approach. Mol. Cell. Proteom. 2019, 18, 1468–1478. [Google Scholar] [CrossRef]
- Li, J.; Van Vranken, J.G.; Pontano Vaites, L.; Schweppe, D.K.; Huttlin, E.L.; Etienne, C.; Nandhikonda, P.; Viner, R.; Robitaille, A.M.; Thompson, A.H.; et al. TMTpro reagents: A set of isobaric labeling mass tags enables simultaneous proteome-wide measurements across 16 samples. Nat. Methods 2020, 17, 399–404. [Google Scholar] [CrossRef]
- Thompson, A.; Schafer, J.; Kuhn, K.; Kienle, S.; Schwarz, J.; Schmidt, G.; Neumann, T.; Johnstone, R.; Mohammed, A.K.; Hamon, C. Tandem mass tags: A novel quantification strategy for comparative analysis of complex protein mixtures by MS/MS. Anal. Chem. 2003, 75, 1895–1904. [Google Scholar] [CrossRef] [PubMed]
- Guevremont, R. High-field asymmetric waveform ion mobility spectrometry: A new tool for mass spectrometry. J. Chromatogr. A 2004, 1058, 3–19. [Google Scholar] [CrossRef]
- Shvartsburg, A.A.; Tang, K.; Smith, R.D. Modeling the resolution and sensitivity of FAIMS analyses. J. Am. Soc. Mass Spectrom. 2004, 15, 1487–1498. [Google Scholar] [CrossRef]
- Kline, J.; Belford, M.; Boeser, C.; Huguet, R.; Fellers, R.; Greer, J.; Greer, S.; Horn, D.; Durbin, K.; Dunyach, J.; et al. Orbitrap mass spectrometry and high-field asymmetric waveform ion mobility spectrometry (FAIMS) enable the in-depth analysis of human serum proteoforms. J. Proteome Res. 2023. [Google Scholar] [CrossRef]
- Kaulich, P.T.; Cassidy, L.; Winkels, K.; Tholey, A. Improved Identification of Proteoforms in Top-Down Proteomics Using FAIMS with Internal CV Stepping. Anal. Chem. 2022, 94, 3600–3607. [Google Scholar] [CrossRef] [PubMed]
- Hatsis, P.; Brockman, A.H.; Wu, J.T. Evaluation of high-field asymmetric waveform ion mobility spectrometry coupled to nanoelectrospray ionization for bioanalysis in drug discovery. Rapid Commun. Mass Spectrom. 2007, 21, 2295–2300. [Google Scholar] [CrossRef] [PubMed]
- Fang, P.; Ji, Y.; Silbern, I.; Viner, R.; Oellerich, T.; Pan, K.T.; Urlaub, H. Evaluation and Optimization of High-Field Asymmetric Waveform Ion-Mobility Spectrometry for Multiplexed Quantitative Site-Specific N-Glycoproteomics. Anal. Chem. 2021, 93, 8846–8855. [Google Scholar] [CrossRef] [PubMed]
- Gregus, M.; Kostas, J.C.; Ray, S.; Abbatiello, S.E.; Ivanov, A.R. Improved Sensitivity of Ultralow Flow LC-MS-Based Proteomic Profiling of Limited Samples Using Monolithic Capillary Columns and FAIMS Technology. Anal. Chem. 2020, 92, 14702–14712. [Google Scholar] [CrossRef]
- Eckert, S.; Chang, Y.C.; Bayer, F.P.; The, M.; Kuhn, P.H.; Weichert, W.; Kuster, B. Evaluation of Disposable Trap Column nanoLC-FAIMS-MS/MS for the Proteomic Analysis of FFPE Tissue. J. Proteome Res. 2021, 20, 5402–5411. [Google Scholar] [CrossRef] [PubMed]
- Cong, Y.; Motamedchaboki, K.; Misal, S.A.; Liang, Y.; Guise, A.J.; Truong, T.; Huguet, R.; Plowey, E.D.; Zhu, Y.; Lopez-Ferrer, D.; et al. Ultrasensitive single-cell proteomics workflow identifies >1000 protein groups per mammalian cell. Chem. Sci. 2020, 12, 1001–1006. [Google Scholar] [CrossRef]
- Sweet, S.; Chain, D.; Yu, W.; Martin, P.; Rebelatto, M.; Chambers, A.; Cecchi, F.; Kim, Y.J. The addition of FAIMS increases targeted proteomics sensitivity from FFPE tumor biopsies. Sci. Rep. 2022, 12, 13876. [Google Scholar] [CrossRef]
- Adoni, K.R.; Cunningham, D.L.; Heath, J.K.; Leney, A.C. FAIMS Enhances the Detection of PTM Crosstalk Sites. J. Proteome Res. 2022, 21, 930–939. [Google Scholar] [CrossRef] [PubMed]
- Griffiths, R.L.; Simmonds, A.L.; Swales, J.G.; Goodwin, R.J.A.; Cooper, H.J. LESA MS Imaging of Heat-Preserved and Frozen Tissue: Benefits of Multistep Static FAIMS. Anal. Chem. 2018, 90, 13306–13314. [Google Scholar] [CrossRef]
- Bridon, G.; Bonneil, E.; Muratore-Schroeder, T.; Caron-Lizotte, O.; Thibault, P. Improvement of phosphoproteome analyses using FAIMS and decision tree fragmentation. application to the insulin signaling pathway in Drosophila melanogaster S2 cells. J. Proteome Res. 2012, 11, 927–940. [Google Scholar] [CrossRef]
- Pfammatter, S.; Wu, Z.; Bonneil, E.; Bailey, D.J.; Prasad, S.; Belford, M.; Rochon, J.; Picard, P.; Lacoursiere, J.; Dunyach, J.J.; et al. Integration of Segmented Ion Fractionation and Differential Ion Mobility on a Q-Exactive Hybrid Quadrupole Orbitrap Mass Spectrometer. Anal. Chem. 2021, 93, 9817–9825. [Google Scholar] [CrossRef]
- Stejskal, K.; Op de Beeck, J.; Durnberger, G.; Jacobs, P.; Mechtler, K. Ultrasensitive NanoLC-MS of Subnanogram Protein Samples Using Second Generation Micropillar Array LC Technology with Orbitrap Exploris 480 and FAIMS PRO. Anal. Chem. 2021, 93, 8704–8710. [Google Scholar] [CrossRef] [PubMed]
- Fan, Y.; Chen, Z.; Zhang, M. Role of exosomes in the pathogenesis, diagnosis, and treatment of central nervous system diseases. J. Transl. Med. 2022, 20, 291. [Google Scholar] [CrossRef] [PubMed]
- Samanta, S.; Rajasingh, S.; Drosos, N.; Zhou, Z.; Dawn, B.; Rajasingh, J. Exosomes: New molecular targets of diseases. Acta Pharmacol. Sin. 2018, 39, 501–513. [Google Scholar] [CrossRef] [PubMed]
- Tian, Y.; Cheng, C.; Wei, Y.; Yang, F.; Li, G. The Role of Exosomes in Inflammatory Diseases and Tumor-Related Inflammation. Cells 2022, 11, 1005. [Google Scholar] [CrossRef]
- Paskeh, M.D.A.; Entezari, M.; Mirzaei, S.; Zabolian, A.; Saleki, H.; Naghdi, M.J.; Sabet, S.; Khoshbakht, M.A.; Hashemi, M.; Hushmandi, K.; et al. Emerging role of exosomes in cancer progression and tumor microenvironment remodeling. J. Hematol. Oncol. 2022, 15, 83. [Google Scholar] [CrossRef] [PubMed]
- Baghban, R.; Roshangar, L.; Jahanban-Esfahlan, R.; Seidi, K.; Ebrahimi-Kalan, A.; Jaymand, M.; Kolahian, S.; Javaheri, T.; Zare, P. Tumor microenvironment complexity and therapeutic implications at a glance. Cell Commun. Signal. 2020, 18, 59. [Google Scholar] [CrossRef] [PubMed]
- Kanbay, M.; Yerlikaya, A.; Sag, A.A.; Ortiz, A.; Kuwabara, M.; Covic, A.; Wiecek, A.; Stenvinkel, P.; Afsar, B. A journey from microenvironment to macroenvironment: The role of metaflammation and epigenetic changes in cardiorenal disease. Clin. Kidney J. 2019, 12, 861–870. [Google Scholar] [CrossRef]
- Perez-Riverol, Y.; Bai, J.; Bandla, C.; Garcia-Seisdedos, D.; Hewapathirana, S.; Kamatchinathan, S.; Kundu, D.J.; Prakash, A.; Frericks-Zipper, A.; Eisenacher, M.; et al. The PRIDE database resources in 2022: A hub for mass spectrometry-based proteomics evidences. Nucleic Acids Res. 2022, 50, D543–D552. [Google Scholar] [CrossRef] [PubMed]


Disclaimer/Publisher’s Note: The statements, opinions and data contained in all publications are solely those of the individual author(s) and contributor(s) and not of MDPI and/or the editor(s). MDPI and/or the editor(s) disclaim responsibility for any injury to people or property resulting from any ideas, methods, instructions or products referred to in the content. |
© 2023 by the authors. Licensee MDPI, Basel, Switzerland. This article is an open access article distributed under the terms and conditions of the Creative Commons Attribution (CC BY) license (https://creativecommons.org/licenses/by/4.0/).
Share and Cite
Montero-Calle, A.; Garranzo-Asensio, M.; Rejas-González, R.; Feliu, J.; Mendiola, M.; Peláez-García, A.; Barderas, R. Benefits of FAIMS to Improve the Proteome Coverage of Deteriorated and/or Cross-Linked TMT 10-Plex FFPE Tissue and Plasma-Derived Exosomes Samples. Proteomes 2023, 11, 35. https://doi.org/10.3390/proteomes11040035
Montero-Calle A, Garranzo-Asensio M, Rejas-González R, Feliu J, Mendiola M, Peláez-García A, Barderas R. Benefits of FAIMS to Improve the Proteome Coverage of Deteriorated and/or Cross-Linked TMT 10-Plex FFPE Tissue and Plasma-Derived Exosomes Samples. Proteomes. 2023; 11(4):35. https://doi.org/10.3390/proteomes11040035
Chicago/Turabian StyleMontero-Calle, Ana, María Garranzo-Asensio, Raquel Rejas-González, Jaime Feliu, Marta Mendiola, Alberto Peláez-García, and Rodrigo Barderas. 2023. "Benefits of FAIMS to Improve the Proteome Coverage of Deteriorated and/or Cross-Linked TMT 10-Plex FFPE Tissue and Plasma-Derived Exosomes Samples" Proteomes 11, no. 4: 35. https://doi.org/10.3390/proteomes11040035