Article

Prediction of Students’ Performances Using Course Analytics Data: A Case of Water Engineering Course at the University of South Australia

School of Natural and Built Environments, University of South Australia, Adelaide, SA 5095, Australia
*
Author to whom correspondence should be addressed.
Educ. Sci. 2019, 9(3), 245; https://doi.org/10.3390/educsci9030245
Submission received: 29 August 2019 / Revised: 12 September 2019 / Accepted: 15 September 2019 / Published: 19 September 2019

Abstract

:
An association between students’ learn-online engagement and academic performance was investigated for a third-year Water Resources Systems Design course at the University of South Australia in 2017. As the patterns of data were non-parametric, Mann-Whitney and Kruskal-Wallis tests were performed using SPSS. It was revealed from the test results that distributions of students’ logins to learn-online site for all categories and sub-categories including gender, international/domestic students and grades were almost similar. Therefore, it is relatively unrealistic to use lean-online engagement data to predict students’ performances. A correlation test was further performed to validate the hypothesis testing results and a weak relationship (Pearson’s r = 0.29) between login to learn-online site and grade was observed. The smaller F ratios of one way ANOVA also validated the test results. Mann-Whitney and Kruskal-Wallis tests can be applied to course analytics data for face-to-face and online courses to understand a better picture about the uses of learn-online engagement data.

1. Introduction

With the advantages of digital technologies, a large number of data ranging from students’ online engagement to grades are available for both face-to-face and online courses in Australian universities; these course analytics data can be observed and analysed in order to improve the quality of teaching and learning environments. There is a global pressure to reform the engineering educational curriculum and teaching and learning environment so that the graduate capabilities of students can be achieved [1,2]. Well defined learning objectives of a course are usually assessed using multiple grading systems, as a single grading system may not be able to measure students’ understandings on course objectives [3]. Cavenett [1] criticised the tradition grading systems of engineering courses and mentioned that there is more focus on assessing the hard technical knowledge and narrow focus on soft skills including professionalism, teamwork and communication. Sustainable development concepts are also required to be included in the curriculum and assessment tasks to make engineering graduates ready for the twenty-first century [4]. According to Jikaran-Doe and Doe [5], utilization of appropriate technology in the teaching environment may influence learning outcomes of a course. Chowdhury [6] noted that modern teaching methods include contemporary practices using project-based learning, problem-based learning, work integrated learning and integrated learning approaches.
Modern teaching and learning environment is enhanced with technology-rich approaches. It includes pedagogical, technological and social elements to support learning styles to be flexible, open and accessible to resources in learning process [7]. According to Han and Ellis [8], face-to-face or online discussions are integral part of teaching and learning environment, as discussions allow learners to have more time to critically read, review, reflect, participate and engage with the topics. Course analytics, sometimes known as Learning Analytics, can be defined as a big data in a digital learning scenario [9]. It aims at collection, analysis and measurement of course dashboard data in order to understand and optimize learning and teaching environment of a course or program [10]. It also aims to interpret and visualize data for improved learning [11]. It is an automatic and effective tracking systems of students’ engagement [12]. Campbell et al. [13] defined the course analytics as “analysing institutional data captured by a learning management system”. It is the analysis of qualitative data gathered from learning behaviour [14]. Course/learning analytics is also referred to as academic analytics; according to Maseleno et al. [15], academic analytics deals with the improvement of teaching and learning process, resource optimization, work balance and institutional key performance measurement through the uses of learners, academics and institutional data. It helps to demonstrate institutional accountability with regard to students’ successes in public. However, course analytics is more specified on the learning process and it empowers the learners to recognize “the wealth of data related to learning” [16]. 
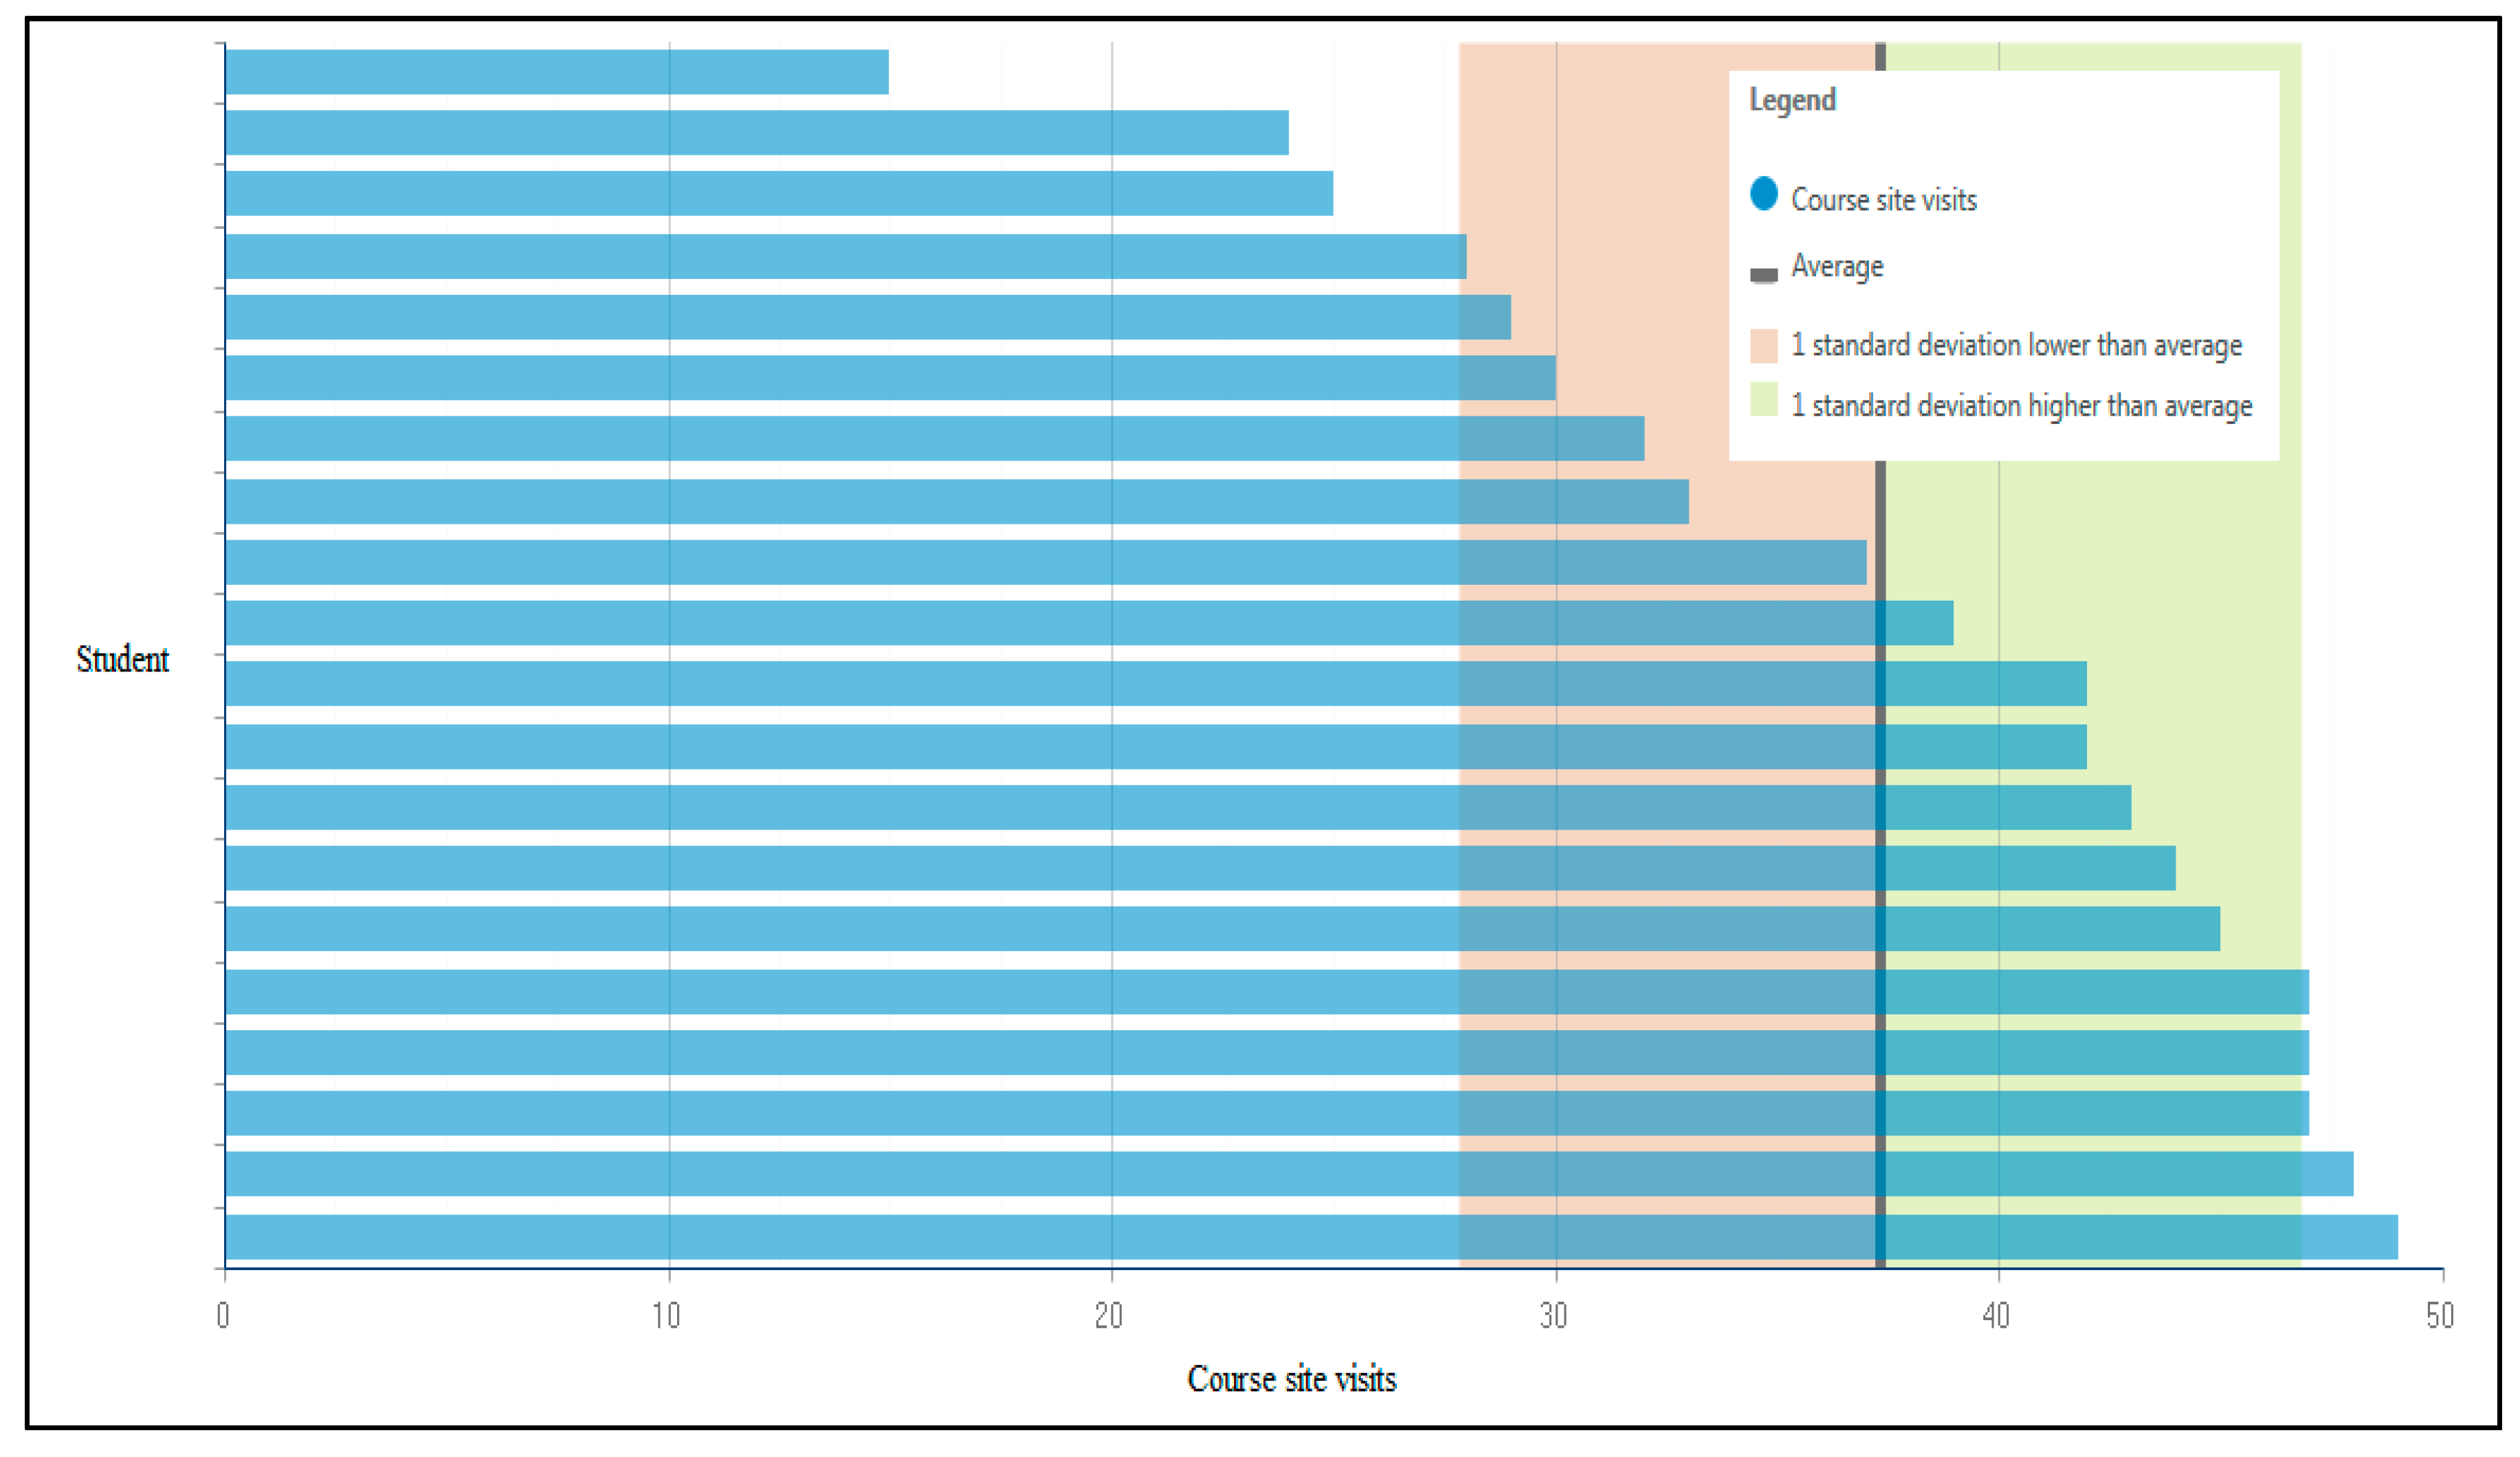
Figure 1 shows a typical visualization of students learn-online engagement data for a course.
Hwang et al. [17] argued that characteristics of a course and students’ learning performances are understood using the conceptual framework of analytics data. According to Lu et al. [18], students’ academic performances can be predicted observing learn-online engagement data even after one-third the duration of a semester. Maseleno et al. [15] demonstrated that course analytics can be utilised to improve the personalized learning. It can also influence the teachers to adjust the delivery mode of instruction [5]. A survey conducted by Tucker et al. [19] to nearly 50,000 students enrolled in Open University of Australia online courses indicated that students were very satisfied for the online interactions with educators and fellow students.
Course analytics data can also be used to identify the students at risk and likely dropout groups [20]. Hachey et al. [21] collected course analytics data for 962 students and observed that students with limited experience in learn-online engagement obtained low grades and had low retention rates. Lu et al. [22] conducted an experiment to evaluate the effectiveness of course analytics in learning activity over 10 weeks in a Taiwanese university and observed that using analytics data improved students’ learning outcomes and engagement. Interventions are required by the instructors for the effective use of course analytics data. Intervention strategies have already been developed by [23], Leeuwen et al. [24] and Syah et al. [25]. Optimum utilization of course analytics data requires academics to upgrade skills for ICT and pedagogy simultaneously in a safe, powerful and cost-effective manner and higher educational institutions should provide adequate supports, professional development trainings and environments to academics [26].
Using course analytics data is challenging, as all data are not meaningful for teaching, learning and educational research purposes [27]. Saqr et al. [12] observed moderate correlation (r = 0.47; n = 131) between frequency of logins and final grades for medical students (n = 131). They also observed weak relationships (r = 0.25; n = 131) between views/hits and final grade for the same study. Beer at al. [28] investigated learning analytics data for 80,000 students and revealed that correlation of students’ engagement with final marks were significantly variable. Moodle provides basic course analytics data for a particular course. Pradas et al. [29] investigated the accountability of Moodle generated course analytics data to predict teamwork and commitment levels in online learning contexts. This study was conducted in a Master’s program in Spain. The results from the study showed no relationship between learn-online engagement and teamwork and commitment acquisition. Conjin et al. [30] investigated the prediction of students’ performances using Moodle data for 17 blended courses and observed that the probability of prediction strongly vary across courses. They also observed that Moodle data provide little value for early intervention. Zacharis [31] observed 52% variation on prediction of final grade using Moodle data.
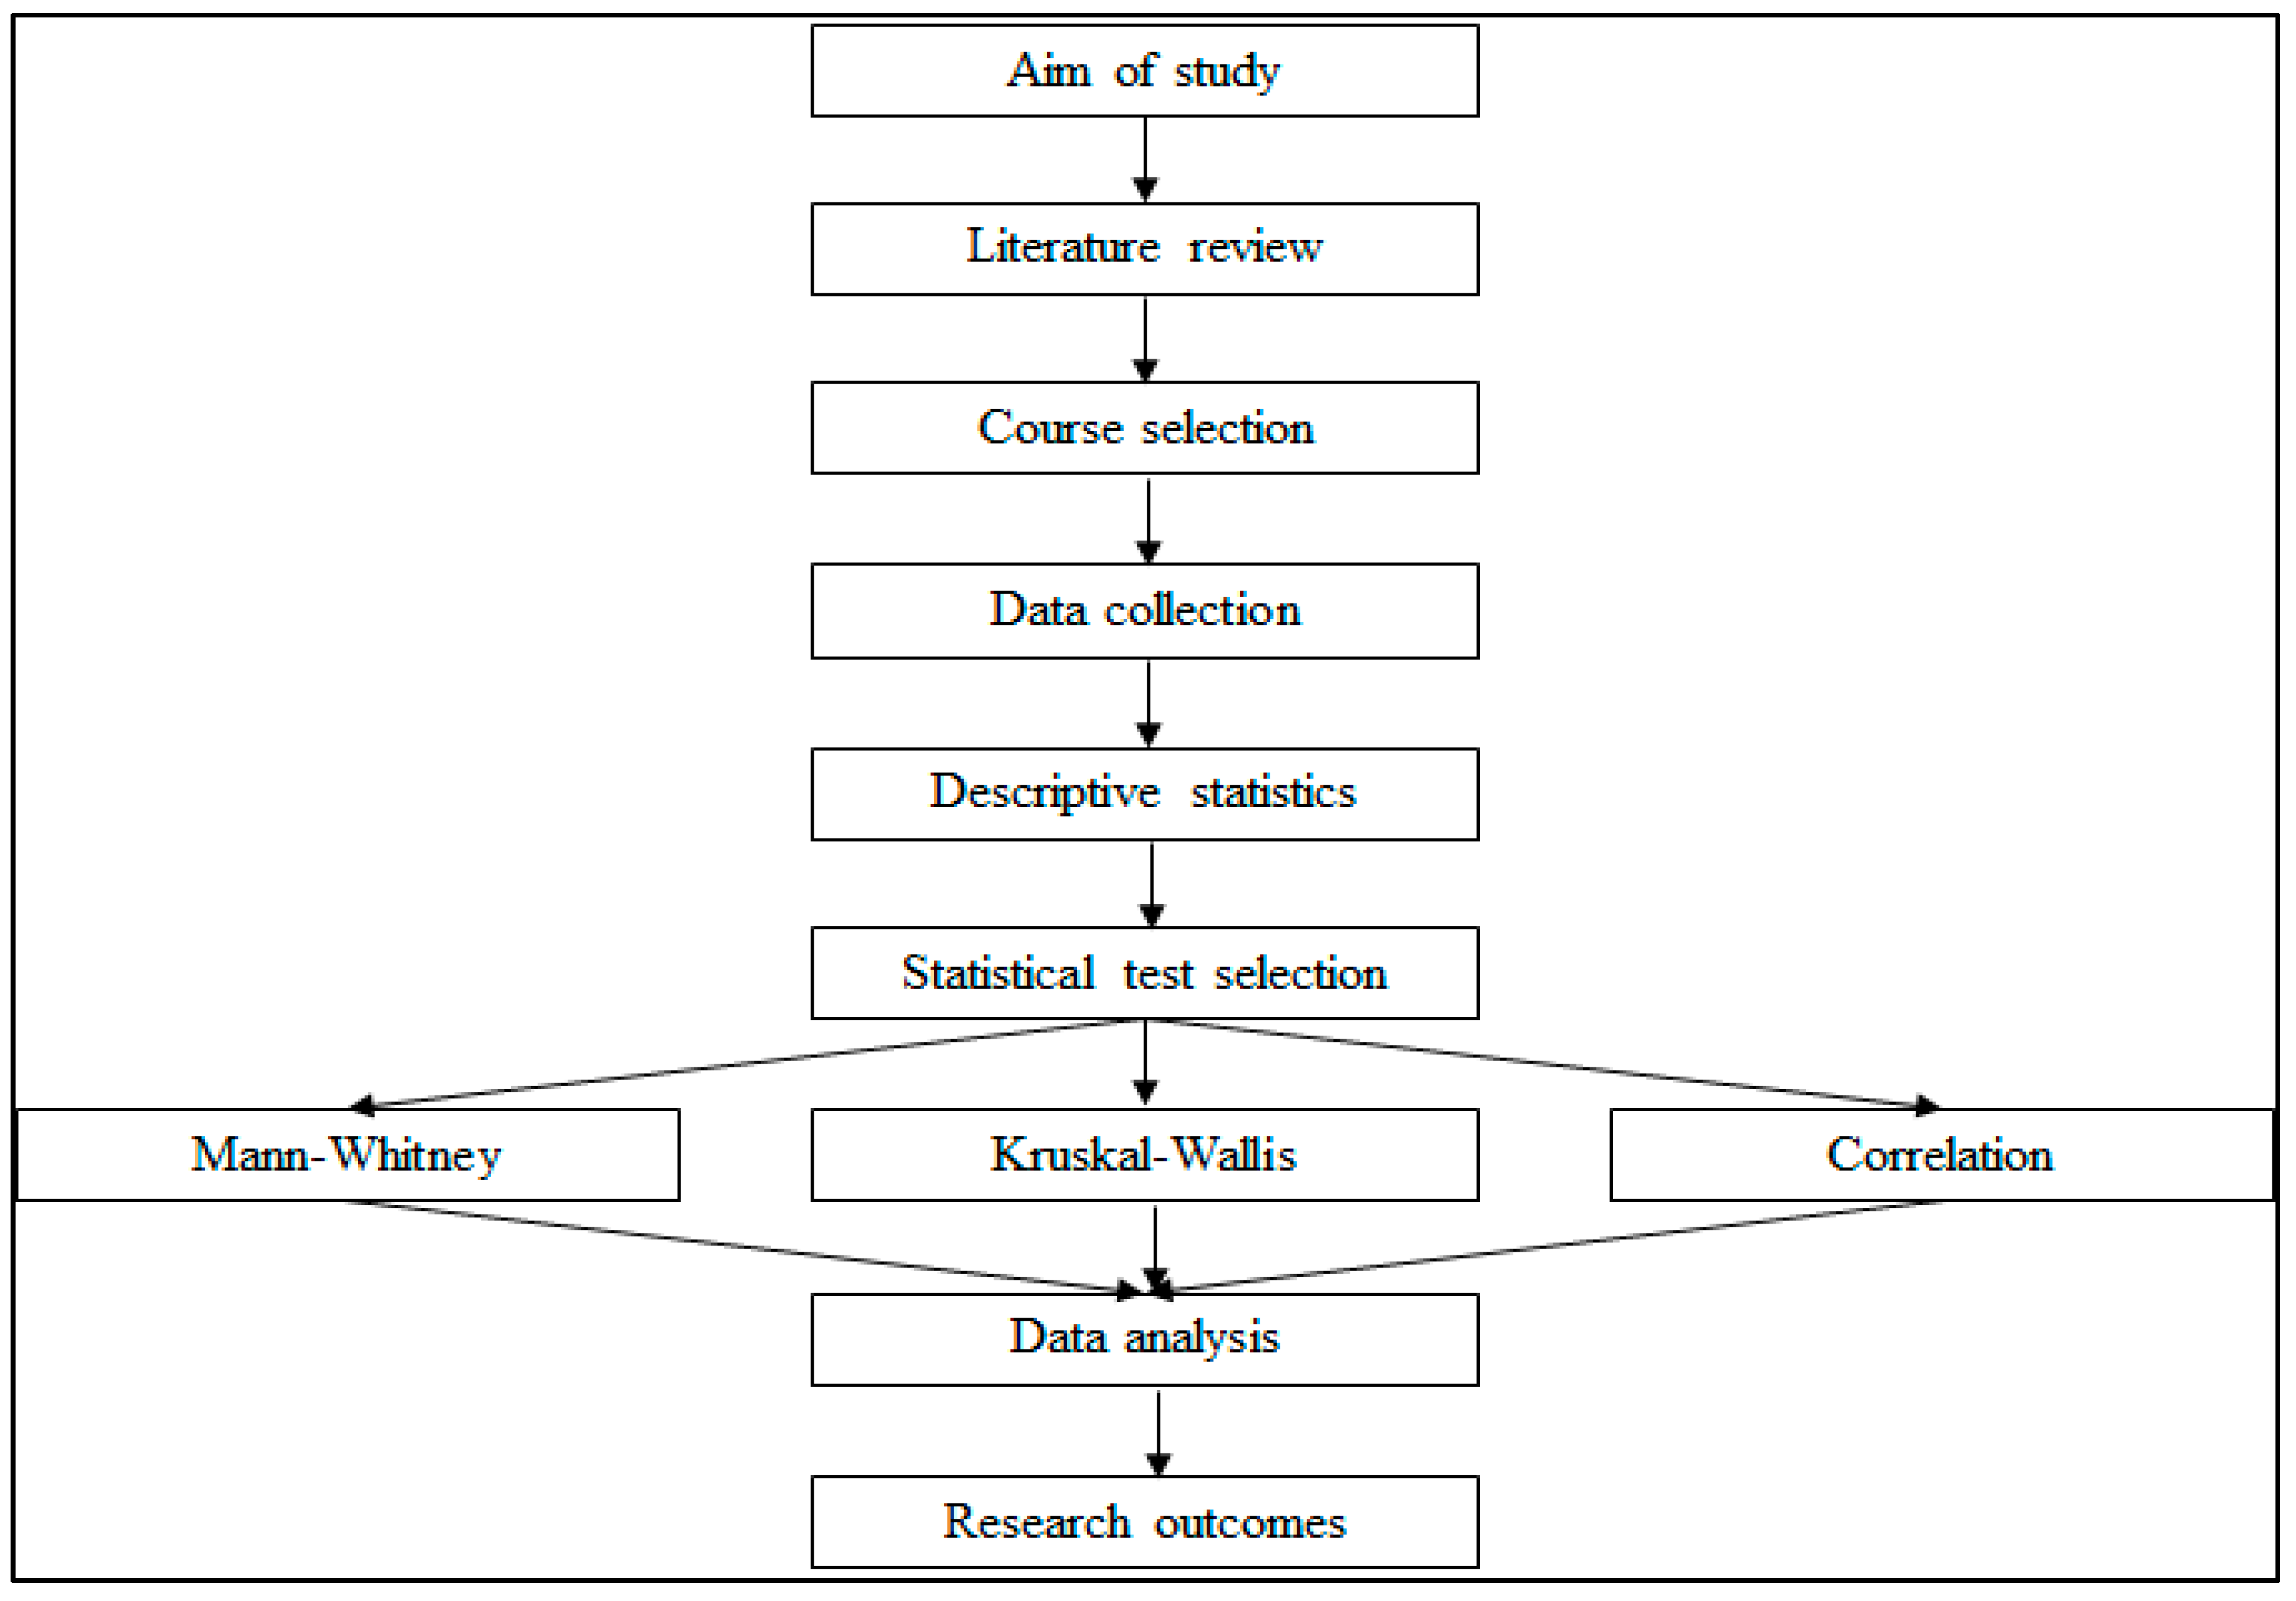
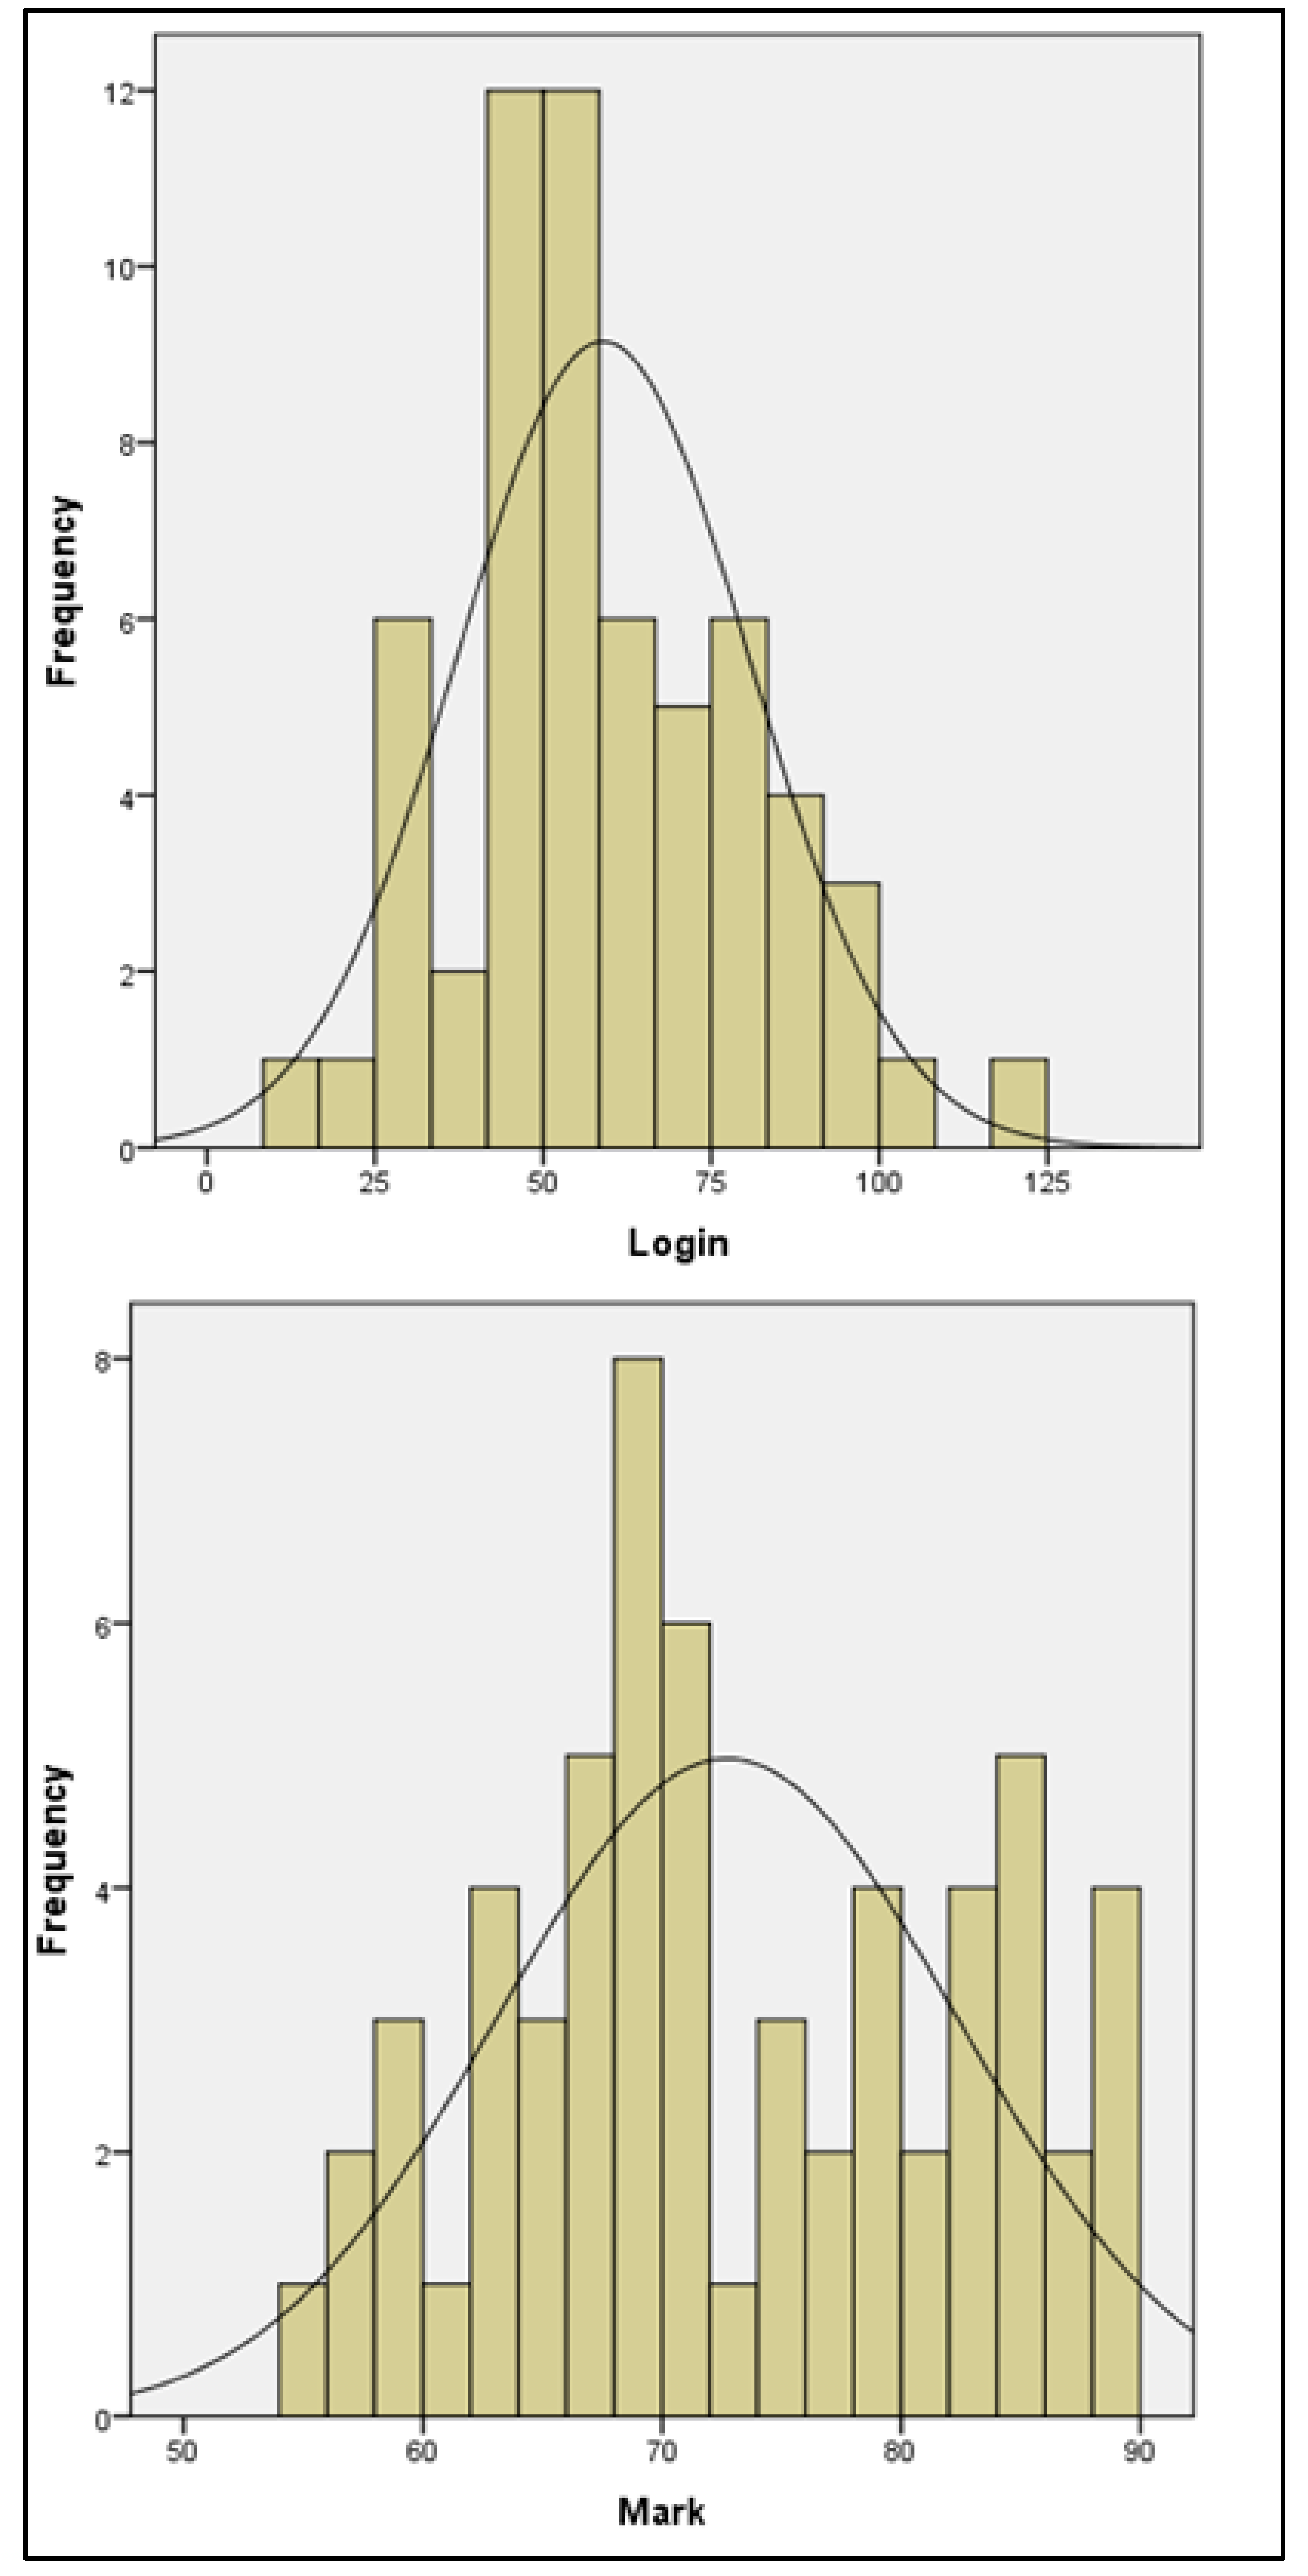
This research considers applying statistical techniques to predict students’ performances using course analytics data from Moodle. The effectiveness of using Moodle data for an engineering course at the University of South Australia was investigated through statistical techniques. Section 2 shows the methodology including the description of appropriate statistical tests used in this study, while Section 3 shows the results from the analysis.

2. Materials and Methods

Figure 2 shows the flow chart of methodology. A brief literature review was performed before starting the data collection. We examined the characteristics of data using the outcomes of descriptive statistics. We selected three statistical tests (Mann-Whitney, Kruskal-Wallis and correlation) for analysis due to the nature of data. The details of methodology are explained in the following sections.

2.1. Course Selection

CIVE 3010: Water Resources Systems Design (WRSD)—a 3rd year’s undergraduate civil engineering course at the University of South Australia was selected as a case study. This course provides the learning opportunities on how to design water resources systems including stormwater drainage, sewerage and water supply systems for a new development or re-development. The course is delivered using a project-based learning exercise. Real life projects collected from industry is usually taught in this course. The course is delivered in blended mode. The lecturer uploads the teaching materials in the Moodle system; lectures are also recorded in the Moodle.
61 students enrolled into WRSD course in 2017. 8 of them were female students, 34 were international students, 4 were female international students and 3 students were studying part-time. Figure 3 shows that majority of international students (n = 19; 56%) were from China followed by Middle East (n = 6; 18%). The percentage of students enrolled in WRSD course from Africa, Southeast Asia and South Asia among international students were 12%, 8% and 6%, respectively.
The course had three assessment items: (i) preliminary design (30% of weight) involved manual design of water resources systems, (ii) final design (50%) belonged to CAD and software based design of stormwater, drainage and sewerage systems and (iii) quiz (20%) involved solving four problems. Preliminary design and final design were group activities and quiz was an individual task. Individual performances in the group activities were moderated using reflective journals and SPARK (Self and Peer Assessment Resource Kit) peer assessment. A sample rating outcome of SPARK peer assessment for a team of four students is shown in Figure 4.

2.2. Descriptive Statistics

We conducted descriptive statistics on students’ number of login to learn-online site of WRSD course. Descriptive statistics was conducted using SPSS to examine its central tendency (mean, median and mode), variability (standard deviation), symmetry (skewness) and peakedness (kurtosis). The distribution pattern of the data (parametric or non-parametric) was observed by examining the results of descriptive statistics. The distribution pattern of data could be considered as parametric, if the skewness and kurtosis values are close to zero [32].

2.3. Statistical Tests Selection

Selection of an appropriate statistical test depends on the characteristics of the independent and dependent variables (Table 1 and Table 2). Chi-square is an appropriate statistical test if both independent and dependent variables are categorical. The level of association between independent and dependent variables for Chi-square test is usually measured using Cramer’s V and Phi tests. There are several statistical tests to perform hypothesis testing including t, Analysis of Variance (ANOVA), Mann-Whitney, Kruskal-Wallis etc. if independent variable is categorical and dependent variable is scale. Correlation and regression are appropriate tests for scale versus scale data. Scale data are required to be parametrical to perform t and ANOVA tests. Mann-Whitney and Kruskal-Wallis tests are usually performed if the scale data are non-parametric or the nature of data is unsure. Abuse of statistical tests is observed for decades in research [33] and careful consideration of the characteristics of data is required for the selection of statistical tests. As the number of login data in the course learn-online site (dependent variable) were scale data and the independent variables (male or female, domestic or international and groups according to various grades) were categorical data, the initially selected statistical tests were t test, ANOVA, Mann-Whitney and Kruskal Wallis. It was further observed that scale data were non-parametric data; therefore Mann-Whitney and Kruskal-Wallis were appropriate statistical tests for the analysis. Students’ final assessment marks and view counts in the course site were scale data, and therefore correlation analysis was also performed.
Mann-Whitney is a counter part of t-test for non-parametric data. It is an appropriate statistical test when the independent variable is limited into two categories. If the task of statistical analysis is to compare the outcomes of two groups, Mann-Whitney is a well-known statistical technique. The parallel names of Mann-Whitney are Wilcoxon-Mann-Whitney, Mann-Whitney-Wilcoxon and Wilcoxon Rank tests [34]. On the other hand, Kruskal-Wallis is the counter part of ANOVA test for non-parametric data, if the independent variable has more than two categories. According to Kruskal and Wallis [35], this statistical test can assess the differences among three or more independently sample groups on a single variable that fails to meet the normality assumptions of ANOVA. A valid alternative for Mann-Whitney and Kruskal-Wallis tests to quantify the characteristics of data is correlation analysis [34].
In this study, Mann-Whitney, Kruskal-Wallis and correlation tests were performed using Statistical Package for the Social Sciences (SPSS). Data were collected from the Moodle of WRSD course in 2017.

2.4. Hypothesis Testing

The process of a hypothesis testing is fundamental and it is almost universal in any statistical analysis [36]. Null and alternative hypotheses for this study were prepared by the Mann-Whitney and Kruskal-Wallis tests themselves and the decisions against null hypotheses were also defined by the tests. These features are customised in the SPSS. The null and alternative hypotheses used in this study are as follows:
Null hypothesis (H0): the distribution of number of login to the learn-online site is the same across the categories.
Alternative hypothesis (HA): the distribution of number of login to the learn-online site is different across the categories.
Table 3 shows the categories used for hypothesis testing. The categories include: (i) domestic and international students, (ii) students’ gender, (iii) categories of various students’ groups using grades (HD, D, C and P), (iv) sub-divisions of domestic/international students for various grades (domestic—HD, international—HD, domestic—D, international—D, domestic—C, international—C, domestic—P and international—P), and (v) sub-divisions of male/female students for various grades (male—HD, female—HD, male—D, female—D, domestic—C, international—C, domestic—P and international—P). Mann-Whitney test was conducted, if independent variable had only two categories (e.g., domestic/international students and gender), while Kruskal-Wallis test was performed when categorical data had three or more groups (e.g., students groups for various grades).

3. Results and Discussions

3.1. Descriptive Statistics

The results of descriptive statistics for login to learn-online engagement site and total mark (out of 100) are shown in Table 4, while the distribution patterns are shown in Figure 5. The mean values of login and mark were 58.88 (STD = 21.80) and 72.72 (STD = 9.62) respectively. The median values were 54.50 and 71 respectively and the mode values were 42 and 69 respectively. The skewness value for login is moderately positive (+0.47), i.e., the right tail is slightly longer than normal distribution bell curve. The kurtosis value of total mark is negative (−1.1), which is close to rectangular distribution. As skewness and kurtosis values were not close to zero, the distribution patterns of data were considered as non-parametric. After observing the values of descriptive statistics and students’ distribution patterns of logins to the learn-online course site and total marks, non-parametric statistical tests (Mann-Whitney and Khruskal-Wallis) were applied.

3.2. Hypothesis Testing Results

The hypothesis testing results using Mann-Whitney and Kruskal-Wallis tests are shown in Table 5. It shows that null hypotheses were accepted for all categories and sub-categories, i.e., the distribution patterns of students’ logins to the learn-online site of WRSD course in 2017 was almost similar. The distributions were observed similar between two groups including male vs female and domestic vs. international students using Mann-Whitney test. Similar distributions were also observed for four students’ categories using grades. The distributions were also similar for sub-categories of grades using domestic vs international and sub-categories of grades using gender. These indicated that the differences of learn-online engagements across various categories were minimum. Therefore, the prediction of students’ performances using course analytics data could mislead.
Figure 6 shows the bar charts of students’ logins to learn-online sites for two categories: (i) domestic and international students, and (ii) gender. The mean rank values for domestic (n = 29) and international (n = 31) students were observed as 28.05 and 32.79 respectively. These values were 25.50 and 31.38, respectively, for female and male students. The test statistics and p values were 378.5–447.5 and 0.05–0.2, respectively. As the Mann-Whitney test compares the distribution patterns between categories (it does not compare value to value, such as, number, mean, median, standard deviation etc.), the patterns shown in Figure 6 were considered almost similar by the test itself and thereafter the decision against null hypothesis was also generated by the test itself. Though the visual observations of distribution patterns of bar charts look different due to the differences in number of participants (e.g., n = 9 for female and n = 51 for male), the test considered all possible inside parameters of distribution patterns and decided that the null hypothesis could be accepted. Therefore, the distribution of number of login to the learn-online site is almost the same across various categories.
Figure 7 represents the box plots of students’ logins to the learn-online course site for various grade categories. The highest and lowest median values were observed for HD and P grades respectively, while P grade showed the highest amount of spread of data. First quartile values were almost similar for HD, D and C groups, and the 3rd quartile values were almost similar for HD and D grades. Null hypothesis and decision against null hypothesis were developed by the Kruskal Wallis test in the SPSS. As null hypothesis was accepted, the distribution patterns of various groups and sub-groups (shown in Table 5) were almost similar, and therefore minimum differences were available in the distribution patterns of various categories. The test statistics and p values for Kruskal Wallis test were 0.56–4.47 and 0.00–0.15, respectively.

3.3. Correlation

Acceptances of null hypotheses for Mann-Whitney and Kruskal Wallis tests indicated that there was a weak correlation between login to learn-online site of the course, and the final mark for various categories and sub-categories (categories and sub-categories are shown in Table 5). This outcome was validated by performing correlation analysis between login and total mark; both data were scale and therefore, correlation analysis was a valid statistical test. The outcomes of correlation analysis are shown in Table 6. It shows the R value as 0.29 indicating a weak correlation between students’ logins to learn-online site of the course and the total marks. The corresponding value for Spearman rho is 0.22. Figure 8 also shows the scatter plot diagrams between login and total mark. The scatter plots were sub-divided by various categories including domestic vs. international students and various groups using grades. The dot points in Figure 8 were too scatter that weak correlation was observed between login and total mark.

3.4. Parametric Test Results Using ANOVA

ANOVA is an appropriate statistical test, if the distribution of scale data is parametric. As students’ logins to learn-online course site data didn’t show an appropriate normal distribution curve, ANOVA is not a proper test for this dataset. However, we ignored the pre-requisite conditions of One Way ANOVA and test results are shown in Table 7. It was observed from Table 7 that F ratio values were relatively small (ranging from 0.80 to 1.70). As a rule of thumb, the smaller F ratio values indicated that the differences of distribution patterns of students’ logins to learn-online course site for various categories and sub-categories were relatively small. Therefore, F ratio values revealed that the distributions of number of logins to the learn-online site were almost same across the categories and thus validated the results presented in the Table 5.

4. Conclusions

The key aspects of this study are highlighted below:
  • Collection, analysis and measurement of course dashboard data are usually utilised to understand and optimize teaching and learning environment of a course. However, using course analytics data is challenging as all data are not meaningful and some data could mislead the actual scenario. Existing literature suggests mixed opinions about prediction of students’ performances using course analytics data.
  • Course analytics is one of the key sources of students’ learn-online engagement data. Students’ academic behaviour of a course sometimes may be understood by analysing course analytics data. However, a careful consideration is required to utilize learn-online engagement data to predict students’ academic performances, as course analytics data sometimes may not truly reflect the engagement of students in the course.
  • Students’ learn-online engagement data and final assessment marks were statistically analysed using SPSS. Mann-Whitney and Kruskal-Wallis tests were performed to explore hypothesis testing. Null hypotheses and decisions against null hypotheses were generated by the tests in the SPSS. As null hypotheses were accepted in all cases, the distributions of learn-online engagement data were almost similar across categories (domestic/international, gender, grades etc.). Therefore, it would mislead to differentiate categories of students’ performances (such as, high, medium or low performing) by analysing learn-online engagement data.
  • The outcomes of hypothesis testing were validated using correlation analysis. A weak relationship was observed between students’ logins to learn-online engagement data and final assessment marks.
  • Though One-Way AOVA is a parametric statistical test, it was performed to cross-check the differences of distributions of students’ learn-online engagement data across various categories. The observed F ratios were relatively small indicating that the differences of distribution patterns of students’ logins to learn-online course site for various categories and sub-categories were relatively small.
  • The results presented in this paper were based on a case of 61 students from a Civil Engineering undergraduate course at the University of South Australia. Similar research can be carried in a large scale considering several courses of a program so that a better picture about the utilization of course analytics data can be explored.
  • The outcomes of this study can be applied in practice for the selection of an appropriate statistical test to analyse course analytics data. Both categorical and scale data are available in course analytics; the distribution of scale data could be parametric or non-parametric. The approaches of Mann-Whitney, Kruskal-Wallis and correlation explained in this paper could be applied for analysing course analytics data of other face to face and on-line courses.

Author Contributions

Conceptualization, F.A. and E.S.; methodology, F.A.; software, F.A. and E.S.; validation, F.A.; formal analysis, F.A.; investigation, F.A. and E.S; resources, F.A. and E.S.; data curation, F.A. and E.S; writing—original draft preparation, F.A.; writing—review and editing, F.A.; visualization, F.A.; supervision, E.S.; project administration, F.A. and E.S.

Funding

This research received no external funding.

Conflicts of Interest

The authors declare no conflict of interest.

References

  1. Cavenett, S. Authentically enhancing the learning and development environment. Australas. J. Eng. Educ. 2017, 22, 39–53. [Google Scholar] [CrossRef]
  2. Trevelyan, J. Towards a Theoretical Framework for Engineering Practice. In Engineering Practice in a Global Context: Understanding the Technical and the Social; Williams, B., Figueiredo, J.D., Trevelyan, J.P., Eds.; CRC Press: Boca Raton, FL, USA, 2014; pp. 33–60. [Google Scholar]
  3. Lee, E.; Carberry, A.R.; Diefes-Dux, H.A.; Atwood, S.A.; Siniawski, M.T. Faculty perception before, during and after implementation of standards-based grading. Australas. J. Eng. Educ. 2018, 23, 53–61. [Google Scholar] [CrossRef]
  4. Sivapalan, S.; Clifford, M.J.; Speight, S. Engineering education for sustainable development: Using online learning to support the new paradigms. Australas. J. Eng. Educ. 2016, 21, 61–73. [Google Scholar] [CrossRef]
  5. Jaikaran-Doe, S.; Doe, P.E. Assessing technological pedagogical content knowledge of engineering academics in an Australian regional university. Australas. J. Eng. Educ. 2015, 20, 157–161. [Google Scholar] [CrossRef]
  6. Chowdhury, R.K. Learning and teaching style assessment for improving project-based learning of engineering students: A case of United Arab Emirates University. Australas. J. Eng. Educ. 2015, 20, 81–94. [Google Scholar] [CrossRef]
  7. Huda, M.; Maseleno, A.; The, K.S.M.; Don, A.G.; Basiron, B.; Jasmi, K.A.; Mustari, M.I.; Nasir, B.M.; Ahmad, R. Understanding modern learning environment (MLE) in big data era. Int. J. Emerg. Technol. Learn. 2018, 13, 71–85. [Google Scholar]
  8. Han, F.; Ellis, R.A. Identifying consistent patterns of quality learning discussions in blended learning. Internet High. Educ. 2019, 40, 12–19. [Google Scholar] [CrossRef]
  9. Duval, E. Attention please! Learning analytics for visualization and recommendation. In Proceedings of the 1st International Conference on Learning Analytics and Knowledge, Banff, AB, Canada, 27 February–1 March 2011; pp. 9–17. [Google Scholar]
  10. Siemens, G. Learning analytics: The emergence of a discipline. Am. Behav. Sci. 2013, 57, 1380–1400. [Google Scholar] [CrossRef]
  11. Agudo-Peregrina, A.F.; Iglesias-Pradas, S.; Conde-Gonzalez, M.A.; Hernandez-Garcia, A. Can we predict success from log data in VLEs? Classification of interactions for learning analytics and their relation with performance in VLE supported F2F and online learning. Comput. Hum. Behav. 2014, 31, 542–550. [Google Scholar] [CrossRef]
  12. Saqr, M.; Fors, U.; Tedre, M. How learning analytics can early predict under-achieving students in a blended medical education course. Med. Teach. 2017, 39, 757–767. [Google Scholar] [CrossRef]
  13. Campbell, J.P.; DeBlois, P.B.; Oblinger, D.G. Academic analytics: A new tool for a new era. Educ. Rev. 2007, 42, 40–57. [Google Scholar]
  14. Retalis, S.; Papasalours, A.; Psaromilogkos, Y.; Siscos, S.; Kargidis, T. Towards networked learning analytics—A concept and a tool. In Proceedings of the 5th International Conference on Networked Learning, Lancaster, UK, 10–12 April 2006. [Google Scholar]
  15. Maseleno, A.; Sabani, N.; Huda, M.; Ahmad, R.; Jasmi, K.A.; Basiron, B. Demystifying learning analytics in personalised learning. Int. J. Eng. Technol. 2018, 7, 1124–1129. [Google Scholar] [CrossRef]
  16. Clow, D. An overview of learning analytics. Teach. High. Educ. 2013, 18, 683–695. [Google Scholar] [CrossRef] [Green Version]
  17. Hwang, G.J.; Chu, H.C.; Yin, C. Objectives, methodologies and research issues of learning analytics. Interact. Learn. Environ. 2017, 25, 143–146. [Google Scholar] [CrossRef] [Green Version]
  18. Lu, O.H.T.; Huang, A.Y.Q.; Huang, J.C.H.; Lin, A.J.Q.; Ogata, H.; Yang, S.J.H. Applying learning analytics for the early prediction of students’ academic performance in blended learning. Educ. Technol. Soc. 2018, 21, 220–232. [Google Scholar]
  19. Tucker, B.; Halloran, P.; Price, C. Student perceptions of the teaching in on-line learning: An Australian university case study. In Proceedings of the 36th HERDSA Annual International Conference, Auckland, New Zealand, 1–4 July 2013. [Google Scholar]
  20. Xing, W.; Chen, X.; Stein, J.; Marcinkowski, M. Temporal prediction of dropouts in MOOCs: Reaching the low hanging fruit through stacking generalization. Comput. Hum. Behav. 2016, 58, 119–129. [Google Scholar] [CrossRef]
  21. Hachey, A.C.; Wladis, C.W.; Conway, K.M. Do prior online course outcomes provide more information rather than GPA alone in predicting subsequent online course grades and retention? An observational study at an urban community college. Comput. Educ. 2014, 72, 59–67. [Google Scholar] [CrossRef]
  22. Lu, O.H.T.; Huang, A.Y.Q.; Huang, J.C.H.; Lin, A.J.Q.; Ogata, H.; Yang, S.J.H. Applying learning analytics for improving students engagement and learning outcomes in an MOOCs enabled collaborative programming course. Interact. Learn. Environ. 2017, 25, 220–234. [Google Scholar] [CrossRef]
  23. Lonn, S.; Aguilar, S.J.; Teasley, S.D. Investigating student motivation in the context of a learning analytics intervention during a summer bridge program. Comput. Hum. Behav. 2015, 47, 90–97. [Google Scholar] [CrossRef]
  24. Lee, V.A.; Janssen, J.; Erkens, G.; Brekelmans, M. Supporting teachers in guiding collaborating students: Effects of learning analytics in CSCL. Comput. Educ. 2014, 79, 28–39. [Google Scholar]
  25. Syah, M.; Hamzaid, N.A.; Murphy, B.P.; Lim, E. Development of computer play pedagogy intervention for children with low conceptual understanding in basic mathematics operation using the dyscalculia feature approach. Interact. Learn. Environ. 2015, 24, 1477–1496. [Google Scholar]
  26. Rientties, B.; Brouwer, N.; Lygo-Baker, S. The effects of online professional development on higher education teachers’ beliefs and intentions towards learning facilities and technology. Teach. Teach. Educ. 2013, 29, 122–131. [Google Scholar] [CrossRef]
  27. Anderson, T. Getting the mix right again: An updated and theoretical rationale for interaction. Int. Rev. Res. Open Distance Learn. 2003, 4, 1–14. [Google Scholar] [CrossRef]
  28. Beer, C.; Jones, D.; Clark, D. Analysis and complexity: Learning and leading for the future. In Proceedings of the Annual Conference of the Australasian Society for Computers in Learning in Tertiary Education, Wellington, New Zealand, 25–28 November 2012. [Google Scholar]
  29. Pradas, S.I.; Azcarate, C.R.; Peregrina, A.F.A. Assessing the suitability of student interactions from Moodle data logs as predictors of cross-curricular competencies. Comput. Hum. Behav. 2015, 47, 81–89. [Google Scholar] [CrossRef] [Green Version]
  30. Conjin, R.; Snijders, C.; Kleingeld, A.; Matzat, U. Predicting student performance from LMS data: A comparison of 17 blended courses using Moodle LMS. IEE Trans. Learn. Technol. 2017, 10, 17–29. [Google Scholar] [CrossRef]
  31. Zacharis, N.Z. A multivariate approach to predicting student outcomes in web-enabled blended learning courses. Int. High. Educ. 2015, 27, 44–53. [Google Scholar] [CrossRef]
  32. Ho, A.D.; Yu, C.C. Descriptive statistics for modern test score distributions: Skewness, kurtosis, discreteness, and ceiling effects. Educ. Psychol. Meas. 2015, 75, 365–388. [Google Scholar] [CrossRef]
  33. Greenland, S.; Stephen, J.S.; Rothman, K.J.; Carlin, J.B.; Poole, C.; Goodman, S.N.; Douglas, G.A. Statistical tests, p values, confidence intervals, and power: A guide to misinterpretations. Eur. J. Epidemiol. 2016, 31, 337–350. [Google Scholar] [CrossRef]
  34. McElduff, F.; Cortina-Borja, M.; Chan, S.K.; Wade, A. When t-tests or Wilcoxon-Mann-Whitney tests won’t do. AJP Adv. Physiol. Educ. 2010, 34, 128–133. [Google Scholar] [CrossRef]
  35. Kruskal, W.H.; Wallis, W.A. Use of Ranks in One-Criterion Variance Analysis. J. Am. Stat. Assoc. 1952, 47, 583–621. [Google Scholar] [CrossRef]
  36. Pfister, L.; Kirchner, J.W. Debate—Hypothesis testing in hydrology: Theory and practice. Water Resour. Res. 2017, 53, 1792–1798. [Google Scholar] [CrossRef]
Figure 1. A typical visualization of course analytics data.
Education 09 00245 g001
Figure 2. Flow chart of methodology.
Education 09 00245 g002
Figure 3. Distribution of international students.
Education 09 00245 g003
Figure 4. A sample rating of SPARK peer assessment. [* WA = Well above average and AA = Above average].
Education 09 00245 g004
Figure 5. Distribution patterns of login to learn-online site and total mark.
Education 09 00245 g005
Figure 6. Bar charts of students’ logins to learn-online site for various categories.
Education 09 00245 g006
Figure 7. Box plots of students’ logins to learn-online site for various grades.
Education 09 00245 g007
Figure 8. Scatter plot between student’s login to learn-online site and mark.
Education 09 00245 g008
Table 1. Selection of statistical tests using category of data.
Independent VariableDependent VariableStatistical Tests
CategoricalCategoricalChi-square test, Cramer’s V and Phi
CategoricalScalet test, Mann-Whitney, ANOVA, Kruskal-Wallis
ScaleScaleCorrelations, regressions
Table 2. Selection of statistical tests using distribution pattern of scale data.
Type of TestNo. of Comparison GroupsStatistical Tests
Parametric2t test
3 or moreANOVA
Non-parametric2Mann-Whitney
3 or moreKruskal-Wallis
Table 3. Categories used in the hypothesis testing.
Statistical TestCategorical Data (Independent Variable)Scale Data (Dependent Variable)
Mann-Whitney
  • Domestic/International students
  • Gender
Number of login to the learn-online site
Kruskal-Wallis
  • Categories for various grades
  • Sub-divisions of domestic/international students for various grades
  • Sub-divisions of male/female students for various grades
Table 4. Results of descriptive statistics.
ItemLogin to Learn-Online Course SiteTotal Mark (Out of 100)
NValid6060
Missing00
Mean58.8872.72
Median54.5071.00
Mode4269
Std. Deviation21.809.62
Skewness0.470.10
Std. Error of Skewness0.310.31
Kurtosis0.11−1.1
Std. Error of Kurtosis0.610.61
Table 5. Hypothesis testing results.
Null HypothesisCategoriesTestDecision
The distribution of number of login to the learn-online site is the same across the categories. Domestic and international studentsMann-WhitneyAccept the null hypothesis
Gender
Grades * (HD, D, C, P)Kruskal-Wallis
Sub-categories of grades using domestic vs international students
Sub-categories of grades using gender
[* Note: HD = High Distinction (≥85% of the total mark, D = Distinction (75–84%), C = Credit (65–74%) and P = Pass (50–64%)].
Table 6. Correlation test results between students’ logins to learn-online site and total marks.
ModelRR SquareAdjusted R SquareStd. Error of the Estimate
Correlation coefficient0.290.050.049.4
Table 7. ANOVA test results for students’ logins to learn-online site for various categories.
CategoryF Ratio
Domestic and international0.82
Gender1.70
Grades0.80

