1. Introduction
Attending university has become increasingly costly in England, with the much-discussed tuition fee cap rising first to £3000 per year in 2006, and more recently to £9000 per year in 2012 (both sets of figures in nominal terms). In response to controversy surrounding this system of fees, and as a concession made to opposition MPs in an attempt to ”ease the passage” of the controversial 2004 Higher Education Bill—which first introduced the £3000 tuition fee—through Parliament [
1], the government mandated that universities would have to give away at least 10% of their fee income in the form of non-repayable cash bursaries to low income students from 2006 onwards. These higher education bursaries (known henceforth as “bursaries”) remain an important element of financial aid.
Bursaries are important for several reasons. First, spending on them is big. Around 40% of students receive a bursary, and the most recent projections show that over £300 m per year (or £370 per student) will be spent by English institutions on bursaries and scholarships in 2015 (see Office for Fair Access (OFFA) [
2]): Table 1e—note that published figures do not provide a split of spending on bursaries and scholarships separately but it is widely known that the bursary spending constitutes the vast majority of this spending), a figure that has remained roughly constant for several years. Second, from September 2016, maintenance grants, which are currently the main source of non-repayable student aid, will be abolished. Whilst poor students will be no worse off in cash terms (since they will be able to access larger maintenance loans), the abolition of grants will make bursaries the main source of “free” money for low-income students. It is worth noting that there are other forms of non-repayable aid—mainly merit based scholarships and hardship funds, but these are generally restricted to a small number of students per institution; to the author’s knowledge, no published data exist on the total value of these. Third, bursaries are the sole element of financial aid in England that varies at the institutional level (maintenance grants and loans are centralised), making them an important and unique example of decentralisation of aid within the sector (tuition fees, of course, vary by institution; however, as is widely known, the vast majority of institutions set fees at £9000 per year, and there is very little variation by institution [
2]. This decentralization gives rise to huge variation in the generosity and targeting of bursary spending by institution. For example, recent projections for steady state spending on bursaries and scholarships for 2015 students ranged between 0% and 91% of universities’ total access agreement expenditure (authors’ own calculations based on [
2] Table 3a: institutions charging fees above the basic level of £6000 per year for a full-time undergraduate programme are required to produce an OFFA access agreement, which details fee limits and describes how institutions will promote fair access and improve retention and success through financial and non-financial support, including bursaries and scholarships as well as other forms of access spending), while bursary spend per student varied between £0 and £6000 per year (see Wakefield [
3] for details). This reflects not only the different strategies employed by universities in their approaches to widening participation, but also the lack of guidance or stated aims of the bursary system at the outset.
Indeed, little rationale was provided by the government for their introduction, nor was their purpose explicitly articulated. As such, Callender [
1] establishes the purpose of bursaries by gleaning information from various government documents and official sources published around the time of bursaries’ introduction. She concludes that the aim of bursaries was “overcoming the financial barriers to higher education (HE) participation” via three main channels:
- (i)
Minimising the impact of tuition fees: The aim here appears to have been to create a system where the full cost of fees (then £3000 per year) was offset by student support, with bursaries to be part of this. As quotations from the secretary of state’s letter to the OFFA watchdog director reveal “[I]t is our policy that the poorest students on the most expensive courses should receive a total package ... of non-repayable support of at least £3000”. Of course, tuition fees could not be easily offset by up-front cash support, since fees are deferred and repaid upon graduation. Hence, this aim seems to be of limited practical value.
- (ii)
Reducing student debt and promoting choice: Callender [
1] quotes Charles Clark, Secretary of Education and Skills “My ... intention is to ensure that every student from a poor economic background has enough resources to meet even the highest course fee without incurring additional debt”. Rather than promoting choice between universities, the intention is again apparently to offset fees. As above, this is an unlikely scenario, though of course debt could be reduced by relieving the need for private borrowing for liquidity constrained students.
- (iii)
Safeguarding access: Callender [
1] describes this as “the aim of eliminating price as a factor in student decision making”. Again, it is hard to see how bursaries could address this aim, since fees were deferred, and, moreover, the minimum bursary amount was set relatively low in comparison to tuition fees.
Despite a lack of government guidelines, two further reasonable assumptions can be made regarding the purpose of bursaries: to promote access and improve the university attainment of disadvantaged students, and to promote choice between universities through price differentials (the latter was formally tested in an OFFA commissioned report [
4]). Testing the impact of bursary aid on student participation and/or attainment is beyond the scope of this paper (the causal relationship between bursary aid and university outcomes (completion, annual module scores and degree classification) will be explored in a forthcoming companion paper [
5]). However, given the amount of money spent on these forms of aid, understanding how universities have used and continue to use bursaries, and which students have benefitted from these forms of aid is of importance.
This paper aims to evaluate higher education bursaries on the basis of equity and efficiency—the main criteria for evaluating policy from an economics perspective. There are many definitions of equity and efficiency, and it is beyond the scope of this paper to examine them all, or to apply them to this problem, so my analysis is necessarily limited.
In more detail, I aim to understand whether the bursary system is equitable, or socially just, by examining which types of students receive bursaries and how much they receive, specifically asking whether the poorest students receive the biggest bursaries. This is a relevant question since, of course, under the bursary system, universities themselves can decide on the threshold for bursary receipt—effectively they decide who is “poor”.
Notions of efficiency are rather less straightforward and less widely discussed in the UK aid literature, which tends to focus on equity (Dearden
et al. [
6]). However, a common concern in the US student aid literature (Bettinger [
7]; Dynarski [
8]) is that student aid merely subsidizes low ability students, who may lack the skills to perform well at university, and for whom a college degree may not improve earnings. Whilst the UK system is somewhat different from the US system (for example, the US system is characterised by higher dropout rates than those in the UK), the question may become increasingly important in the UK as participation continues to expand and the pool of students widens. Moreover, the question of whether it is desirable to pursue equity policy through needs-based support, or to pursue so-called efficiency ends by attempting to retain and support the most talented students is of general policy importance (Orsuwan and Heck [
9]), particularly when resources are limited. With this in mind, my aim is to understand whether bursaries are going to the poorest, most able students, where I define ability as according to prior academic attainment. This is made possible due to my unique dataset, which allows me to look not just at the distributional impact of bursaries according to student income background, but also according to prior academic attainment, something hitherto unexamined in the literature. Of course, as described, the aims of bursaries may be wider than those initially set out; moreover, it could be argued that offering bursaries purely on need is both equitable and efficient since more able students may not require additional aid to succeed, and may have already availed themselves of disproportionate share of societal resources. However, I concentrate on this question since, as described, it is of some importance in the academic literature.
Note also, that if bursaries are ineffective as tools to encourage participation and ineffective as tools to improve students’ outcomes when at university, then providing bursaries to students could be considered inefficient regardless of who receives them. However, such analysis is beyond the scope of my paper, and in the absence of compelling evidence on this from the literature, I proceed under the assumption that recipients benefit in some way from bursaries.
To explore these questions, I make use of a unique administrative dataset collected from 22 English universities. This dataset comprises individual-level data on UK and EU undergraduate students (i.e., those eligible for bursaries) for students at English universities enrolling between 2006–2011, including the university and course each student attends, the bursary they are awarded each year, their background characteristics and prior academic attainment, and their outcomes at university.
In this paper I show that, as a direct consequence of the decentralized nature of the bursary system, there are vast inequalities in aid receipt among poor students. With universities compelled to award bursaries to the poorest students (those receiving full maintenance grants), those universities with high numbers of poor students have to spread their limited resources more thinly. Hence, students attending these universities—usually less elite, non-Russell Group institutions—get less than their (often better off) counterparts at more prestigious universities.
Nevertheless, I find that the poorest, most able (in terms of A-level attainment) students tend to receive the most bursary aid. This is because such students are more likely to gain access to wealthier, more elite institutions who give out the most in bursary aid. This latter finding is the unique contribution of this paper.
This research relates to the literature on student aid, which predominantly comes from the US and UK. Most relevant to this paper are studies examining the UK bursary system. Of these, a first strand of such work examines institutional spending on bursaries across the sector, investigating the implications for inequality and widening participation. Hills and Richards [
10] study the bursary rules published by universities in 2012, and find that “cliff edges” in bursary support mean that a small difference in parental income can mean several thousand pounds’ less support within institution, compounding already existing inequalities caused by the national tax and benefits system. Chowdry
et al. [
11] examine the now defunct National Scholarship Programme (NSP). Their investigation reveals that high status universities such as those in the Russell Group contribute more of their own resources to fund student support activities than lower status universities do, leading to students at high status universities enjoying more generous total support packages (including bursaries) than those at lower-ranked institutions. The result is wide inequalities in bursary receipt among disadvantaged students, depending on the university attended. My paper uses individual-level data collected from universities to confirm these findings of Chowdry
et al. [
11], but also builds on this work by linking bursary receipt to prior academic attainment, and to university performance. Thus my work is unique in that it is able to reveal which types of students (not just in terms of their income background, but also in terms of their academic performance) are particularly affected by bursaries.
A second strand of work on the UK bursary system attempts to investigate students’ understanding and perceptions of bursaries. Callender and Wilkinson [
12] survey around 4800 undergraduate students entering HE in the UK in 2008 and find that around a quarter of them were unaware of bursaries, and that most did not become aware of them until after they had enrolled in a particularly university. They conclude that other than the most cost-conscious, most do not think their choice of institution was affected by bursaries. This is perhaps an unsurprising result since (due to the complex nature of the system, and the lack of transparency in university bursary offerings) students are unlikely to be aware of the particular bursary they qualify for prior to university entry (Chowdry
et al. [
11]).
A third strand attempts to relate bursary spend to student behaviour and outcomes. Corver [
4] looks at the impact of bursaries on participation whilst a study by OFFA [
13] examines the impact of bursaries on student retention. These papers find no impact of bursaries on either student participation at university, or retention in the first year of study, but do not look at other outcomes such as annual module test scores or final degree class.
This paper is also relevant to the large body of US student financial aid literature, and the small but growing body of literature from the UK and Europe. These papers do not look specifically at bursaries, but at national or state-level aid packages. From the US, studies by Dynarski [
8] and Seftor and Turner [
14] find small positive impacts of aid eligibility on enrolment. Studies from the UK and Europe are rarer, perhaps due to the lack of clean policy “experiments” and data. Nevertheless, Dearden
et al. [
15], and Nielsen
et al. [
16] again find positive effects of aid on enrolment. Also of relevance to this paper are studies that look at the impact of aid on college attainment, rather than college enrolment. Bettinger [
7] and Dynarski [
17] demonstrate the potential effectiveness of financial aid on student performance. Finally, the small body of literature concerned with merit-aid—aid directed at students according to ability—is of relevance. Scott-Clayton [
18] and Dynarski [
19] demonstrate the potential effectiveness of providing incentives related to merit.
The remainder of the paper is structured as follows:
Section 2 provides background information on the bursary scheme and associated legislation,
Section 3 goes on to describe the data that will be used in the remainder of this paper,
Section 4 contains the main analysis and results, and
Section 5 concludes.
2. The English Higher Education Bursary System, 2006–Present
The English higher education system is characterised by high tuition fees (at £9000 (all figures expressed in this section are in nominal prices) per year, they are the highest in Europe and on a par with many US institutions)) but a generous national system of financial support. Whilst tuition fees are decided at the institution level, in practise the vast majority of universities charge the full £9000 per year, and the average fee stood at £8830 in 2015 (see OFFA [
2]: Table 2). The latter consists of means-tested fee loans, which cover the full value of tuition fees, and maintenance loans of up to £5740 per year in 2015 (for full-time undergraduates living away from home and studying at English universities outside London, while different rates apply for those living at home or studying in London (see Gov.uk [
20] for full details)). Both fee and maintenance loans are repayable after graduation once the graduate is in employment and earning above £21,000 per year. Non-repayable maintenance grants of up to £3387 per year are also available for students with parental incomes of less than £25,000 per year. However, these grants will be abolished from September 2016 (with maintenance loans increased to make up the difference, see Britton
et al. [
21] for more details), meaning higher education bursaries will become the sole non-repayable or “free” form of student financial aid. Bursaries also represent the sole form of aid that is governed at an institutional rather than a national level.
As described in
Section 1, the system of higher education bursaries was introduced by the UK government in 2006. At that time, the upfront means-tested tuition fee of £1200 per year, which had been in place since 1998, was abolished and replaced with a deferred tuition fee of up to £3000 per year backed by a tuition fee loan as described above. Again, the tuition fee was intended to be decided at institution level but, in practise, all institutions charged £3000 per year. English institutions were required to offer a bursary to all disadvantaged students (defined as those in receipt of a full maintenance grant, £2700 at that time; note there are no other requirements, such as prior academic attainment or academic performance whilst at university, though the student has to be registered each year to receive their bursary). The minimum bursary that institutions could offer was set to be the difference between full fee charged and the maintenance grant received by the student. Thus, the minimum bursary at the time was £300 per year (£3000 in fees minus £2700 grants). From 2010 onwards, the rules were redefined so that the minimum bursary became 10% of fee charged. Since fees at the time were around £3200 per year, the minimum bursary remained around £320 per year. Since 2012, no minimum bursary requirement has been in place. In 2012, the bursary system was supplanted by the National Scholarship Programme (NSP) in which universities were allocated a set amount of money to distribute among their disadvantaged students in the form of bursaries, fee waivers or other benefits. The NSP has since been disbanded.
Aside from the minimum bursary rule, universities are free to set bursaries as they choose, effectively defining for themselves what constitutes a poor student, and how much they should receive in bursaries. This gives rise to considerable variation in bursaries. The most recent figures indicate that around 9% of tuition fee income is currently spent on bursaries (authors calculations based on total bursary spend of £316m in 2015, and total fee income of £3532m in the same year (based on average tuition fee of £8830 and cohort of 400,000 UK/EU students in 2015—see UCAS [
22]). This will be discussed in more detail in
Section 4.
An interesting feature of the bursaries system concerns their delivery. Although each individual institution designs its own bursary scheme (including the income thresholds for bursary receipt and the amount of bursary on offer), the Student Loans Company (SLC) administers the bursary payment for the majority of schemes (universities can opt to administer their own scheme but the majority choose to do so through the SLC). This means that students do not have to apply for bursaries in order to receive them. Thus, there is no possibility of a student choosing not to take up their bursary (or forgetting to do so). As long as the student has applied for other forms of student support through the SLC (which include maintenance loans, fee loans and grants) (in 2011, 88% of eligible students took up maintenance loans (see Bolton [
23]))
and choose to declare their parents’ income in doing so (which is necessary for the mean-tested elements of maintenance loans, and in order to receive any maintenance grant, which depending on year, effects those with parental incomes of around £50,000 or below), and are eligible for a bursary, they will receive it. Second, there is very little possibility of non-compliance on the part of the university, since they have minimal involvement in the administration of the bursary payment system, beyond designing the rules. A third outcome of this system is that if the student has not declared their parents income to the SLC, their parental income will be unknown to the university. Thus, in this paper, I only hold parental income data for those who undergo this means-test. Since the upper limit for receipt of a means-tested student grant or loan was around £50,000 per year (depending on the year of entry) during my period of observation, the majority of parental income data in my sample is for students from these backgrounds. Roughly 50% of my sample have non-missing household income. Government statistics (ONS [
24]) show that around 70% of households have income below £50,000. Bearing in mind my households are drawn from the population with children attending university, they are likely to be of higher income than the UK population.
3. Data
This paper makes use of a unique administrative dataset collected by the author directly from 22 UK universities as part of a large scale investigation of the impact of bursaries on university outcomes (Murphy and Wyness [
5]). The data comprise the entire undergraduate population of UK and EU students from eight Russell Group institutions, and 14 non Russell Group institutions, for between 1–5 cohorts of students beginning their studies between 2006 and 2011.
Thus, my study looks purely at undergraduate students, between 2006–2011. I do not examine the current bursary system or changes made as a result of the 2012 tuition fee reforms, nor do I look at part-time or postgraduate students. I do not examine other types of non means-tested aid in this paper, such as scholarships or merit awards; my analysis purely concerns means-tested bursaries.
3.1. My Sample Comprises 153,538 Students
In each case, I have information on the university attended (though for the purposes of this study, this is anonymised) and the subject studied.
3.2. Bursary/Finance Data
As described above, bursaries are administered through the Student Loans Company, then details of the bursaries paid out are returned to the university. The result is that the dataset contains full information on the bursary each student received each year (as calculated by the SLC according to the university’s bursary rules), but parental income data only for those students who underwent the parental income means-test (since otherwise parental income would not be known). In the case of 12 universities, full parental income data are provided. In the case of 10 universities, only parental income bands were made available, in which case I have imputed parental income as the mid-point of these bands. Four out of the eight Russell Group institutions (50%) provided parental income data, whilst eight out of the 14 non-Russell Group institutions (57%) provided parental income data.
3.3. Background Information
The dataset also holds information on the student background characteristics, such as their parental occupation, parental socio-economic status, their age at the point of entry, ethnic group, gender, and disability status. Crucially, the dataset also contains information on the students’ prior academic attainment, in terms of their qualification types, subjects and grades. Again, there were many hundreds of qualification types among the dataset. For simplicity, I have therefore augmented the dataset with the corresponding University and College Admissions Service (UCAS) points assigned to this particular qualification. To explain in greater detail, UCAS is the centralised university entry board to which students must apply to gain entry to university or college. All UK qualifications are awarded UCAS points, with a top scoring A-level (the standard qualification taken at age 18 to gain entrance into university) worth 140 points. Universities normally require three or more A-levels to gain entrance to university, though their standards vary greatly. A sum total of UCAS points has been calculated for each student.
3.4. Outcomes
The dataset tracks students throughout the course of their degree. Therefore, I have information on each students final outcome, including whether they dropped out and their final degree classification where applicable.
In
Table 1 and
Table 2, I present some descriptive statistics on the universities and individuals in my sample. Of course, my sample is a selection of those universities willing to participate in the study, rather than a representative sample of institutions. My sample is over-represented in terms of the Russell Group (there are 20 Russell Group universities in England (and a further two in Scotland, and one each in Wales and Northern Ireland), out of 130 universities in total), who have stricter entry requirements and tend to attract richer students.
Over 40% of students in my sample receive a bursary. Russell Group universities have fewer bursary receivers than non-Russell Group students in the sample (28% vs. 57%). Not surprisingly then, Russell Group bursaries are twice as generous, at roughly £1250 on average per bursary holder (all prices are henceforth expressed in 2013 prices (RPI)), versus £680 in non-Russell Group institutions.
Table 2 presents characteristics of the individuals in my sample. Forty-five per cent are male, 89% are of traditional age (18–21) and 82% are white British. According to the most recent Higher Education Statistics Agency (HESA) statistics (HESA, 2015: Table 6a) [
25], 45% of full-time undergraduates are male, 61% are under 22, and 60% are white. My sample is therefore representative in terms of gender, but is younger and whiter than the UK undergraduate population—reflecting the disproportionate amount of Russell Group universities in the sample. They have an average of 289 UCAS points (equivalent to roughly BBC in terms of A-level scores) (see [
22] for more details of qualifications and their equivalent UCAS points) and household income (of bursary holders only) is around £21,000. As such, these results cannot be generalized to the whole population, although I do attempt to contextualise the results in terms of other research in the sections that follow.
In terms of outputs, the dropout rate is 11%, and of those who successfully completed their studies, 68% achieved a first class or an upper second (2:1) degree.
4. Institutional Approaches to Bursary Spending
As described in
Section 2, universities were compelled, between 2006 and 2011, to ensure that all students in receipt of a full grant were also eligible for a bursary. They were also compelled to give out a minimum of 10% of tuition fee income as a bursary. Of course, the system had some autonomy built in. Universities could choose to be more generous, by giving bursaries to a wider range of students (
i.e., not just the poorest) and/or by giving out more generous bursaries than the minimum.
What might be the consequences of a system in which the amount of bursary a student receives is determined by both his/her parental income and the university he/she chooses to attend?
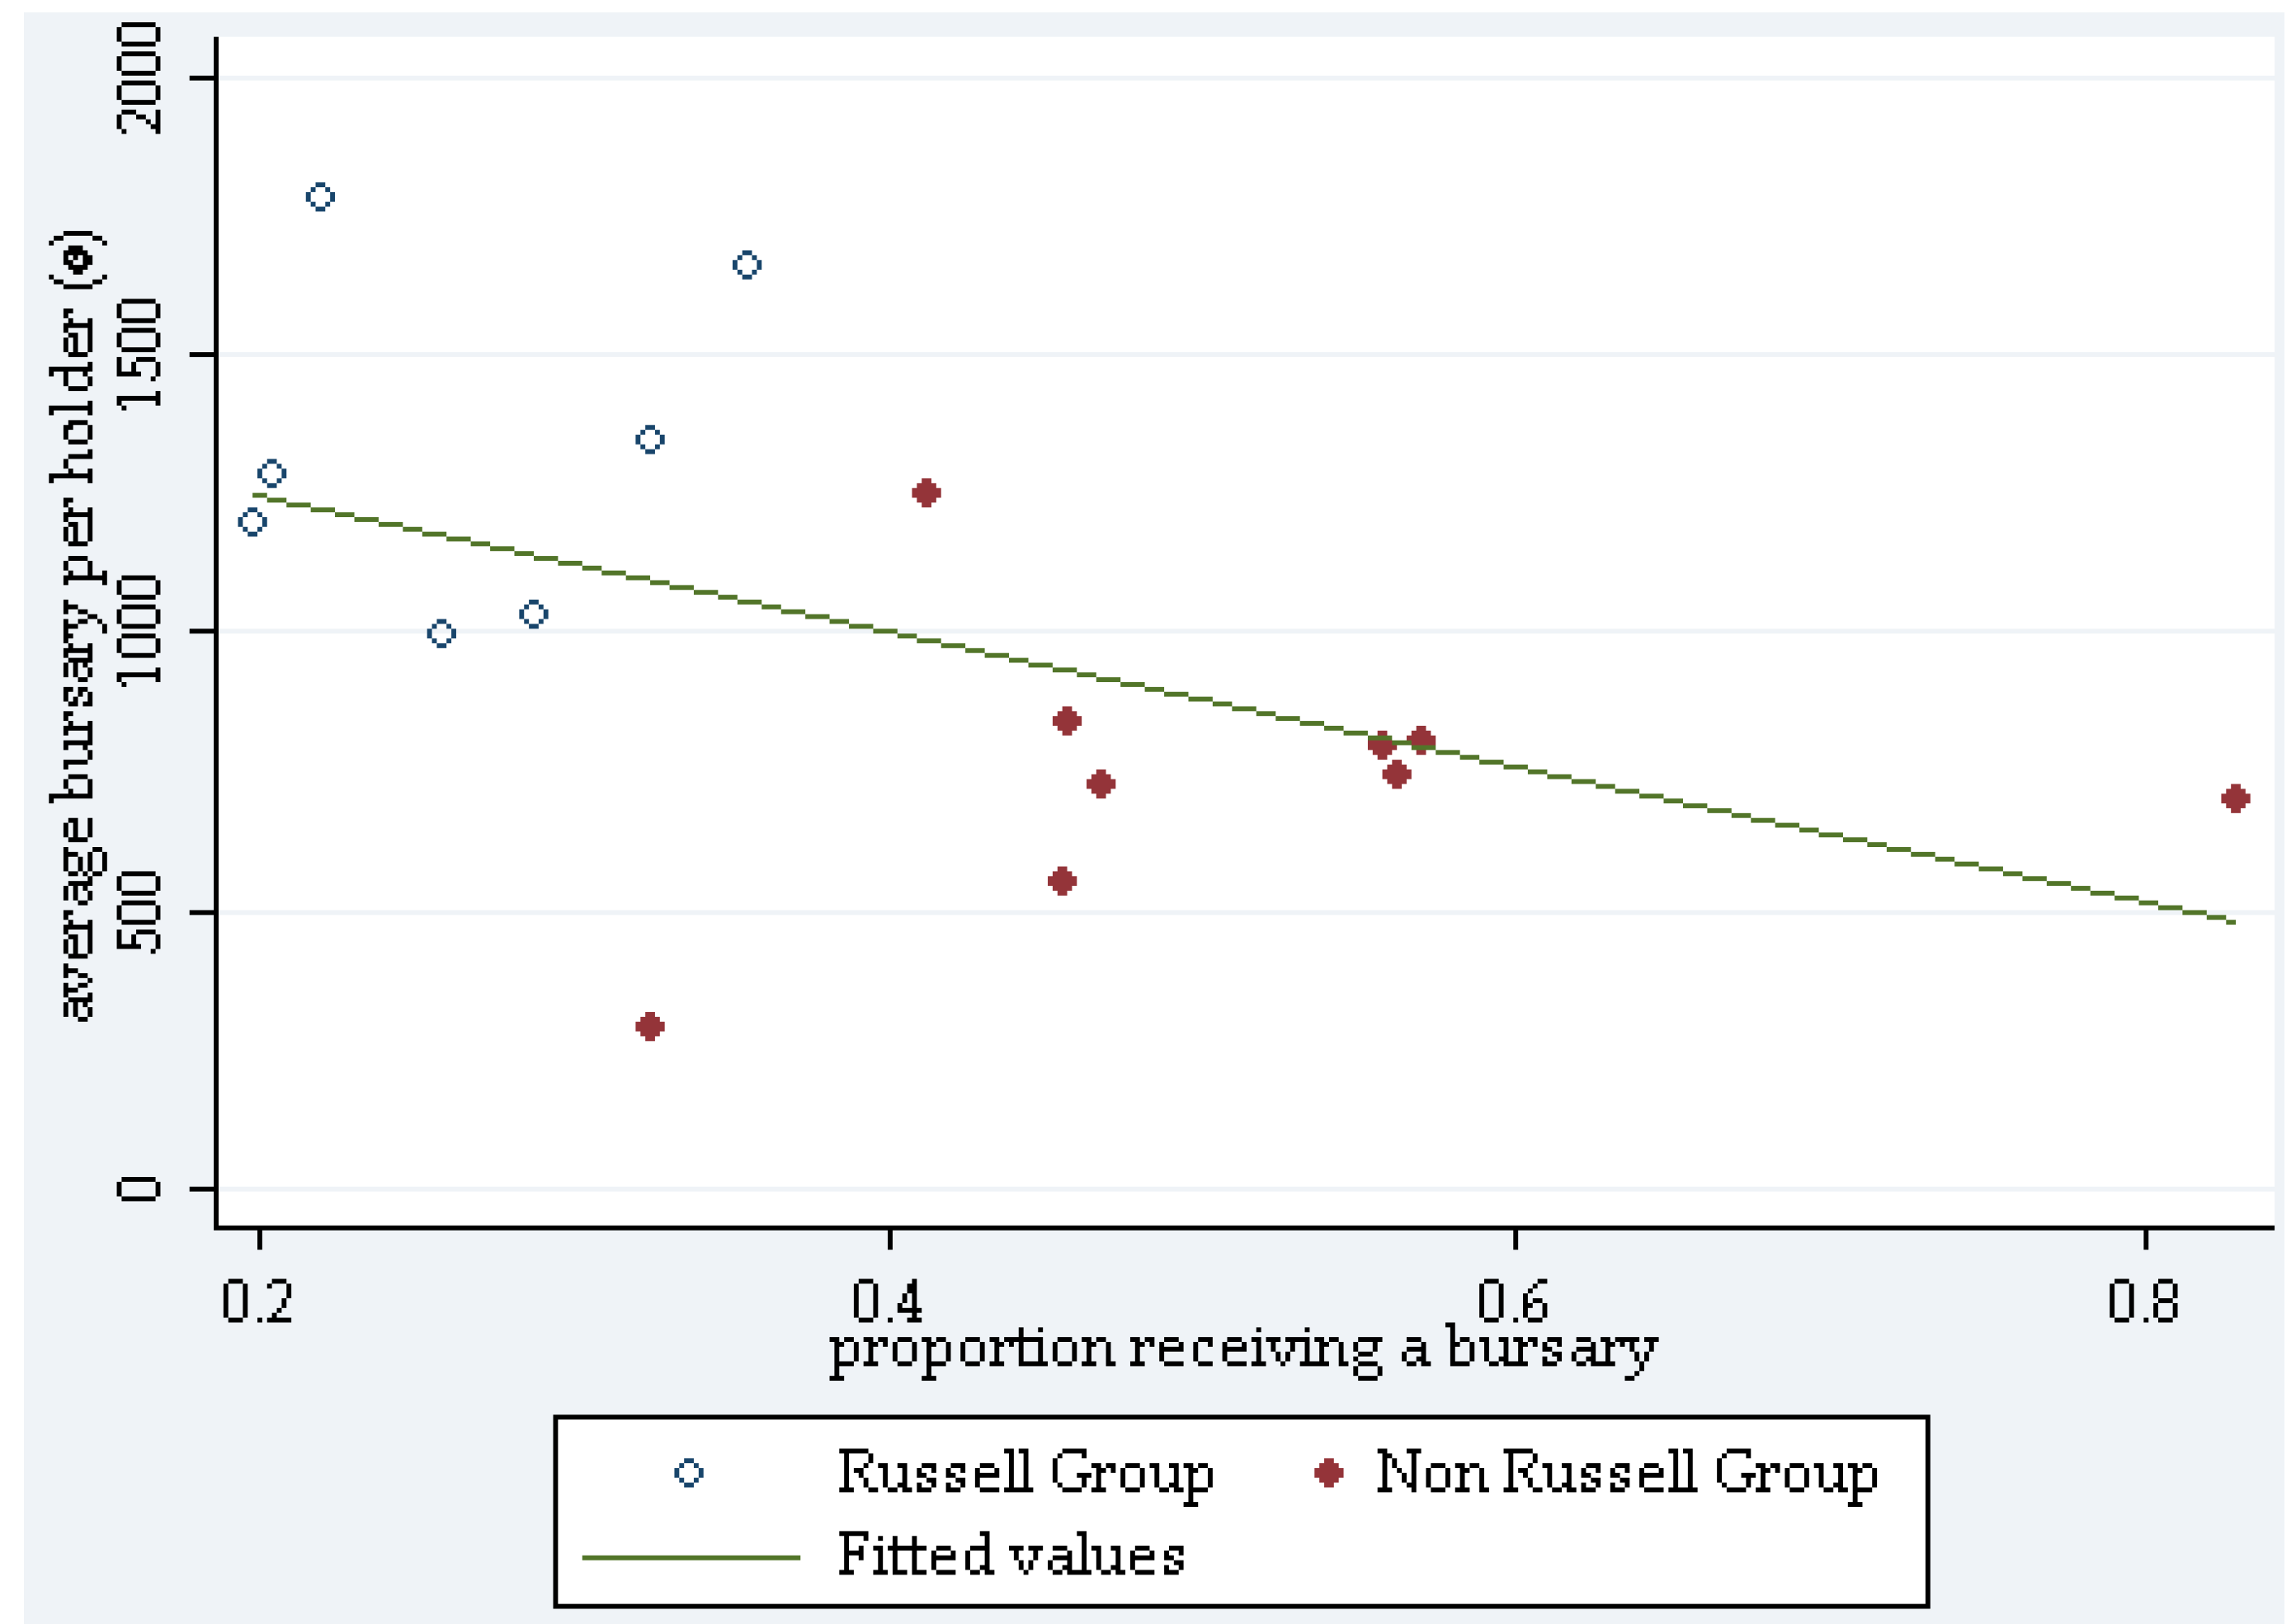
Figure 1 shows the relationship between the proportion of students in each university receiving a bursary, and the average bursary received per bursary holder (over the entire sample period 2006–2011). Each university is the sample is represented by a point. Transparent points represent the elite, Russell Group institutions; solid points represent non-Russell group institutions.
There is a clear negative relationship between the proportion of poor students in a university and the amount of bursary each student receives. Universities with high proportions of bursary-eligible students tend to give out lower average bursaries. Conversely, universities with fewer bursary-eligible students give out higher average bursaries. It is easy to see why this might be the case. With universities compelled to give out bursaries to low-income students (those on full-grants), those universities with high numbers of poor students have to spread their resources among more students, and so students attending these universities get less. Conversely, those universities with only a small proportion of poor students can give out more to the lucky few disadvantaged students they have enrolled. It is perhaps unsurprising that the latter institutions tend to be from the Russell Group. Poor students are less likely to gain access to these academically elite universities since they do not possess the A-levels required for entry (the correlation between parental income background and A-level attainment is widely documented, e.g., Chowdry
et al. [
26]). Moreover, these institutions tend to put more money into their bursary schemes (see Chowdry
et al. [
11]). Hence, disadvantaged students that do get in will enjoy significant financial benefits whilst at university.
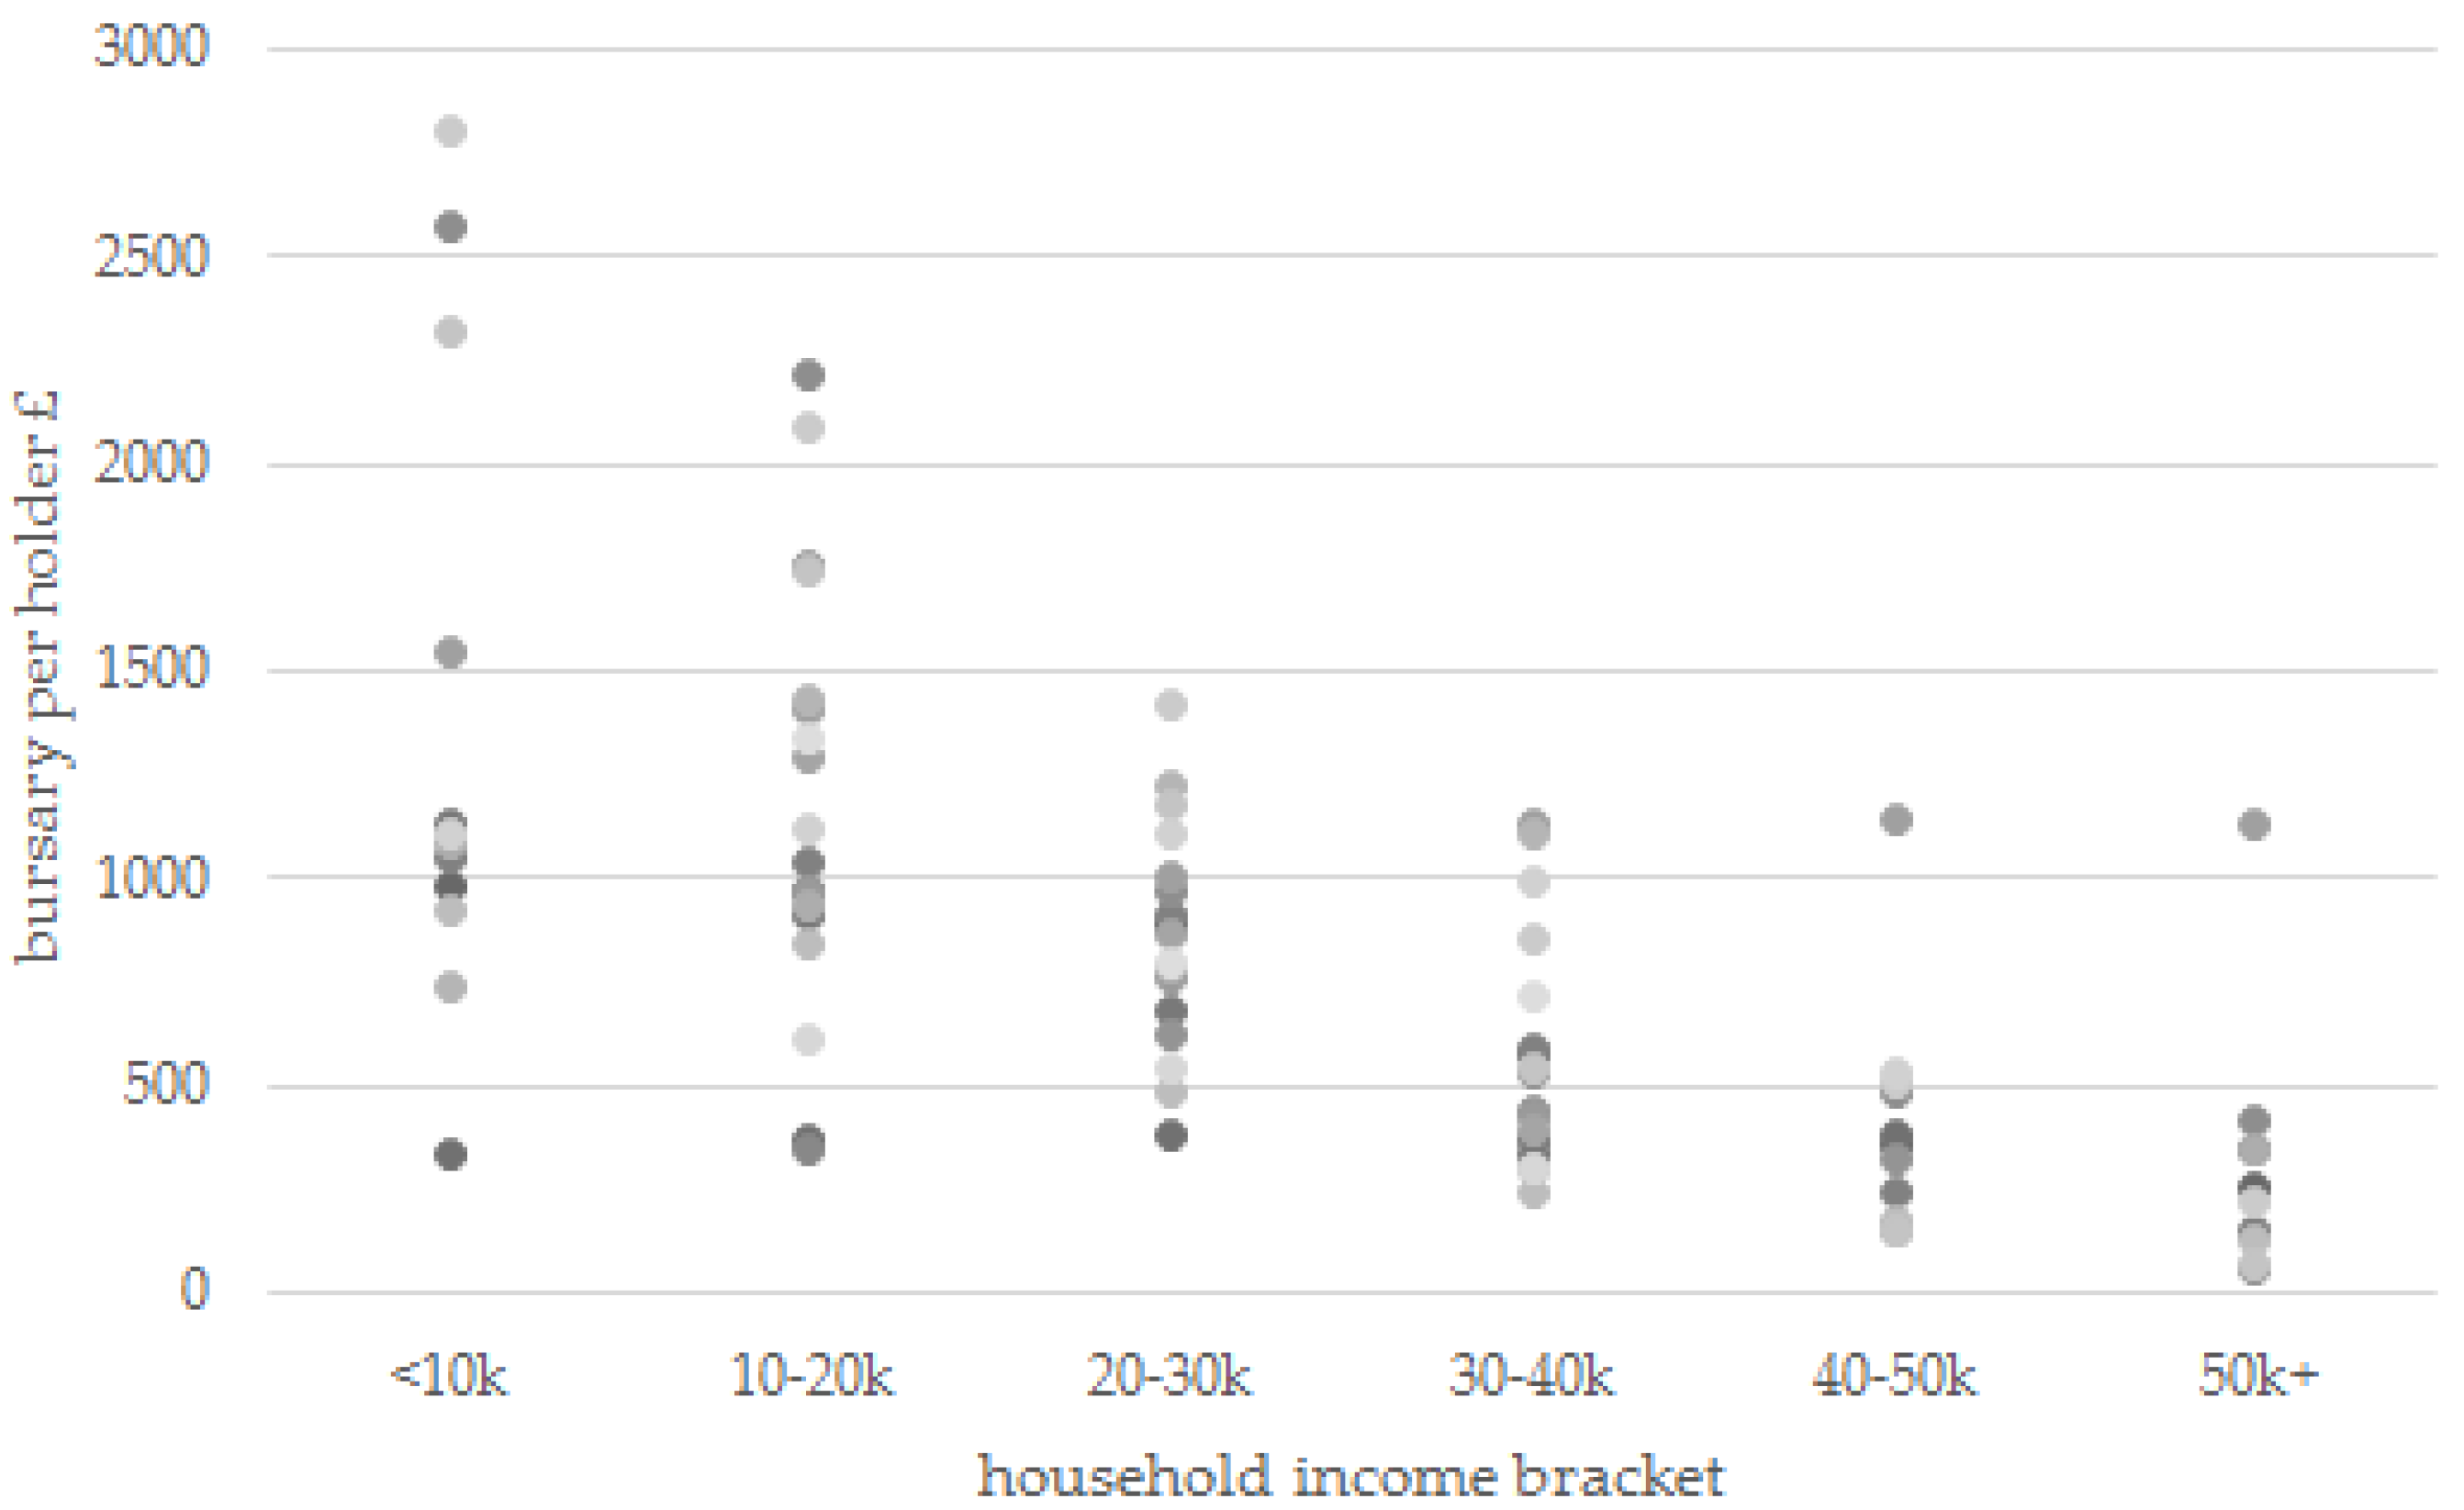
Figure 2 illustrates institutional spending on bursaries in more detail. It shows average bursary paid by student income background. Within each household income bracket, each point again represents a university. Two things are evident from this chart. Firstly, for students of similar income backgrounds, there is a substantial range of bursaries on offer, depending on which university the student attends. For example, students with parental incomes of less than £10,000 per year could receive as little as £350 and as much as £2800 per year depending on the university attended. The second point is that some students from relatively wealthy backgrounds can end up with more bursary money than those from poorer backgrounds, simply because of the institution they attend. For example, at one university, students with parental incomes over £50,000 per year are eligible for over £1000 per year. This is substantially more than what many poorer students at other universities receive. There are many other instances of this in the data.
How can such a situation come about? Simply because students from wealthier backgrounds (who are often better qualified) tend to congregate at more elite institutions. These institutions in turn give out higher bursaries (because they have fewer students to give them to, and more money to give), at higher income thresholds.
Of course, these findings are based on the 2006–2011 bursary system. However, work by Chowdry
et al. [
11], who look at the 2012 system of bursaries (under the remit of the National Scholarship Programme) drew similar conclusions. Moreover, most recent data for 2015 entrants shows the Russell Group universities again offering the most generous awards, with Imperial, Cambridge, LSE and Oxford (among other Russell Group universities) offering the top amounts to their poor students.
This is the first of my key findings in this paper—simply that, as a direct consequence of the decentralized nature of the bursary system, there are vast inequalities in aid receipt—and that the poorest students do not necessarily always receive the highest bursaries.
I can also examine bursary receipt according to other student characteristics, bearing in mind that any differences that arise will be driven by students’ parental income and their choice of university (
Table 3). I find that whilst males and females receive roughly similar amounts of bursary per head, it is interesting that older students are more likely to receive a bursary than their younger counterparts—though at the same rate. This appears to come as a result of differences in income among my sample members, with older students typically worse off (students aged 25 or over are classed as “independent” students and therefore are assessed according to their own, rather than their parents’ income (see Gov.uk (2016) [
27]). It is also notable that whilst non-whites are more likely to receive a bursary, they receive £746 per bursary holder on average, which is £119 per head per year less than white bursary holders. This stems largely from the fact that whilst non-whites are typically poorer in my sample, being non-white is correlated with attending a lower status institution.
Thus, when examined as a whole, the English bursary system does not appear to be equitable; there is a substantial range of bursaries on offer for students who are equally poor, and relatively well-off students can end up with more than poor students. However, as previously discussed, it is a common concern among policy makers and in the literature (Bettinger [
7]; Dynarksi [
8]) that means-tested forms of aid simply subsidize low-ability students. In other words, because means-tested aid is generally given to poorer students, and such students are more likely to have lower school-leaving qualifications and subsequent labour market performance, the money may not be being spent in an efficient or socially optimal way. We may prefer to allocate bursary money to the most talented students (in this case, those with the highest prior attainment).
Therefore, whilst bursaries are not uniformly given to the poorest students, it is of interest to know whether they go to the poorest, most able students. This is the question that I turn to next.
In
Table 4, I present average bursary received per bursary holder, according to both quartile of student ability (as proxied by their A-level or equivalent scores) and household income. The columns group students by ability, ranging from the most able (
Table 4, Column 1) to the least able (
Table 4, Column 4), whilst the rows indicate students from different household income quartiles, from the richest to the poorest. A number of things are evident from this table. First, within every ability grouping (
i.e., looking within each of the four columns), it is not always the case that the poorest students receive the highest bursaries. In the lowest two quartiles of ability, students from the second quartile of income get slightly more than the poorest (as was seen earlier in this section). Second, however, within every income group, the most able students always receive more than those from lower ability groups. Third, the poorest, most able students (defined as those from the lowest quartile of parental income, and the highest quartile of prior attainment) do indeed get the most bursary aid; they receive £1,692 in bursary aid per year—significantly more than the £417 per year received by the richest, least able students, who get the least.
This situation comes about, of course, because more able students, by virtue of their strong A-level qualifications, are more likely to attend Russell Group institutions, and Russell Group institutions can afford to give out bigger bursaries, since they have smaller proportions of poor students to support financially.
This evidence suggests the English bursary aid system is working efficiently—to the extent that we believe that we should allocate bursary aid not just to the poorest students, but rather to the poorest, most able students. However, whilst this is true on average, there will always be high ability students from poor backgrounds who do not attend the most elite universities, and who therefore will receive smaller amounts of bursary aid than their counterparts at more elite institutions. Indeed, my analysis shows that of the poorest, most able students, 68% attend Russell Group institutions, whilst 32% attend non-Russell Group institutions. Those attending the Russell Group received around £1900 per year in bursary aid. Those attending non-Russell Group received significantly less, at around £1100 per year. It is also noteworthy that only 16% of the poorest students in my sample gain the best A-levels versus 46% gaining the worst A-levels; in other words the most able poor only account for a small proportion of overall students.
Of course, this analysis cannot confirm that these high ability low income students stand to gain the most from their degrees in the long run. To fully understand this, I would need to be able observe their labour market outcomes. However, whilst I cannot track my sample of students into the labour market, I am at least able to observe their outcomes whilst in university—in terms of their dropout rates and degree performance. In
Table 5 and
Table 6, I therefore present dropout rates and degree performance (in terms of the proportion of students gaining a first or upper second), again according to household income and ability.
These tables highlight two main points:
- (a)
Prior attainment is a key correlate of success at university. Among almost every household income group, those with the strongest A-level scores are least likely to drop out and most likely to attain good degrees.
- (b)
Disadvantage, nevertheless, plays an important role in success at university. Even looking within each level of prior A level attainment, poor students are always more likely to drop out and less likely to gain a good degree than richer students. Since students from low income backgrounds are less likely to be able to access financial support from other sources (other than maintenance grants and loans to which they are entitled), such as parents, this could be evidence of liquidity constraints—though of course there could be many other explanations for such a finding.
What conclusions should be drawn from this evidence? Firstly, it seems evident that having high prior attainment is associated with better performance among students from poor backgrounds; high prior attainment students perform significantly better than others from within their own income groups, and perform as well as those from more advantaged groups with lower attainment. Of course, we cannot untangle this from the effect that bursary aid might be having on their outcomes. Bursaries are the highest for this group of students, so it could be the case that part of their success is due to their increased financial aid. On the other hand, it could be suggestive that bursary money is wasted on these students, and that they would have succeeded even in its absence. I am not able to draw a conclusion either way.
Nevertheless, the other take-out message from this table is that economic disadvantage is a factor in degree outcomes. Even among those with the best A-levels, those from poorer backgrounds do worse. This is particularly note-worthy since there does not appear to be a downward linear trend in university performance going from rich to poor; rather, poor students appear to be something of an outlier, performing particularly badly compared to other groups. This suggests that, even accounting for prior attainment of the student, being from a particularly poor background is correlated with poor degree outcomes.
A final issue is evident from this table. The group of students likely to perform worst at university are disadvantaged students with weak prior attainment. Understanding the extent to which bursaries or other forms of financial aid can help these students is beyond the scope of this paper; more research is needed to understand the most effective ways to assist such vulnerable students.
5. Conclusions and Discussion
Higher education bursaries are a major source of student aid; around 40% of students receive a bursary, and universities spend some £300 m per year on this form of aid. The bursary system is also an important example of where decentralization in higher education finance has led to real variation in students’ financial circumstances. Using a unique set of data collected from 22 UK universities, this paper studies the higher education bursary system, with a view to understanding how universities use this form of aid, and which students benefit the most.
I find that the decentralised nature of the bursaries system creates income inequalities in bursary receipt. Bursaries are a means-tested benefit, directed at poor students. However, poor students are not equally spread out across institutions. Universities with disproportionate amounts of disadvantaged students—usually less elite, non-Russell Group institutions—have to spread their resources amongst more students. Hence, poor students attending these universities will get less.
I also find, however, that the biggest winners from the bursary system are poor students with high A-level grades. These students end up with the biggest bursaries on average, since they are more likely to attend elite universities. Whilst this may offer some comfort to those who believe that bursaries should go to help the most academically promising students, it should be noted that many poor students with high A-levels do not choose to attend elite institutions, and so will lose out.
Of course, there are also benefits to the decentralization of student aid. Universities arguably know best which of their students benefit the most from the bursary scheme, and, moreover, some universities may want to target their aid towards particular groups of students at the expense of others. However, the government—or its appointed regulator OFFA—should be aware of the consequences of decentralization, particularly in terms of equity. As well as auditing the behaviour of individual institutions, they should also take a more holistic view of the bursaries scheme, looking at which student groups benefit as a whole, and which lose out.
This study has many limitations. My sample includes only 22 universities, and is not representative of the sector as a whole. It also studies the bursary scheme over a limited timeframe. Of course, the most important limitation of the study is that it is unable to say anything about the causal impact of bursaries on student outcomes. Such a study would require detailed data and econometric techniques to deal with the selection biases inherent in bursary receipt. However, its findings would be highly informative for policymakers and universities alike.


