Article

A Novel Influence Analysis-Based University Major Similarity Study

1
College of Electronics and Information Engineering, Shenzhen University, Shenzhen 518060, China
2
Teaching and Learning Centre, Lingnan University, Hong Kong 000852, China
3
School of Science and Technology, Hong Kong Metropolitan University, Hong Kong 000852, China
*
Author to whom correspondence should be addressed.
Educ. Sci. 2024, 14(3), 337; https://doi.org/10.3390/educsci14030337
Submission received: 9 December 2023 / Revised: 15 February 2024 / Accepted: 27 February 2024 / Published: 21 March 2024
(This article belongs to the Special Issue Challenges and Trends for Modern Higher Education)

Abstract

:
In the field of education, investigating the relationships between different majors in universities is an important topic in current educational research. The application of social networks from informatics provides new opportunities and potentials for the field of education. Due to the complexity of social interactions, the social network connections surrounding individuals exert a significant influence on their daily decision-making processes. This paper aims to introduce the social network and influence analysis theories from informatics into the field of education, regarding major as a variable, and comparing and analyzing the influence relationships between majors. An empirical study was conducted, involving the collection of questionnaire data on graduates’ evaluations of various aspects of their university experiences across different majors. The evolution of this model follows the DeGroot opinion dynamics with the inclusion of stubborn nodes. By defining leader majors and general majors based on the data and modeling the questionnaire data as the outcome of a discrete random process, an influence matrix is ultimately generated through the opinion dynamic model. Through this modeling approach, we revealed the underlying influence relationships between different disciplines (majors). These findings provide schools with insights to adjust the directions of discipline cultivation, and offer new perspectives and methods for the study of majors in higher education.

1. Introduction

As students begin their journey towards higher education, choosing a college major is one of the most critical decisions that students have to make during their academic journey. It not only shapes their careers but also the quality of life they lead in the future. However, different university majors come with different challenges, skills, and opportunities. Sometimes students may make the wrong choices, leading to dissatisfaction and uncertainty after graduation [1]. These wrong choices may stem from their inadequate understanding of those majors, as there are clear differences and similarities in subject knowledge, skill development, and employment direction among disciplines and majors [2]. Therefore, analysis and research on the connections between different majors is of significant importance in promoting students’ comprehensive development and enhancing the quality of education [3].
A major similarity study that compares and contrasts several majors may help students narrow down their choices, choose a major that is the best fit for them, and adapt to the requirements of different disciplines (majors). In addition, educational institutions could also optimize their teaching strategies and curriculum design more effectively [4]. Moreover, as the economy changes and new professions emerge, certain majors may become more lucrative than others. A major similarity study can examine how majors adapt to these changes, such as adding new courses or emphasizing certain skills [5,6].
Traditionally, a university major similarity study would compare the required courses, career paths, and overall curriculum of two or more majors, and thus provide insights into the majors’ similarities from the alumni’s viewpoint to help prospective students make informed decisions about their major choices. However, such traditional educational research mainly relies on methods such as questionnaire surveys and statistical analysis [7,8]. In practice, the questionnaire survey method usually requires the involvement of domain experts to design appropriate questions, and the general statistical analysis usually falls short when conducting an influence analysis between different majors. Therefore, we hope to apply informatics technology to the field of education and provide new insights for professional similarity research from a new perspective.
This work aims to employ data mining technology for modeling and analyzing educational influence using school datasets. Data mining, as an interdisciplinary field, serves the purpose of extracting valuable information from vast amounts of data and unraveling underlying patterns that aid decision makers in adjusting market strategies, mitigating risks, and making informed decisions. Its applications span across diverse domains such as data statistics, market analysis, and production management. In the context of education, specific scenarios exist in which data mining finds relevance and practical application [9,10,11,12,13]. In [13], the author proposed a combined approach of social network analysis and educational data mining, which was used to study the impact of communication networks, behavior networks, and the combination of these two networks on students’ academic performance. This kind of related research makes people aware of the importance of social networks.
A social network refers to a collection of points (social actors) and edges between points (relationships between actors). The analysis of a social network focuses on the relationships between the social actors; the patterns of which would affect the actors’ actions [14]. Estimating the influence matrix of a social network is very challenging research. In the domain of social network analysis, matrices offer a viable approach for representing the intricate structures of social networks [15]. Within these matrices, the elements serve to signify the connections or ties that exist between actors. Graphical depictions of networks can incorporate weighted edges, with the elements within matrices assuming values that reflect the strength of the relationships between actors. Previous research endeavors have predominantly focused on extracting the node reputations within the network. The edges of the network can be effectively expressed as the relationships between nodes, encompassing various forms such as “agreement”, “voting”, and “recommendation” [16]. In this work, we will apply an informatics social network technique to the school questionnaire data to analyze the underlying influence relationships between different majors. Specifically, our survey responses have been gathered from graduates of a liberal arts University in Hong Kong. The objective of this survey is to capture alumni’s opinions regarding the quality of courses and the learning environment offered by their alma mater. Drawing upon this data, the majors offered at the University are considered as nodes within a social network. By defining leader majors and general majors based on the data and modeling the questionnaire data as the outcome of a discrete random process, an influence matrix is ultimately generated through the opinion dynamic model. The focus of our research is to explore and analyze the profound interconnections between majors from a novel perspective by mining this data set.

2. Overview of Data Model
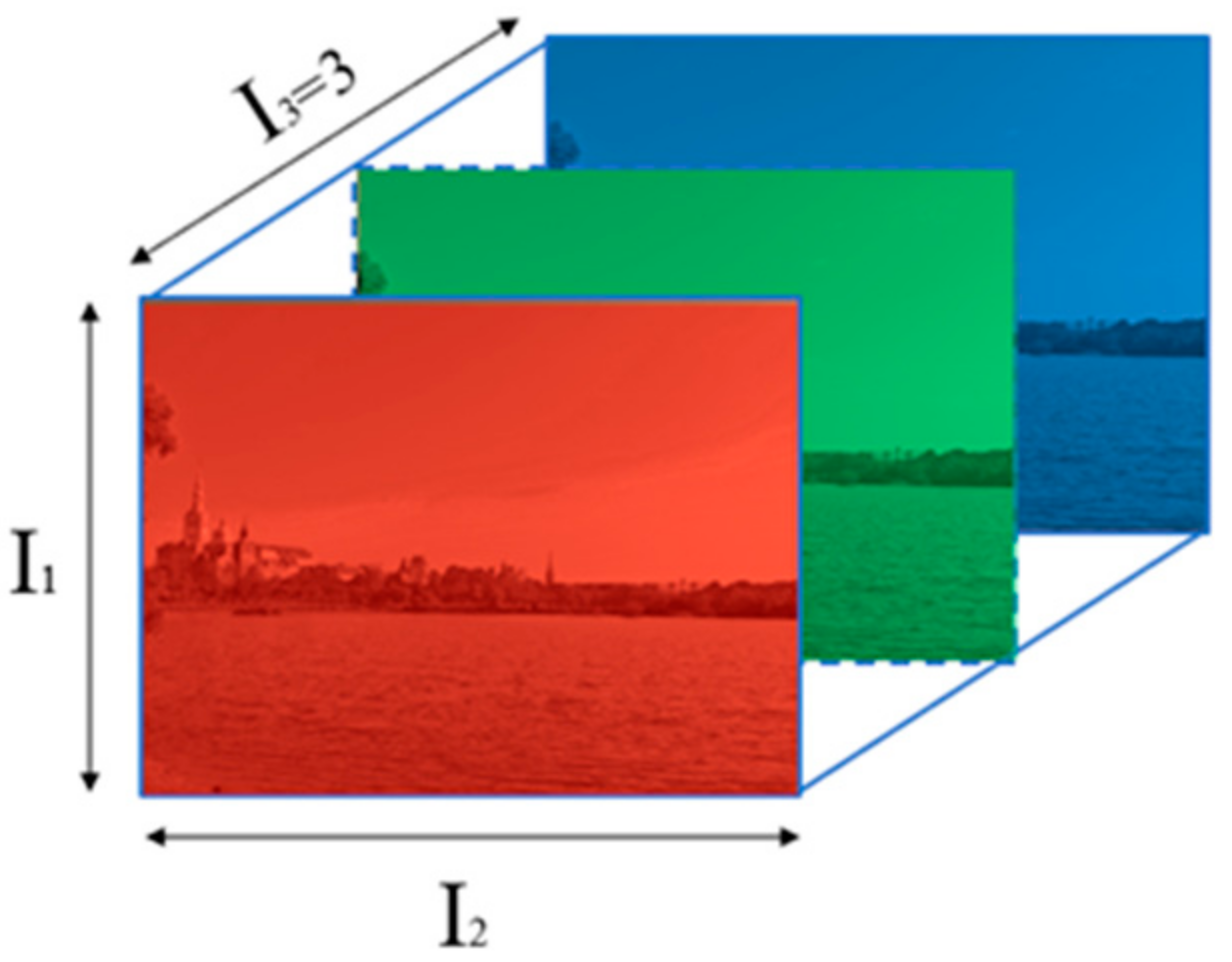
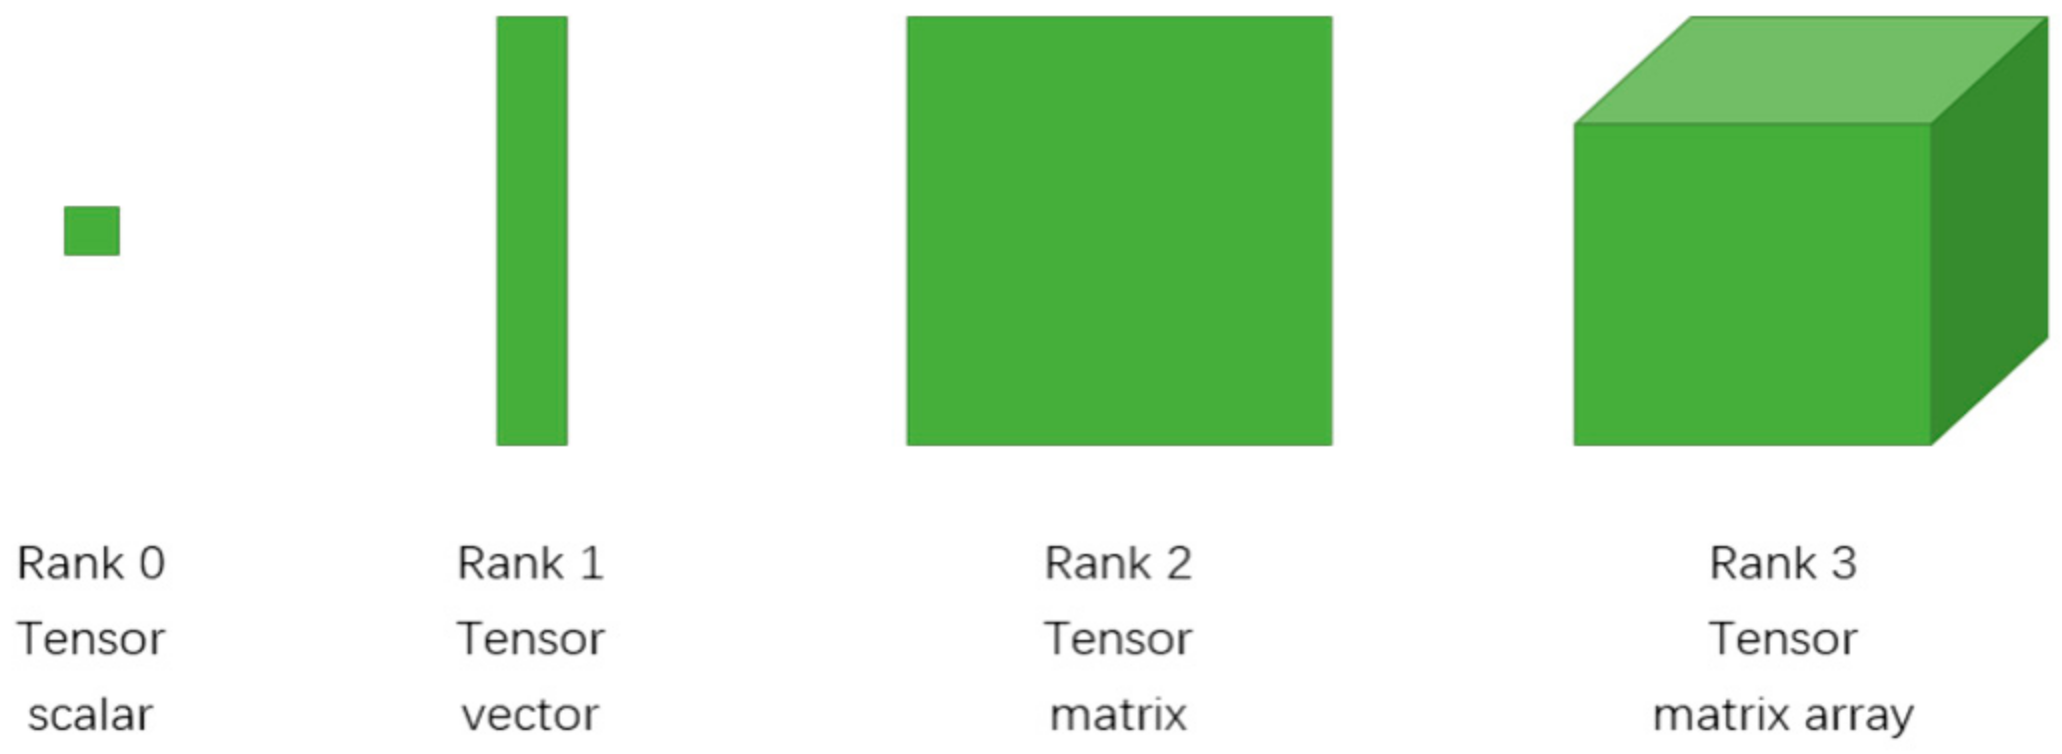
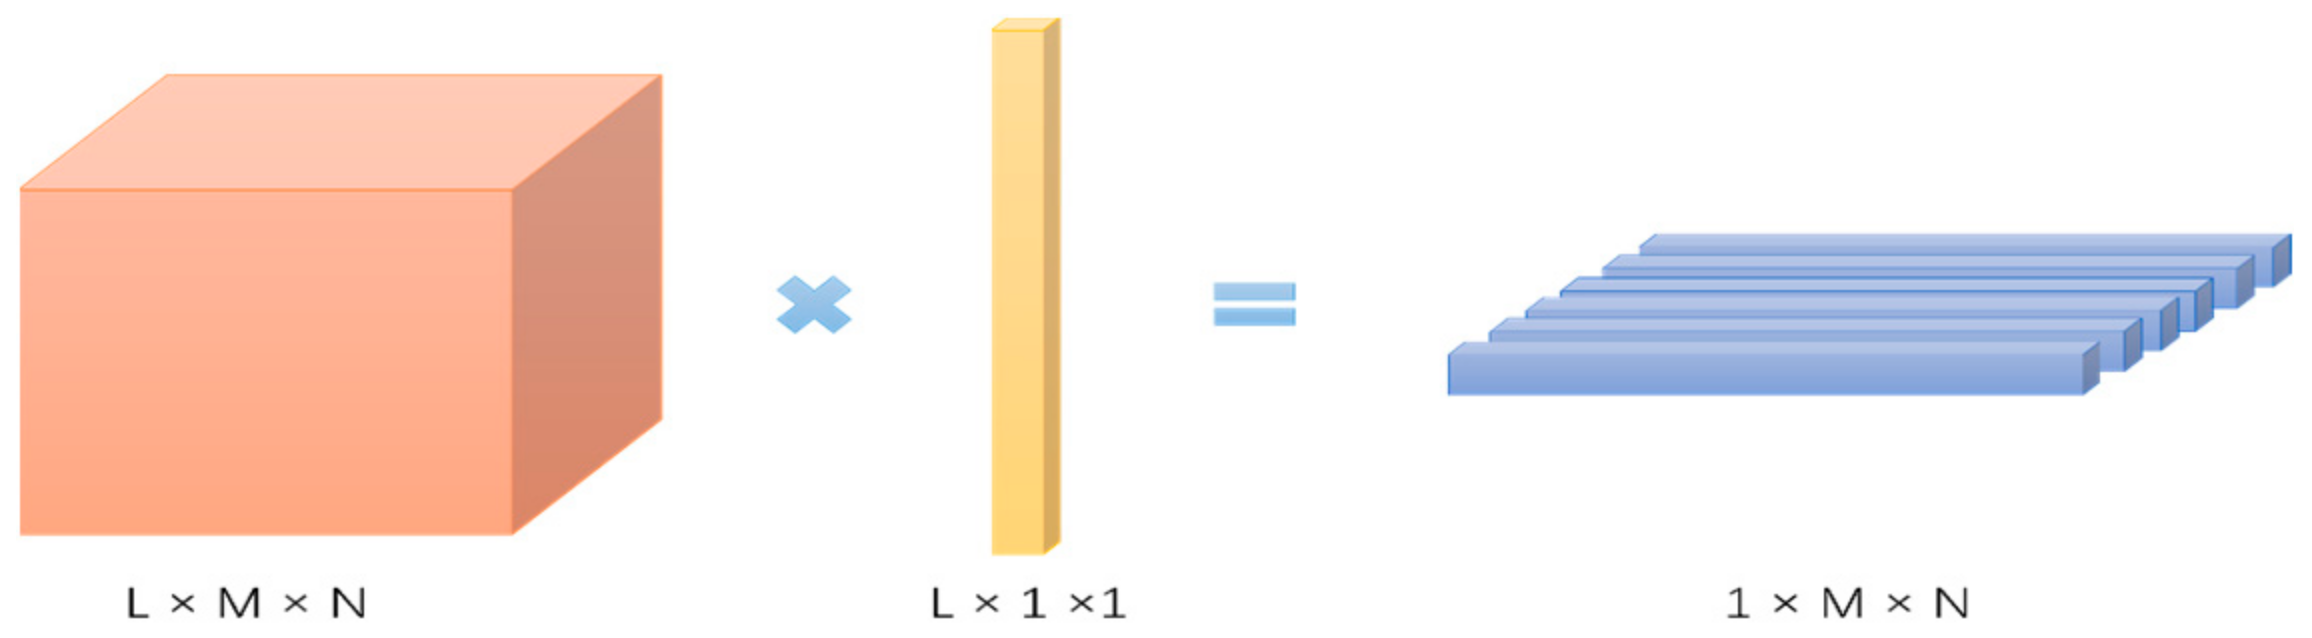
In 1974, DeGroot proposed a viewpoint dynamics model that explains how team members converge their opinions and adjust their own opinion distributions to reach consensus after gaining knowledge of the subjective opinions of other members [17]. It is postulated that a latent dynamic process precedes the completion of the questionnaire by the graduates. Within this process, alterations in the opinions of certain majors can impact the opinions of corresponding majors reflected in the questionnaire, thus exerting an influence on the opinions of other majors. This is consistent with the idea of the DeGroot model. According to the DeGroot model, interactions between users would ultimately make the whole group tend to be consistent. Some scholars proposed a simple but insightful opinion dynamics model based on the DeGroot model [18,19], which examined the traditional first-order opinion consensus algorithm with a static symbolic interaction graph.
Our previous work [20] proposed an opinion dynamic model which introduced the concept of opinion leaders into the DeGroot model. Wu et al. found that, even with the inclusion of opinion leaders, the process of opinion convergence still occurs. However, the introduction of opinion leaders leads to a divergence in the opinions of the group on specific topics, rather than achieving consensus among the nodes. It has been proven that, if we can reach the steady-state opinion distribution of nodes, the model could accurately mine the influence between nodes. In our work, we would integrate the opinions of students in the same major to obtain the opinion distribution of this major through the tensor dimension reduction. In other words, by using tensor dimension reduction, each major could be regarded as a vector. Some majors will be regarded as leader majors, also called stubborn nodes in the social graph, whose opinions cannot be swayed by other nodes [20,21,22]. Due to historical reasons or their own characteristics, the leader majors have a huge impact on other majors and will dominate the DeGroot public opinion dynamic model, as they are often the ones who influence the opinions of others and are rarely affected by other majors. By employing tensor dimension reduction and defining opinion leaders, the opinion distributions of each major would be extracted from the questionnaire data, and the final influence matrix among different disciplines (majors) would be generated through the opinion dynamics model.

2.1. Tensor

In computer science, it is essential to store such data in appropriate structures. For instance, images can be treated as two-dimensional arrays composed of pixels, with each pixel represented by a triple which denotes the RGB values. For instance, an image can be transformed into a higher-order array, as depicted in Figure 1. While scalars, vectors, and matrices can be considered as special cases of tensors, tensors are primarily used to store high-order arrays [23]. Figure 2 illustrates that scalars are zero-order tensors, and vectors are first-order tensors.
In reality, a substantial portion of the data we encounter consist of high-dimensional tensors. For instance, videos encompass temporal, visual, and auditory information. Images can be regarded as three-dimensional tensors, resulting in videos being represented as five-dimensional tensors. Processing high-dimensional tensors is more complex compared to low-dimensional tensors due to the involvement of time and increased computational requirements. To address this, we employ dimensionality reduction techniques by mapping certain dimensions onto others [24], thereby reducing the tensor’s overall dimensions. One simple approach for dimensionality reduction is multiplying a tensor with a vector, resulting in a lower-dimensional tensor, as shown in Figure 3.
There are various methods which can reduce the dimensions of a tensor and other ways to save the information from data. To reduce the storage burden, [25] proposes a novel use of the row-product random matrices in random projection, which is called Tensor Random Projection (TRP), formed as the Khatri–Rao product of a list of smaller dimension-reduction maps. In [26], the author proposed a dimension-adaptive quadrature method to reduce the dimensions of tensor automatically. In [27], the author uses nonnegative Tucker decomposition (NTD), which obtains a set of smaller core tensors by finding a set of common projection matrices of tensor objects, and finally accomplishes the dimension reduction of tensors.

2.2. Opinion Dynamic Model

By using the method introduced in the previous section, the opinion vector of each key point can be obtained based on the answers to the questionnaire. Subsequently, we can introduce the DeGroot opinion dynamic model by incorporating stubborn nodes to infer the influence matrix based on node opinions.
The opinion dynamic model assumes that, within a group, members possess an initial opinion pertaining to a specific topic, referred to as the “initial state”. Upon assimilating the opinions of other group members, a weighted aggregation approach is employed to incorporate diverse perspectives, resulting in the adjustment of one’s own opinion on the topic. This process can be conceptualized as a form of opinion integration. Eventually, each member’s opinion converges to a state of equilibrium, known as the “steady state”. This process from the “initial state” to the “steady state” represents how group members gather the opinions of others, alter their opinion distributions, and ultimately attain consensus by learning from the subjective opinions of fellow members. In the model proposed by Wu et al., after adding opinion leaders to the DeGroot model, the opinion dynamic process can still converge and the steady states will be decided by the opinion leaders. We will utilize this property to analyze how the leader majors affect other majors in the university system.
Within the university context, it is evident that different majors have different opinions on the same questionnaire. Moreover, it is important to recognize that these opinions are not entirely independent but rather influenced by majors that are closely aligned with their respective fields of study. Consequently, we assume that there is an underlying interactive process before each major fills out their questionnaire. In this process, each major will be influenced by some of the other majors to change their initial opinions, and finally form their own opinions which are then presented in the questionnaire.
We therefore consider the majors in the university as nodes in the network. We define the opinion matrix of N nodes at time t as X N × K , whose K represents the dimension of the majors’ opinion vector on a specific topic in the questionnaire. In our model there are two kinds of nodes, i.e., there are N s stubborn nodes (corresponding to the leader majors) and N n   non-stubborn nodes (corresponding to the normal majors). Then, the opinion matrix X can be expressed as   Z N s × K and Y N n × K , respectively.
X = Z Y ,
where Z N s × K and Y N n × K   represents the opinions of K parameters for stubborn nodes and non-stubborn nodes. Since the stubborn nodes are not affected by the other nodes in the network, we define the influence matrix among these majors as W N × N .
W = I N s 0 B D ,
where W is a stochastic matrix, i.e., j W ij = 1 for every i ; B N n × N s represents the influence of stubborn nodes on non-stubborn nodes, and D N s × N s   represents the mutual influence among the non-stubborn nodes. After that, our primary task is to calculate matrix B and matrix D by observing the nodes’ opinions at their steady state.
The process of opinion diffusion among N members within a group on K topics at each time point in the discussion stage can be expressed as:
X t = W X t 1 , t = 1 , 2 ,
Herein, we made the same assumption as that made in [20,28,29]: that the network corresponding to W is connected. Then, after the recursion, there will eventually be a steady state X . In this way, the underlying interactive process can be written as:
X = l i m   t X t = l i m t   W t X 0
According to the division matrix multiplication principle, we can obtain:
l i m   t W t = I N s 0 I D 1 B 0 .
As the opinions of the stubborn nodes in the network will not change throughout the whole process, i.e., lim t Z t = Z 0 , we then substitute Equation (5) into Equation (2) to obtain:
l i m t   Y t = I D 1 · B · lim t   Z t .
Then, we replace the lim t   Y t with Y and the lim t   Z t with Z to obtain:
Y = I D 1 · B · Z .
In order to solve B and D , we need to construct a linear least-square fitting problem with regularization terms. The goal is to minimize the objective function:
min B 0 ,   D 0 ρ I D Y B Z F 2 + B , D 1   s . t   B + D 1 = 1 d i a g D = l
where ρ is a parameter, which can be used to adjust the punishment of an L1 regular term B   D 1 to prevent over fitting, l is a self-trust prior of the normal nodes, which represents the degree to which a node is susceptible to influence. A higher confidence indicates a lesser susceptibility to the influence of other nodes. When ρ is smaller, the sparsity of the solution will be higher, which makes the network structure in the model sparse and adapt to the real social network scene. The operator d i a g · represents taking out the diagonal elements of the matrix and forming a vector. We can solve Problem (8) by using the CVX toolbox [30].

3. Material and Methods

This study utilizes the secondary dataset derived from the questionnaire (see Appendix A) administered and provided by the University over a span of ten project cycles between 2002 and 2020. The survey, conducted biennially, aims to assess the perspectives of alumni regarding the quality of programs and the learning environment at the University. The data collection process involved the utilization of online platforms and postal mail questionnaires. The target respondents for the survey were recent graduates of the University, with a focus on those who had graduated within the preceding five years. Key areas of investigation included in the questionnaire are:
  • Level of importance of different skills and competencies obtained at the Univeristy for the alumni in the working environment.
  • Level of satisfaction with the education the Univeristy provided in terms of nurturing different skills and competencies of students.
  • Alumni’s learning and living experiences at school, and views on supporting staff.
  • Alumni’s anonymous job information and their engagement with the Univeristy after graduation.
A diverse range of over 30 majors actively engaged with and participated in this survey. The University, in its pursuit to comprehend the perspectives of its recent alumni regarding the quality of its programs and the learning environment, diligently conducts a biennial survey. The invaluable data collected through this survey will play a pivotal role in facilitating the university’s ongoing endeavors to enhance the design of its programs. By leveraging this information, the University aims to equip future students with the essential skills and knowledge required to adeptly tackle the multifaceted challenges arising from the dynamic and ever-evolving demands of the twenty-first century.
This section can be divided by subheadings. It should provide a concise and precise description of the experimental result and their interpretation, as well as the experimental conclusions that can be drawn.

3.1. Data Preprocessing

Due to the dynamic nature of the questionnaire, which involves the addition and deletion of questions in each iteration, the dataset collected exhibits inherent differences. Consequently, it is imperative to preprocess the collected data before direct utilization due to the presence of numerous missing values and extraneous information. Questions that lack over 15% of responses were excluded from further analysis.
Moreover, considering the research objective of investigating potential interdependencies among majors through questionnaire completion, specific questions related to demographic information, such as “company size”, “current salary” and “industry”, were deemed irrelevant, as they do not involve any deliberation process prior to questionnaire completion. Additionally, questions that lack variation in response options were removed as imputing missing values and generating meaningful matrix values becomes challenging in such scenarios.
Following the aforementioned steps, a set of 53 questions (highlighted in yellow in Appendix A) with few missing values was selected as the pertinent information. Subsequently, to ensure the accuracy of results, graduate data containing more than 20% missing responses were excluded. However, even after these measures, the dataset may still have contained certain missing or invalid values, which were subsequently filled using the mode as it represented the most common selection among users for such issues. Furthermore, graduates who failed to provide their student numbers or filled “Others” in the “Major” option were excluded from the study, and we retained only the samples from the specific 29 options for majors provided on the questionnaire. Finally, we obtained 6090 samples from a total of 6771 questionnaire responses. The graduate data corresponding to each major were integrated separately based on the major number, resulting in the creation of 29 distinct matrices of graduate data.

3.2. Selection of the Leader Major

In the process of selecting leaders in the group, we believe that influential members should be more capable, have more resources, or be able to lead more members. Hence, we can identify leaders and normal members by evaluating their leadership skills or the number of resources that he possesses. Considering the characteristics of the data set, this experiment chose the latter method. That is, majors with a larger number of students are designated as “leadership majors” as they are more cohesive, have firmer opinions, and are less susceptible to external influences from other majors. Conversely, majors with smaller graduate populations are deemed as general majors, as they are more prone to being influenced by the opinions of other majors. We had a total of 29 majors. We therefore allocated the leader majors and the normal majors according to the ratio of 1:3 (this is also a proper ratio for which Problem (8) can be successfully solved [22]). Therefore, we chose the 7 majors with the largest number of students, namely Chinese, Cultural Studies, Translation, Accounting, Human Resource Management, Marketing, and Contemporary Social Issues and Policy, as our leader majors, and the other majors were classified as the normal majors.

3.3. Extraction of Majors’ Opinion Vector
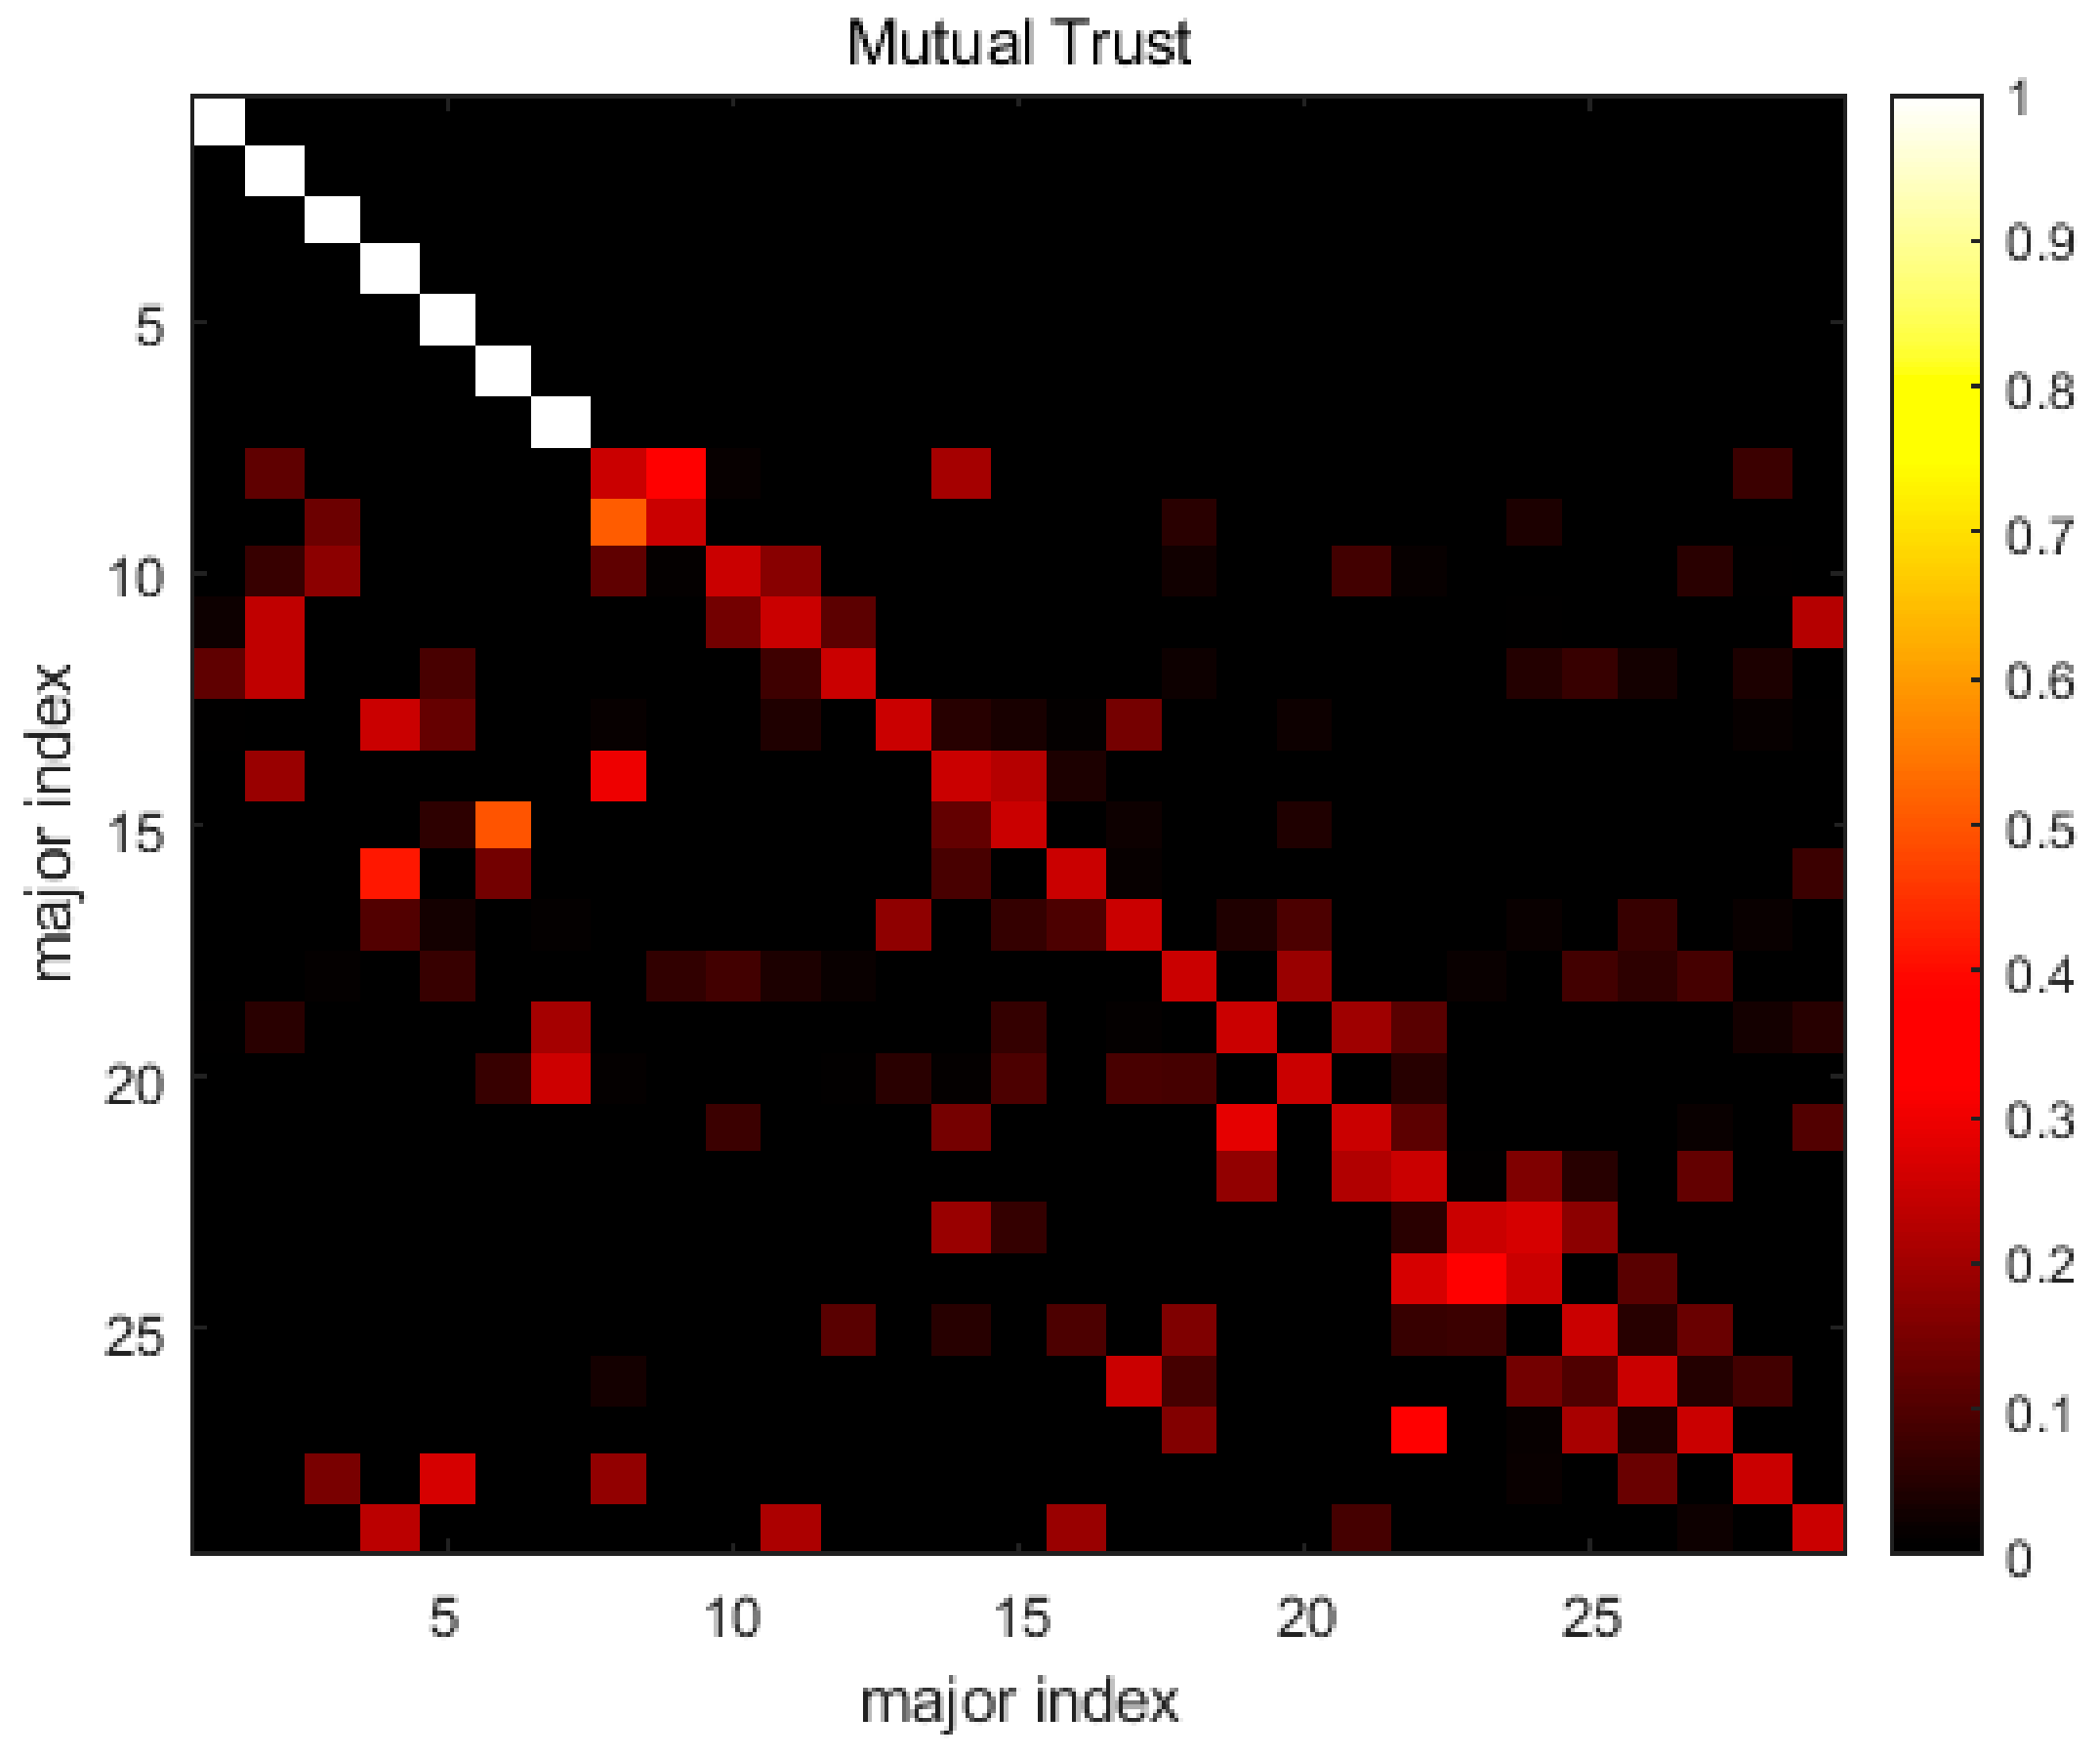
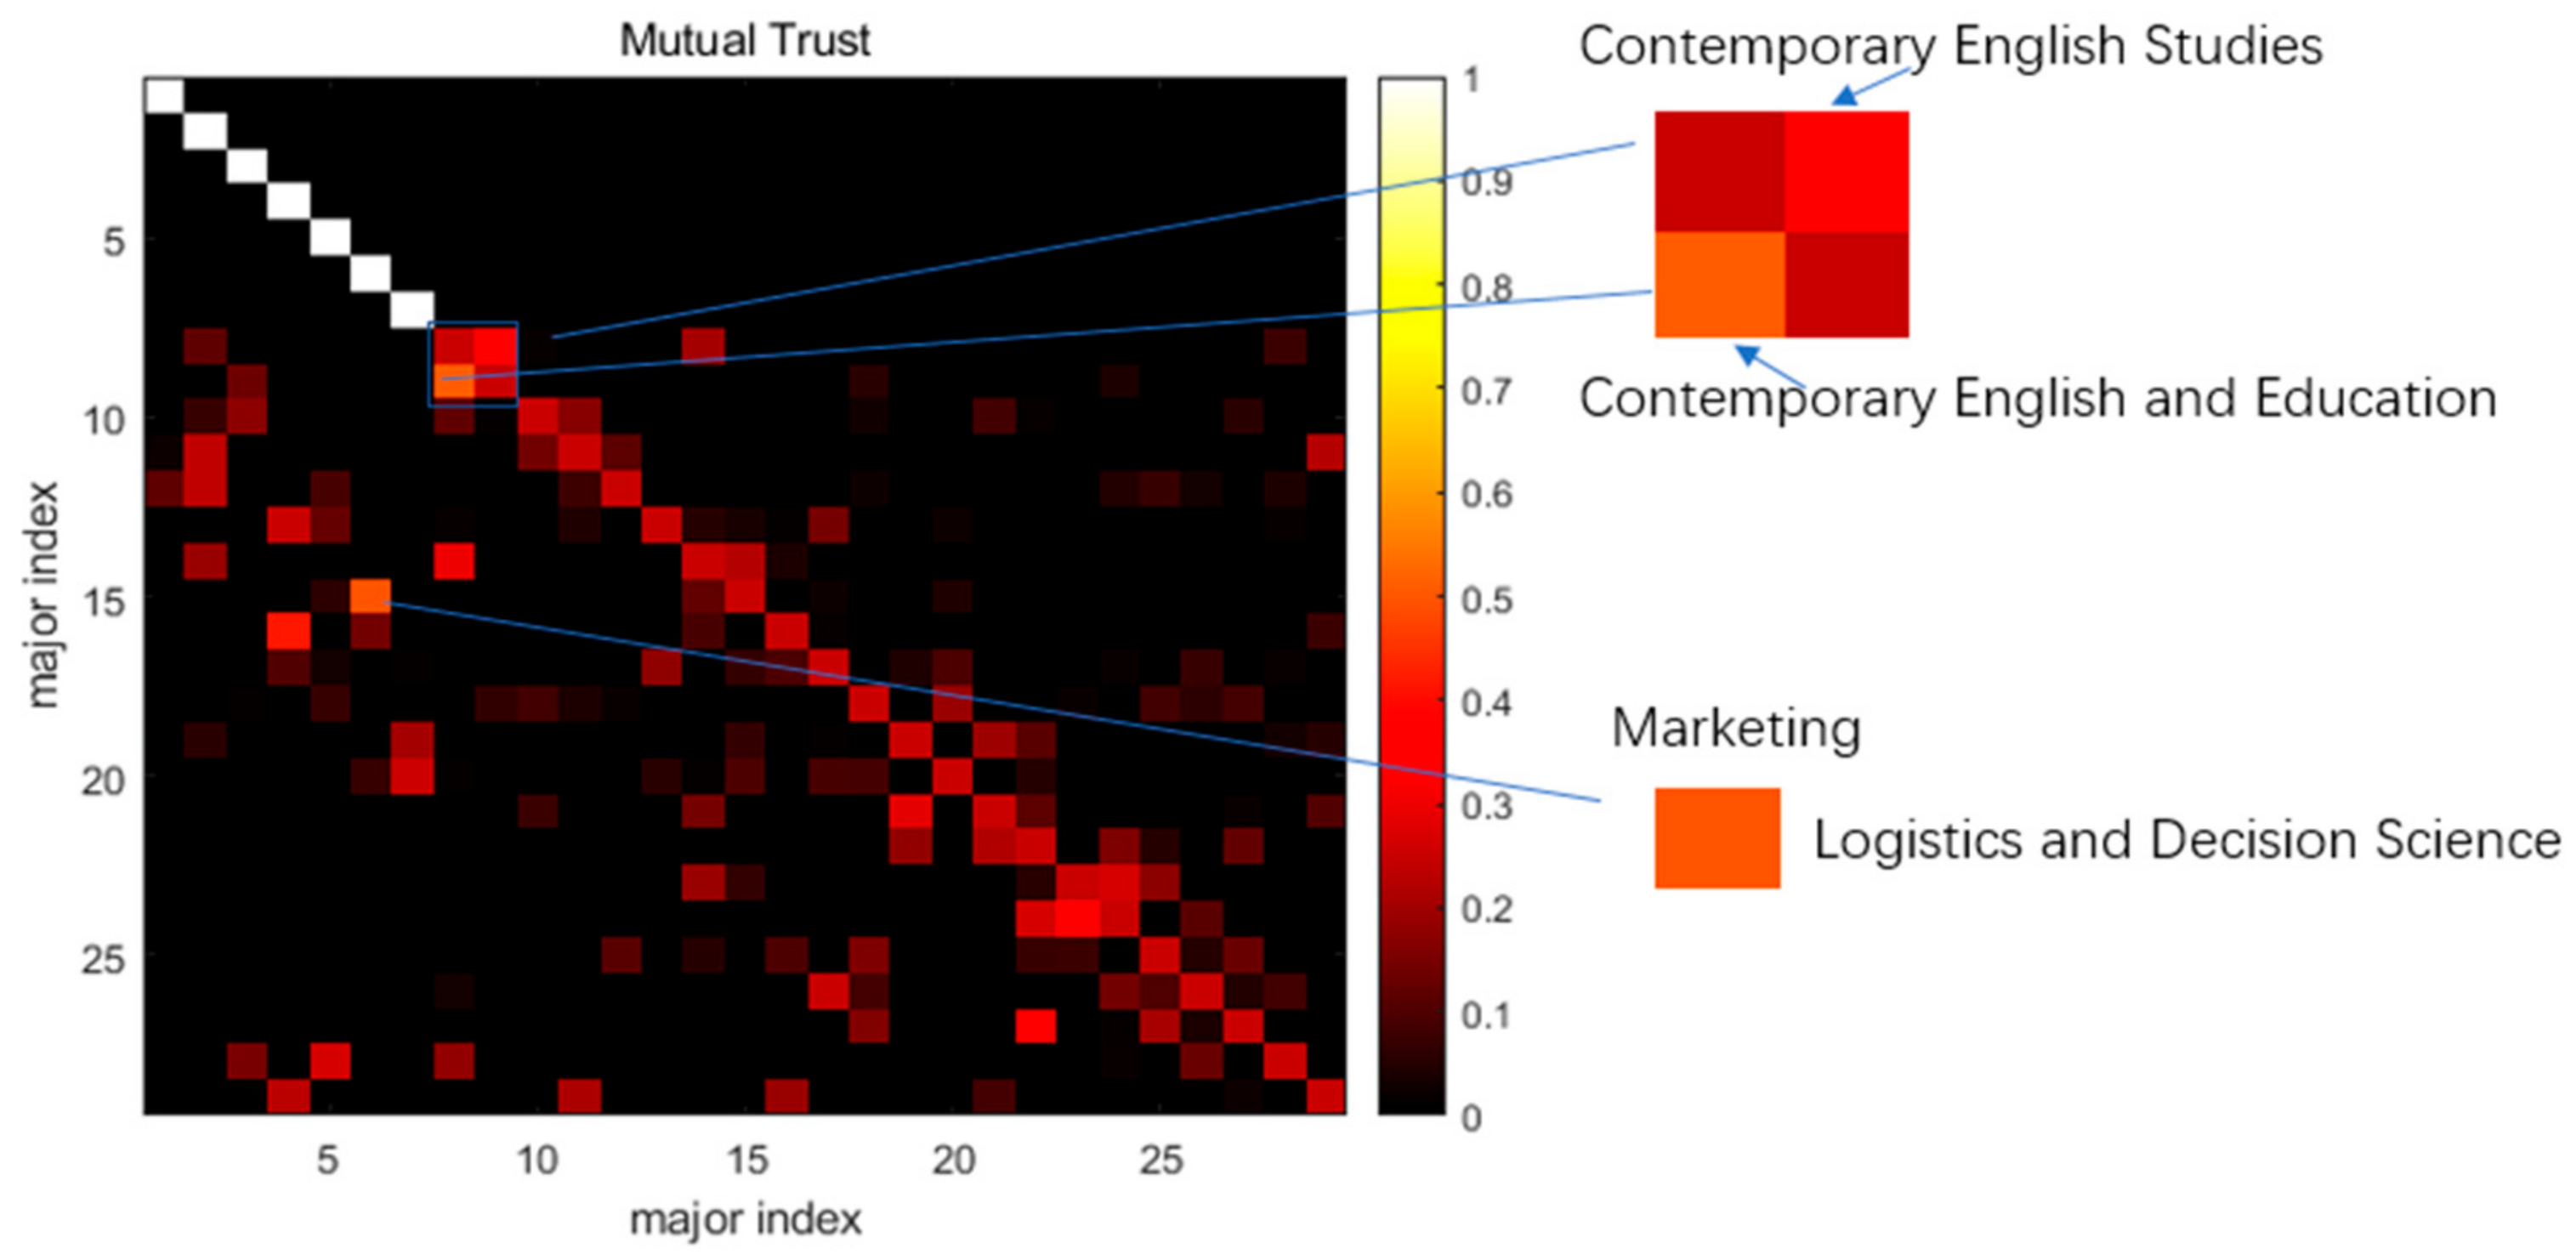
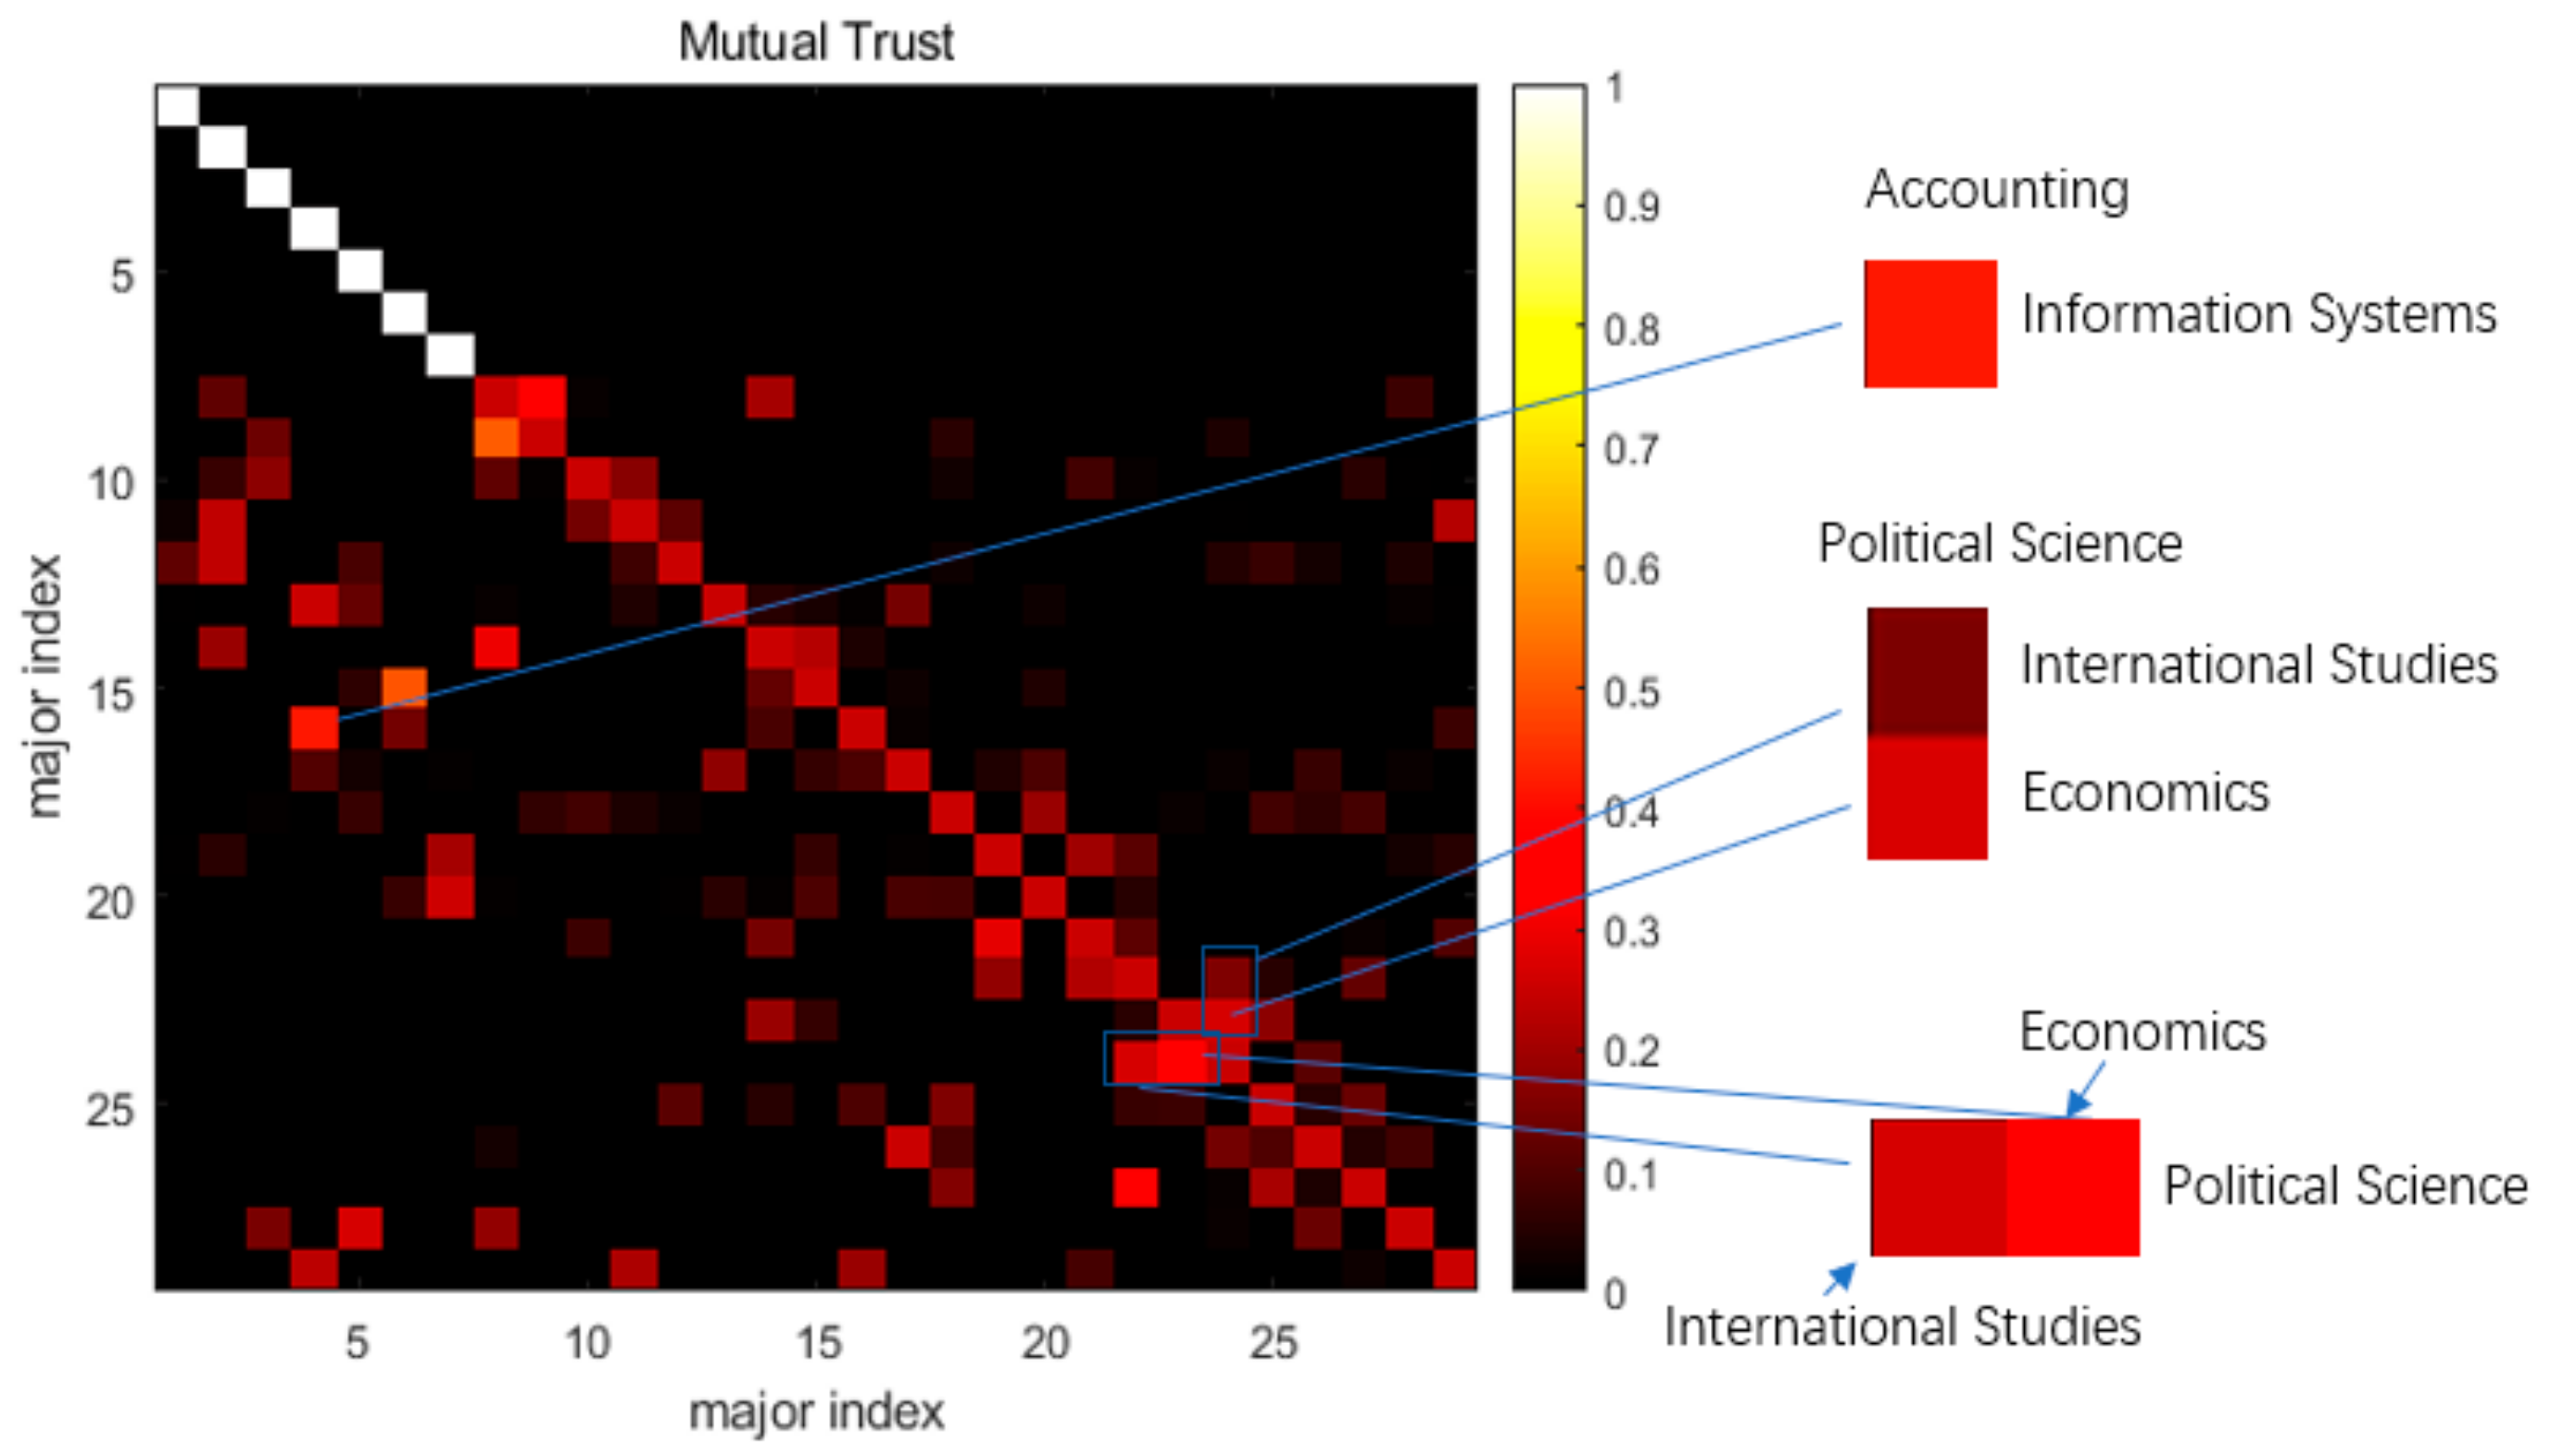
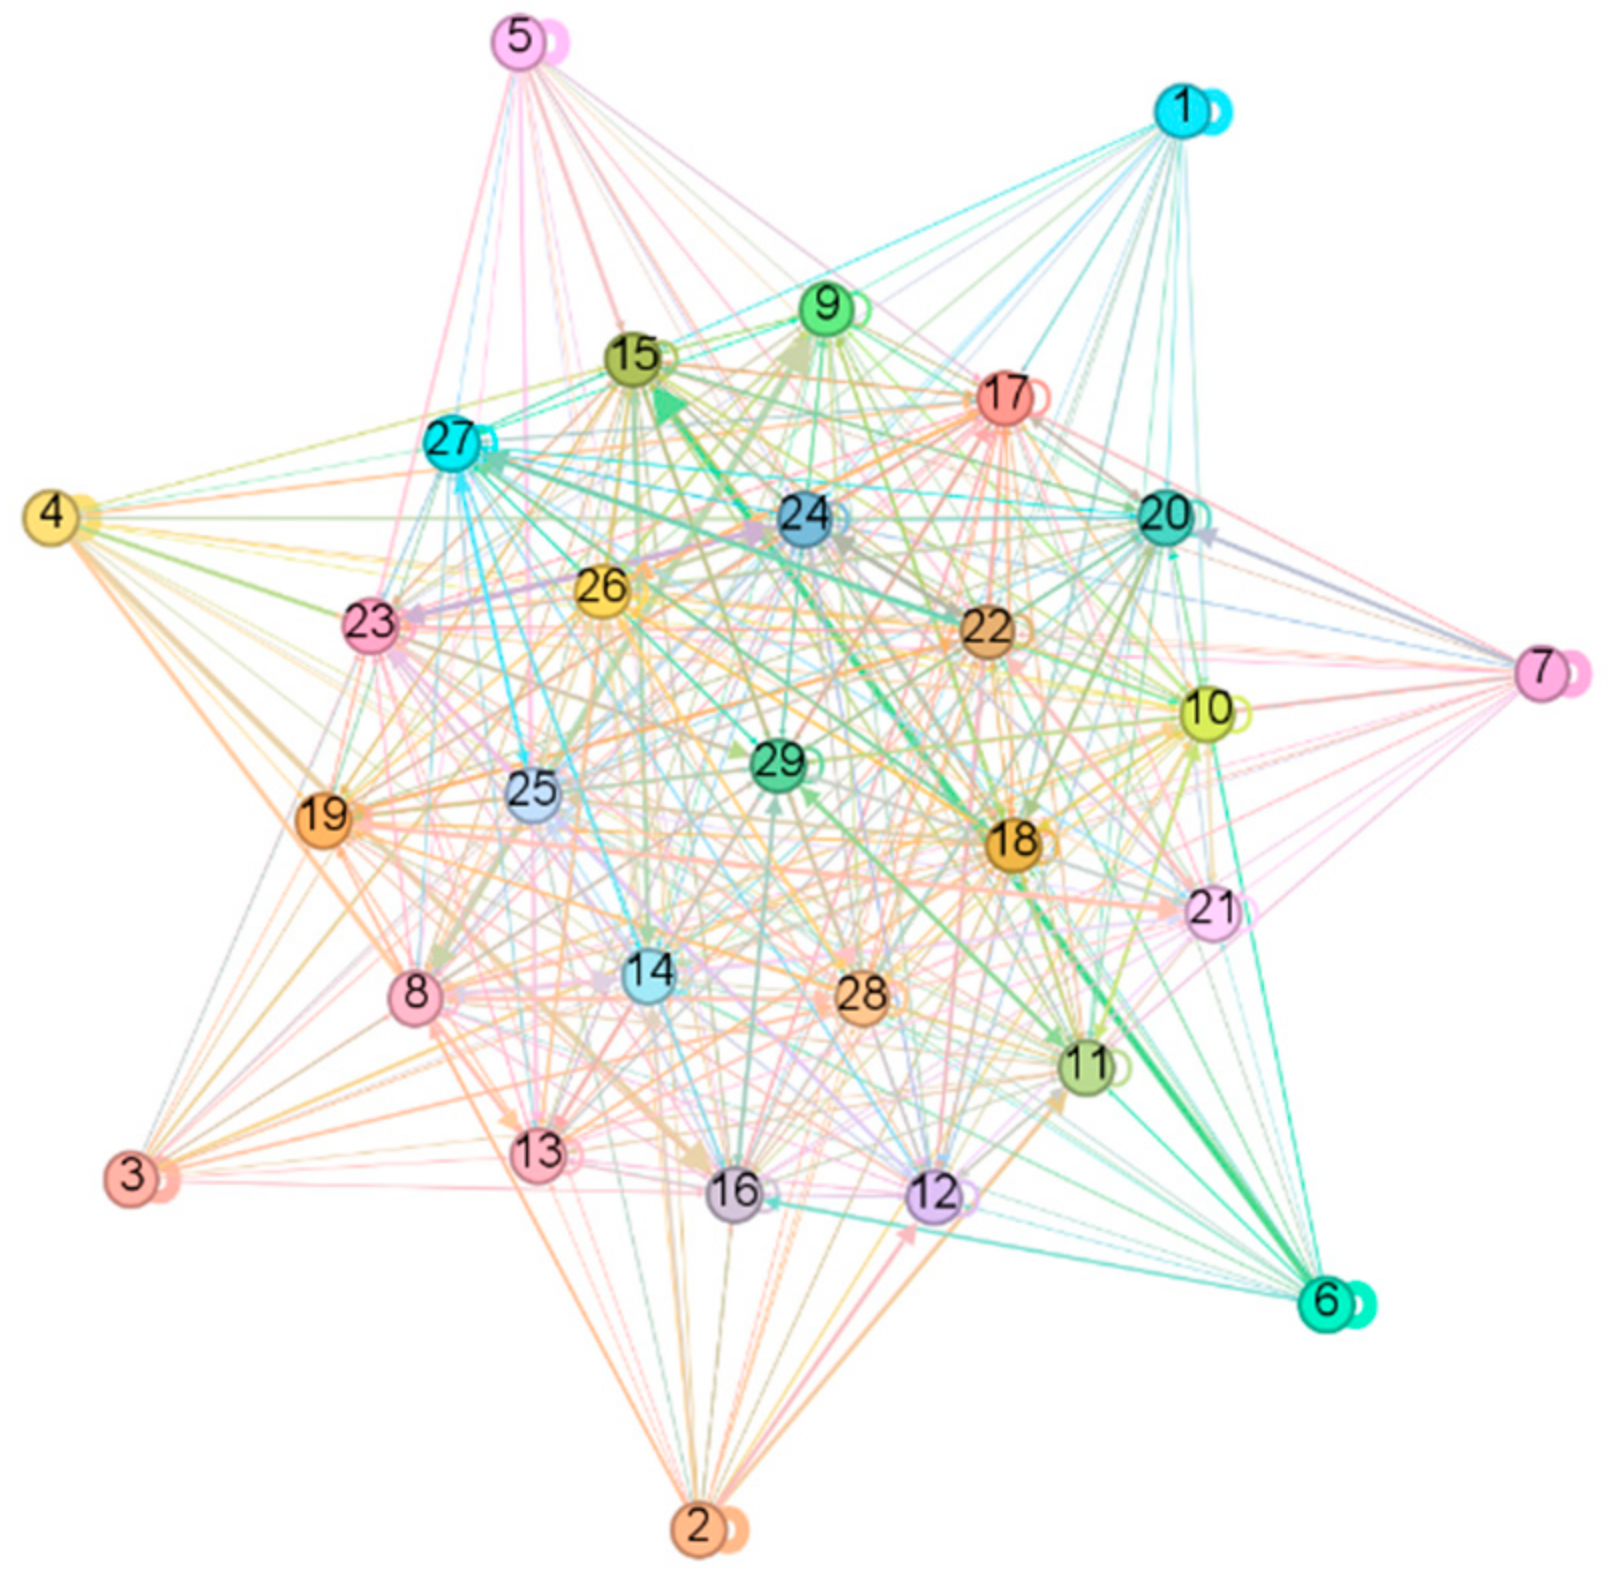
The data can be viewed as a tensor, with the three dimensions representing major, graduates, and questionnaire answers, respectively. In order to reduce the complexity of the model, the dimension of the tensor data needs to be reduced first. In Section 2, a simple method of tensor dimension reduction is introduced. The dimension of the data could be reduced by multiplying the tensor and the vector. Since the data do not contain any individual-specific information about graduates, each graduate was treated as an equal entity. Therefore, the length of our vector is L, and each element is 1/L, where L is the number of students corresponding to each major. This approach enables us to accord equal weight to the opinions of students within the same major. Ultimately, the opinions of students in the same major could be integrated to obtain the opinion distribution of this major through the tensor dimension reduction. The opinion matrix, composed of majors and questionnaire questions, can be obtained by splicing the opinion vectors of each major obtained in the previous section. The vertical axis represents majors, and the horizontal axis represents their responses to various questions. In order to mitigate overfitting and obtain sparser solutions that are more suitable for real-world scenarios, the parameter ρ is set to 0.9 and the confidence parameter l of normal nodes is set to 0.25 to achieve a good training performance. To solve this optimization problem, we can directly utilize the well-established numerical computing software MATLAB (version 2.0) along with the corresponding optimization toolbox, CVX [30]. We could ultimately obtain the optimal solution and output the figure of influence matrix by the function “imagesc” in MATLAB. The “imagesc” function converts the values in the matrix to different colors and paints them at the corresponding positions on the coordinate axis. The brighter positions denote a larger value in the influence matrix we plotted.

4. Results

Figure 4 illustrates the influence matrix derived using the aforementioned methodology. The index range of one to seven corresponds to leading majors, while the index range of eight to twenty-nine represents general majors. Based on the color bar on the right and the darkness of the highlighted part in the figure, we can observe the degree of influence between majors. Generally speaking, if the research content of two majors is more relevant, the influence between them will be greater. A comprehensive analysis of our experimental results also further demonstrates this conclusion.
Based on Figure 4, it can be deduced and analyzed that considerable reciprocal influence exists among majors that share similarities. The findings indicate the presence of mutual influence between Contemporary English Studies and Contemporary English and Education as shown in Figure 5. Specifically, the impact of Contemporary English Studies on Contemporary English and Education appears to be more pronounced. There clear similarities exist between these two majors from the perspective of disciplinary characteristic and objective, which may contribute to the substantial influence relationship observed between them.
Furthermore, Marketing evidently exerts influence on Logistics and Decision Science. Marketing places emphasis on areas such as consumer behavior, market research, and market positioning, which align with the decision science and analytical techniques employed in Logistics and Decision Science. This alignment facilitates the formulation of effective marketing strategies and decisions. Hence, the noteworthy impact of Marketing on Logistics and Decision Science is not surprising. In general, these majors demonstrate a significant level of similarity with one another.
The marked influence of Accounting on Information Systems can be observed in Figure 6. It is widely acknowledged that graduates majoring in accounting frequently encounter information systems in their professional endeavors, as they are adept at managing and auditing complex systems as part of their responsibilities in the workplace. Conversely, graduates majoring in Information Systems often engage in the establishment of comprehensive information systems and the management of databases as integral components of their jobs’ requirements. As such, the interconnectedness between these two majors is to be expected.
Additionally, the results indicate that both International Studies and Economics have an influence on Political Science. It is universally acknowledged that economics and politics are inseparable, and the study of international relations cannot be separated from the support of political science. This logical connection is reflected in the influence exerted by these two majors. However, the influence of Political Science on Economics and International Studies is relatively less pronounced in Figure 6, yet they all belong to School of Social Science. Based on this result, universities can consider strengthening the connections between these three majors in various aspects.
To visualize the influence relationships among the majors at the University, we employed the Fruchterman–Reingold algorithm, available in the Gephi drawing software [31]. Gephi 0.10.1 is a piece of software used for visualizing and exploring all types of graphs and networks. Figure 7 illustrates the resultant visualization by Gephi. In this representation, the outer nodes correspond to leader majors, while the inner nodes represent general majors. The edges connecting the nodes are depicted as weighted arrows, with thicker edges indicating larger weights. Upon examining the visualization in a clockwise manner, it becomes apparent that the majority of leader majors exhibit thicker arrows pointing towards general majors. Conversely, a few leader majors display thinner arrows indicating influence towards general majors.

5. Conclusions

In conclusion, the primary objective of this study was to implement an influence analysis and uncover the underlying influence relationships between majors within questionnaire data from the perspective of alumni. To achieve this, we proposed an informatics data mining approach that leverages an opinion dynamic model to explore the mutual influences among various majors, utilizing data from a questionnaire completed by graduates. Through the examination of the generated model, our findings align with widely held opinions regarding the practical relevance of graduates’ majors to their respective careers.
In addition, as we have mined the underlying influence between any two majors from our social network model, we can discover and analyze which majors within the university are closely connected and which lack interdisciplinary links. This information can help students make better choices when selecting majors, and facilitate academic exchanges with other majors. In addition, it also provides a good reference for optimizing teaching strategies and curriculum design, promoting communication between disciplines (majors), and promoting interdisciplinary cooperation.
Moreover, the proposed methodology proposed in this paper opens up possibilities to further mine data from graduates, providing researchers with a new perspective to further explore the differences and connections between majors and devise career development strategies tailored to different majors within educational institutions.

Author Contributions

Conceptualization, N.Z. and S.X.W. methodology, S.X.W. and Q.L.; software, N.Z.; validation, S.X.W. and Q.L.; formal analysis, S.X.W.; investigation, Q.L.; resources; data curation, Q.L.; writing—original draft preparation, Q.L.; writing—review and editing, J.Z., Q.L. and J.H.; visualization, Q.L.; supervision, S.X.W.; project administration, Q.L.; funding acquisition, Q.L. All authors have read and agreed to the published version of the manuscript.

Funding

No funding was received to conduct this study.

Institutional Review Board Statement

This survey is a standard institutional survey, started before 1995. Ethics Committee or Institutional Review Board approval not be required for the manuscript. The aggregate data are available in the University annual report: https://www.ln.edu.hk/media/publications-and-multimedia/university-publications/annual-report (1 March 2024).

Informed Consent Statement

Not applicable.

Data Availability Statement

Data available on request due to restrictions.

Conflicts of Interest

The authors declare no conflicts of interest.

Appendix A. The Questionnaire from the Alumni Survey

Education 14 00337 i001
Education 14 00337 i002
Education 14 00337 i003
Education 14 00337 i004
Education 14 00337 i005
Education 14 00337 i006
Education 14 00337 i007
Education 14 00337 i008

References

  1. Gordon, V.N.; Steele, G.E. The Undecided College Student: An Academic and Career Advising Challenge; Charles C Thomas Publisher: Springfield, IL, USA, 2015. [Google Scholar]
  2. Neumann, R. Disciplinary Differences and University Teaching. Stud. High. Educ. 2001, 26, 135–146. [Google Scholar] [CrossRef]
  3. Hsu, Y.; Chi, Y. Academic major satisfaction and regret of students in different majors: Perspectives from Self-Determination Theory. Psychol. Sch. 2022, 59, 2287–2299. [Google Scholar] [CrossRef]
  4. Peffer, M.; Renken, M. Practical strategies for collaboration across discipline-based education research and the learning sciences. CBE—Life Sci. Educ. 2016, 15, es11. [Google Scholar] [CrossRef]
  5. Denice, P.A. Choosing and Changing Course: Postsecondary Students and the Process of Selecting a Major Field of Study. Sociol. Perspect. 2021, 64, 82–108. [Google Scholar] [CrossRef]
  6. Pinxten, M.; De Fraine, B.; Van Den Noortgate, W.; Van Damme, J.; Boonen, T.; Vanlaar, G. ‘I choose so I am’: A logistic analysis of major selection in university and successful completion of the first year. Stud. High. Educ. 2015, 40, 1919–1946. [Google Scholar] [CrossRef]
  7. Glynn, S.M.; Brickman, P.; Armstrong, N.; Taasoobshirazi, G. Science motivation questionnaire II: Validation with science majors and nonscience majors. J. Res. Sci. Teach. 2011, 48, 1159–1176. [Google Scholar] [CrossRef]
  8. Balsamo, M.; Lauriola, M.; Saggino, A. Work values and college major choice. Learn. Individ. Differ. 2013, 24, 110–116. [Google Scholar] [CrossRef]
  9. Zhang, X.; Wang, P.-C.; Wang, M.-N.; Chen, N.-Y. Big Data Mining and Analysis of Hot Issues in International Education—Based on K-means algorithm of cluster analysis. In Proceedings of the 2020 International Conference on Information Science and Education (ICISE-IE), Sanya, China, 4–6 December 2020; pp. 1–4. [Google Scholar] [CrossRef]
  10. De Paula Santos, F.; Lechugo, C.P.; Silveira-Mackenzie, I.F. “Speak well” or “complain” about your teacher: A contribution of education data mining in the evaluation of teaching practices. In Proceedings of the 2016 International Symposium on Computers in Education (SIIE), Salamanca, Spain, 13–15 September 2016; pp. 1–4. [Google Scholar] [CrossRef]
  11. Yanrong, P. Research on Intelligent Education Method Based on Data Mining of Distance Education System. In Proceedings of the 2021 International Conference on Intelligent Transportation, Big Data & Smart City (ICITBS), Xi’an, China, 27–28 March 2021; pp. 586–589. [Google Scholar] [CrossRef]
  12. Tang, R.; Zou, J.; Chen, S.; Li, L. Research on Quality Modeling of Information Education in Colleges and Universities Based on Web Data Mining. In Proceedings of the 2019 International Conference on Smart Grid and Electrical Automation (ICSGEA), Xiangtan, China, 10–11 August 2019; pp. 576–582. [Google Scholar] [CrossRef]
  13. Mastoory, Y.; Rajaee Harandi, S.; Abdolvand, N. The effects of communication networks on students’ academic performance: The synthetic approach of social network analysis and data mining for education. Int. J. Integr. Technol. Educ. 2016, 5, 23–34. [Google Scholar] [CrossRef]
  14. Peng, S.; Zhou, Y.; Cao, L.; Yu, S.; Niu, J.; Jia, W. Influence analysis in social networks: A survey. J. Netw. Comput. Appl. 2018, 106, 17–32. [Google Scholar] [CrossRef]
  15. Wasserman, S. Social Network Analysis: Methods and Applications; Cambridge University Press: Cambridge, UK, 1994; Volume 2, pp. 1–22. [Google Scholar]
  16. Abdul-Rahman, A.; Hailes, S. Supporting trust in virtual communities. In Proceedings of the 33rd Annual Hawaii International Conference on System Sciences, Maui, HI, USA, 7 January 2000; Volume 1, p. 9. [Google Scholar] [CrossRef]
  17. DeGroot, M.H. Reaching a consensus. J. Am. Stat. Assoc. 1974, 69, 118–121. [Google Scholar] [CrossRef]
  18. Altafini, C. Consensus Problems on Networks with Antagonistic Interactions. IEEE Trans. Autom. Control 2013, 58, 935–946. [Google Scholar] [CrossRef]
  19. Altafini, C. Dynamics of opinion forming in structurally balanced social networks. In Proceedings of the 2012 IEEE 51st IEEE Conference on Decision and Control (CDC), Maui, HI, USA, 10–13 December 2012; pp. 5876–5881. [Google Scholar] [CrossRef]
  20. Wu, S.X.; Wai, H.-T.; Scaglione, A. Estimating Social Opinion Dynamics Models from Voting Records. IEEE Trans. Signal Process. 2018, 66, 4193–4206. [Google Scholar] [CrossRef]
  21. Acemoglu, D.; Ozdaglar, A. Opinion dynamics and learning in social networks. Dyn. Games Appl. 2011, 1, 3–49. [Google Scholar] [CrossRef]
  22. Wai, H.T.; Scaglione, A.; Leshem, A. Active sensing of social networks. IEEE Trans. Signal Inf. Process. Netw. 2016, 2, 406–419. [Google Scholar] [CrossRef]
  23. Kolda, T.G.; Bader, B.W. Tensor decompositions and applications. SIAM Rev. 2009, 51, 455–500. [Google Scholar] [CrossRef]
  24. Wang, H.; Ahuja, N. A Tensor Approximation Approach to Dimensionality Reduction. Int. J. Comput. Vis. 2008, 76, 217–229. [Google Scholar] [CrossRef]
  25. Gerstner, T.; Griebel, M. Dimension–Adaptive Tensor–Product Quadrature. Computing 2003, 71, 65–87. [Google Scholar] [CrossRef]
  26. Li, X.; Ng, M.K.; Cong, G.; Ye, Y.; Wu, Q. MR-NTD: Manifold Regularization Nonnegative Tucker Decomposition for Tensor Data Dimension Reduction and Representation. IEEE Trans. Neural Netw. Learn. Syst. 2017, 28, 1787–1800. [Google Scholar] [CrossRef] [PubMed]
  27. Sun, Y.; Guo, Y.; Tropp, J.A.; Udell, M. Tensor random projection for low memory dimension reduction. arXiv 2021, arXiv:2105.00105. [Google Scholar]
  28. Sahafizadeh, E.; Ladani, B.T. The impact of group propagation on rumor spreading in mobile social networks. Phys. A Stat. Mech. Appl. 2018, 506, 412–423. [Google Scholar] [CrossRef]
  29. Dong, Y.; Ding, Z.; Chiclana, F.; Herrera-Viedma, E. Dynamics of public opinions in an online and offline social network. IEEE Trans. Big Data 2017, 7, 610–618. [Google Scholar] [CrossRef]
  30. CVX Research, Inc. CVX: Matlab Software for Disciplined Convex Programming, Version 2.0. April 2011. Available online: http://cvxr.com/cvx (accessed on 31 August 2012).
  31. Bastian, M.; Heymann, S.; Jacomy, M. Gephi: An open source software for exploring and manipulating networks. In Proceedings of the Third International AAAI Conference on Web and Social Media, San Jose, CA, USA, 17–20 May 2009; Volume 3, pp. 361–362. [Google Scholar]
Figure 1. Each pixel could be considered as a triple composed of RGB.
Education 14 00337 g001
Figure 2. A tensor is an N-dimensional array of data.
Education 14 00337 g002
Figure 3. Multiply tensor and vector to reduce the dimension.
Education 14 00337 g003
Figure 4. The influence matrix among majors.
Education 14 00337 g004
Figure 5. The first example of the influence matrix: the mutual influence among similar majors.
Education 14 00337 g005
Figure 6. The second example of the influence matrix: the mutual influence among related majors.
Education 14 00337 g006
Figure 7. Visualization of majors’ influence relationships with Gephi.
Education 14 00337 g007
Disclaimer/Publisher’s Note: The statements, opinions and data contained in all publications are solely those of the individual author(s) and contributor(s) and not of MDPI and/or the editor(s). MDPI and/or the editor(s) disclaim responsibility for any injury to people or property resulting from any ideas, methods, instructions or products referred to in the content.

