Article

The Visual Science Communication Toolkit: Responding to the Need for Visual Science Communication Training in Undergraduate Life Sciences Education

Biomedical Communications, Department of Biology, University of Toronto, Mississauga, ON L5L 1C6, Canada
*
Author to whom correspondence should be addressed.
Educ. Sci. 2024, 14(3), 296; https://doi.org/10.3390/educsci14030296
Submission received: 25 November 2023 / Revised: 27 February 2024 / Accepted: 3 March 2024 / Published: 12 March 2024
(This article belongs to the Special Issue Visualization in Biology Education)

Abstract

:
Visual representations are essential to scientific research and teaching, playing a role in conceptual understanding, knowledge generation, and the communication of discovery and change. Undergraduate students are expected to interpret, use, and create visual representations so they can make their thinking explicit when engaging in discourse with the scientific community. Despite the importance of visualization in the biosciences, students often learn visualization skills in an ad hoc fashion without a clear framework. We used a mixed-methods sequential explanatory study design to explore and assess the pedagogical needs of undergraduate biology students (n = 53), instructors (n = 13), and teaching assistants (n = 8) in visual science communication education. Key themes were identified using inductive grounded theory methods. We found that extrinsic motivations, namely time, financial resources, and grading practices, contribute to a lack of guidance, support, and structure as well as ambiguous expectations and standards perceived by students and instructors. Biology and science visualization instructors cite visual communication assessments as a way of developing and evaluating students’ higher-order thinking skills in addition to their communication competencies. An output of this research, the development of a learning module, the Visual Science Communication Toolkit, is discussed along with design considerations for developing resources for visual science communication education.

1. Introduction

1.1. Scientists Have a Responsibility to Communicate Their Research to the Public

Science communication can be defined as the use of appropriate skills, media, activities, and dialogue to solicit understanding, awareness, appreciation, interest, and opinions regarding science-related topics [1]. This communication is recognized as central to building trust between science and society [2] and is therefore delivered in a format that remains faithful to scientific evidence and is designed to be understood by the intended audience [3]. It can be outward-facing, which involves mediated communication from scientists to the general public (e.g., outreach, journalism), or inward-facing among scientists (e.g., scholarly communication, publication) [4]. Models for science communication can be divided into two paradigms differentiated by their aims and modes of communication [5]:
  • Models in the dissemination paradigm, such as the knowledge deficit model, use a one-way process of transmitting scientific findings to raise the level of scientific literacy among non-expert audiences. This can take the form of education in a formal school setting or through mass media (e.g., television, magazines, and books).
  • Models in the public participation paradigm focus on facilitating two-way communication and discussion between the public, experts, and policymakers. Engaging the public can improve the public’s perceptions of and beliefs in the legitimacy of scientific issues, and common platforms include public forums, referendums, and citizen science projects.
Modern developments in media and technology have changed the field of science communication—diversifying the practice, shifting previously conceived paradigms and models, and redefining the roles and responsibilities of stakeholders involved in science communication [6,7]. With the advent of interactive online media and communication services (e.g., social media platforms), all stakeholders, especially the lay public, have greater influence over the dissemination of scientific information, whether it is by producing content and commentary or influencing the reach of a story through likes, comments, and shares [8]. This has led to the elimination of a niche previously held by legacy media outlets and specialized science journalists [9]. As a result, scientists, and by extension, science students, have a greater responsibility to engage in the communication process, sharing their findings with a wider audience.

1.2. The Role of Science Communication in the Life Sciences

Recognizing the increased responsibility of the scientific research community in communicating information to the wider public, a number of institutions have introduced training initiatives to prepare scientists for interfacing with the public and other stakeholders [10]. Exemplar training programs include, for instance, the Alan Alda Center for Communicating Science (http://www.centerforcommunicatingscience.org/ (accessed on 19 February 2024)) and the Center for Public Engagement with Science & Technology at the American Association for the Advancement of Science (https://www.aaas.org/programs/communicating-science (accessed on 19 February 2024)).
The goal of science communication training is primarily focused on providing the research community with skills to communicate with a broader audience. Training ranges in duration from a one-hour workshop to entire degree programs. The training model frequently employed is aimed at supporting established scientists with developing and conveying clear messaging, using plain language, and developing narrative. Little attention, however, has been devoted to supporting the development of science communication skills amongst future scientists. Still less studied is the role of visual representation in the communication of science.

1.3. The Role of Visual Representations in Science Communication

Visual representations (e.g., photographs, imaging, diagrams, charts, models) are central to the communication of science. Scientists use visual representations to share findings with a much wider audience with varying levels of literacy and education (e.g., [11,12,13,14]). These representations can refer to physical objects, such as models of DNA, or conceptual constructions, such as a graph of sound waves [15]. Evidence shows that scientists rely on visuals to support their scientific arguments. Mogull and Stanford [16] found representational visuals, such as diagrams and graphs, to be high-use inscriptions compared to other types of figures, such as photographs, instrument outputs, tables, and equations. Lee et al. [17], in classifying over 8 million figures in the PubMed literature, found a significant correlation between the use of visual information and scientific impact, where higher-impact papers tend to include more diagrams and plots. When these visual representations are well designed, they positively influence a reader’s perception of the scientist’s intellectual and scientific competence [18].
Visual communication offers distinct benefits compared to other means of science communication. One benefit is the exploration of information that is difficult to describe through text alone. For instance, visuals can convey spatial, topological information that is difficult to describe with the linear affordances of written or oral communication (e.g., spatial, topological information) [19]. In another example, Anscombe [20] illustrates the importance of graphical representations in data exploration by visualizing a dataset with identical statistical properties but markedly distinct graphs.
A second benefit is the dissemination of information to a much wider audience of varying levels of literacy and education (e.g., [11,12,13,14]). Visual narratives have shown promise as communication tools in times of public health crises such as the COVID-19 pandemic—these tools can share accurate scientific information rapidly online (e.g., a validated infographic shared on social media in 20 languages [21]). Additionally, these tools can make messages more accessible to audiences and improve their capacity to understand and act on the information provided in the narrative (e.g., users of a visual “flashcard” course showed improved self-efficacy and behavioral intentions towards COVID-19 disease prevention [22]). Cinematic scientific visualization, which aims to be educational, visually appealing, and compelling, also has a measurable impact on its audience (e.g., increasing one’s understanding of the subject matter presented [23]) and can reach millions of viewers internationally [24].

1.4. The Role of Visual Representations in Undergraduate Life Sciences Education

The visualization of complex phenomena is an essential skill for students and scientists in the life sciences [25,26,27]. Visual representations are a part of scientific practice and essential in scientific progress—they play a role in conceptual understanding, scientific reasoning, knowledge generation, and the communication of scientific discovery and change [28,29,30].
As mentioned in Section 1.3, one application of visual representations is to support and develop a scientific argument. Figures, diagrams, and graphs are commonly used to conceptualize scientific processes and relay information, trends, and relationships among scientists across disciplines [25,31]. These visual representations have widespread use in written science communication, such as research articles [16], and in visual aids for oral science communication, such as scientific poster presentations [32,33]. Given the extensive use of representations in undergraduate science instruction (e.g., textbooks, lecture slides) and expectations that students generate high-quality communication materials (e.g., scientific papers, posters) [18,34], there is a growing need for students to develop an ability to interpret and create visual representations so they can engage in discourse with other scientists [35]. As an example, Agrawal and Ulrich [36] describe a recently developed undergraduate research experience course that integrates the creation of graphical abstracts as a core element of the experimental design process, research plan communication, and illustration of results. In addition to communicating with scientific peers, scientists are increasingly expected to communicate with the lay public as part of their civic duties [37], which can be particularly challenging (e.g., navigating social stigma and personal philosophies [38]). Brownell et al. [39] argue that undergraduate students, as part of their formal education, should receive explicit training in the communication of scientific concepts to the public.
Moreover, the incorporation of visual science communication practices may contribute to students’ development of high-level cognitive skills as outlined in Bloom’s Taxonomy of Education (e.g., synthesis, evaluation, and creation). When students engage in the practice of creating visualizations, they make their thinking explicit; it is a vehicle for learning about and communicating science. Research has shown that drawing can help students learn in science by learning conventions of representational formats and their purposes, by learning to assimilate information into a schematic diagram for conceptual understanding, and by practicing reasoning skills by checking logical connections and relationships between different pieces of information [40,41]. Some documented examples of drawing-to-learn exercises in the biology classroom include the Role in Representation in Learning Science (RiLS) program, in which students aged 10–13 were challenged to draw visual representations of scientific phenomena that they observed through hands-on experiments [40]; the Picturing to Learn program, in which undergraduate students were asked to visually explain phenomena they were learning in lecture classes, thereby “reveal[ing] their misconceptions in a way that text [did] not” [42]; and the Drawing-to-Learn framework, which proposes drawing exercises for model-based reasoning in biology [43]. Wider adoption of such exercises could be a welcome change to current practices in introductory undergraduate biology courses, where assessments are currently focused on low-level cognitive skills as outlined in Bloom’s Taxonomy of Education (e.g., the rote memorization of facts) [44].
Thus far, we have touched upon different aspects of visual science literacy—the ability to interpret visual conventions used in science (comparable to reading and writing in verbal literacy) and the ability to fluently engage in discourse with other scientists using visual materials [45]. The second definition encompasses the ability to synthesize information and visually communicate it to a target audience, which is a process we will refer to throughout this paper as visual science communication.

1.5. Visual Communication Training Can Mitigate the Risks of Visual Representation

The use of visuals in digital media is rising along with the availability of new graphic technologies for generating and sharing visualizations (e.g., BioRender (Toronto, ON, Canada, www.biorender.com (accessed 30 August 2023))), a commercial service for creating scientific graphics used by a majority of scientists and students [46]; Canva (Sydney, Australia, www.canva.com (accessed 30 August 2023)), an online graphic design platform for social media graphics and presentations; and Microsoft PowerPoint (Version 16.81, Redmond, WA, USA, www.microsoft.com/en-ca/microsoft-365/powerpoint (accessed 30 August 2023)), a slideshow presentation software program). While visual materials can be beneficial, their inappropriate use can do more harm than good. An examination of visualization pitfalls showed that visualizations carry inherent cognitive, emotional, and social risks [47]. They can distract and mislead, cause emotional harm, and create misinterpretations in different cultural contexts—these misinterpretations can be introduced by both the designer of the visualization as well as its viewer [47,48,49]. One example is the misuse of color in scientific communications. The use of color maps that are perceptually non-uniform can create data distortion, and when a color map contains red and green at similar luminosities, it cannot be distinguished by readership with red–green color vision deficiency [50]. Colors also have affective meanings (e.g., red—danger) and influence the viewer’s emotional state [51,52], and their inadequate use can make an image unappealing or distressing. Socially, color can be used differently across cultures and history [53]. For instance, blue-colored skin can indicate normal physiology in Western digital anatomical models, has historically indicated abnormal physiology in Asian medical paintings [54], and can indicate immortality and divinity in sacred imagery.
Visual science communication training can help steer students away from these pitfalls through improving students’ visual literacy skills. Rodríguez Estrada and Davis [55] argue that by incorporating communication theory and practices into science education, educators can teach students to ask pragmatic questions about visual representations, interpret and analyze the meaning of visual elements, evaluate and critique the value of visual elements, and understand social issues surrounding the creation and use of visual media. In addition to improving their interpretation and evaluation skills, explicit instruction can improve students’ communication skills—their ability to translate verbal or written information into visual representations while following the conventions in their field [43].

1.6. Current State of Visual Science Communication Training in Undergraduate Biology Education

Despite the importance of visualization in life sciences education, students often learn visual skills in an ad hoc fashion from peers and advisors without a clear framework [56]. The National Research Council’s [57] appraisal of biological research in the 21st century called for a more interdisciplinary approach to biology education. In particular, a successful undergraduate student should be competent in communication and collaboration and be able to demonstrate both graphical and visual literacy [58]. The incorporation of visual design instruction with well-established communication principles may cultivate more robust, evidence-based science communication practices [59] and address expectations for students’ visual communication skills [55]. This can take multiple forms, each with their benefits and limitations, such as the following:
  • Coursework that exposes students to visual representations and provides opportunities for students to practice, test, and develop visual literacy (e.g., [36,40,42,43,60]).
  • Reference guides that offer frameworks for visual thinking and comparisons of effective and ineffective graphics (e.g., [61]).
  • Visual design tutoring centers that provide guidance to students developing graphics (e.g., [62]).
  • Well-designed visual instructional media and frameworks for using visual representations in biology education (e.g., BioMolViz (biomolviz.org (accessed 11 July 2022))) and VISABLI (www.visabli.com (accessed 11 July 2022)).
While strides have been made to incorporate visual experiences into life sciences instruction, few studies investigate instruction that focuses on students’ active interrogation of and experimentation with visual representations through the creation of original communication materials. Student competence and confidence have also been investigated in other science literacy skills, such as quantitative [63], data analysis and interpretation [64], and reading and writing skills [65], but not in relation to students’ visual communication skills. In addition, few studies investigate the incorporation of visual science communication instruction within the context of the needs of undergraduate biology students and instructors. The inclusion of stakeholders and their lived experiences in the problem-solving process (co-creation) has the potential to add value to solutions [66] and increase their uptake (e.g., [67]).
This exploratory study assesses the pedagogical needs of undergraduate biology students, instructors, and teaching assistants with respect to visual science communication education, how it is taught, and how it may be improved. In response, we explore the development of a multimedia educational resource that addresses the needs identified in this study.

1.7. Research Questions

  • What are the current gaps in visual science communication instruction in undergraduate life sciences education?
  • What are the qualities of a resource with perceived value in teaching and learning visual science communication?

2. Materials and Methods

2.1. Research Design

A two-stage mixed-methods sequential explanatory design [68,69] was used to explore diverse perspectives and relationships among the following stakeholders: undergraduate biology students (n = 53), instructors (n = 13), and teaching assistants (TAs) (n = 8) at the University of Toronto. This study was conducted in accordance with the Declaration of Helsinki, and the protocol was approved by the University of Toronto Research Ethics Board on 15 July 2021 (Protocol #41242).
An environmental scan was conducted to gain an initial understanding of the problem space. This informed the objectives of the quantitative data collection stage of the study (Stage 1):
  • How do participants perceive the use of visual design in science communication?
  • How do students perceive their own confidence and competence in visual science communication? Specifically, students were asked how effectively they thought they could achieve the following:
    Communicate to different audiences (a scientifically literate audience; the general public);
    Create four common types of communication materials (a diagram of a scientific process, a data visualization, presentation slides, and a research poster);
    Evaluate their peers’ or their own visual science communication skills.
  • How do instructors perceive their students’ confidence and competence in visual science communication?
  • >What are the participants’ current practices?
  • What are perceived gaps in visual science education?
Students were recruited from undergraduate life sciences programs at the University of Toronto through an announcement posted on Quercus, the university’s learning management system, as well as from email announcements through student unions and associations. Instructors and TAs who taught undergraduate bioscience courses with visual communication assessments in North America were invited to participate through email correspondence. Participation in the study was voluntary. Out of 54 student responses, 14 instructor responses, and 9 TA responses, one student, one instructor, and one TA were excluded based on selection criteria (see Table 1).

2.2. Procedure

2.2.1. Stage 1: Surveys

In Stage 1, two surveys were completed by the students, instructors, and TAs to observe general trends in the problem space [70]. Data were collected anonymously via Microsoft Forms. The student survey included 19 closed- and open-ended questions divided into 3 main sections: student demographics; the students’ perceptions of their own confidence and competence in visual science communication, scored using a 4-point Likert scale; and perceived gaps in visual science education. The instructor and TA survey included 18 closed- and open-ended questions divided into 4 sections: instructor demographics; each instructor’s perception of their students’ confidence and competence in visual science communication, scored using a 4-point Likert scale; the instructor’s experience with evaluating visual communication materials; and perceived gaps in visual science education. As the study was aimed at specific objectives related to confidence and competence in the creation of visual science communication materials, we developed new surveys rather than using previously published surveys.

2.2.2. Stage 2: Interviews

Findings from Stage 1 informed the design of research instruments used in the qualitative data collection stage, Stage 2. Stage 2 consisted of interviews with a selection of participants from Stage 1. This consisted of a moderated focus group interview with students (n = 8) and one-on-one semi-structured interviews with instructors and TAs (n = 8), conducted according to best practices by Krueger and Casey [71] and Courage and Baxter [72]. Facilitation guides included 5 open-ended questions for students and 9 for instructors, divided into 5 main topics:
  • The student’s process of learning visual science communication skills;
  • The student’s process of creating the four types of communication materials listed above and how they may differ in the creation process;
  • The student’s process of reviewing the work of others and their own, and the criteria they use to evaluate work;
  • The instructor’s process of evaluating a student’s visual science communication skills using the four types of communication materials;
  • The student’s and instructor’s criteria for a preferred resource.
Stage 2 sought to understand the positive and negative experiences faced by students, instructors, and TAs in greater depth to identify areas for design opportunities. Stage 2 findings were also used in the interpretation of findings from Stage 1.

2.3. Data Analysis

Quantitative survey data from Stage 1 were analyzed descriptively to provide an overview of the participants’ demographic characteristics and their average level of confidence in various aspects of visual science communication education. Qualitative data from open-ended survey questions were not formally analyzed and used only to inform the direction and design of the Stage 2 research instruments.
Qualitative interview data from Stage 2 were analyzed thematically using inductive grounded theory [73,74]. Grounded theory was used in this paper as a method (rather than methodology) for conceptualizing and gaining an in-depth understanding of a particular process or phenomenon, resulting in a descriptive non-theory [73,75]. Positioning grounded theory as a living methodology or set of methods allows STEM education researchers to make connections between current and past research in addition to generating new theories [76]. A coding process was applied to progressively categorize and connect interview data to identify and report themes emerging from the data. Open coding was used to develop a series of subcategories before they were grouped into core categories.

3. Results

3.1. Stage 1: Survey

3.1.1. Students’ Experience of Visual Science Communication Education

Coursework was the most frequent way undergraduate students experienced visual science communication training, followed by video tutorials (e.g., YouTube (San Bruno, CA, USA)), e-learning modules (e.g., library resources), workshops, webinars, and training completed before starting university (Figure 1). Eight students reported not having received training during their undergraduate education. The majority of students surveyed stated their instructors had not clearly taught them how to create effective visuals (Table 2). Half of all students stated they have received clear feedback on the effectiveness of their creations.

3.1.2. Students’ Confidence in Their Visual Science Communication Skills

Students were divided when it came to their confidence in the effectiveness of their visual science communication skills (Figure 2). Students felt particularly confident in their ability to create presentation slides as well as graphs and charts, but less confident when it came to designing a research poster as well as communicating their ideas to a scientifically literate audience. Students seemed to be less confident in their skills as their level of education increased, particularly in their ability to communicate to a scientifically literate audience, communicate research using posters, and evaluate their peers. Exposure to coursework may have contributed to the students’ confidence in the design of certain communication materials rather than others—some participants had created presentation slides and communicated science to their peers as early as in their high school courses but only had the opportunity to create research posters and communicate with other scientists in upper-year research experience or thesis courses. One TA recounted their experience transitioning from undergraduate to graduate education—their self-awareness increased as they gained more experience in the field, broadened their perspective, and interacted with other communicators, scientists, and professionals.

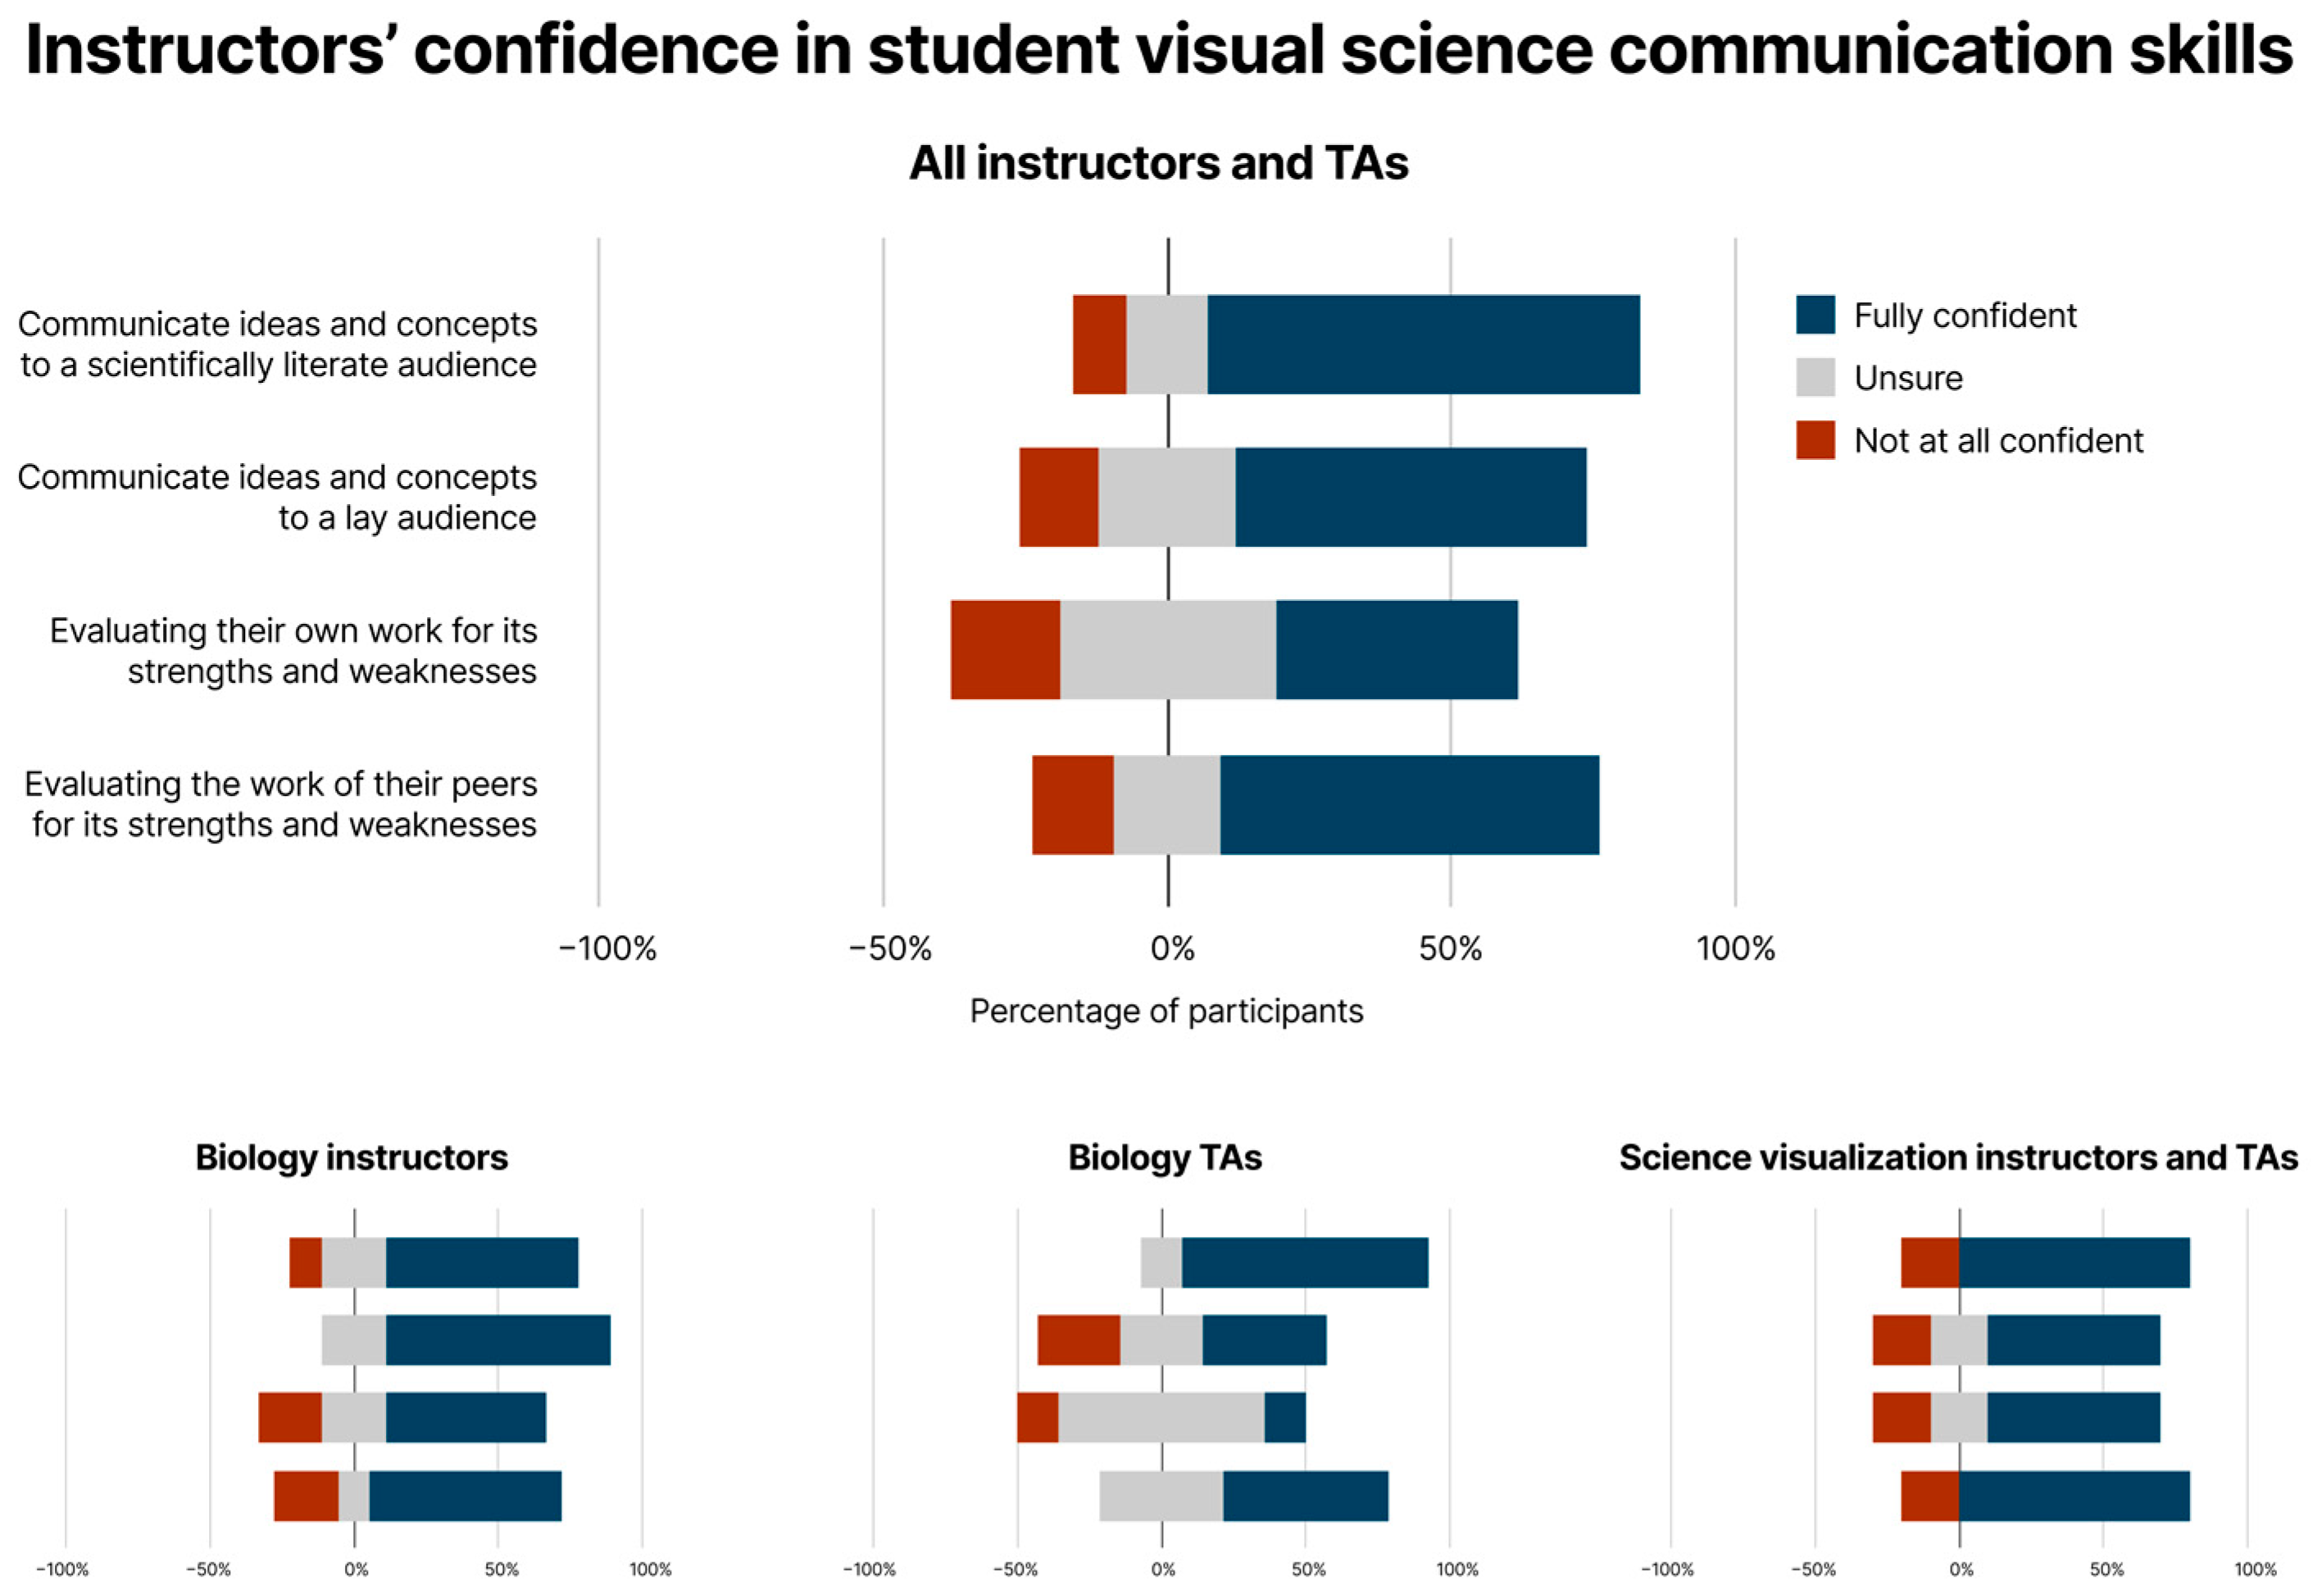
3.1.3. Instructors’ Confidence in Their Students’ Visual Science Communication Skills

Overall, instructors and TAs were confident in their students’ visual science communication skills, namely their ability to communicate to different audiences as well as evaluate their work or the work of their peers for its strengths and weaknesses (Figure 3). However, biology TAs were less confident about their student’s abilities—they were particularly unsure of their students’ ability to identify their own strengths and weaknesses. Drawing from our interview findings, TAs tended to work more closely and directly with younger undergraduate students (e.g., in large introductory biology courses). They were usually the person responsible for helping students with their communication assignments and evaluating their communication materials and were therefore more aware of their students’ abilities. TAs also stated they were lacking in communications training themselves and therefore might not be as confident as faculty in rating their students’ abilities.

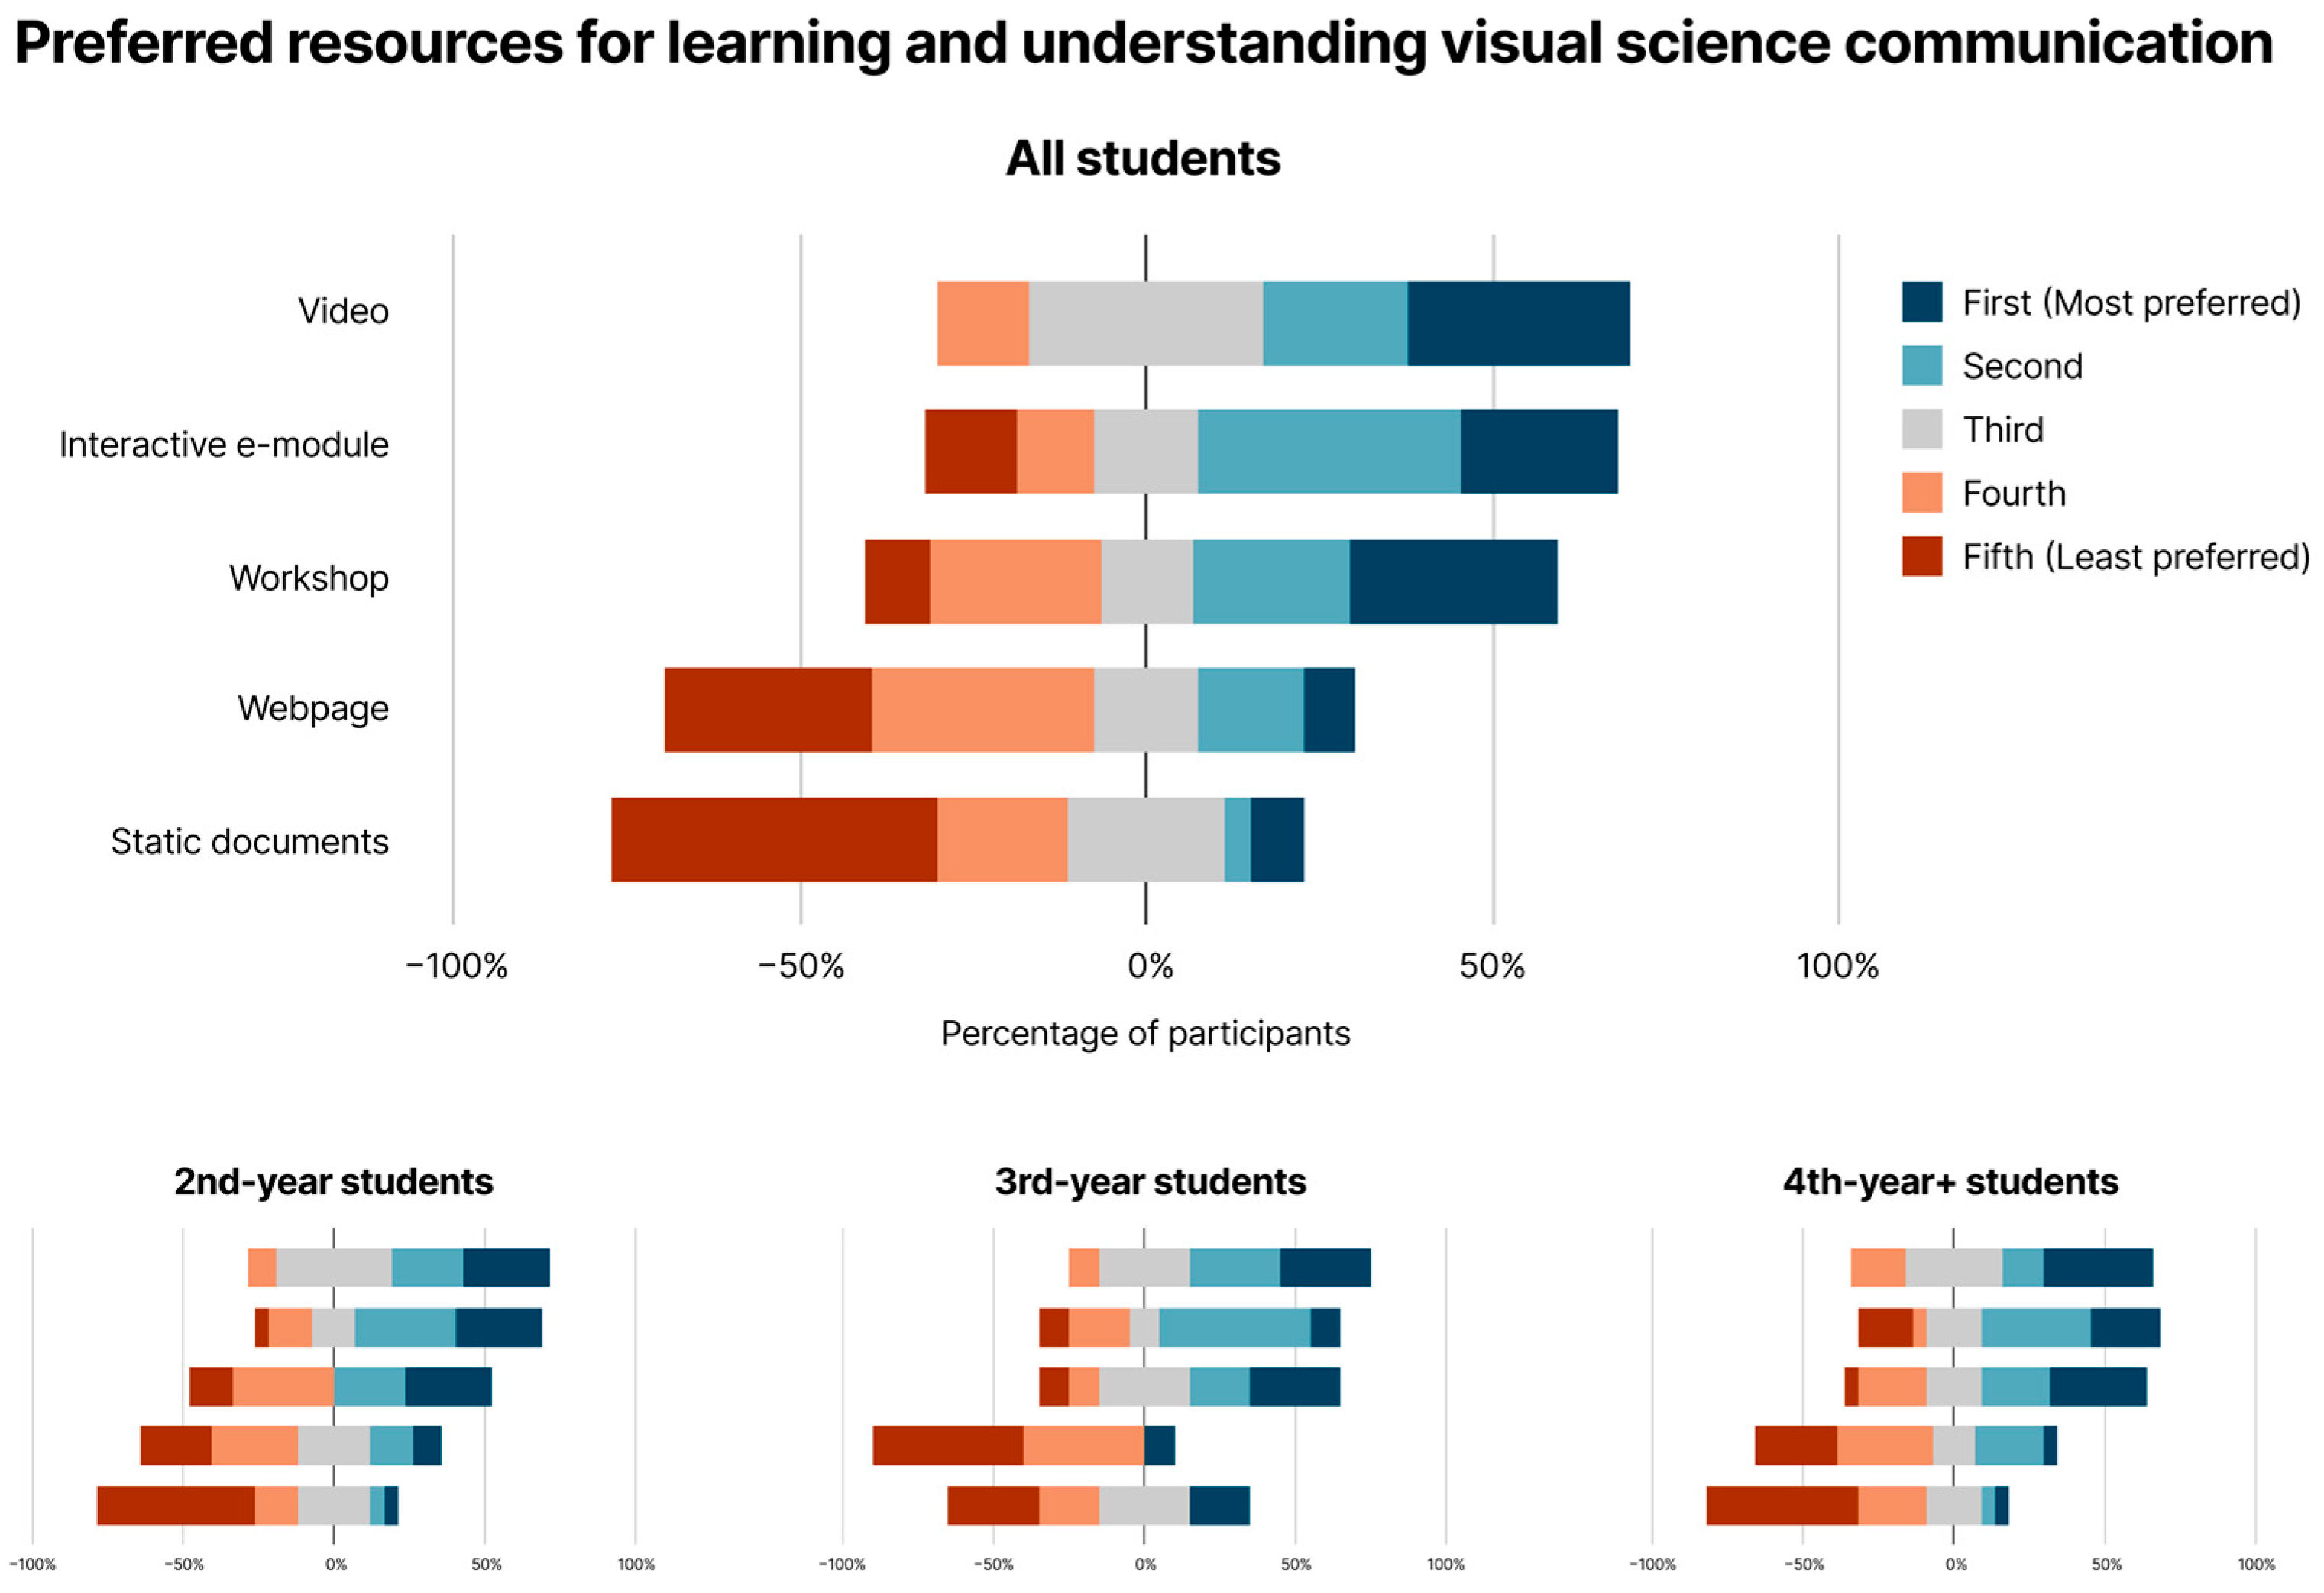
3.1.4. Students’ Preferred Resources for Learning Visual Science Communication Skills

Students ranked videos and interactive e-modules as more useful types of resources for learning and understanding the topic of visual science communication (Figure 4). Students who participated in the focus group agreed with the survey results, favoring these resources because they delivered information concisely and efficiently. These types of resources could also keep students engaged in the learning process (e.g., modules with checkpoint quizzes) and allow them to process information at their own pace. The workshop format was also an option favored by some focus group participants because this type of resource gave students a chance to interact with and seek advice from experts, which allowed students to clarify their understanding in real time. However, this level of interaction could be challenging to organize and was considered less time-efficient by two out of eight focus group participants.

3.1.5. Instructors’ Preferred Resources for Teaching and Evaluating Visual Science Communication Skills

Overall, instructors and TAs ranked interactive e-modules, workshops, and videos as more useful types of resources for teaching visual science communication to their students (Figure 5). Biology instructors favored videos because this type of resource could be integrated into their lectures and provided to students to view on their own time, while TAs favored workshops because interactive activities could be integrated into tutorials to increase student engagement. Conversely, science visualization instructors had a preference for in-person facilitated workshops in which expert guidance could be provided in real time.
Instructors and TAs ranked rubrics as the most useful type of resource for evaluating students’ visual science communication skills (Figure 6). Rubrics were considered a staple for many instructors and TAs who needed to evaluate large amounts of coursework in a limited amount of time. Frameworks were the second most favoured resource as they may help instructors and TAs better understand their thinking about science communication. However, this type of resource was considered less practical, usable, and quick to implement than rubrics.

3.2. Stage 2: Interviews

The following themes emerged following our coding process (summarized in Table 3; a full list of codes is provided in the Supplementary Materials, Table S3). These themes are described in detail in the subsections below.

3.2.1. Perceived Support and Exposure: Factors Contributing to Students’ Experience of Visual Science Communication Education

Unclear Expectations and Standards

Students frequently mentioned instructors’ unclear expectations and standards as contributing factors in their experience of visual science communication education. Our focus group interview with students showed that rubrics played a large role in informing students’ perceptions of standards. Students tended to tailor their work to a rubric to score well and used their scores as well as written feedback from instructors to gauge the success of their visual communication outputs. Students found that existing rubrics for visual communication assignments were largely ambiguous and unspecific. Both students and instructors believed that well-designed rubrics would help instructors communicate their expectations to students (e.g., bring objectivity to grading, clarity to standards, and efficiency when providing feedback).
“When reviewing work [of my peers], I tend to see if they’re meeting all the requirements within a rubric because I consider those the baseline for how things have to be done in order to be successful in whatever the person does, or in order to be successful in the presentation, whatever the professor is expecting of you.”—Student from focus group
“I would appreciate it if our assignments, in the rubric, it’s extremely clear about, you know, this is what you need to do to get a certain mark. I find that there’s so [many] arbitrary opinions that influence marking. That’s one of my biggest gripes.”—Student from focus group
“When you’re marking an assignment that someone else made, and you don’t have a rubric, it is just very complicated and it becomes quite subjective. But if you have a rubric, you already know what to look for. Also, students feel more confident—if they hit those points in the rubric, then they know that they will get a decent mark.”—Biology TA 1

Lack of Guidance, Support, and Feedback

Students repeatedly mentioned that they were not provided with sufficient guidance and support from their instructors that helped them learn and apply visual science communication skills; this was corroborated by instructors. Biology instructors mentioned not necessarily teaching communication as deeply as promised, nor providing enough resources for understanding the topic, applying knowledge, and critiquing it with peers. TAs expressed that they do not receive enough training in this topic to provide the support needed. Learning tended to be self-directed; students were responsible for finding resources on their own.
“[Learning visual science communication skills] becomes easier as you do it […] but definitely [at] the start, it would have been nice to have had some sort of guidance.”—Student from focus group
“I found that we were mainly creating graphs, but we weren’t really taught how to refine those, and being online [during the pandemic], it was very important to have information that I could see to replace the in-person interaction with a professor in place of asking questions. I found that it was very difficult to learn these on my own or using online sources, especially without anyone telling me, or even teaching me what to do.”—Student from focus group
“What participant one said about knowing the resources that we refer to. I think that’s really important because it removes time from other stuff that you can be doing for your work. Just being able to have that guidance in knowing what we can use […] helps streamline that process.”—Student from focus group
Students also wished for constructive feedback from instructors and TAs to guide their approach to solving communication problems. Students usually do not receive formative feedback that incrementally improves their drafts and elevates their work. At the end of the process, they do not receive adequate summative feedback that helps them refine their approach the next time they tackle a problem. This occurs more often in large courses in which instructors and TAs are not adequately resourced to give students individual attention and feedback.
“There’s not very much handholding when it comes to teaching. The constructive feedback a lot of students receive is very minimal and sometimes even counterproductive. There is a lot of trial and error coming from all these students when they’re trying different things. Until they have explicit guidance on why some things work and don’t, it’s hard for them to develop [these skills].”—Biology TA 4

Lack of Integration in Life Sciences Education

Students stated they do not receive sufficient education in visual science communication as part of their formal scientific training, whether within life sciences courses with visual communication assignments or within a visual communications course. There seemed to be little opportunity to practice these skills until students entered upper-year biology courses. Some students and TAs emphasized that training needs to be mandatory. Since time can be a precious resource for students who are balancing multiple priorities, they are more likely to allocate time to visual science communication training if it is compulsory and tied to their grades.
“[It would be helpful] if they [instructors] can make it [training] mandatory, and also introduce exercises and tutorials with marks, as well as go through the steps and teach us how to be better.”—Student from focus group
“By integrating it, everyone will have to do it. Whereas when you’re on your own, some people are at different paces and some people behind and they wouldn’t know if they’re doing something right or wrong.”—Student from focus group
“I think that they should have at least a course or something about learning how to communicate ideas, in general.”—Biology TA 2

Intrinsic Factors

Intrinsic factors include a student’s personal interests and competencies. For example, their ability to communicate concepts using their own words, their familiarity with the science, and their technological aptitude could impact their experience with the design task. Students who were passionate about the arts said they were more likely to seek out training on their own. Lastly, students mentioned their mental health also affected their confidence in creating visual materials as well as their receptiveness to constructive feedback.

3.2.2. Incentives and Resources: Factors Contributing to Instructors’ Experience of Visual Science Communication Education

Lack of Incentive to Change

Instructors and TAs stated that there is a lack of incentive, specifically a lack of time and financial support, to change the current state of visual science communication education. The priority in life sciences courses, especially in large introductory biology courses, is to devote time to covering the science rather than to teaching visual science communication. These educational requirements can be influenced by the institution or industry.
“Well, I think the biggest hurdle is time. Just, you know, it’s time away from the content of your class. This is the same hurdle that’s going on with how much you’re covering [for] your class. […] If students had to take a whole course in visual literacy, that would be one thing, but that isn’t in our curriculum currently. So it’s subsetted into smaller science classes.”—Biology instructor 1
“From the instructors’ perspective…providing meaningful feedback is not something very easy [to do]. You have to spend more time writing feedback. And I know a TA is unlikely to do that because they are not paid a lot…”—Biology TA 1
“A lack of time, we’ve been over that a million times, but also a lack of training for us in how to teach [visual science communication], and I think you know we learned from textbooks on our own, without modeling, without access to other media.”—Biology instructor 2
TAs also stated they had difficulty introducing changes because the course structure depends heavily on the instructor.
“No one is really teaching you what are the best communication skills, which are ways in which you can engage your students. You have [TA] training for each course, and it depends on the instructor. So for one of the courses that I TA, the instructor is like, well, I want you to teach this topic next week. That’s it. That was the training.”—Biology TA 1

Existing Instructional Design Resources

Instructors stated that they reference existing tools (e.g., rubrics, guidelines, and test banks) to design their teaching. Evaluation methods, for example, rubrics, can influence the nature of what life sciences instructors teach (e.g., breadth and depth), and these resources have not evolved to incorporate the evaluation of visual content.
“People are going to have a hard time deploying that teaching in their own classroom unless they have some sort of scaffold or a framework that breaks down this process into manageable steps.”—Science visualization instructor 1
“I think it helps to see someone else’s rubric [so that] I have a picture of how someone else would evaluate this. I think it’s just getting at the same thing that the students are lacking. They’re like, we don’t know what a good peer review looks like because no one ever showed [us]. And so, should I be looking for these things too? It’s the kind of strength in numbers and collaboration, talking about this with someone else.”—Biology instructor 2

Intrinsic Factors

One intrinsic factor is the instructor’s ability to communicate their expectations to their students. Some instructors mentioned it is difficult to train students to interpret visuals because they have different levels of experience in the field and understanding of the subject compared to their students (i.e., experts and novices).
“Providing directions that are explicit enough to get the product that you want back from the students is very challenging because, I mean, sometimes you just know what you mean and they don’t…”—Biology instructor 2

3.2.3. Perceived Value: Integrating Visual Science Communication into Life Sciences Education

Students Build Their Thinking Skills When They Engage in the Visual Communication Design Process

Science visualization instructors stated that visualizing information helped their students learn more than just scientific concepts. Students practiced synthesizing knowledge using evidence when they were asked to externally represent their thinking, and it made them aware of their gaps in knowledge. Designing materials with communication objectives in mind also trained students to discern and prioritize information. Some biology instructors and TAs feel that their students are currently not demonstrating higher-order thinking skills in their assignments.
“I don’t know of any other process that forces you to consider all of the supporting data, all of the ways to communicate something, then the challenge of having to create a visual representation of it. Different activities confront us in useful or powerful ways to embody an idea or […] mental model of something.”—Science visualization instructor 1
“In science courses, we ask [students] to study [papers] and then give a presentation or write a report. I believe most of my students understand the scientific concepts, but they really don’t know how to explain them in their own words. Most of the time, they end up … copying a paragraph from the paper from the book, and that is not really what we need. At the same time, no one is teaching them how to communicate effectively. It’s really important that [students] understand [the science], but if they don’t know how to communicate it properly, then we’re not doing our job.”—Biology TA 1
Biology instructors stated that engaging in critique and comparison with peers (e.g., giving a presentation in front of an audience) helped their students develop critical thinking skills as well as self-awareness.
“If you had different posters and different sections of posters, and you asked [students] which one is good, which one is bad and which one is so-so? If they looked at them and tried to be critical, they would get a better understanding, and once they understood that, they would be better able to create something that was better. I don’t think they know how to be critical consumers. In order to be a critical creator, you need to first understand what people are being asked to consume and why it works and why it doesn’t.”—Biology instructor 1

Visual Assessments Allow Instructors to Evaluate Their Students’ Thinking Skills

Instructors and TAs mentioned that visual assessments gave them insight into their students’ understanding of science, knowledge synthesis skills, and communication skills. Oral–visual assessments such as presentations and posters further provide students with the opportunity to explain communication decisions and demonstrate their understanding to instructors.
“We’ll ask students to produce flow charts for the [introductory biology] labs. But we’re not really assessing their communication skills. We’re assessing the fact that they understand what the lab is about.”—Biology TA 1
“With a presentation, you can explain yourself, but with the flowchart, you’re giving it to me and then that’s it. There is no other information.”—Biology TA 3

Communication Training Helps Students Develop Professionally

Participants stated that communication training would make students and instructors better scientists and science educators. One TA stated that scientists could have been communicating more effectively during public health crises such as COVID-19. A science visualization instructor stated that the process of visualization also introduces students to the complexities of science, which may nurture their interest in pursuing a career in the sciences.
“…introduce these skills early on […] to get exposure to creating these visuals because these skills are transferable to any industry, any role. It’s not just about education.” —Student from focus group

3.2.4. Exemplary Models: Designing Instruction for Visual Science Communication

Scaffolding

Students and instructors agreed that there should be better scaffolding for students new to visual communication design (e.g., specific guidelines to help students complete their work, checkpoint assignments that evaluate students’ learning over time, and structured practice built into courses). Science visualization instructors stated there should be a greater focus on the iterative process of design rather than focusing on the end product. An iterative design process could allow instructors to provide truthful feedback in the earlier phases of a project, and an emphasis on iteration, feedback, and collaboration could help students develop objectivity.
“Realistically, it would be better if we asked them to start with making one slide or one tiny piece, and then built them up over the quarter system to the end where they could make a full poster, but we don’t usually do that. We’ll usually jump right in and say, make a slide presentation on this. So I don’t think it’s as good as it could be.” —Biology instructor 1

Interactions between Students, Instructors, and Communication Experts

Instruction should allow for interactions, collaborations, and communication between students, instructors, and visual communication design (science visualization) experts. Multiple participants stated that student–instructor interactions were important to them as they allowed them to receive feedback and clarifications in real time. Collaboration between students could help them improve each other’s work, and collaboration between scientists and visual communication experts could help scientists elevate their work and develop professionally.
“I believe workshops are the best option [for learning visual science communication] … it’s best that all people [are together at a] specific time so we can have in-person interaction, so we can talk to people about anything that we’re having trouble with. When you have questions, it’s important to get them clarified and you can’t exactly do that if you’re watching modules and videos in chronicity.”—Student from focus group

Evaluation of Visual Communication Materials

Many students and biology instructors found existing rubrics for visual communication assignments to be ambiguous and lacking specificity. While rubrics are practical and time-efficient as assessment tools, it may be a challenge to set standards in a field that values creative freedom and innovation.
“In terms of concrete tools, I would prefer a framework over a rubric. It doesn’t matter if they have two points for grammar. To me, it matters more that they understand this concept that they’re writing about, whether they can demonstrate their ability to understand it. You produce a bad rubric when you don’t have an established framework, when you don’t know what you want from the students.”—Biology TA 4
Communication value was important to both students and instructors. Factors that could affect the communication value included the logic and flow of the information presented, the prioritization of different aspects or components of information, the clarity of messaging, and ease of understanding. Biology instructors were also concerned with scientific accuracy, although TAs seemed to be more lenient with their expectations since they do not always expect novices to have a complete grasp of a scientific concept. Rather, TAs prioritize students’ ability to communicate logically.
“[When it comes to judging posters, I judge] whether [students] are following a logical flow of information, whether they’re explaining the background information well, whether they understand who their audiences are. […] I don’t think the information has to be necessarily correct, but it has to make sense.”—Biology TA 2
There were different views on visual design standards for visual science communication materials. Students and instructors acknowledge that aesthetics could influence the audience’s impression of a communication piece (e.g., legitimacy) as well as the audience’s ability to interpret its content (e.g., poorly designed graphics could distract the audience from the message), but some instructors thought that students often prioritized visual appeal at the expense of scientific accuracy and communication value.
“I would say that [students] focus more on the way it looks and less on whether it actually transfers content correctly. I think the problem is more that the students focus on the slickness. What the students and the faculty disagree on is the content versus the stylistic things. And so the students, if they put energy into it, they do want to complete the assignment, but they often want it to look right. There’s a lot of emphasis on making the colors nice and the size of the pages and stuff, again, less on what it actually has to do. The disconnect seems to be in, not so much the visual style, but the visual content.”—Biology instructor 1

Designing Instructional Resources for Students and Instructors

When students and instructors were asked about their preferred resources, they mentioned qualities relevant to their roles and responsibilities. For example, instructors who could not provide individual attention to their students wanted a video they could incorporate into lectures, while TAs wanted an interactive activity they could use in their tutorials to generate discussion. Students who were managing assignments from multiple courses wanted a resource that was concise, time-efficient, easy to access, and generally applicable.
“The tool in my head would be something that could be applicable to all audiences, and then you would just adjust the information within it, in order to communicate different things to those different audiences.”—Student from focus group
“In large classroom lectures, videos are kind of the only way they can embed visuals and kind of a one-direction teaching situation. Whereas TAs tend to be broken down into smaller groups [with students] and therefore they have the ability to do more back and forth. With more back and forth comes the possibility of more workshop, hands-on, types of activities.”—Science visualization instructor 1
Both students and instructors placed a great value on resources that were flexible with respect to how they were implemented. They also preferred resources that incorporated video and guided interactive activities both flexibly and efficiently.

4. Discussion

The current study examined perceived gaps and challenges in visual science communication training in undergraduate life sciences education. This study also explored instructors’ and learners’ perceived preferences for science communication instructional material aimed at teaching these skills to undergraduate biology students. What follows is a discussion of factors derived from a thematic analysis that influence how visual science communication is currently taught by instructors and experienced by students. We also discuss the implications of the findings for the implementation of visual science communication instruction, including a proposed toolkit developed in response to the findings of this assessment.

4.1. Extrinsic Factors Shape Students’ and Instructors’ Experiences

Our needs assessment showed that time, financial resources, and grading practices greatly shape students’ and instructors’ experiences when it comes to visual science communication education. This is not surprising as these factors apply generally to higher education in North America. Funding affects schooling quality and student outcomes—financial resources for students, schooling resources that require spending (e.g., smaller class sizes, additional supports), and state school finance reforms are positively associated with improved or higher student outcomes and allow for more equitable and adequate schooling [77]. The success of course development and reform requires institutional funding as well as personal commitment from a community of faculty members and staff [57,78]. Since TAs are relied upon for the successful delivery of courses [79] and are often primary student contacts in large undergraduate science courses, institutions should also invest resources into improving the quality of TA professional development [80]. Needless to say, there needs to be greater incentive to change the support, guidance, and structure available within current visual science communication education.
Grades as well as grading guides (e.g., rubrics) are important to undergraduate students because they communicate instructor expectations to students and help students assign importance to a topic. Grading practices are driven by pedagogical and organizational goals, such as a means of communicating feedback to students, motivating students to learn and devote attention to the course, and objectively evaluating student knowledge [81]. Grading guides like rubrics also make learning goals and evaluation criteria explicit for both instructors and students [82]. However, the literature also suggests that these goals are often not being achieved; grades may not provide feedback that effectively guides students’ future performance in tasks involving problem-solving and creativity [83]. Additionally, grades may inaccurately represent students’ knowledge and mastery of content and may be inconsistent and subjective for open-ended assignments like student writing [81]. School grades impact children’s life satisfaction and emotional well-being beyond academics [83] and can lower intrinsic motivation in learning and increase anxiety in students who are already struggling [81]. Grading practices also influence instructors, who may be dissuaded from integrating other pedagogical practices due to the expectations, time, and stress associated with grading and providing feedback [81]. While the participants in our needs assessment mentioned the use of peer review to evaluate student work in large introductory courses, it tends to be more successful with lower-order cognitive tasks than higher-order cognitive tasks; it should also be used in combination with a well-designed rubric [84]. Because grading practices have a substantial impact on students’ learning experiences and instructors’ teaching experiences, they need to be well crafted if instructors want to accurately shape students’ epistemic beliefs about visual science communication.
While our needs assessment did identify intrinsic factors such as personal interests and competencies, these were mentioned less frequently than extrinsic factors. These played a smaller role in shaping students’ and instructors’ experiences, suggesting that extrinsic motivations (or the lack thereof) currently pose greater barriers to the incorporation of visual science communication training in the biosciences.

4.2. Students and Instructors Have Different Uses for Visual Communication Assessments

For students, visual communication assessments are opportunities to develop competency and confidence in visual communication so they are prepared to apply this skill professionally. While our study showed that around half of the students lacked confidence in their skills, the percentage of students who lack competency in visual communication may be higher because self-assessed confidence does not equal actual competence [85]. Exposure to and engagement with visual representations also allow students to develop necessary competency in visual literacy [45]. Because course assessments shape the way students learn (e.g., [86]) and reinforce ideas about the disciplinary practices of scientists, assessments that integrate visual representations are useful for reinforcing the importance of visualization in the discipline [87].
For instructors, visual communication assessments can be beneficial in biology courses as a way of evaluating higher-order cognitive skills and student mastery of scientific content as well as a way of changing learners’ beliefs about biology. Assessments in introductory biology courses often focus on testing low-level cognitive skills such as memorization and recall [44], and these current evaluation methods routinely reinforce student epistemic beliefs that biology is about memorizing facts—that successful learning can be achieved using surface-level approaches [88]. If the desired result of biology education is to develop students’ higher-order cognitive skills, we need to design opportunities for students to demonstrate these skills and build learning experiences promoting these skills [82]. Strategies for building visual literacy include, for example, training students to generate their own representations [25] as well as integrating visualizations into assessments [45].
By implementing visual communication assessments, novice learners (i.e., students) can practice model-based reasoning, build connections between ideas, recognize emerging patterns and relationships, and transfer knowledge to novel situations [40,43], which are skills seen in expert learners (i.e., scientists) [89]. Some faculty argue that knowledge and comprehension of introductory biology course content are necessary before students can complete higher-level thinking tasks (e.g., [90]). However, it appears to be possible to incorporate higher-level thinking tasks, like visual communication assessments, into introductory biology courses as cognitive complexity does not correlate or has a limited correlation with the difficulty of content delivered in a biology course [91].

4.3. Integrating Design Education into Biology

Design education offers exercises that can develop students’ thinking skills and train them to approach problems in an interdisciplinary fashion, as envisioned by A New Biology for the 21st Century [57] and Vision and Change for Undergraduate Biology Education [92]. The growing integration of creative processes and technologies into STEM (STEAM) comes from a desire to train students in 21st-century skills such as creative, collaborative, and innovative thinking [93]. For example, problem-based design tasks may be able to provide students with contextualized and authentic learning experiences [94] through which they can develop systems thinking skills, utilize domain knowledge, and create external representations used to explain and communicate decisions to others [95]. Design tasks share similarities with inquiry-based learning tasks, which have been shown to improve students’ competency and confidence in general science literacy skills [96].
In an environment where time, energy, and resources are limited, current and future biology faculty can look toward existing visual assessments, evaluation methods, and frameworks in design education rather than reinventing the wheel. Biology can draw inspiration from problem-based tasks in engineering design that promote learning STEM content through collaborative sense making, reasoning with evidence, and assessing knowledge [97]. Or, biology can look outwards to art and design fields, for example, drawing inspiration from existing frameworks in architecture (e.g., design critique [98]) or museum studies (e.g., visual thinking strategies [99]) to organize and conduct constructive feedback sessions during tutorials.
However, as our findings demonstrate, faculty may not necessarily alter their practices when they are given instructional materials without guidance or a community to support curricular change. Faculty are more motivated when they can use student learning data to inform changes, have a facilitator who can organize efforts and minimize faculty time investment, and work with collaborators to develop a product (e.g., an instructional unit) that is adopted into practice and published [78]. Efforts have been made to bridge visual education and biology education—for example, Quillin and Thomas [43] provide a drawing-to-learn framework and related implementation strategies for biology instructors who are interested in scaffolding drawing into classroom practice.

4.4. Designing a Multimedia Resource for Learning Visual Science Communication

In response to the findings identified by the present study, we created the Visual Science Communication Toolkit, a web-based learning module that integrates multimedia to teach visual science communication design to undergraduate life sciences students. This research output exemplifies a practical application of our findings as well as existing frameworks for teaching visualization in biology (e.g., [43]) and designing multimedia learning tools (e.g., [100,101]). Drawing upon research–creation practices used by arts and communication scholars [102], we combined creative design processes and academic research practices to innovate and produce new knowledge in the area of visual science communication education.

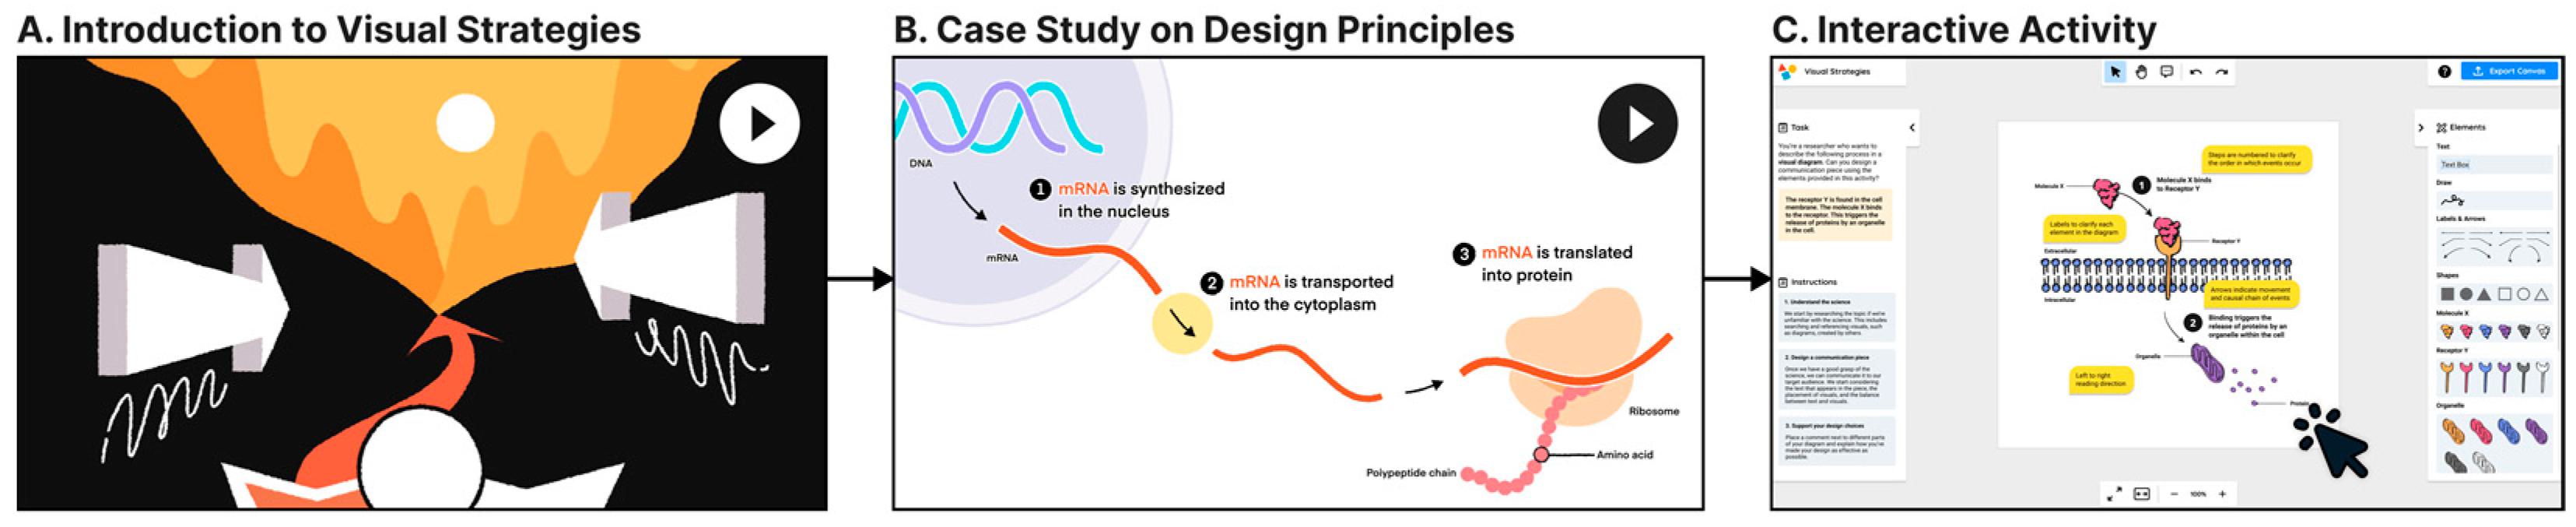
4.4.1. Components of the Visual Science Communication Toolkit

The module covers the topic of visual design strategies applied to the design of a diagram suitable for publication or poster presentation. Visual strategies are foundational design principles that influence our approach to scientific communication problems—specifically, making design decisions that align with communication objectives [103]. This includes, for example, leveraging the pre-attentive features of visual perception in the design of communication that captures and guides the viewer’s attention [104,105]. In addition, it includes the organization and layout of assets in clear information hierarchies that are readily understood by the viewer [106]. These aspects of communication theory and practice have been identified as essential to scientific research and communication [107], and teaching these skills address many of the needs identified by our own study (e.g., teaching students how to approach a communication problem, developing their ability to make and justify design decisions, and helping them form their expectations and standards of visual science communication).
The module is structured as a scrollable web page with four components (Figure 7):
  • A textual overview of the module with learning objectives.
  • Two 2D animations designed to educate students on the topic. The first introductory animation (A) provides students an overview of three key visual strategies, namely, layout, color, and graphical elements. The second case study animation (B) demonstrates the application of four design principles in constructing a diagram of mRNA translation, namely, alignment, proximity, repetition, and contrast.
  • An interactive drag-and-drop activity (C) that tasks students with designing a diagram depicting a hypothetical molecular process, utilizing a set of provided illustrations. At the end of the activity, students justify their design decisions using comment boxes placed over their diagram.
  • A text summary comprising questions for students to consider regarding the design of their diagrams as well as links to download module content.
The toolkit was designed such that students can gain knowledge of visual communication principles through the animations, apply and practice this knowledge through the design activity, and be assessed on their application of knowledge through their creations.

4.4.2. Design Strategies for Addressing Gaps in Visual Science Communication Training

Based on our literature review and needs assessment, we identified current gaps in visual science communication training that we hope to address with this toolkit:
  • Students learn ad hoc without formal framework and vocabulary (supported by [56]).
  • Training opportunities are limited, highly variable, and not centralized (supported by [108,109]).
  • Training materials, especially static documents (articles, textbooks, guides, etc.), require students to imagine rather than observe the effect of design principles (e.g., [32,33,34]).
  • Opportunities to practice skills are limited, sometimes high-stakes, and have little room for experimentation (supported by [60,108]).
The toolkit makes novel contributions to the learning and teaching of visual science communication by providing scaffolding, context, modularity, demonstration through animation, and experimentation through design exercises.

Scaffolding and Context

The module content provides a framework for understanding different features and principles of visual science communication in a context that is relevant and familiar to biology students. It acts as scaffolding for novices who do not yet have intuition or experience in creating visual representations. Additionally, this framework can be a basis upon which instructors can construct assessments and grading rubrics.
Designing with the learners’ existing abilities and environment in mind can help with scaffolding [110]. Thus, we used a user-centered design approach [111] to create a resource that could account for students’ habits, behaviors, and routines. This took various forms, such as the following:
  • Using vocabulary familiar to life sciences students (e.g., using central dogma and scientific posters as examples in the case study animation);
  • Providing a written transcript of the animation to help students record information for future use and to fit in with their note-taking practices;
  • Using a drag-and-drop tool with features familiar to students (e.g., features available in Microsoft PowerPoint);
  • Using pre-made illustrations/elements in an intuitive and familiar interface can alleviate the time and potential anxiety associated with drawing a diagram from scratch.

Modularity

The components of the toolkit can be used together or separately based on the needs of the user. For students, this digital, standalone module provides them an opportunity to practice visual science communication skills in a low-stakes environment and at their own pace. On the other hand, instructors and TAs can use components of the module to scaffold learning in a variety of learning contexts. For example, instructors could insert short animations into large lectures, while TAs could use the interactive design activity to generate discussions and engagement in small group tutorials. The module could also be completed entirely out of class.

Demonstration through Animation

The module uses 2D motion graphics to demonstrate, in real time, how the use of design principles (e.g., contrast) changes the way a visual is read and perceived. Low-fidelity 2D motion graphics offer more efficient exposition compared to high-fidelity 3D graphics [112], and they convey visual changes in a straightforward manner, making them an effective way of demonstrating design principles in action.

Experimentation through Design Exercises

As mentioned in Sections Scaffolding and Context as well as Modularity, the interactive design activity can be used as a low-stakes exercise that is approachable for students who do not have experience drawing and designing and/or are afraid to do so. The activity supports multiple solutions, which gives students an opportunity to experiment with their visual representations. The activity is also set in a digital environment relevant to students—they are expected to create presentations and posters using digital software with interactions similar to those supported by the activity.
It is important to note that students’ design choices are constrained by the activity’s pre-made elements and limited drag-and-drop features, which could have both positive and negative impacts on the student’s experience of completing the task. Constraints on visual aesthetics (e.g., due to pre-made elements) may help students to focus and overcome barriers such as their ability to draw (conversely, students with drawing skills may view this constraint as limiting). Additionally, instructors can focus on evaluating students’ communication skills (e.g., the logical flow of information in their diagram) rather than their artistic abilities. Adding time pressure to this activity may also be a way to help students focus their attention on the largest problem area (e.g., solving a communication question) rather than grappling with small details (e.g., illustrating the molecule) [113].
The module activity also limits the scientific content students need to know before constructing the diagram (e.g., the activity asks students to visually communicate a hypothetical rather than a real molecular process). This was designed to reduce the research burden on learners completing the communication task; instead, we wanted to direct their attention toward applying and demonstrating visual design principles. This unfortunately takes away an opportunity for students to gather, appraise, and synthesize scientific knowledge as well as analyze existing visual representations of the subject for its strengths and weaknesses. As such, we recommend that instructors substitute the activity task with one that asks students to construct visual representations of real and specific scientific processes or concepts relevant to their course instruction.

4.4.3. Suggestions for Implementing the Toolkit

We envision that the toolkit could supplement instruction, but further investigation and evaluation of the effectiveness of this tool will better inform our understanding of possible use cases. In Ostergren’s [60] dissertation on developing visual science communication competency in graduate students, she highlights a variety of learning experiences important for skill acquisition as well as strategies for delivering a curriculum. Studio-based learning experiences—namely, direct instruction and feedback, expert modeling, the exchange of ideas, encouragement to experiment, and exposure to design and design strategies—help students foster the skills and knowledge needed to create effective visuals. These experiences could be delivered formally as a course under the guidance of an expert communicator. They could also be delivered as a workshop, with opportunities for expert modeling, feedback, and hands-on exercises to expose students to design strategies. Learning experiences can also occur informally through tutorials and clubs. Of the above, Ostergren notes her study population (graduate students) experience direct instruction, experimentation, and the exchange of ideas with peers in a limited way during their education.
Building on Ostergren’s work, we recognize that while the toolkit was designed as a standalone learning module, students may benefit most when their learning is guided and supported by a TA or instructor. For instance, TAs could hold a tutorial session dedicated to learning visual science communication in which they use animations from the toolkit to teach concepts, ask students to complete the design activity with peers, and provide feedback on their diagrams in real time. For biology instructors, dedicating a full class to visual science communication may be difficult. Instead, they could assign students to complete the toolkit outside of class time or incorporate the design activity as an assessment of students’ understanding of scientific concepts (see Section 1.4 for examples of drawing-to-learn assignments). Both TAs and instructors can design grading rubrics (or other grading aids) based on the principles of visual science communication described in the animations.

4.5. Study Limitations

Our research was undertaken primarily at one university and the practices of this university, with respect to visual science communication instruction, may not reflect teaching at other North American institutions. Additionally, this study comprised a small sample size, limiting its generalizability to the wider undergraduate life sciences student population at the University of Toronto. Participation in the survey did not provide remuneration, so students and instructors who willingly participated may have been driven by intrinsic motivations and a positive perception of visual science communication. Thus, the study may not capture the needs of participants who had neutral or negative perceptions of the topic.
It is also important to note that this study was conducted during the COVID-19 pandemic. Some factors, such as the students’ perceived lack of guidance, support, and structure from instructors, may have reflected the shift to an online learning environment during the pandemic [114].

4.6. Answers to Our Research Questions

We conducted this study with two research questions in mind:
  • What are the current gaps in visual science communication instruction in undergraduate life sciences education?
  • What are the qualities of a resource with perceived value in teaching and learning visual science communication?
With respect to the first research question, we learned that current gaps exist in guidance and opportunities for visual science communication training for students. Students learn visual science communication on their own time without a formal framework, and their exposure to the communication design process is limited. For TAs and instructors, there is a lack of incentive and resources for integrating such training into the biology classroom. Despite the perceived value of visual representations in biology, there are gaps in exemplary models of instruction that teach students the visual design strategies required to construct effective visual representations as well as teach biology by asking students to create these visual representations.
With respect to the second research question, we learned our users value training experiences that provide scaffolding for the visual communication design process. Time can be spent breaking down visual communication theory and practice into manageable steps for novices, discussing the pitfalls of visualization, as well as providing opportunities for feedback between students, instructors, and communication experts. The ideal resource would be referenceable, efficient, self-paced, engaging, and designed for our users’ different pedagogical needs. This would ideally come with a well-designed rubric (or other assessment method) that evaluates a visual creation’s communication value and aesthetics. Once we identified these qualities of a valuable training resource from our study as well as from the literature, we created the Visual Science Communication Toolkit, a learning module that combines animations and interactivity to teach visual communication theory and practice in a context familiar to undergraduate biology students.

5. Conclusions

Visual science communication education has the potential to develop undergraduate life sciences student competencies as envisioned by call-to-action reports in biological research and education (e.g., A New Biology for the 21st Century [57] and Vision and Change in Undergraduate Biology Education [91]). This study provides two novel contributions to our understanding of visual science communication. Firstly, it strove to explore and define the current state of visual science communication training in the undergraduate life sciences, with a focus on students’ active interrogation with visual representations through the creation of communication materials. We found that extrinsic factors, namely, time, financial resources, and grading practices, greatly shape students’ and instructors’ experiences of visual science communication instruction. These factors can contribute to the lack of structure and support as well as unclear expectations and standards perceived by students and instructors. Our findings also show that the benefits of visual science communication assessments are twofold: they are opportunities for students to practice and refine their science communication skills and they give opportunities for instructors to gain insight into students’ higher-order thinking skills.
Secondly, this study discusses an original research output, the development of the Visual Science Communication Toolkit, along with design considerations for creating resources for visual science communication training. Future directions include further investigations and evaluations of the effectiveness of this tool, which will help to inform our understanding of its potential use cases in undergraduate life sciences education.

Supplementary Materials

The following supporting information can be downloaded at https://www.mdpi.com/article/10.3390/educsci14030296/s1, File S1: Survey questions and interview guides for students and instructors; File S2: Recruitment materials for students and instructors; Table S1: Demographic information on student survey participants (n = 53); Table S2: Demographic information on instructor (n = 13) and TA (n = 8) survey participants; Table S3: Spreadsheet tracking codes and themes (subcategories, categories, and groups); Figure S1: Screen capture of module page; Video S1: First animation in the toolkit, “Introduction: Visual Strategies”; Video S2: Second animation in the toolkit, “Case Study: Design Principles”.

Author Contributions

Conceptualization, K.E.Z.; methodology, K.E.Z. and J.J.; software, K.E.Z.; validation, K.E.Z. and J.J.; formal analysis, K.E.Z.; investigation, K.E.Z.; resources, K.E.Z. and J.J.; data curation, K.E.Z.; writing—original draft preparation, K.E.Z.; writing—review and editing, J.J.; visualization, K.E.Z.; supervision, J.J.; project administration, K.E.Z. and J.J.; funding acquisition, J.J. All authors have read and agreed to the published version of the manuscript.

Funding

This research was funded in part by grants from the US National Science Foundation (NSF) #1827249 as well as the Social Sciences and Humanities Research Council (SSHRC) Partnership Development Grant in Canada #890-2019-0028.

Institutional Review Board Statement

This study was conducted in accordance with the Declaration of Helsinki and approved by the Research Ethics Board of the University of Toronto (Protocol #41242, approved 15 July 2021).

Informed Consent Statement

Informed consent was obtained from all subjects involved in the study.

Data Availability Statement

The following data are available in the Supplementary Materials: demographic information on survey participants; research instruments; recruitment materials; a spreadsheet of codes; animations from research output. Other needs assessment data presented in this study are available on request from the corresponding author. Due to the nature of the data and its collection (interview video and audio recordings), the authors are taking precautions to maintain confidentiality of the participants and are not making the data publicly available.

Acknowledgments

We thank Nicholas Woolridge (University of Toronto) and Marc Dryer (University of Toronto) for supporting the supervision of this study; Susan Keen (University of California at Davis) and Gaël McGill (Digiyzme, Inc.; Harvard Medical School) for contributing to funding acquisition of this study and feedback on subsequent development of the toolkit; and Yixuan (Max) Zhang (McGill University) for developing software for the Visual Science Communication Toolkit interactive design activity.

Conflicts of Interest

The authors declare no conflicts of interest. The funders had no role in the design of the study; in the collection, analyses, or interpretation of data; in the writing of the manuscript; or in the decision to publish the results.

References

  1. Burns, T.W.; O’Connor, D.J.; Stocklmayer, S. Science Communication: A Contemporary Definition. Public Underst. Sci. 2003, 12, 183–202. [Google Scholar] [CrossRef]
  2. Roche, J.; Arias, R.; Bell, L.; Boscolo, M.; Fornetti, A.; Knutas, A.; Kupper, F.; Magalhães, J.; Mannino, I.; Mendoza, I.; et al. Taking Stock and Re-Examining the Role of Science Communication. Front. Environ. Sci. 2021, 9, 662. [Google Scholar] [CrossRef]
  3. Tornasi, Z.; Delaney, N. Science Communication—Achievements in Horizon 2020 and Recommendations on the Way Forward; European Commission, Directorate-General for Research and Innovation, Publications Office of the European Union: Luxembourg, 2020; Available online: https://data.europa.eu/doi/10.2777/518359 (accessed on 12 September 2023).
  4. Illingworth, S.; Allen, G. Effective Science Communication, 2nd ed.; IOP Publishing: Bristol, UK, 2020. [Google Scholar] [CrossRef]
  5. Kappel, K.; Holmen, S.J. Why Science Communication, and Does It Work?: A Taxonomy of Science Communication Aims and a Survey of the Empirical Evidence. Front. Commun. 2019, 4, 55. [Google Scholar] [CrossRef]
  6. Ziegler, R.; Hedder, I.R.; Fischer, L. Evaluation of Science Communication: Current Practices, Challenges, and Future Implications. Front. Commun. 2021, 6, 669744. [Google Scholar] [CrossRef]
  7. Canfield, K.; Menezes, S.; Matsuda, S.B.; Moore, A.; Austin, A.N.M.; Dewsbury, B.M.; Feliú-Mójer, M.I.; McDuffie, K.; Moore, K.; Reich, C.; et al. Science Communication Demands a Critical Approach That Centers Inclusion, Equity, and Intersectionality. Front. Commun. 2020, 5, 2. [Google Scholar] [CrossRef]
  8. Schäfer, M.S. How Changing Media Structures Are Affecting Science News Coverage. In The Oxford Handbook of the Science of Science Communication; Jamieson, K.H., Kahan, D.M., Scheufele, D.A., Eds.; Oxford University Press: Oxford, UK, 2017. [Google Scholar] [CrossRef]
  9. Akin, H. Overview of the Science of Science Communication. In The Oxford Handbook of the Science of Science Communication; Jamieson, K.H., Kahan, D.M., Scheufele, D.A., Eds.; Oxford University Press: Oxford, UK, 2017. [Google Scholar] [CrossRef]
  10. Dudo, A.; Besley, J.C.; Yuan, S. Science Communication Training in North America: Preparing Whom to Do What with What Effect? Sci. Commun. 2021, 43, 33–63. [Google Scholar] [CrossRef]
  11. Olfert, M.D.; Hagedorn, R.L.; Barr, M.L.; Famodu, O.A.; Rubino, J.M.; White, J.A. eB4CAST: An Evidence-Based Tool to Promote Dissemination and Implementation in Community-Based, Public Health Research. Int. J. Environ. Res. Public Health 2018, 15, 2142. [Google Scholar] [CrossRef] [PubMed]
  12. Oliffe, M.; Thompson, E.; Johnston, J.; Freeman, D.; Bagga, H.; Wong, P.K.K. Assessing the readability and patient comprehension of rheumatology medicine information sheets: A cross-sectional Health Literacy Study. BMJ Open 2019, 9, e024582. [Google Scholar] [CrossRef] [PubMed]
  13. Royal, K.D.; Erdmann, K.M. Evaluating the readability levels of medical infographic materials for public consumption. J. Vis. Commun. Med. 2018, 41, 99–102. [Google Scholar] [CrossRef] [PubMed]
  14. Wolpin, S.; Halpenny, B.; Sorrentino, W.; Stewart, M.; McReynolds, J.; Cvitkovic, I.; Chang, P.; Berry, D. Usability Testing the “Personal Patient Profile–Prostate” in a Sample of African American and Hispanic Men. CIN 2016, 34, 288–296. [Google Scholar] [CrossRef]
  15. Pauwels, L. A theoretical framework for assessing visual representational practices in knowledge building and science communications. In Visual Cultures of Science: Rethinking Representational Practices in Knowledge Building and Science Communication; Pauwel, L., Ed.; Dartmouth College Press: Chicago, IL, USA, 2006; pp. 1–25. [Google Scholar]
  16. Mogull, S.A.; Stanfield, C.T. Current Use of Visuals in Scientific Communication. In Proceedings of the 2015 IEEE International Professional Communication Conference (IPCC), Limerick, Ireland, 12–15 July 2015; pp. 1–6. [Google Scholar] [CrossRef]
  17. Lee, P.-S.; West, J.D.; Howe, B. Viziometrics: Analyzing Visual Information in the Scientific Literature. IEEE Trans. Big Data 2018, 4, 117–129. [Google Scholar] [CrossRef]
  18. Cheng, K.; Chen, Y.; Larson, K.; Rolandi, M. Proving the Value of Visual Design in Scientific Communication. Inf. Des. J. 2017, 23, 80–95. [Google Scholar] [CrossRef]
  19. Anscombe, F.J. Graphs in Statistical Analysis. Am. Stat. 1973, 27, 17–21. [Google Scholar] [CrossRef]
  20. Lemke, J. Multiplying meaning: Visual and verbal semiotics in scientific text. In Reading Science: Critical and Functional Perspectives on Discourses of Science; Martin, J.R., Veel, R., Eds.; Routledge: Oxfordshire, UK, 1998; pp. 87–113. [Google Scholar]
  21. Hamaguchi, R.; Nematollahi, S.; Minter, D.J. Picture of a Pandemic: Visual Aids in the COVID-19 Crisis. J. Public Health 2020, 42, 483–485. [Google Scholar] [CrossRef]
  22. Jarreau, P.B.; Su, L.Y.-F.; Chiang, E.C.-L.; Bennett, S.M.; Zhang, J.S.; Ferguson, M.; Algarra, D. COVID ISSUE: Visual Narratives About COVID-19 Improve Message Accessibility, Self-Efficacy, and Health Precautions. Front. Commun. 2021, 6, 712658. [Google Scholar] [CrossRef]
  23. Flagg, B. Beyond Entertainment: Educational Impact of Films and Companion Materials. Big Fram. 2005, 22, 50–66. Available online: https://www.informalscience.org/sites/default/files/Beyond-Entertainment-Flagg.pdf (accessed on 30 August 2023).
  24. Jensen, E.A.; Borkiewicz, K.M.; Naiman, J.P. A New Frontier in Science Communication? What We Know about How Public Audiences Respond to Cinematic Scientific Visualization. Front. Commun. 2022, 7, 840631. [Google Scholar] [CrossRef]
  25. Schönborn, K.J.; Anderson, T.R. The Importance of Visual Literacy in the Education of Biochemists. Biochem. Mol. Biol. Educ. 2006, 34, 94–102. [Google Scholar] [CrossRef] [PubMed]
  26. Mathewson, J.H. Visual-Spatial Thinking: An Aspect of Science Overlooked by Educators. Sci. Educ. 1999, 83, 33–54. [Google Scholar] [CrossRef]
  27. Gilbert, J.K. Visualization: A Metacognitive Skill in Science and Science Education. In Visualization in Science Education; Gilbert, J.K., Ed.; Springer: Dordrecht, The Netherlands, 2005; pp. 9–27. [Google Scholar] [CrossRef]
  28. Evagorou, M.; Erduran, S.; Mäntylä, T. The Role of Visual Representations in Scientific Practices: From Conceptual Understanding and Knowledge Generation to ‘Seeing’ How Science Works. Int. J. STEM Educ. 2015, 2, 11. [Google Scholar] [CrossRef]
  29. Reilly, C.; Ingber, D.E. Art advancing science: Filmmaking leads to molecular insights at the nanoscale. ACS Nano 2017, 11, 12156–12166. [Google Scholar] [CrossRef]
  30. Sheredos, B.; Burnston, D.; Abrahamsen, A.; Bechtel, W. Why Do Biologists Use So Many Diagrams? Phil. Sci. 2013, 80, 931–944. [Google Scholar] [CrossRef]
  31. Lynch, M. The Production of Scientific Images: Vision and Re-Vision in the History, Philosophy, and Sociology of Science. Commun. Cognition. Monogr. 1998, 31, 213–228. [Google Scholar]
  32. Carter, M. Designing Science Presentations, 2nd ed.; Academic Press: Cambridge, MA, USA, 2013. [Google Scholar]
  33. Rowe, N. Academic & Scientific Poster Presentation; Springer International Publishing: Berlin/Heidelberg, Germany, 2017. [Google Scholar] [CrossRef]
  34. Rolandi, M.; Cheng, K.; Pérez-Kriz, S. A Brief Guide to Designing Effective Figures for the Scientific Paper. Adv. Mat. 2011, 23, 4343–4346. [Google Scholar] [CrossRef] [PubMed]
  35. Trumbo, J. Visual Literacy and Science Communication. Sci. Commun. 1999, 20, 409–425. [Google Scholar] [CrossRef]
  36. Agrawal, S.; Ulrich, P. A Picture is Worth 1000 Words: Teaching Science Communication with Graphical Abstract Assignments. J. Microbiol. Biol. Educ. 2023, 24, e00208-22. [Google Scholar] [CrossRef] [PubMed]
  37. Greenwood, M.R.C.; Riordan, D.G. Civic Scientist/Civic Duty. Sci. Commun. 2001, 23, 28–40. [Google Scholar] [CrossRef]
  38. Illes, J.; Moser, M.A.; McCormick, J.B.; Racine, E.; Blakeslee, S.; Caplan, A.; Hayden, E.C.; Ingram, J.; Lohwater, T.; McKnight, P.; et al. Neurotalk: Improving the Communication of Neuroscience Research. Nat. Rev. Neurosci. 2010, 11, 61–69. [Google Scholar] [CrossRef]
  39. Brownell, S.E.; Price, J.V.; Steinman, L. Science Communication to the General Public: Why We Need to Teach Undergraduate and Graduate Students This Skill as Part of Their Formal Scientific Training. J. Undergrad. Neurosci. Educ. 2013, 12, E6–E10. [Google Scholar]
  40. Ainsworth, S.; Prain, V.; Tytler, R. Science Education. Drawing to Learn in Science. Science 2011, 333, 1096–1097. [Google Scholar] [CrossRef]
  41. Stanger-Hall, K.F.; Shockley, F.W.; Wilson, R.E. Teaching Students How to Study: A Workshop on Information Processing and Self-Testing Helps Students Learn. CBE Life Sci. Educ. 2011, 10, 187–198. [Google Scholar] [CrossRef]
  42. Frankel, F.C. Picturing Science and Engineering. MRS Bull. 2020, 45, 994–998. [Google Scholar] [CrossRef]
  43. Quillin, K.; Thomas, S. Drawing-to-Learn: A Framework for Using Drawings to Promote Model-Based Reasoning in Biology. CBE Life Sci. Educ. 2015, 14, es2. [Google Scholar] [CrossRef]
  44. Momsen, J.L.; Long, T.M.; Wyse, S.A.; Ebert-May, D. Just the Facts? Introductory Undergraduate Biology Courses Focus on Low-Level Cognitive Skills. CBE Life Sci. Educ. 2010, 9, 435–440. [Google Scholar] [CrossRef]
  45. Offerdahl, E.G.; Arneson, J.B.; Byrne, N. Lighten the Load: Scaffolding Visual Literacy in Biochemistry and Molecular Biology. CBE Life Sci. Educ. 2017, 16, es1. [Google Scholar] [CrossRef]
  46. Perkel, J.M. The Software That Powers Scientific Illustration. Nature 2020, 582, 137–138. [Google Scholar] [CrossRef]
  47. Bresciani, S.; Eppler, M.J. The Pitfalls of Visual Representations: A Review and Classification of Common Errors Made While Designing and Interpreting Visualizations. SAGE Open 2015, 5, 4. [Google Scholar] [CrossRef]
  48. Schnotz, W.; Bannert, M. Construction and interference in learning from multiple representation. Learn. Instr. 2003, 13, 141–156. [Google Scholar] [CrossRef]
  49. Franconeri, S.L.; Padilla, L.M.; Shah, P.; Zacks, J.M.; Hullman, J. The Science of Visual Data Communication: What Works. Psychol. Sci. Public Interest 2021, 22, 110–161. [Google Scholar] [CrossRef] [PubMed]
  50. Crameri, F.; Shephard, G.E.; Heron, P.J. The Misuse of Colour in Science Communication. Nat. Commun. 2020, 11, 5444. [Google Scholar] [CrossRef] [PubMed]
  51. Adams, F.M.; Osgood, C.E. A Cross-Cultural Study of the Affective Meanings of Color. J. Cross-Cult. Psychol. 1973, 4, 135–156. [Google Scholar] [CrossRef]
  52. Valdez, P.; Mehrabian, A. Effects of Color on Emotions. J. Exp. Psychol. Gen. 1994, 123, 394–409. [Google Scholar] [CrossRef]
  53. Bresciani, S. Do you see what I see? The effect of culture on the reception of visual communication. In Theoretical Turbulence in Intercultural Communication Studies; Poutiainen, S., Ed.; Cambridge Scholars: Newcastle upon Tyne, UK, 2014; pp. 81–100. [Google Scholar]
  54. Dachille-Hey, R.E. The Case of the Disappearing Blue Women: Understanding how Meaning is made in Desi Sangye Gyatso’s Blue Beryl painting. Asian Med. 2011, 6, 293–320. [Google Scholar] [CrossRef]
  55. Rodríguez Estrada, F.C.; Davis, L.S. Improving Visual Communication of Science Through the Incorporation of Graphic Design Theories and Practices into Science Communication. Sci. Commun. 2015, 37, 140–148. [Google Scholar] [CrossRef]
  56. Chen, Y.; O’Mahony, K.; Ostergren, M.; Pérez-Kriz, S.; Rolandi, M. Study of Interdisciplinary Visual Communication in Nanoscience and Nanotechnology. Int. J. Eng. Educ. 2014, 30, 1036–1047. [Google Scholar]
  57. National Research Council. A New Biology for the 21st Century; National Academies Press: Washington, DC, USA, 2009. [Google Scholar] [CrossRef]
  58. Labov, J.B.; Reid, A.H.; Yamamoto, K.R. Integrated Biology and Undergraduate Science Education: A New Biology Education for the Twenty-First Century? CBE Life Sci. Educ. 2010, 9, 10–16. [Google Scholar] [CrossRef]
  59. Jensen, E.; Gerber, A. Evidence-Based Science Communication. Front. Commun. 2020, 4, 78. [Google Scholar] [CrossRef]
  60. Ostergren, M. How Scientists Develop Competence in Visual Communication. Ph.D. Dissertation, University of Washington, Seattle, WA, USA, 2013. [Google Scholar]
  61. Tufte, E.R. The Visual Display of Quantitative Information, 2nd ed.; Graphics Press: Cheshire, CT, USA, 2001. [Google Scholar]
  62. O’Mahony, T.; Petz, J.; Cook, J.; Cheng, K.; Rolandi, M. The Design Help Desk: A Collaborative Approach to Design Education for Scientists and Engineers. PLoS ONE 2019, 14, e0212501. [Google Scholar] [CrossRef] [PubMed]
  63. Flanagan, K.M.; Einarson, J. Gender, Math Confidence, and Grit: Relationships with Quantitative Skills and Performance in an Undergraduate Biology Course. CBE Life Sci. Educ. 2017, 16, ar47. [Google Scholar] [CrossRef] [PubMed]
  64. Sorte, C.J.B.; Aguilar-Roca, N.M.; Henry, A.K.; Pratt, J.D. A Hierarchical Mentoring Program Increases Confidence and Effectiveness in Data Analysis and Interpretation for Undergraduate Biology Students. CBE Life Sci. Educ. 2020, 19, ar23. [Google Scholar] [CrossRef] [PubMed]
  65. Brownell, S.E.; Price, J.V.; Steinman, L. A writing-intensive course improves biology undergraduates’ perception and confidence of their abilities to read scientific literature and communicate science. Adv. Physiol. Educ. 2013, 37, 70–79. [Google Scholar] [CrossRef] [PubMed]
  66. Galvagno, M.; Dalli, D. Theory of Value Co-Creation: A Systematic Literature Review. Manag. Serv. Qual. 2014, 24, 643–683. [Google Scholar] [CrossRef]
  67. Stier, J.; Smit, S.E. Co-Creation as an Innovative Setting to Improve the Uptake of Scientific Knowledge: Overcoming Obstacles, Understanding Considerations and Applying Enablers to Improve Scientific Impact in Society. J. Innov. Entrep. 2021, 10, 35. [Google Scholar] [CrossRef]
  68. Greene, J.C.; Caracelli, V.J.; Graham, W.F. Toward a Conceptual Framework for Mixed-Method Evaluation Designs. Educ. Eval. Policy Anal. 1989, 11, 255–274. [Google Scholar] [CrossRef]
  69. Creswell, J.W.; Clark, V.L.P. Designing and Conducting Mixed Methods Research; SAGE Publications: Thousand Oaks, CA, USA, 2007. [Google Scholar]
  70. Bennett, C.; Khangura, S.; Brehaut, J.C.; Graham, I.D.; Moher, D.; Potter, B.K.; Grimshaw, J.M. Reporting Guidelines for Survey Research: An Analysis of Published Guidance and Reporting Practices. PLoS Med. 2011, 8, e1001069. [Google Scholar] [CrossRef] [PubMed]
  71. Krueger, R.A.; Casey, M.A. Focus Groups: A Practical Guide for Applied Research, 3rd ed.; SAGE Publications: Thousand Oaks, CA, USA, 2000. [Google Scholar]
  72. Courage, C.; Baxter, K. Understanding Your Users: A Practical Guide to User Requirements Methods, Tools, and Techniques; Elsevier: Amsterdam, The Netherlands, 2005. [Google Scholar]
  73. Strauss, A.L.; Corbin, J.M. Basics of Qualitative Research: Techniques and Procedures for Developing Grounded Theory; SAGE Publications: Thousand Oaks, CA, USA, 1998. [Google Scholar]
  74. Stewart, D.W.; Shamdasani, P. Focus Groups: Theory and Practice; SAGE Publications: Thousand Oaks, CA, USA, 2014. [Google Scholar]
  75. Jones, R.; Noble, G. Grounded theory and management research: A lack of integrity? Qual. Res. Organ. Manag. 2007, 2, 84–103. [Google Scholar] [CrossRef]
  76. McCall, C.; Edwards, C. New Perspectives for Implementing Grounded Theory. Stud. Eng. 2020, 1, 93–107. [Google Scholar] [CrossRef]
  77. Baker, B.D. Does Money Matter in Education? 2nd ed.; Albert Shanker Institute: Washington, DC, USA, 2016. Available online: https://files.eric.ed.gov/fulltext/ED563793.pdf (accessed on 15 December 2022).
  78. Pelletreau, K.N.; Knight, J.K.; Lemons, P.P.; McCourt, J.S.; Merrill, J.; Nehm, R.H.; Prevost, L.B.; Urban-Lurain, M.; Smith, M.K. A Faculty Professional Development Model That Improves Student Learning, Encourages Active-Learning Instructional Practices, and Works for Faculty at Multiple Institutions. CBE Life Sci. Educ. 2018, 17, es5. [Google Scholar] [CrossRef]
  79. Seymour, E.; Melton, G.; Wiese, D.J.; Pedersen-Gallegos, L. Partners in Innovation: Teaching Assistants in College Science Courses; Rowman & Littlefield: Lanham, MD, USA, 2005. [Google Scholar]
  80. Wyse, S.A.; Long, T.M.; Ebert-May, D. Teaching Assistant Professional Development in Biology: Designed for and Driven by Multidimensional Data. CBE Life Sci. Educ. 2014, 13, 212–223. [Google Scholar] [CrossRef]
  81. Schinske, J.N.; Tanner, K.D. Teaching More by Grading Less (or Differently). CBE Life Sci. Educ. 2014, 13, 159–166. [Google Scholar] [CrossRef]
  82. Allen, D.; Tanner, K. Rubrics: Tools for Making Learning Goals and Evaluation Criteria Explicit for Both Teachers and Learners. CBE Life Sci. Educ. 2006, 5, 197–203. [Google Scholar] [CrossRef]
  83. Lettau, J. The Impact of Children’s Academic Competencies and School Grades on Their Life Satisfaction: What Really Matters? Child Indic. Res. 2021, 14, 2171–2195. [Google Scholar] [CrossRef]
  84. Freeman, S.; Parks, J.W. How Accurate is Peer Grading? CBE Life Sci. Educ. 2010, 9, 379–553. [Google Scholar] [CrossRef] [PubMed]
  85. Ziegler, B.; Montplaisir, L. Student Perceived and Determined Knowledge of Biology Concepts in an Upper-Level Biology Course. CBE Life Sci. Educ. 2014, 13, 322–330. [Google Scholar] [CrossRef] [PubMed]
  86. Hattie, J.; Timperley, H. The Power of Feedback. Rev. Educ. Res. 2007, 77, 81–112. [Google Scholar] [CrossRef]
  87. Airey, J.; Linder, C.A. Disciplinary Discourse Perspective on University Science Learning: Achieving Fluency in a Critical Constellation of Modes. J. Res. Sci. Teach. 2009, 46, 27–49. [Google Scholar] [CrossRef]
  88. Momsen, J.L.; Offerdahl, E.G.; Kryjevskaia, M.; Montplaisir, L.; Anderson, E.; Grosz, N. Using Assessments to Investigate and Compare the Nature of Learning in Undergraduate Science Courses. CBE Life Sci. Educ. 2013, 12, 239–249. [Google Scholar] [CrossRef] [PubMed]
  89. Bransford, J.D.; Schwartz, D.L. Chapter 3: Rethinking Transfer: A Simple Proposal with Multiple Implications. Rev. Res. Educ. 1999, 24, 61–100. [Google Scholar] [CrossRef]
  90. Guo, S. Science Education: Should Facts Come First? Science 2008, 320, 1012. [Google Scholar] [CrossRef]
  91. Allen, D.; Tanner, K. Putting the Horse Back in Front of the Cart: Using Visions and Decisions about High-Quality Learning Experiences to Drive Course Design. CBE Life Sci. Educ. 2007, 6, 85–89. [Google Scholar] [CrossRef]
  92. Brewer, C.; Smith, D. Vision and Change in Undergraduate Biology Education: A Call to Action; American Association for the Advancement of Science: Washington, DC, USA, 2011; Available online: https://www.aps.org/programs/education/undergrad/upload/Revised-Vision-and-Change-Final-Report.pdf (accessed on 15 December 2022).
  93. Leavy, A.; Dick, L.; Meletiou-Mavrotheris, M.; Paparistodemou, E.; Stylianou, E. The prevalence and use of emerging technologies in STEAM education: A systematic review of the literature. J. Comput. Assist. Learn. 2023, 39, 1061–1082. [Google Scholar] [CrossRef]
  94. Brown, J.S.; Collins, A.; Duguid, P. Situated cognition and the culture of learning. Educ. Res. 1989, 18, 32–42. [Google Scholar] [CrossRef]
  95. de Vries, E. Students’ construction of external representations in design-based learning situations. Learn. Instr. 2006, 16, 213–227. [Google Scholar] [CrossRef]
  96. Gormally, C.; Brickman, P.; Hallar, B.; Armstrong, N. Effects of Inquiry-based Learning on Students’ Science Literacy Skills and Confidence. Int. J. Scholarsh. Teach. Learn. 2009, 3, 16. [Google Scholar] [CrossRef]
  97. Li, Y.; Schoenfeld, A.H.; diSessa, A.A.; Graesser, A.C.; Benson, L.C.; English, L.D.; Duschl, R.A. Design and Design Thinking in STEM Education. J. STEM Educ. Res. 2019, 2, 93–104. [Google Scholar] [CrossRef]
  98. Oh, Y.; Ishizaki, S.; Gross, M.D.; Yi-Luen, E. A Theoretical Framework of Design Critiquing in Architecture Studios. Des. Stud. 2013, 34, 302–325. [Google Scholar] [CrossRef]
  99. Yenawine, P. Visual Thinking Strategies: Using Art to Deepen Learning Across School Disciplines; Harvard Education Press: London, UK, 2013. [Google Scholar]
  100. Mayer, R.E. Cognitive Theory of Multimedia Learning; Cambridge University Press: Cambridge, UK, 2005; pp. 43–71. [Google Scholar] [CrossRef]
  101. Rau, M.A.; Keesler, W.; Zhang, Y.; Wu, S.P.W. Design Tradeoffs of Interactive Visualization Tools for Educational Technologies. IEEE Trans. Learn. Technol. 2020, 13, 326–339. [Google Scholar] [CrossRef]
  102. Chapman, O.; Sawchuk, K. Research-Creation: Intervention, analysis and “family resemblances”. Can. J. Commun. 2012, 37, 5–26. [Google Scholar] [CrossRef]
  103. Wong, B. Points of View: Visualizing Biological Data. Nat. Methods 2012, 9, 1131. [Google Scholar] [CrossRef]
  104. Wong, B. Gestalt Principles (Part 1). Nat. Methods 2010, 7, 863. [Google Scholar] [CrossRef]
  105. Wong, B. Gestalt Principles (Part 2). Nat. Methods 2010, 7, 941. [Google Scholar] [CrossRef]
  106. Wong, B. Layout. Nat. Methods 2011, 8, 783. [Google Scholar] [CrossRef]
  107. Iwasa, J.H. The Scientist as Illustrator. Trends Immunol. 2016, 37, 247–250. [Google Scholar] [CrossRef]
  108. Bankston, A.; McDowell, G.S. Changing the Culture of Science Communication Training for Junior Scientists. J. Microbiol. Biol. Educ. 2018, 19, 19.1.43. [Google Scholar] [CrossRef]
  109. Baram-Tsabari, A.; Lewenstein, B.V. Science Communication Training: What Are We Trying to Teach? Int. J. Sci. Educ. Part B 2017, 7, 285–300. [Google Scholar] [CrossRef]
  110. van Merrienboer, J.J.G.; Kirschner, P.A.; Kester, L. Taking the Load Off a Learner’s Mind: Instructional Design for Complex Learning. Educ. Psychol. 2003, 38, 5–13. [Google Scholar] [CrossRef]
  111. Kelley, D.; Brown, T. An Introduction to Design Thinking. 2010. Available online: https://web.stanford.edu/~mshanks/MichaelShanks/files/509554.pdf (accessed on 15 December 2022).
  112. Barnes, S.R. Studies in the Efficacy of Motion Graphics: The Relation between Expository Motion Graphics and the Presence of Naïve Realism. Vis. Commun. 2019, 18, 135–158. [Google Scholar] [CrossRef]
  113. Miller, G.A. The Magical Number Seven, plus or Minus Two: Some Limits on Our Capacity for Processing Information. J. Psychol. 1956, 63, 81–97. [Google Scholar] [CrossRef]
  114. Jackson, J.; Almos, H.; Karibian, N.; Lieb, C.; Butts-Wilmsmeyer, C.; Aranda, M.L. Identifying Factors That Influence Student Perceptions of Stress in Biology Courses with Online Learning Modalities. J. Microbiol. Biol. Educ. 2022, 23, e00233-21. [Google Scholar] [CrossRef] [PubMed]
Figure 1. Type and frequency of visual science communication training received by undergraduate students.
Education 14 00296 g001
Figure 2. Students’ confidence in their visual science communication skills. First row: All students (n = 53). Second row, left to right: 2nd-year students (n = 21); 3rd-year students (n = 10); students in their 4th year and above (n = 22).
Education 14 00296 g002
Figure 3. Instructors’ confidence in student visual science communication skills. First row: All instructors and TAs (n = 21). Second row, left to right: biology instructors (n = 9); biology TAs (n = 7); science visualization instructors and TAs (n = 5).
Education 14 00296 g003
Figure 4. Students’ preferred resources for learning and understanding the topic of visual science communication. First row: All students (n = 53). Second row, left to right: 2nd-year students (n = 21); 3rd-year students (n = 10); students in their 4th year and above (n = 22).
Education 14 00296 g004
Figure 5. Instructors’ and TAs’ preferred resources for teaching the topic of visual science communication to students. First row: All instructors and TAs (n = 21). Second row, left to right: biology instructors (n = 9); biology TAs (n = 7); science visualization instructors and TAs (n = 5).
Education 14 00296 g005
Figure 6. Instructors’ and TAs’ preferred resources for evaluating students’ visual science communication skills. First row: All instructors and TAs (n = 21). Second row, left to right: biology instructors (n = 9); biology TAs (n = 7); science visualization instructors and TAs (n = 5).
Education 14 00296 g006
Figure 7. Diagram of module structure. The module starts with (A) an introductory video on visual strategies, followed by (B) a case study video on design principles, followed by (C) an interactive design activity that asks students to create a diagram explaining a hypothetical scientific process. The complete module can be accessed: https://www.visabli.com/work/visual-scicomm-toolkit (these materials are also available in the Supplementary Materials). The interactive activity was developed in ReactJS and is directly accessible through: https://visual-scicomm-toolkit.vercel.app (the codebase for the application is available on GitHub: https://github.com/amykzhang/visual-scicomm-toolkit-app).
Education 14 00296 g007
Table 1. Selection criteria for student, instructor, and teaching assistant study participants.
Participant Type Selection Criteria
Student
  • Participant is currently an undergraduate student at a university;
  • Participant is in their 1st, 2nd, 3rd, 4th, or 5th+ year of study;
  • Participant majors in a life sciences program.
Instructor
  • Participant is currently faculty or a sessional instructor at a university;
  • Participant instructs or has experience instructing undergraduate life sciences or biological sciences courses that ask students to create visual communication materials.
Teaching assistant
  • Participant is currently a teaching assistant at a university;
  • Participant instructs or has experience instructing undergraduate life sciences or biological sciences courses that ask students to create visual communication materials.
Table 2. Student responses to perceived gaps in visual science education.
QuestionsFrequencyPercentage
When do students think about incorporating visuals when making communication materials?
From the start or before2649%
In the middle1325%
Towards the end815%
After I finish611%
My professor and/or TAs have clearly instructed me on the creation of effective visual communication materials.
Yes2038%
No3362%
My professor and/or TAs have provided me with clear feedback on the effectiveness of the visual communication materials I create for them.
Yes2649%
No2751%
Table 3. Themes that emerged following interviews with students and instructors/TAs.
ThemeCore CategorySubcategory
3.2.1. Perceived support and exposure (factors contributing to students’ experience of visual science communication education)Expectations and standardsUnclear expectations
Rubrics as a standard for success
Support, guidance, and feedbackInsufficient support from instructors
Difficulty providing feedback to students
Integration in life sciences educationIntegration of training into curriculum
Opportunities to practice and refine
Personal interests and competenciesTechnological aptitude
Artistic aptitude
Stress and workload
Familiarity with scientific content
3.2.2. Incentives and resources (factors contributing to instructors’ experience of visual science communication education)Incentives to changeLack of financial resources and time
Prioritization of disciplinary content
Support for instructorsInsufficient training for instructors
Availability of resourcesInstructors reference existing resources
Evaluation methods for visual content
Intrinsic factorsDiffering levels of experience
3.2.3. Perceived value (integrating visual science communication into life sciences education)Value of visual communication assessmentsStudents building thinking skills
Instructors evaluating thinking skills
Teaching self-awareness
Value of visual communication skillsCommunication of information
Professional development
3.2.4. Exemplary models (designing instruction for visual science communication)Qualities of a valuable resourceScaffolding
Interactions between students, instructors, and communication experts
Referenceable, efficient, self-paced, engaging, user-centred
Evaluation criteria for visual communication materialsRubric design
Communication value
Aesthetics
Disclaimer/Publisher’s Note: The statements, opinions and data contained in all publications are solely those of the individual author(s) and contributor(s) and not of MDPI and/or the editor(s). MDPI and/or the editor(s) disclaim responsibility for any injury to people or property resulting from any ideas, methods, instructions or products referred to in the content.

