Article

Epistemic Discourses and Conceptual Coherence in Students’ Explanatory Models: The Case of Ocean Acidification and Its Impacts on Oysters

by
Asli Sezen-Barrie
1,*,
Mary K. Stapleton
2,
Gili Marbach-Ad
3 and
Anica Miller-Rushing
4
1
College of Education & Human Development, Research in STEM Education Center (RiSE), University of Maine, Orono, ME 04469, USA
2
Fisher College of Science and Mathematics, Towson University, Towson, MD 21252, USA
3
College of Computer, Mathematical and Natural Sciences, University of Maryland, College Park, MD 20742, USA
4
College of Education & Human Development, University of Maine, Orono, ME 04469, USA
*
Author to whom correspondence should be addressed.
Educ. Sci. 2023, 13(5), 496; https://doi.org/10.3390/educsci13050496
Submission received: 27 February 2023 / Revised: 21 April 2023 / Accepted: 2 May 2023 / Published: 14 May 2023
(This article belongs to the Special Issue Practices in Science and Engineering Education)

Abstract

:
Engaging students in epistemic and conceptual aspects of modeling practices is crucial for phenomena-based learning in science classrooms. However, many students and teachers still struggle to actualize the reformed vision of the modeling practice in their classrooms. Through a discourse analysis of 150 students’ explanatory models (as social semiotic spaces) from 14 classes, we propose a qualitative framework that investigates conceptual coherence and epistemic discourses to achieve a gapless explanation of scientific phenomena. Our framework draws attention to four critical components of students’ explanatory models: (a) key ideas based on evidence, (b) the discourse modalities of how evidence is presented, (c) scientific representations from the cultures of scientific disciplines, (d) systems thinking approaches directly and indirectly related to oceans and marine ecosystems. Our results indicate that students struggled to construct cohesive explanatory models that communicated all key ideas and the relationships among them, with the majority of student-developed models in our study categorized as ‘insufficiently’ cohesive (lacking key ideas and the relationships among them), and only a small percentage of the models considered ‘extensively’ cohesive (all key ideas attended to, as well as the relationships among them).

1. Introduction

Models are significant tools for making sense of our world and what lies beyond. In modern science, models are critical for learning, developing, evaluating, and communicating scientific knowledge [1,2]. Scientists develop and use models for a variety of purposes, such as theoretical exploration, explanation, and prediction [3,4]. For decades, models have been a vehicle for learning science in K-12 classrooms and have been a topic of research in science education [5,6,7]. Modeling practice regained a new emphasis in science education when a framework for K-12 Science Education [8] and the Next Generation Science Standards [9] suggested modeling as one of the key scientific practices that help students make sense of scientific phenomena. These two documents recommend a progressive use of models and modeling across all K-12 grades that develops from drawings of simple diagrams at the earliest grades to multimodal representations of complex or abstract phenomena.
Despite the increased attention to the role of models in student learning and authentic engagement in science, in many classrooms, the development and use of modeling practices are limited to routinized activities, including drawing components of a cell or writing the steps of an insect’s life cycle [10]. While these routinized activities can serve to accomplish the goals of traditional schooling [11], they might not help students understand how scientists make sense of scientific phenomena by engaging in modeling [12]. Long-standing research on modeling suggests a change in students’ roles in the modeling process. Scholars recommend a shift from students’ passive use of models as simple representations to students’ active use of models, such as figuring out phenomena through social interaction in the classroom environment (e.g., [5,7,13]). This active involvement is achieved by highlighting the epistemological aspects of the modeling practice in science classrooms where students act as producers and evaluators of scientific knowledge. Emphasis on epistemic aspects of the modeling practice requires students’ meaningful engagement where they are active participants in constructing and iteratively revising models based on evidence (e.g., [13,14,15]).
In order to successfully develop curricula and professional learning materials to align with this vision, there is a need to understand how students develop models through iterative revisions in the reality of science classrooms [16]. Authentic classroom environments can be a platform for showing challenges to the implementation of research-based ideas. In addition, the unique background of students can help researchers to identify diverse ways of student participation in the construction of knowledge through modeling practice. To this end, we worked with 14 classes where students engaged in constructing explanatory models. Explanatory models are tools that provide students opportunities to communicate their initial conceptions and integrate and revise these ideas with evidence collected through investigations, observations, and credible resources to gain explanatory power. These models can include inscriptional and written discourses to explain how and why phenomena occur [17,18]. The explanatory models were a critical part of a module on the impacts of climate change, and students worked to develop models that explained the impact of increasing atmospheric carbon dioxide on oyster larvae.
The NGSS became the first set of national standards in the U.S. that made climate change an explicit topic to be taught in classrooms [9]. This focus on climate change in the standards was timely as the scientific consensus is that climate change is real, and the increase in atmospheric CO2 due to the burning of fossil fuels is the main reason for the recent climatic change (e.g., [19]). Despite strong evidence, climate change is still represented as a controversial topic by the media [20] and most classroom teachers [21]. Understanding climate change claims requires background knowledge from various disciplines due to its interdisciplinary nature [22]. For example, when making sense of the impacts of ocean acidification on marine life, one needs to understand ocean chemistry, the biological cycle of marine animals, and the economic impacts on fisheries. Supporting evidence or positions of climate change require a systems thinking approach to understand the relationships between these and other interdisciplinary components [23]. Due to its complex (assumed) controversial nature, making sense of climate change claims creates a unique challenge. To tackle this challenge in their classrooms, teachers need guidance and supporting materials. In order to design activities and supporting materials, it is critical to start with an exploration of how students model climate-change-related phenomena in their classrooms.
Our study explored how students’ models represent human-induced climate change with respect to ocean acidification and oysters. We analyzed 150 explanatory models from 14 science classes to investigate whether and how epistemic practices were utilized to build coherent explanations of ocean acidification and its impacts on oyster larval development. In addition, we propose an analysis framework for explanatory models that is aligned with NGSS and that attends to multidisciplinary complex issues in science. Our intention is to develop a qualitative analysis framework practitioners can use as a feedback tool to improve real classroom practice.

2. Background

2.1. Modeling as an Epistemic Practice of Science and in Science Classrooms

Scientists work within the norms of their disciplines that are socially agreed upon by the members of that discipline [24]. The epistemic nature of scientific practices emphasizes how scientists work within the cultural norms of their disciplines to construct scientific explanations [25,26]. Gouvea and Passmore [27] assert that a shift in K-12 classrooms toward emphasizing epistemic goals is particularly important for the practice of developing and using models. The traditional use of models in science classrooms reflects the known components of scientific phenomena (i.e., models of), such as students imitating the structure of DNA by focusing on its representational nature. Instead, Gouvea and Passmore [27] suggest a modeling practice in classrooms where there is a focus on learning the functions and relationships of the components of DNA, and in which the model is a tool for relationship building to explore and explain the nature of scientific phenomena (i.e., models for). The focus on the latter (models for), helps students understand the epistemic functions of the models. These epistemic functions help students understand how scientists develop, evaluate, and represent evidence through their models [28]. Researchers argue that shifts such as these (where students collectively work towards epistemic goals) require an immense amount of instructional support [29], and teachers need support to learn to scaffold these instructional environments [30]. Despite these calls for an instructional shift toward epistemic understanding, researchers found that the modeling practice where students actively contribute to the development of the models (models for) has rarely been integrated into science classrooms in elementary and middle schools. Most models continue to be used as illustrative or communicative devices (models of) that do not incorporate students’ contributions [7]. We therefore chose to build our module around the use of explanatory models that allow students to integrate their ideas (models for) to support their learning regarding the impact of climate change.
To support teachers and students in developing high quality explanatory models in science classrooms, it is crucial to understand the epistemic norms highlighted in what are characterized as “good models” in scientific disciplines [31] (p. 486). Philosophers of science found that good models are evidenced-based and have explanatory power, with appropriate details and complexity of ideas that are directly related to the topic studied (e.g., [32,33,34,35]). Most effective models also communicate a variety of modes of representation, such as pictures, diagrams, and tables (e.g., [34,36]), to sequence and connect ideas [37] and integrate data [38].
Learning progression studies on the modeling practice contribute to another important area of research that informs the epistemic aspects of the modeling practice for science classrooms [39,40,41]. These studies provide a framework that can be used by teachers to engage their students in epistemic considerations. These considerations include how well student models use evidence relevant to the claim, how coherently they explain the related scientific phenomena, how diverse semiotic tools (e.g., written or drawn discourses) are utilized to effectively communicate to audiences, and how a model is revised to improve its explanatory or predictive power. In addition, these studies highlight how models can represent a variety of scientific phenomena that are meaningfully connected for a coherent explanation. Bamberger and Davis’ study [39] provided a framework where models progressed from static representations of visible components of a phenomenon to mechanistic representations where both the visible and invisible features were used to explain the relationships and processes related to the phenomenon. In the mechanistic models, students also showed comparisons of different situations, such as models of the smell of air fresheners in warmer and cooler temperatures, and specifically labeled representations to clarify abstract components of models, such as labeling the air modules.
For successful mechanistic models, it is important to allow students to use multiple representations (e.g., drawing, writing) in communicating their ideas [42,43]. Drawn models have shown advantages in promoting creative ways of expressing scientific ideas and relationships between the ideas. The drawn models can also remove language barriers, resulting in a more equitable and inclusive learning tool [44]. While written models tend to be more restricted in the ways ideas can be expressed, written information on models with drawings can enhance the clarity of the drawn representations [45]. To respond to the unique learning demands of individual students, researchers suggest giving students the freedom to select the form of their expression [44]. Students who can take advantage of using different modes of representation can have the opportunity to show a “deeper understanding” of phenomena [46] and develop epistemic agency while taking part in shaping knowledge construction on the models [29].
Despite more than a decade of research on epistemic aspects of modeling practices, teachers and students still hold a limited understanding of this practice. Therefore, they struggle to engage in modeling as an epistemic practice where their initial ideas and observed evidence are iteratively built into a mechanistic model. The student models often lack the representation of abstract components and the connections between ideas to show a coherent explanation [16,47]. We propose that an in-depth analysis of student-developed models can provide insight into why teachers and students continue to struggle with attending to the epistemic aspects of modeling in science classrooms.

2.2. Engaging in Models for a Systems Thinking Approach to Climate Change

The climate crisis is one of the top concerns for today’s youth [48]. The youth are already experiencing the impacts of climate change in their daily lives and are exposed to conflicting claims about the causes and impacts of the changing climate [49]. While NGSS positioned science classrooms as a space where the youth can learn about climate change, such instruction is limited due to a lack of teacher education and knowledge regarding the complexity of the issue [21]. Understanding complex climate-related phenomena requires a systems thinking approach that attends to the interconnectedness of the ecological systems and living things [50]. While there is not a single definition of systems thinking, Senge [51] defines it as a “framework for seeing interrelationships rather than things, for seeing patterns of change rather than static ‘snapshots’” (p. 68). Adding on to this definition, Davidz and Nightingale [52] view systems thinking as an approach to analyze, interpret, and understand these interrelationships and patterns, rather than their pieces and parts [53]. By seeing the world as a whole, systems thinking provides a means to tackle the world’s most complex problems from interdisciplinary and multidisciplinary perspectives [54], and using a systems thinking approach to solve complex issues in today’s world requires multidisciplinary knowledge. For example, experts in economics, life sciences, bioengineering, sociology, and psychology work together to improve public health [55]. Similarly, many disciplines and stakeholders are involved in climate adaptation. While climate data collected by scientists over the years are critical in determining climate action, these data sets will only translate to meaningful adaptation plans when human and social systems are considered [56].
Due to the abstract nature of many system components and interrelationships, qualitative and quantitative modeling are both practices that can help scientists in making systems thinking visible [57]. While qualitative models may help learners grasp initial concepts [58] and explain system-wide phenomena [59], quantitative models can be used to focus on mathematical relationships that predict the behavior of the system [60]. The framework [8] and the NGSS [9] highlight the importance of studying systems and the modeling of these systems as some of the key crosscutting concepts for K-12 science education. The performance expectations of NGSS across K-12 grades draw attention to systems at different scales, e.g., from the circulatory system to the ecosystem, and highlight the importance of scaffolding students as they learn about these systems with their boundaries. The framework [8] suggests that students show their understanding of a system and raise questions about the system while engaging in the modeling practice. Further, “student-developed models may reveal problems or progress in their conceptions of the system, just as scientists’ models do” (p. 94). Drawing from the framework’s focus on systems modeling, NGSS highlighted some performance expectations that call for designing activities where models are used to explore and explain systems. These performance expectations were implemented across various disciplines of science, including the ones related to Earth Sciences. For example, middle school science (standard 2–6) expects students to engage in modeling to investigate the “unequal heating and rotation of the Earth” and its impacts on “patterns of atmospheric and oceanic circulation that determines regional climates”.
In our project, we focus on the world’s oceans as a system and develop materials to engage students in modeling an explanation for how ocean acidification (a result of increasing atmospheric CO2) will impact oyster larvae. One reason for this focus is the critical role of oceans and marine organisms at the global scale. The majority of the Earth’s surface is covered by oceans that are critical for all life, including humans. Although oceans act as carbon sinks by absorbing CO2, this additional CO2 in oceans increases acidification levels, which can threaten the lives of marine organisms. The increasing ocean acidification affects the growth of oysters, which may directly and/or indirectly impact the lives of many organisms by disturbing the food web [61]. Another reason for our focus on oceans and oysters considers the local scale. As shown in previous studies, locally relevant phenomena can lead to increased student interest while providing meaningful contexts for science learning [62]. The students who participated in this study are from a region that is in close proximity to the ocean and communities with strong ties to oysters (as a food source, and a means to reduce water pollution).

2.3. Research Questions

Using student-developed models as our primary data set, we aimed to examine epistemic discourses, i.e., how key ideas are represented with evidence, how the pieces of evidence are connected to build a coherent explanation, and how a systems thinking approach helps improve students’ explanatory models. Specifically, we asked the following research questions as part of our analysis of explanatory models developed during a classroom module on ocean acidification and oysters:
In what ways do students communicate key ideas, based on evidence, in their explanatory models?
How do students use evidence to support the building of conceptually coherent explanations?
What systems thinking ideas do students utilize to strengthen their explanatory models?

3. Design and Methods

3.1. Context of the Study

This study was part of a larger project funded by the National Science Foundation to support the integration of climate change into secondary science curricula. For this project, scientists, researchers, teacher educators, and teachers worked together to design a climate change module called Ocean Acidification and Oysters for use in secondary science classrooms. This module is designed for both middle (11–14 years of age) and high school classrooms (14–18 years of age). While the main investigations are the same, the high school version has expansions with additional videos and readings to align with the progression suggested in the standards. As part of the development process, researchers recruited 22 secondary science teachers from 7 school districts in a single state in the United States to engage in a professional learning experience that included piloting the module in their classrooms. The NGSS practice of ‘Developing and Using Models’, a focal point of the Ocean Acidification and Oysters module, is the focus of this study. In total, 12 of the 22 teachers who participated in the professional learning experience provided student artifacts for this study (2 of those teachers provided student artifacts from 2 different classes, for a total of 14 classes represented). Table 1 provides the demographics of the schools in which these classes were located. The teachers we recruited for the study vary in terms of their years of experience in teaching and integrating climate science into their curriculum (Table 2).
The science teachers who implemented the Ocean Acidification and Oysters module participated in a professional learning experience that included a full-day 8-h, in-person, pre-implementation workshop that introduced teachers to the lesson; there was also a half-day 4-h, in-person, post-implementation workshop. During the first in-person workshop, the teachers engaged in the Ocean Acidification and Oysters module as learners, learned to navigate the teacher guide, and participated in an interactive presentation with an ocean scientist. At the end of the first workshop, participants were provided with a kit that contained all the necessary materials (equipment, reagents, printed readings, and student graphic organizers) to implement the module in their classrooms. The support during the implementation period included emails or phone calls with the design team members, classroom visits, and a shared Google Drive of reliable scientific resources. During the post-implementation workshop, teachers reflected on their implementation, analyzed example student work on scientific modeling, and interacted with climate change education scholars.

3.2. Data Sources of the Study

In order to understand how students build a coherent explanation while engaged in the epistemic aspects of modeling practices, we utilized 150 explanatory models from 14 science classes of teachers who participated in the professional learning experience as our primary data source. To develop a framework for our analysis, we utilized complementary data sources of student artifacts (e.g., student argumentative writings, investigation protocols) as well as artifacts from the workshop (e.g., teacher implementation feedback forms, recordings of the teacher workshops). The Ocean Acidification and Oysters module was designed around a phenomena-based driving question of: How might increasing levels of CO2 affect Oysters? (which was further broken down into two more narrowly focused ‘investigative’ questions). The module is divided into four main activities (Figure 1), with students working in small groups to create and continually revise an explanatory model that answers the driving question. In the first introductory activity, ‘All about Oysters’, students access a variety of resources (readings, videos, discussions) to learn about oysters. Students learn how oysters reproduce, consider their role in the ocean ecosystem, and discover that they use carbonate and calcium ions to build their shells. They then create an initial explanatory model that incorporates any prior knowledge they may have on oysters as well as information learned during the activity. In the next activity, ‘Carbon Dioxide and pH’, students engage in the NGSS science practice of ‘Planning and Carrying out Investigations’ to answer the investigative question “What effect does increasing atmospheric CO2 have on ocean pH?”. Students learn that CO2 decreases the pH of oceans, resulting in a more acidic environment. Results from this activity are then incorporated into their explanatory models. In the third activity, named ‘Carbonate Challenge’, students explore carbonate chemistry to answer the investigative question “How does increasing the amount of CO2 in the ocean affect oyster larvae’s ability to build shells and survive?” Acting as larval oysters, students attempt to gather the chemicals (calcium and carbonate, represented by different colored plastic beads) needed to build shells in less vs. more acidified oceans and learn that carbonate ions are less available as ocean pH decreases. Students, again, return to their explanatory models, revising any existing information and adding what they just learned. In the final activity, ‘Putting it all Together’, students are engaged in sensemaking by accessing resources (readings, videos, discussions) to deepen their understanding of how ocean acidification impacts oysters. They then add to and revise their explanatory model a final time. Our study’s focus is limited to the final version of their explanatory models to be able to investigate epistemic and conceptual characteristics of the variety of explanatory models built by 150 models from 14 classes.

3.3. Data Analysis Approach

For the analysis of the 150 explanatory models, we used Dedoose, a qualitative analysis software that allows the coding of visual artifacts. First, we uploaded all models to Dedoose with the teachers’ pseudonyms and grade levels. Drawn from our sociocultural framework to meaning-making and engaging in epistemic aspects of scientific practices, we saw each explanatory model as a social space where students interact, using the semiotic resources of discourse (e.g., technical terms, visual representations) available to them to communicate their ideas. The focus on what and how semiotic resources are socially utilized in the culture of science classrooms is critical to understand the meaning-making process to construct a cohesive explanation [63,64,65].
To understand the students’ meaning-making process, we used a discourse analysis process of ‘zooming in’, i.e., we analyzed the model at the micro level to look at individual key ideas. We then utilized the discourse analysis process of ‘zooming out’, i.e., analyzed the explanatory model at the macro level to assess the cohesiveness of the explanation communicated in terms of the whole model. The first step was zooming in to highlight key ideas and label each key idea with a specific name, such as ‘CO2 Amounts’ or ‘Energy Expenditure in Shell Building. For each key idea, we also looked at the discourse modality (a parent code) of how it was presented in the model, such as ‘Written’, ‘Drawn’, or ‘Data Table’ (child codes). We then highlighted the semiotic resources typically used by scientists to code for scientific representations (a parent code) that included the use of arrows and circles for molecules. Finally, we zoomed in again to highlight and code semiotic resources that showed a systems thinking approach where students made a link between what is happening in the ocean system in relation to other systems (e.g., atmosphere) or living things (e.g., land plants).
Figure 2 provides a visual example of the coding scheme iteratively developed using Dedoose software. Figure 2, on the left side, shows the original image of an explanatory model uploaded to Dedoose. Figure 2, on the right side, shows the same image with codes applied. When an area is selected and a code is applied, Dedoose creates a light blue box. We have added gray boxes to the image from Dedoose in three areas to illustrate the codes that were applied in each instance. The upper gray box shows that the code for the key idea ‘pH and Acidification’ was applied to this part of the image, in addition to the modality code ‘Written and Data Table’. The middle gray box indicates an area we coded as showing a systems thinking approach, where students linked what is happening in the ocean system to the atmospheric system by drawing land plants. The lower gray box shows an example of an area that was coded for scientific representations, specifically a chemical reaction formula. Once we completed our micro-level analysis, we ‘zoomed out’ to the macro level and assessed how well the model shows connections built across key ideas (cohesiveness) to provide an explanation for the driving question of the module (e.g., extensively cohesive, partially cohesive, etc.).
Our initial coding framework was deductively derived from the instructional materials developed for the module (e.g., energy expenditure); the underlying ideas of the framework [8] and NGSS [9], such as systems thinking; and studies on learning and teaching about scientific models and modeling (e.g., scientific representations). Next, we utilized a constant comparative approach to iteratively revise our codes [66]. Each explanatory model was coded by one primary and two secondary coders. Each researcher was assigned to ~50 models as a primary and another ~50 as a secondary coder. The primary coder took the first turn and completed the coding of the one explanatory model in detail. The secondary coder then reviewed and coded the same model and created memos if there were disagreements or questions about the primary coder’s decisions. Hence, each model was coded twice. After each model was coded twice, we calculated the inter-reliability by using the percent agreement (PA) formula: PA = NA/(NA + ND) × 100 [67], where NA is the total of agreements and ND is the total of disagreements between the two coders. The PA value ranged from 80.3% to 94.7% for the 150 explanatory models. All disagreements raised between the primary and secondary coders were discussed at the weekly research meetings with a third researcher until 100% agreement was reached for all codes.

4. Findings

We organize the findings into three subsections, each of which responds to a specific research question. In the first section, we respond to our research question on the ways key ideas are communicated in explanatory models. We explain the primary activities that are a source for the key ideas and present how often each key idea was communicated. We further provide information on the discourse modalities and scientific representations used to present the key ideas. The second section responds to research question two on the coherence of the explanations constructed in the explanatory models. In this section, we provide examples of the levels of cohesiveness determined through qualitative analyses of the student models. Finally, our third section responds to the research question on systems thinking approaches students utilized to explain the impact of ocean acidification beyond oceans and oysters.

4.1. Models as Epistemic Tools for Communicating Key Ideas Based on Evidence

Our coding across all explanatory models, which resulted from the Ocean Acidification and Oysters module, helped us identify which key scientific ideas were communicated by the students in the models and how often these ideas were included in the models. Under the parent code, ‘key ideas based on Evidence’, we identified eight key ideas (child codes) (see Table 3) based on the four module activities (see Figure 1 for the explanation of four activities). These key ideas were derived from specific ideas covered in the module, such as ‘CO2 Amounts’ and ‘Chemistry of Shell Building’. A total of 1924 instances representing the eight key ideas were found. If a key idea appeared multiple times in a model, each instance was coded separately. For example, we coded the ‘pH and Acidification’ key idea twice when students included: (1) a data table from their pH and Acidification investigation that showed a decrease in pH levels when students added more CO2 to their liquids and (2) drawings of different numbers of pH symbols on each side of the model. Table 3 presents frequencies for each key idea to demonstrate how often each key idea was attended to across models from a variety of classroom settings. Furthermore, we counted the occurrences/frequencies of each modality (e.g., ‘Drawn’, ‘Written’) that students used to communicate the key idea (Table 3). Since students were given the flexibility to choose how to include their ideas, a variety of modalities were present. The majority, however, were ‘Just Written’, ‘Just Drawn’, or ‘Written and Drawn’. Rarely, students decided to use data from the ‘Carbon Dioxide and pH’ and ‘Carbonate Challenge’ activities in the modality of ‘Data Table’, ‘Written and Data Table’, or ‘Drawn, Written and Data Table’. Below we provide descriptions of how the students communicated these key ideas in their explanatory models.
We present our findings by explaining each of the key ideas as a subsection of the related activity that served as a primary source of learning about Ocean Acidification and Oysters in their classrooms. We organized the results by activities designed as the primary source of evidence for the key ideas under each section. However, we acknowledge the possibility that students did not necessarily learn these key ideas in a linear fashion. Moreover, while all eight key ideas were intended to be addressed in at least one of the four activities, students may also be bringing these ideas from other sources (e.g., pre-existing knowledge, external media, or teachers may have chosen to use them during the lesson).

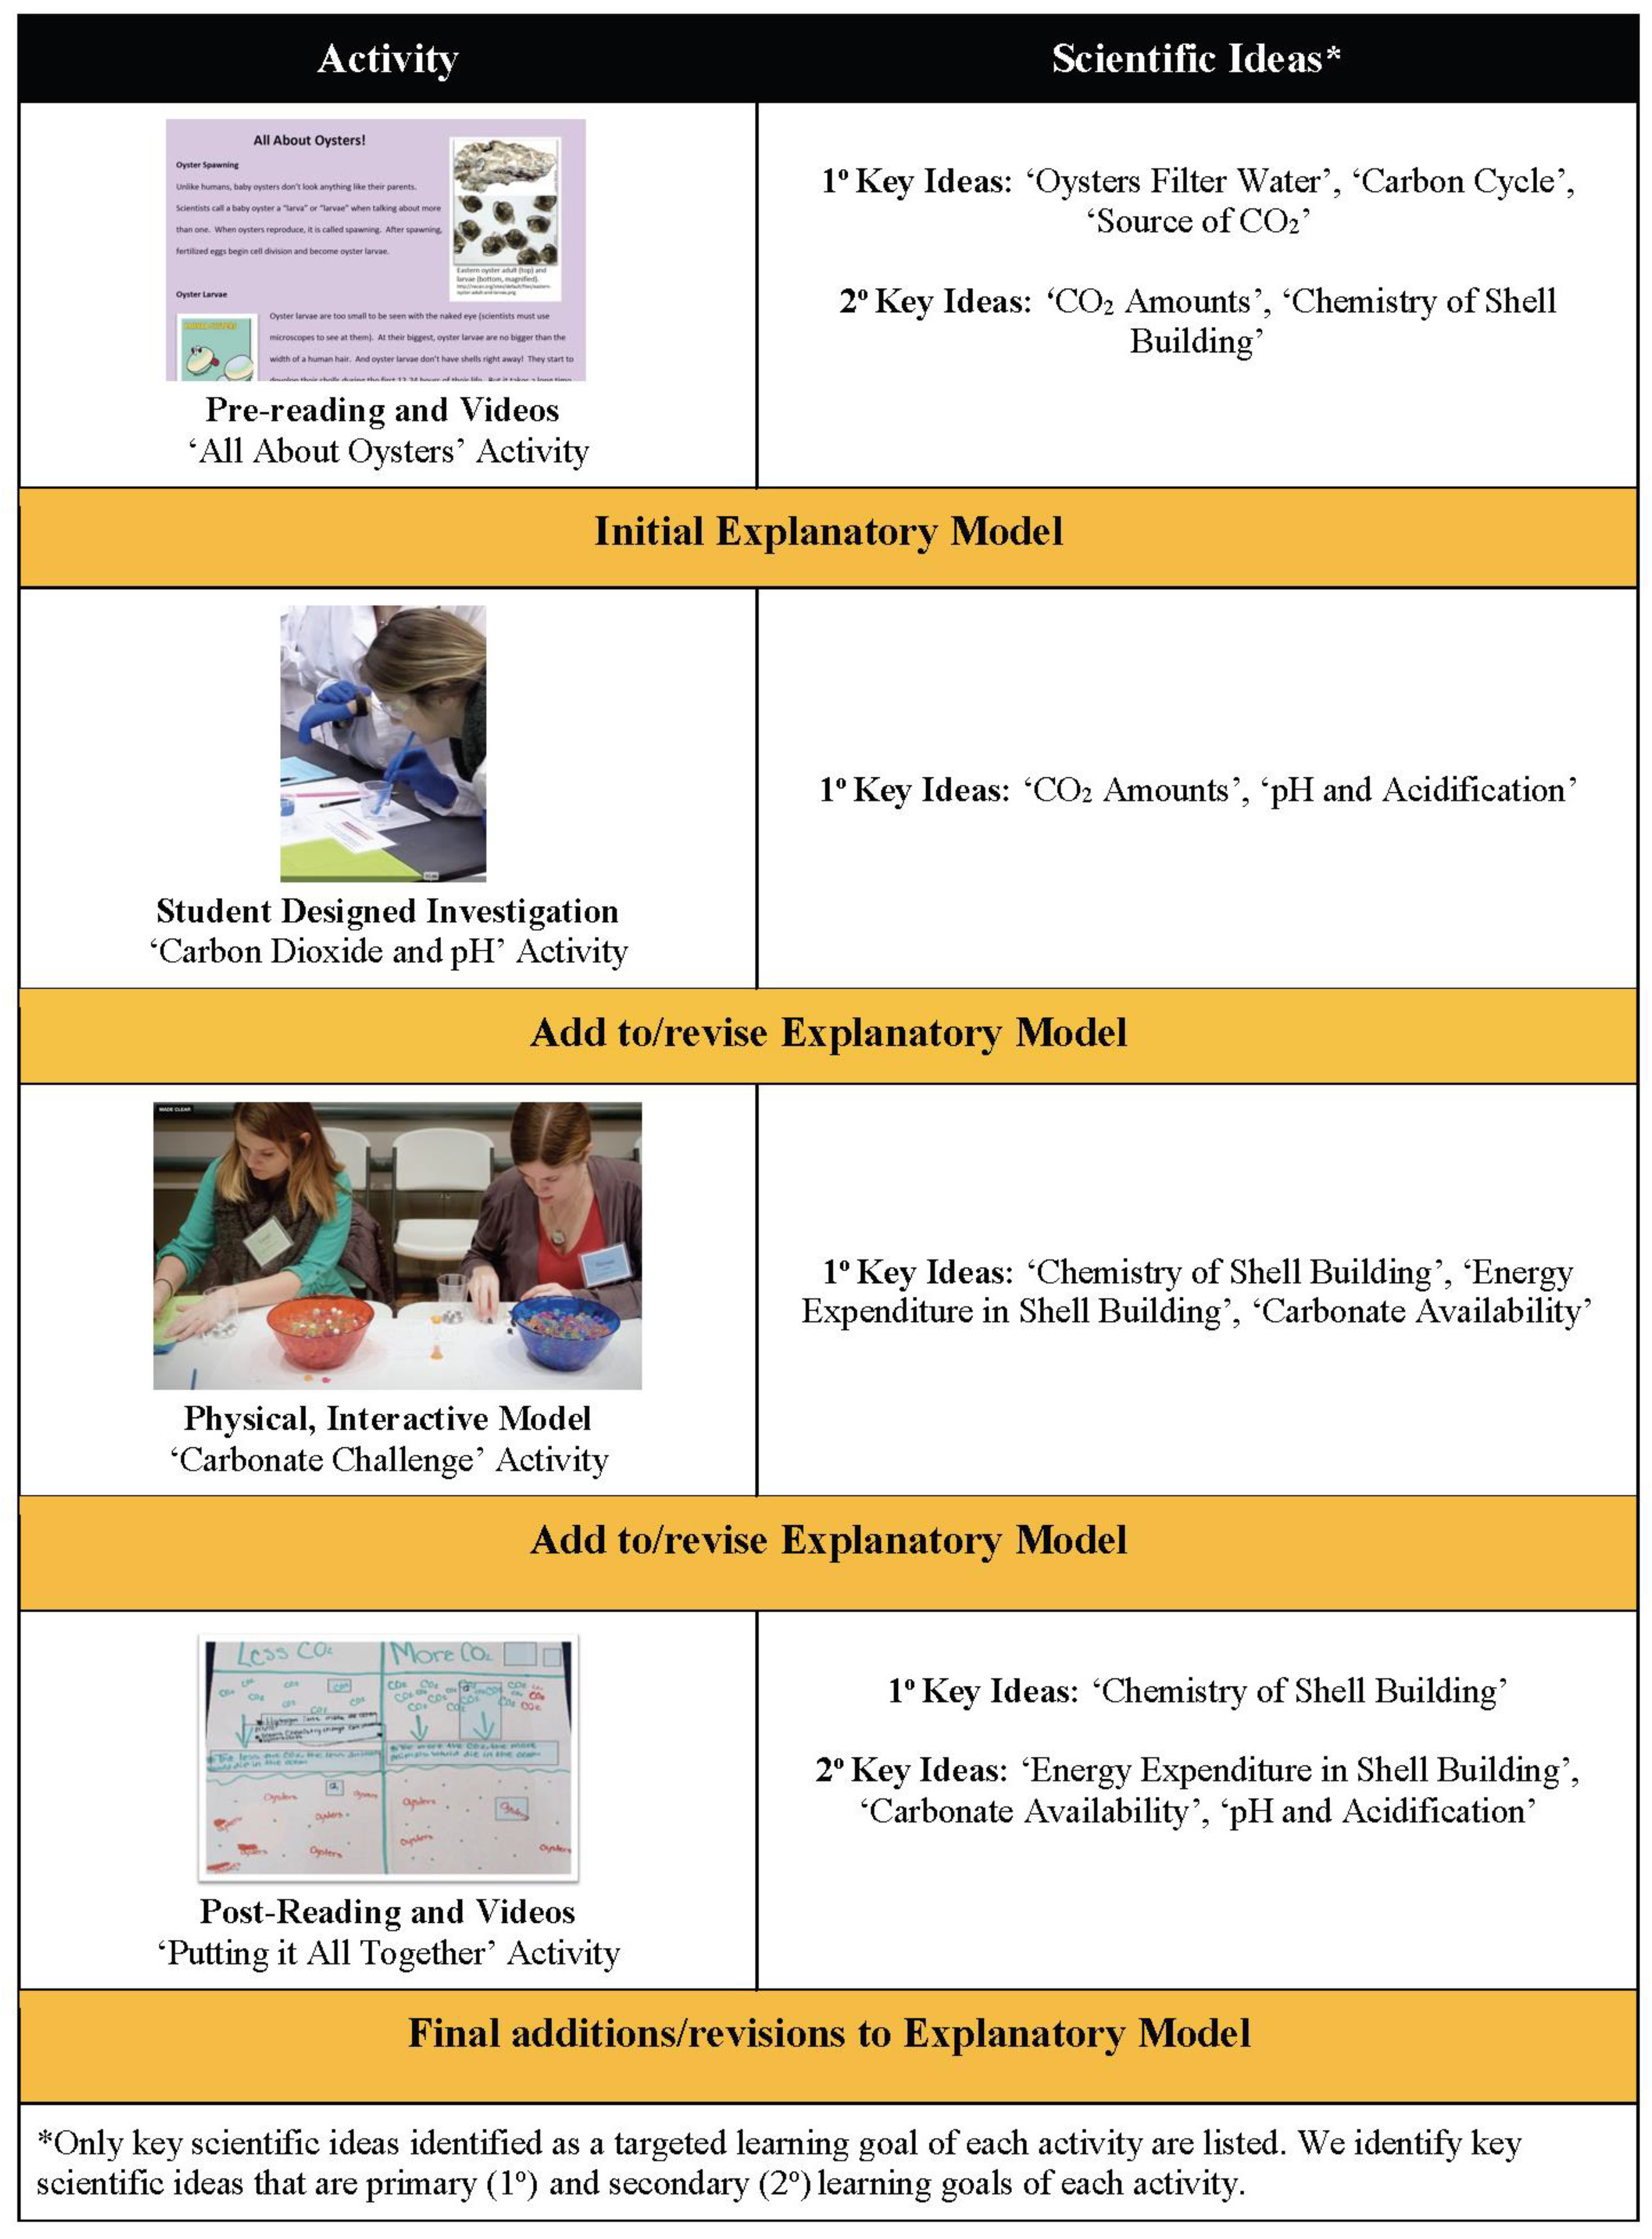
4.1.1. Student Designed Investigation on Change in CO2 Amounts and pH Levels

For this activity, students were provided with beakers, straws, saltwater, and pH test strips and challenged to plan and carry out an investigation to explore the effect of CO2 on the pH levels of saltwater. This activity was intended to highlight the following key ideas: ‘CO2 Amounts’ and ‘pH and Acidification’. Below are the explanations of the frequencies of these two main key ideas and the modalities that students used in their models while doing this activity.
CO2 Amounts: Our analysis (in Table 3) showed that 87% (131/150) of the explanatory models included reference to the key idea of ‘CO2 Amounts’. Across all models, we coded a total of 458 occurrences of the key idea of ‘CO2 Amounts’. Half (229/458) of the representations were made using the modality ‘Written’ (e.g., the phrases “more CO2” and/or “less CO2” were written on the explanatory model). Approximately a quarter (24%) of the occurrences were made using the modality ‘Drawn’. For example, students drew circles or dots to represent amounts of CO2. Another quarter of the representations were a combination of ‘Drawn and Written’ (e.g., drawing circles that represented amounts of CO2 and writing a sentence that explained the amount of CO2).
pH and Acidification: Differing pH and acidification levels in less acidic vs. more acidic oceans was a key idea students included in 78% (117/150) of the models based on their observations during the ‘Carbon Dioxide and pH’ activity (Table 3). Counting all occurrences across models, this idea appeared 341 times in all student models. While 64% (217/341) of the instances showed this idea in the modality of ‘Written’, 23% (77/341) of the instances showed this idea by the combination of the modalities ‘Written and Drawn’, 9% of the instances showed the use of the ‘Drawn’ modality by drawing H+ molecules and abbreviations of pH, and 3% used the ‘Data Table’ modality. There was only one occurrence (0.3 %) of the combined ‘Drawn, Written, and Data Table” modality for this key idea.

4.1.2. Physical Interactive Model on Carbonate Challenge Activity

For this activity, students were given two large plastic bowls. One represented a less acidic (i.e., healthy) ocean and the other represented a more acidic (i.e., unhealthy) ocean. Both bowls were filled with soft, absorbent polymer beads (hydrated with water) of various colors that represented the ocean, white plastic snap beads that represented calcium ions, and black plastic snap beads that represented carbonate ions. The unhealthy ocean included fewer black snap beads to represent the unavailability of carbonate ions in more acidic oceans. In pairs, students were challenged to ‘build’ as many calcium carbonate molecules as they could in at least two 30 s rounds (by snapping together a single white plastic bead and a single black plastic bead) for each ocean type (healthy versus unhealthy). During the activity, students collected data on how many calcium carbonate molecules they ‘built’ in the healthy and unhealthy oceans for each round. This activity was designed to demonstrate what happens when ‘Carbon Availability’ differs and its effects on ‘Energy Expenditure in Shell Building’. Moreover, the activity was designed to illustrate the basic chemistry of calcium carbonate bonding during the building of oyster shells. Below are the explanations of frequencies of the main key ideas and modalities that students used in their models after doing this activity.
Carbonate Availability: Carbonate ions are critical in oysters’ shell-building activity. Around half of the student models (56%) communicated the key idea of ‘Carbonate Availability’ (Table 3). These models typically included more carbonate ions in the healthy oceans. On the contrary, the unhealthy oceans were depicted as having fewer carbonate ions, some of which were attached to hydrogen ions and not available to the oyster larvae. This code appeared 180 times across all models. In the majority of these occurrences, students used the modality of ‘Written’ to convey the availability of carbonate ions to oyster larvae in healthy and unhealthy oceans (47%). More than a quarter (29%) of the instances used the modality of ‘Drawn’ and 19% of instances were a combined modality of ‘Drawn and Written’ to illustrate the availability of carbonate ions. Rarely, students included a ‘Data Table’ (0.6%), a combination of ‘Drawn, Written and Data Table” (1.67%), and a combination of ‘Written and Data Table’ (2.78%).
Energy Expenditure in Shell Building: Oyster larvae need calcium carbonate to build healthy shells. Lack of access to these nutrients can lead to weakened shells that negatively affect the growth of oysters. This key idea was included in 95% (145/150) of the explanatory models, making it the most highlighted key idea in the explanatory models (Table 3). This key idea appeared 453 times across all models and was mostly presented using the ‘Written’ modality (42%). An example of this modality is “If oyster or oyster larvae can’t build shells, they will die or they will look messed up”. More than a quarter (28%) of these instances were categorized as ‘Drawn’. For example, students drew happy or sad shells, strong shells, weak or cracked shells, or used a combination of modalities of ‘Drawn and Written’ (32%) to convey how hard or easy it is to build shells. We noticed one occurrence where students used the modality of ‘Data Table’ and one occurrence where they used the combined modality of ‘Data Table and Written’ to convey this key idea.
Chemistry of Shell Building: Around half (47%) of the explanatory models showed calcium or carbonate, or both (calcium carbonate) and linked the appearance of the ions to oyster/oyster larvae development (Table 3). Only 12% of these models also included the complete chemical reaction of ocean acidification. The ‘Chemistry of Shell Building’ key idea was coded 139 (91%) times. Around half (53%) of the codes were presented using the modality of ‘Drawn’ and 36% were a combined modality of ‘Written and Drawn’. Some codes (8%) were categorized as ‘Drawn’. In rare instances, students integrated data they collected during the ‘Carbonate Challenge’ (e.g., a count of black and white beads snapped together to represent calcium carbonate molecules they ‘built’). There was one instance of this using the modality of ‘Data Table’, and another single instance using a combination of ‘Data Table, Written and Drawn’. Finally, there were three instances where this was shown using the combination of modalities ‘Data Table and Written’.

4.1.3. All about Oysters and Putting It All Together Activities

These opening and ending activities included reading and video resources. Readings and video sources were prepared and adapted in collaboration with scientists and teachers and were used to introduce the driving question “How might increasing levels of CO2 affect Oysters?”; attending to the students’ prior knowledge and questions was important. Readings during the initial ‘All about Oysters’ activity were th major source of the key ideas ‘Sources of CO2’, ‘Carbon Cycle’, and ‘Oysters Filter Water’. These key ideas are discussed below. Readings in the final ‘Putting it all Together’ activity were also a major source for advanced chemical formulas for ocean acidification (which we discussed in Section 4.1.2). Finally, the readings in both of these activities had the role of enhancing the learning of key ideas as a complimentary resource.
Sources of CO2: We applied this code when students made a clear connection between burning fossil fuels and increased CO2. Almost half (49%) of the explanatory models addressed the key idea of ‘Sources of CO2’, with 145 instances that made references to this key idea (Table 3). Around half (47%) of these instances were in the modality of ‘Drawn’, 23% of these instances were ‘Written’, and 30% were in combinations of ‘Written and Drawing’. To communicate this idea, students often drew and/or wrote cars, factories, and smokestacks next to each other as sources of CO2.
Carbon Cycle: This key idea attended to how the change in atmospheric CO2 leads to changes in CO2 levels in the ocean. Less than half (43%) of the explanatory models communicated this key idea (Table 3). Across all models, we saw 123 instances attending to the ‘Carbon Cycle’ as a key idea. Around a quarter (26%) of these instances were in the modality of ‘Drawn’, 41% of these instances were ‘Written’, and 33% were combinations of ‘Written and Drawn’.
Oysters Filter Water: Instances that were categorized under this key idea provided evidence about oysters’ role in ecosystems. Only 27% of the explanatory models attended to this key idea (Table 3). There were a total of 78 occurrences of the code ‘Oysters Filter Water’. Of these instances, 67% were in the modality ‘Written’, 30% were in combinations of ‘Written and Drawn’, and 3% were ‘Drawn’. Students often communicated this idea to show how larger oyster populations lead to healthy, clean water while smaller oyster populations lead to unhealthy, dirty water.

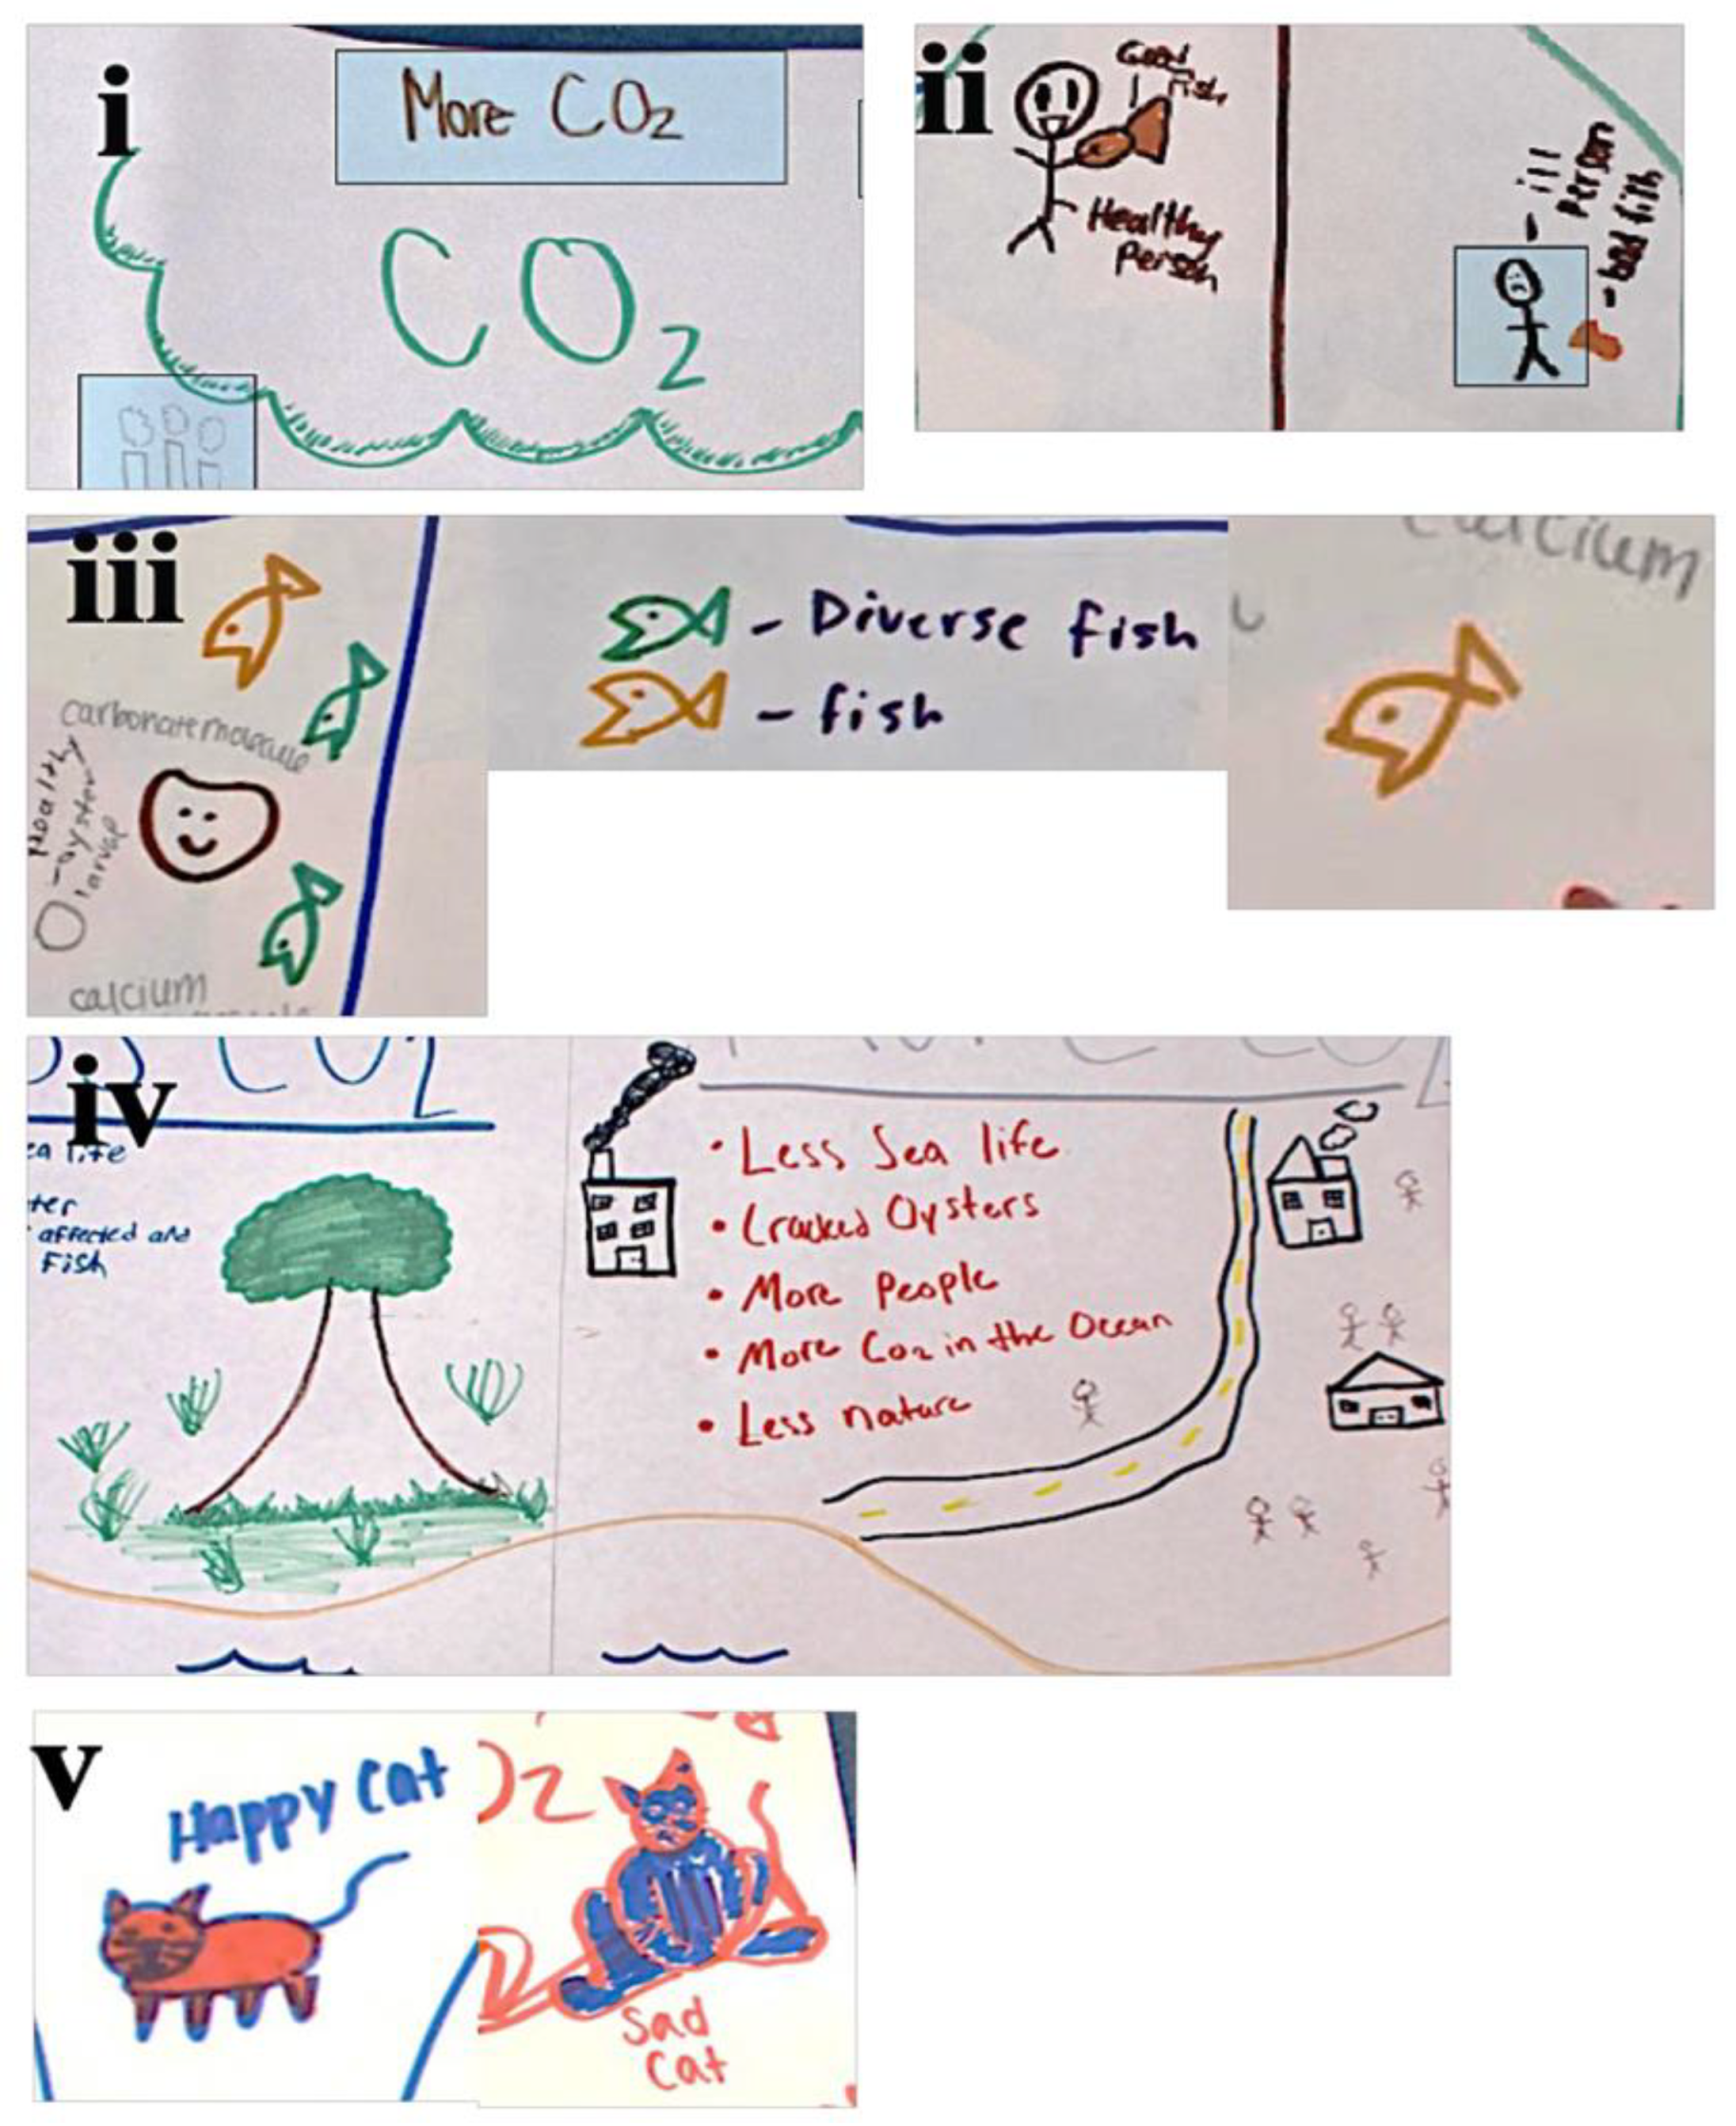
4.1.4. Scientific Representations Used in Students’ Explanatory Models

In addition to looking at the modality of key ideas in the explanatory models, we looked at what known scientific representations students decided to utilize in communicating the key ideas (Table 4). In this study, we use the term ‘scientific representations’ for semiotic tools (e.g., language tools, visuals) that have been traditionally used only in scientific or academic publications. We see explanatory models as semiotic social spaces that are affected by culture. As a result, we wanted to examine students’ use of semiotic resources connected to the culture of science. The ‘Molecular Formula’ (201, 34%) or ‘Written Molecule/Element Names’ (195, 33%) were the two most utilized scientific representations in the models. Although rarer, students also utilized ‘Circles’ (45, 8%) or ‘Dots’ (5, 1%) as representations of molecules or elements. Some models included ‘Chemical Reaction Formulas’ (37, 6%), mostly to explain the acidification process. In addition, similar to many scientific models, students used ‘Arrows for Processes and Relationships’ to illustrate the process of how oyster larvae build shells or to show how key ideas relate to other key ideas (70, 12%). We also noticed that some students included a ‘Key or Label’ for the visuals used in their models (39, 7%).
We reviewed each explanatory model as a whole with respect to how well it provided a coherent and gapless explanation for our driving question, “How might increasing levels of CO2 affect Oysters?” In addition, our identification of cohesiveness included looking at responses to the modules’ two investigative questions: “What effect does increasing atmospheric CO2 have on ocean pH?” and “How does increasing the amount of CO2 in the ocean affect an oyster larvae’s ability to build shells and survive?” Our final coding organized the models into four categories of explanation with respect to cohesiveness, namely: extensive, sufficient, partial, and insufficient. Among the 150 explanatory models, we found that almost half (47%) insufficiently communicated an explanation of how ocean acidification changes with changing CO2 levels in the atmosphere and how changes in acidification impact oyster larvae. The number of models with moderate and sufficient explanations was almost evenly distributed (23% and 20%, respectively). Only 9% of the models are grouped under the extensive explanations category. In the following subsections, we explain the criteria for each of the four cohesiveness categories and utilize an example model for each category to illustrate how we assigned cohesiveness codes to models. We have labeled each of the example models below (Figure 3, Figure 4, Figure 5 and Figure 6) with a combination of Arabic numerals and letters (e.g., 1b, 10a) to guide the reader through a sequence (numbers) of key ideas (letters) identified in the model that answer the module’s driving question. Key ideas presented in the model include: a = ‘CO2 Amounts’, b = ‘Source of CO2′ c = ‘Carbon Cycle’, d = ‘pH and Acidification’, e = ‘Energy Expenditure in Shell Building’, f = ‘Oysters Filter Water’, g = ‘Carbonate Availability’, and h = ‘Chemistry of Shell Building’.

4.2. Levels of Cohesiveness in Explanatory Models

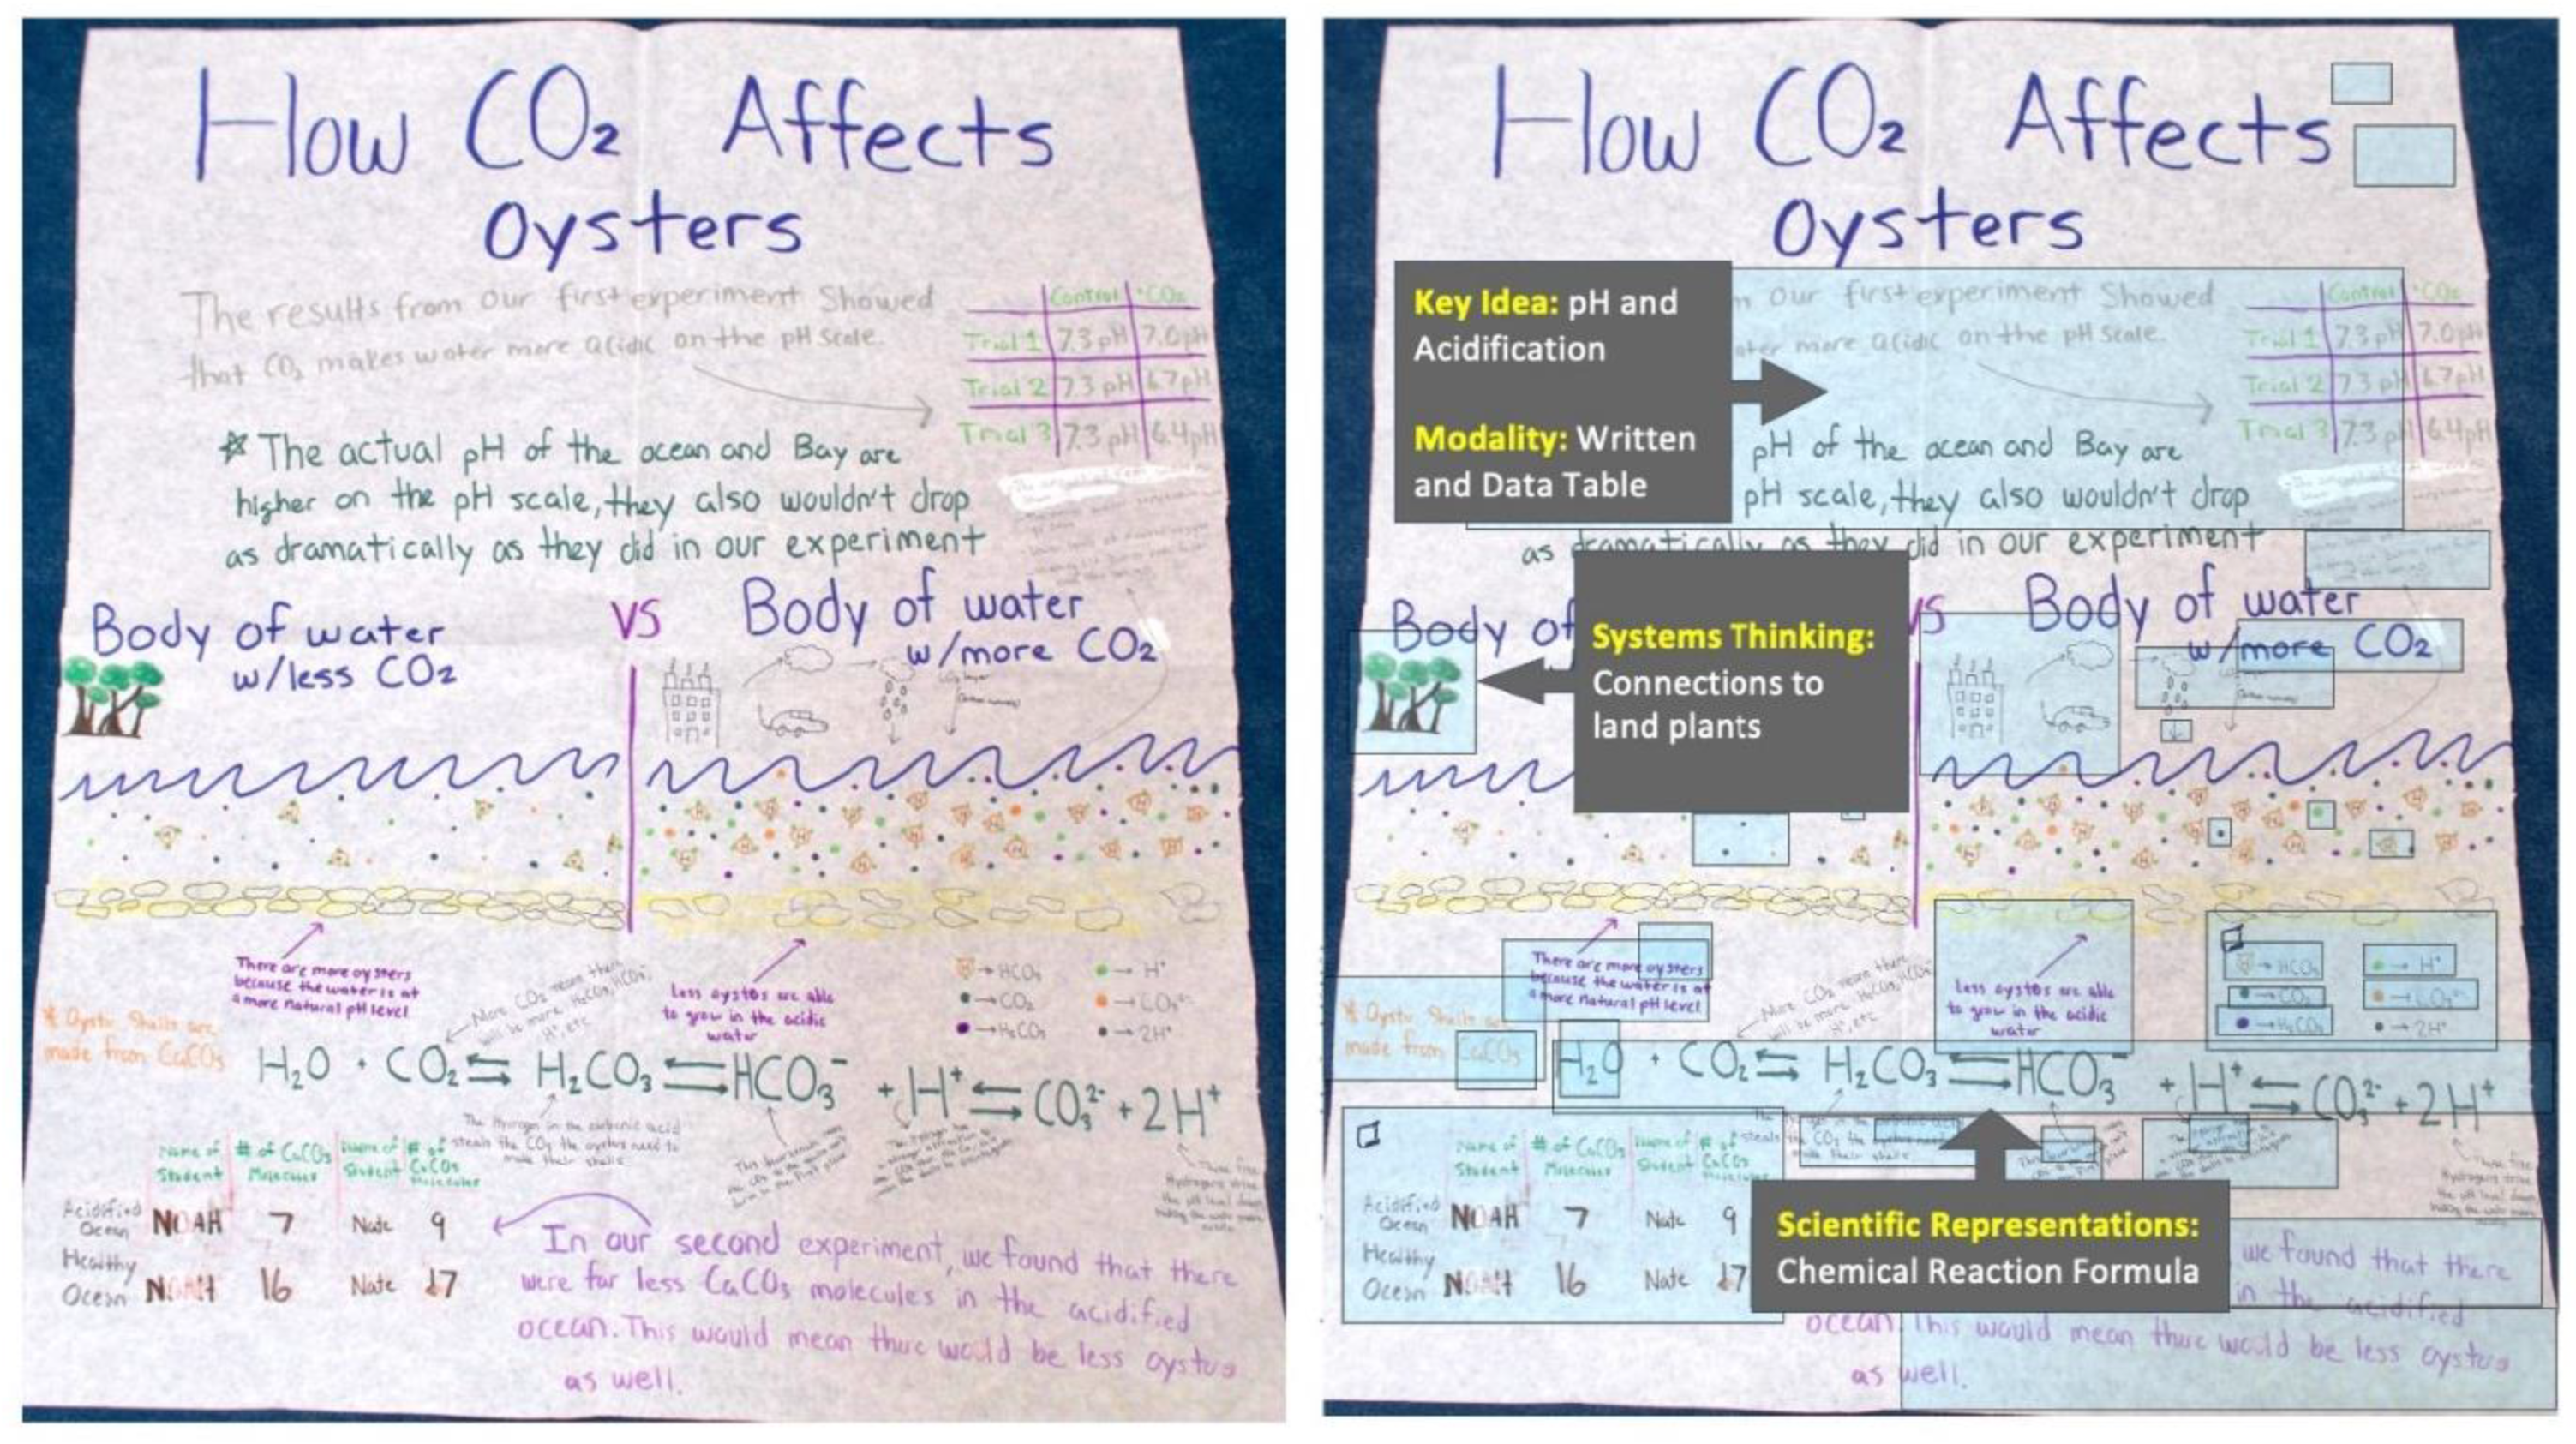
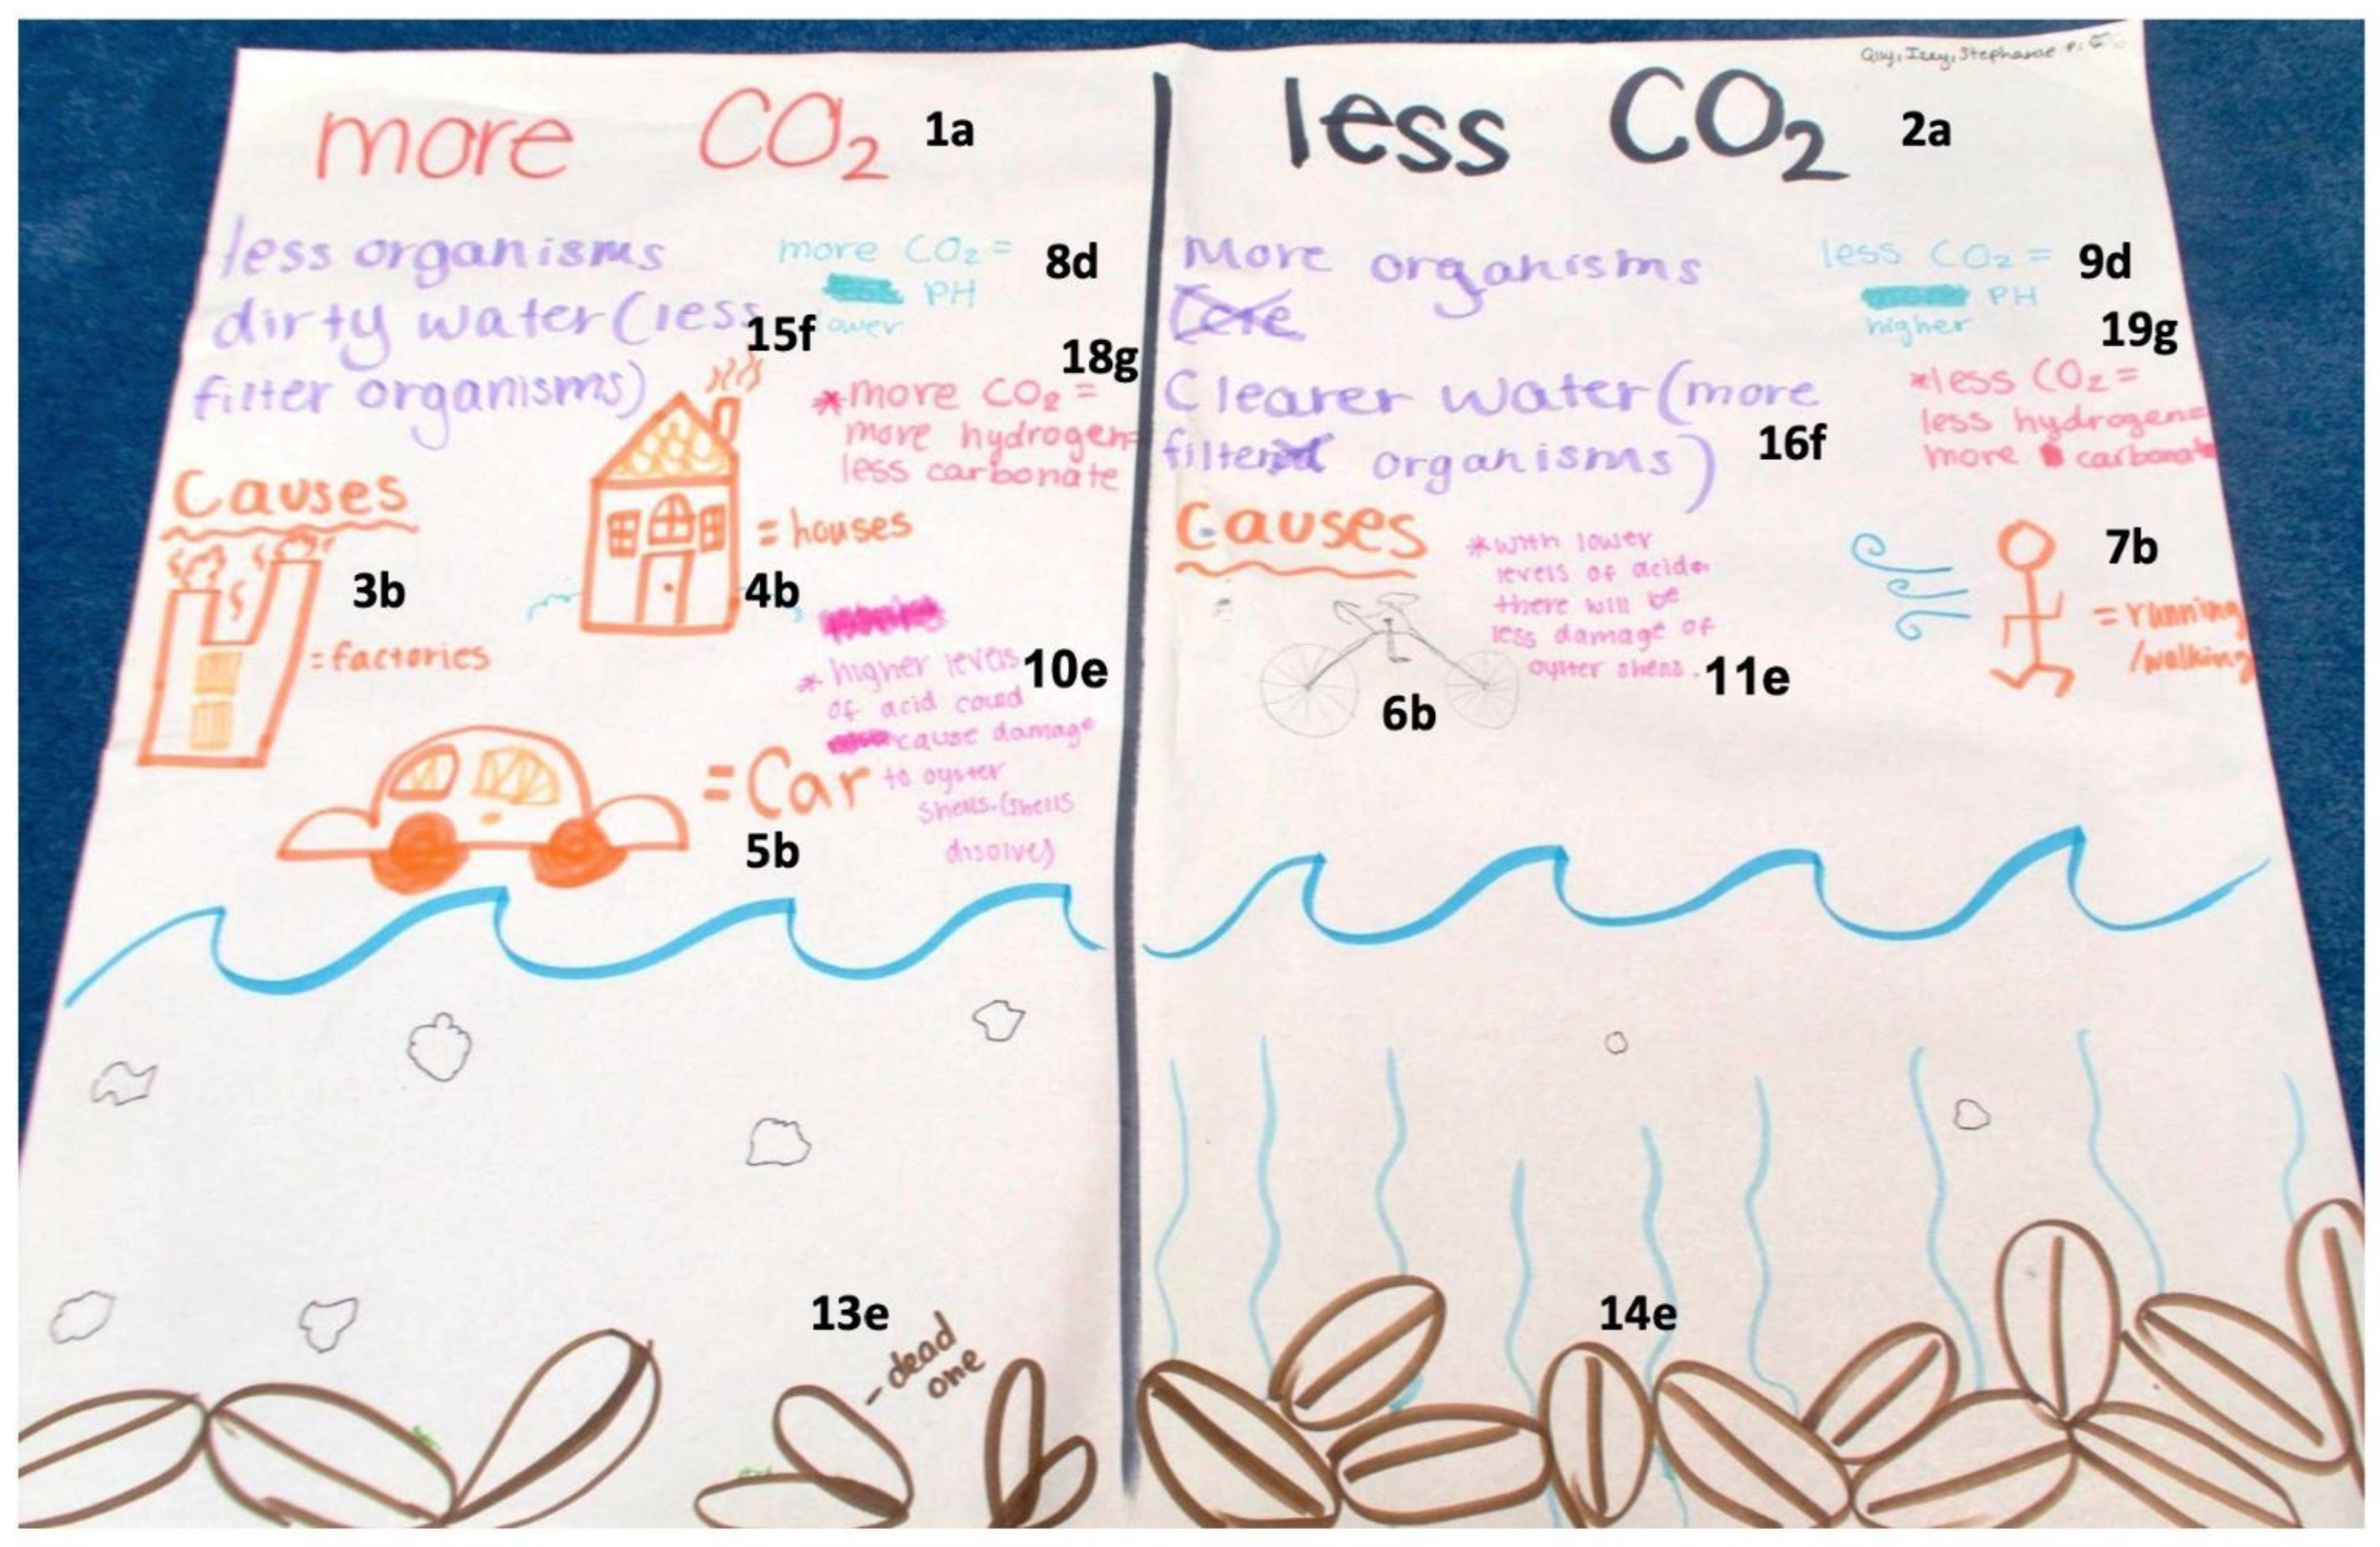
4.2.1. Explanatory Models with Extensive Explanation

Models in the ‘Extensive’ category communicated accurately, and with enough detail, the phenomena in response to the driving question. To communicate a coherent, cohesive, sequential, and gapless explanation, the models included evidence from activities to support almost all key ideas and showed clear connections among these key ideas. The explanatory model in Figure 3 provides an example of an extensively coherent model which responds to the module’s driving question and its two investigative questions. The model in Figure 3 achieves this by not only attending to all key ideas (a→h), but also communicating the ideas in a coherent manner (1→19), using various semiotic tools (e.g., ‘Arrows for Processes and Relationships’), discursive strategies (e.g., sequencing ideas in a meaningful pattern), and multimodal representations (e.g., both ‘Written and Data Table’ use).
Figure 3 depicts two contrasting scenarios: the left side depicts a scenario with less CO2 in the atmosphere and ocean while the right side depicts an atmosphere with more CO2 present. Both sides are framed with a title attending to the key idea ‘CO2 Amounts’ and express how it differs (less versus more) on each side (1a and 2a). On the right side (“Atmosphere with More CO2”), the students represented the key idea ‘Source of CO2′ by drawing a factory emitting CO2 as a gray cloud (3b). The key idea ‘Carbon Cycle’ is depicted by an arrow showing the process of the CO2 in the gray cloud moving into the oceans (4c). On the side depicting an atmosphere with less CO2 (left side), the students attended to the key idea ‘Carbon Cycle’ by writing about the process of photosynthesis (5c). They indicated that increased amounts of CO2 lead to a more acidic environment in the atmosphere (right side, 6d, 7d) while the atmosphere with less CO2 (left side) lead to a “more neutral pH” (8d). The students used several modalities to express their ideas throughout their model development. For example, when addressing the key idea of ‘pH and Acidification’ the students used the modality of providing ‘Data’ (6d, 9d) which they collected during the module’s activities, as well as the modality of ‘Written’ (7d, 8d). The students addressed the key idea of ‘Energy Expenditure in Shell Building’ by providing both ‘Written’ explanations (10e, 11e, 12e) and ‘Drawings’ (13e, 14e). They used two modalities (‘Written and Data’; 18h) to connect the key ideas of ‘Energy Expenditure in Shell Building’ and ‘pH and Acidification’. The students attended to the key idea of ‘Oysters Filter Water’ by writing “less water filtration” (15f). The key idea of ‘Carbonate Availability’ was addressed by drawing fewer hydrogen and bicarbonate ions on the side depicting the atmosphere with less CO2 (left side, 16g) versus drawing more ions on the side of the model depicting an atmosphere with more CO2 (right side, 17g). Finally, the students explained the idea of the ‘Chemistry of Shell Building’ using the ‘Written’ modality (18h) and using a ‘Chemical Reaction Formula’ (19h).

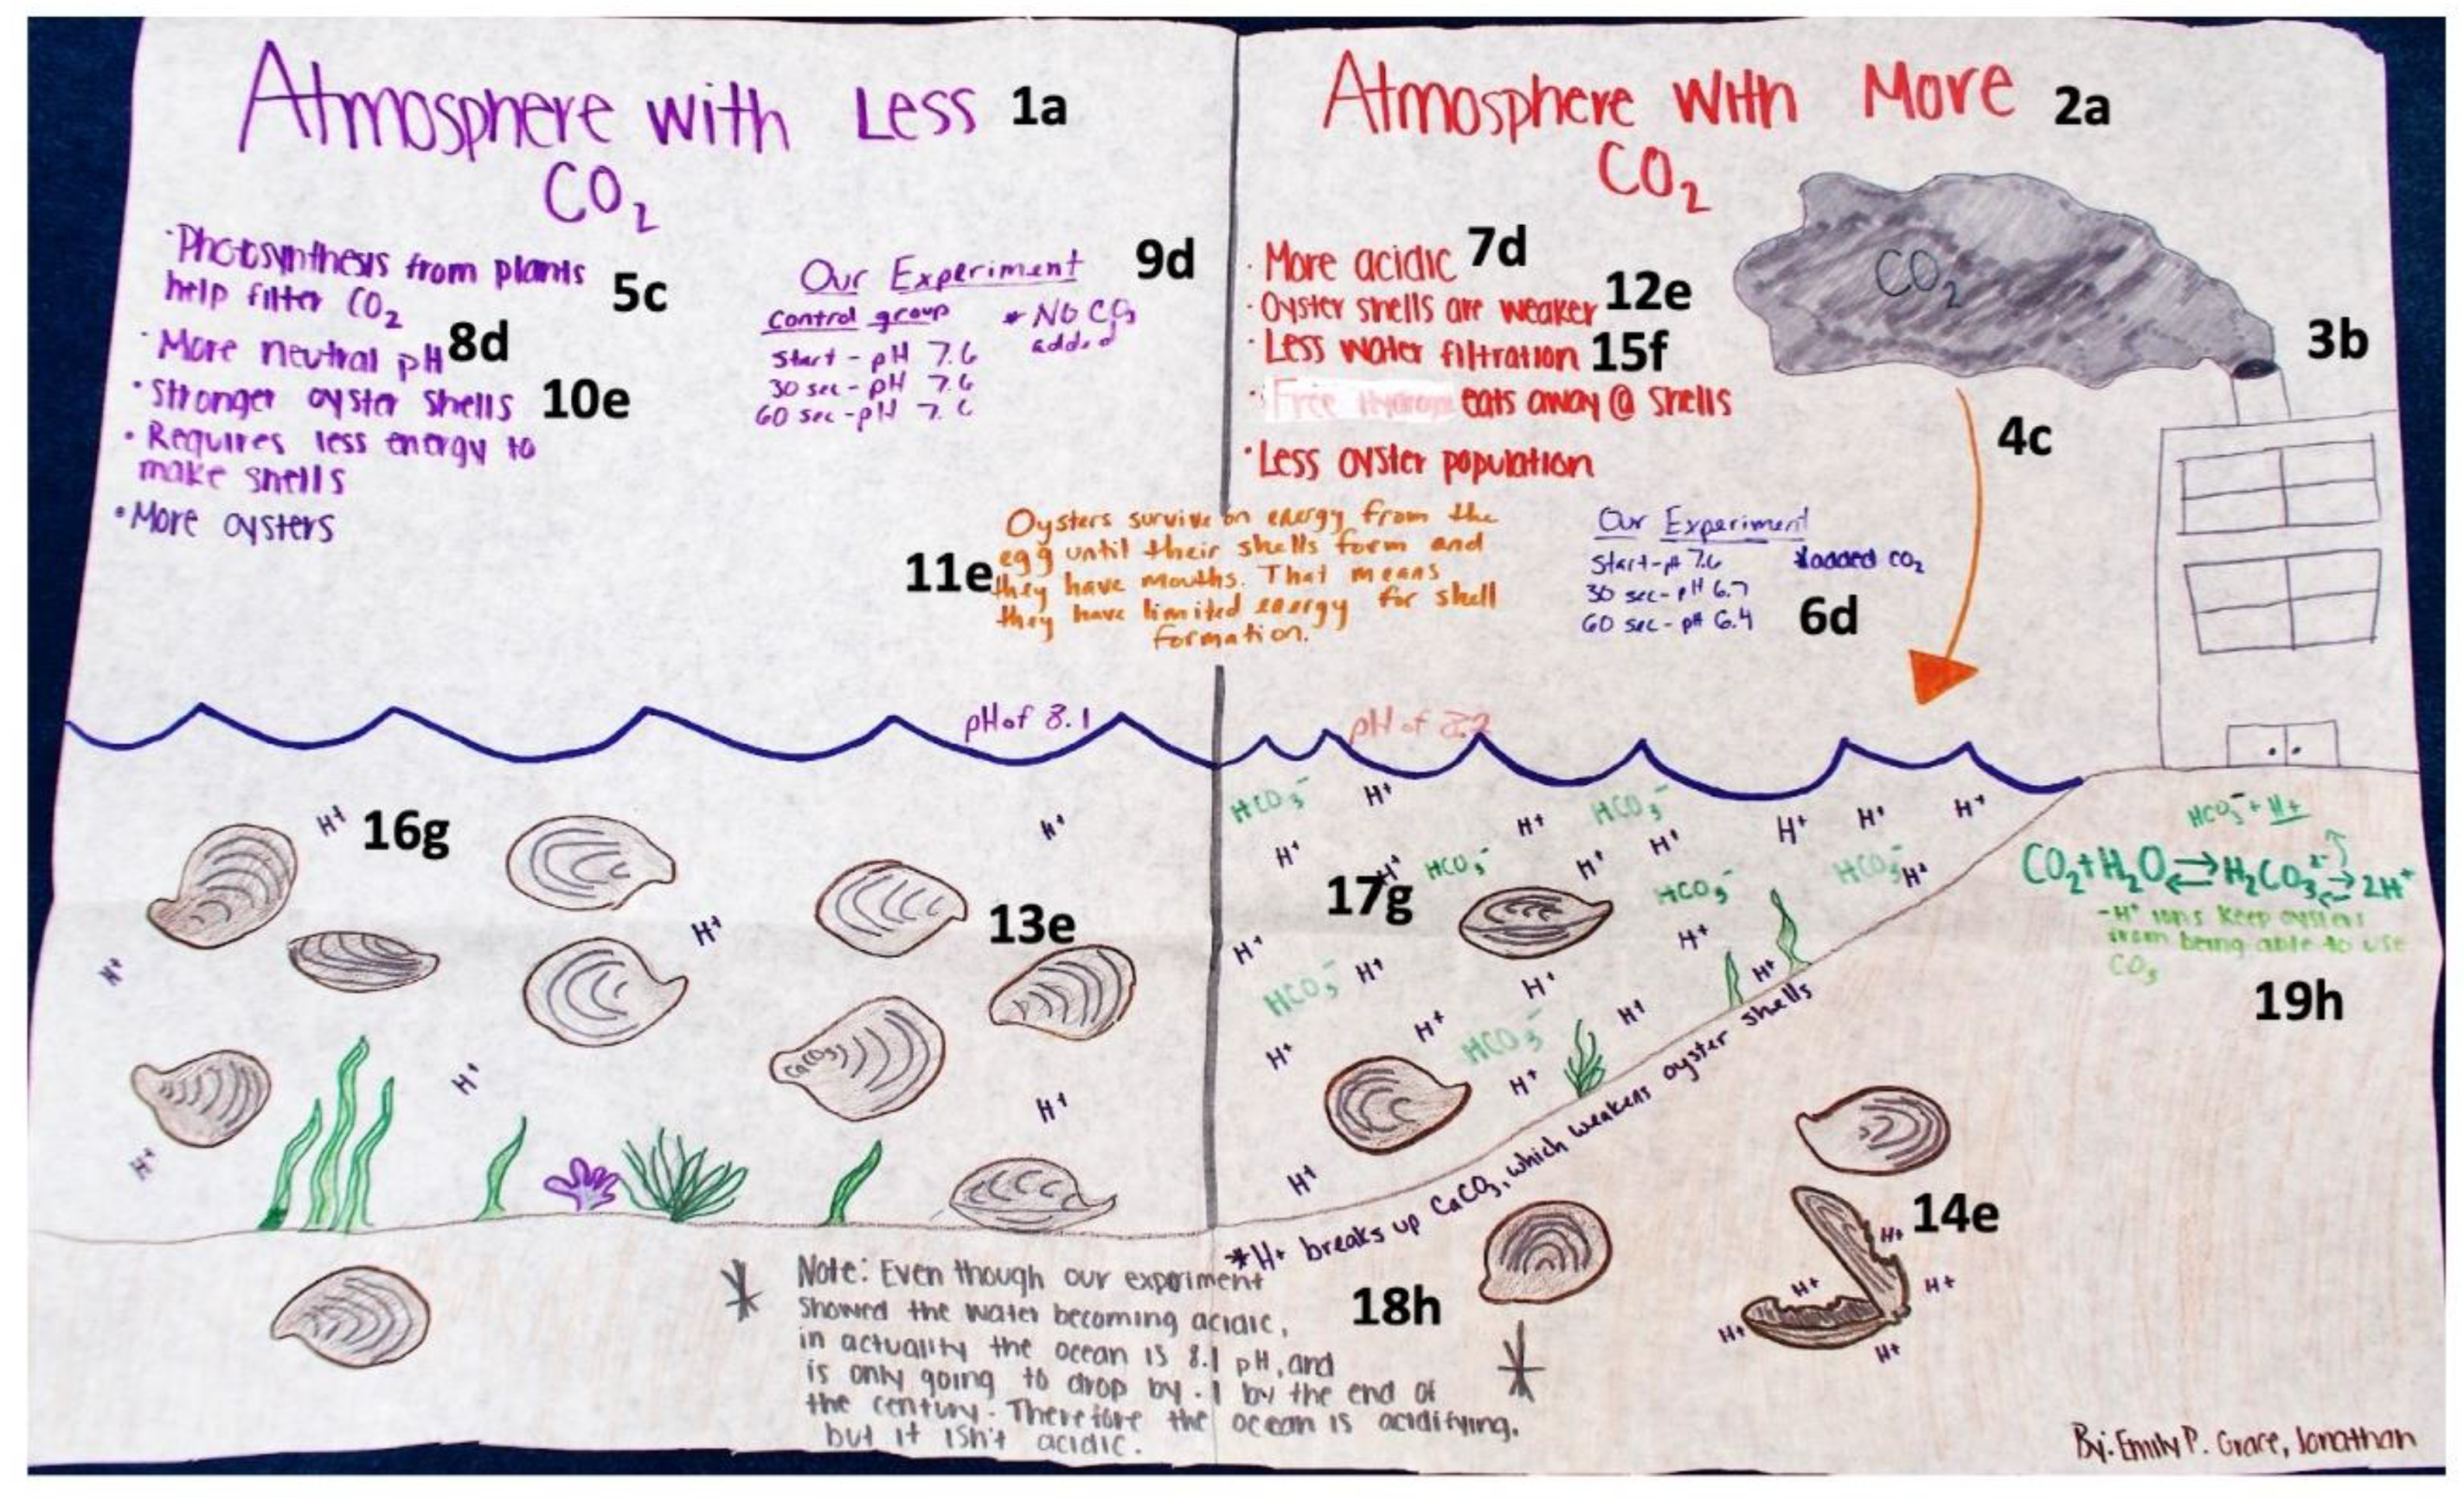
4.2.2. Models with Sufficient Explanation

We labeled the next level of cohesiveness as ‘Sufficient’. Similar to the ‘Extensive’ category, models categorized as ‘Sufficient’ included mostly-complete explanations of the driving question. However, unlike the ‘Extensive’ categories, these models lacked and/or misrepresented more than one key idea. They also tended to include fewer pieces of evidence from the module’s activities.
Figure 4 represents a student model with a ‘Sufficient’ explanation. While the students did not attend to the key ideas of the ‘Sources of CO2’ and ‘Oysters Filter Water’, their model responded to the two investigative questions. In response to the first question, the model explains how the amount of CO2 leads to increased acidity with hydrogen ions. In response to the second investigative question, the students presented how a change in acidification, i.e., change in the number of hydrogen ions, led to decreased carbonate availability and affected oysters’ intake of carbonate ions for healthy shell development. Similarly to the previous example, the model portrayed two sections with different CO2 amounts in the atmosphere. The title of each side shows the key idea of ‘CO2 Amounts’ (1a and 2a). The model attended to the same key idea by also drawing more dots (left side, 3a) and fewer dots (right side, 4a) to represent the CO2 molecules in the atmosphere. The students then attended to the key idea of the ‘Carbon Cycle’ by drawing arrows (5c) and using a written explanation (6c) to describe how atmospheric CO2 will end up in the ocean. To attend to the way in which the key idea of ‘CO2 Amounts’ relates to the key idea of ‘pH and Acidification’, the students wrote “Carbon Dioxide + Water creates Hydrogen” (left side, 7d), and “less Hydrogen created” (right side, 8d). In addition, the students drew hydrogen ions (red sad faces) in higher numbers on the left side (9d) as compared to the right side (10d). The model showed the key idea ‘Energy Expenditure in Shell Building’ in different modalities. Using the ‘Written’ modality, the students mentioned the ease (11e) or difficulty (12e) of growing oyster shells. Using the ‘Drawn’ modality, the students represented a relatively smaller number of jagged (presumably weaker) looking shells in the “More CO2” environment (13e) and a higher number of rounded (presumably healthier) looking shells in the “Less CO2” environment (14e). The key idea of ‘Carbonate Availability’ was represented by drawing carbonate ions (green smiley faces) in relatively lower numbers on the left side (15g) and higher numbers on the right side (16g). Finally, the students represented the idea of ‘Chemistry of Shell Building’ by drawing hydrogen ions (red sad faces) holding onto carbonate ions (green smiley faces) (17h) and leaving more carbonate ions available on the right side (18h). The students also provided a brief written discourse, “hydrogen steals carbonate”, to communicate this key idea (left side, 19h). While the explanation sufficiently addresses the question, it is missing the two key ideas of ‘Source of CO2’ and ‘Oysters Filter H2O’ and provides less information about the importance of oysters in the ecosystem and what is causing the increasing CO2 levels. Furthermore, this sufficient explanation doesn’t provide in-depth evidence from the module’s activities (e.g., data that could be drawn from the ‘Carbon Dioxide and pH’ activity were not included).

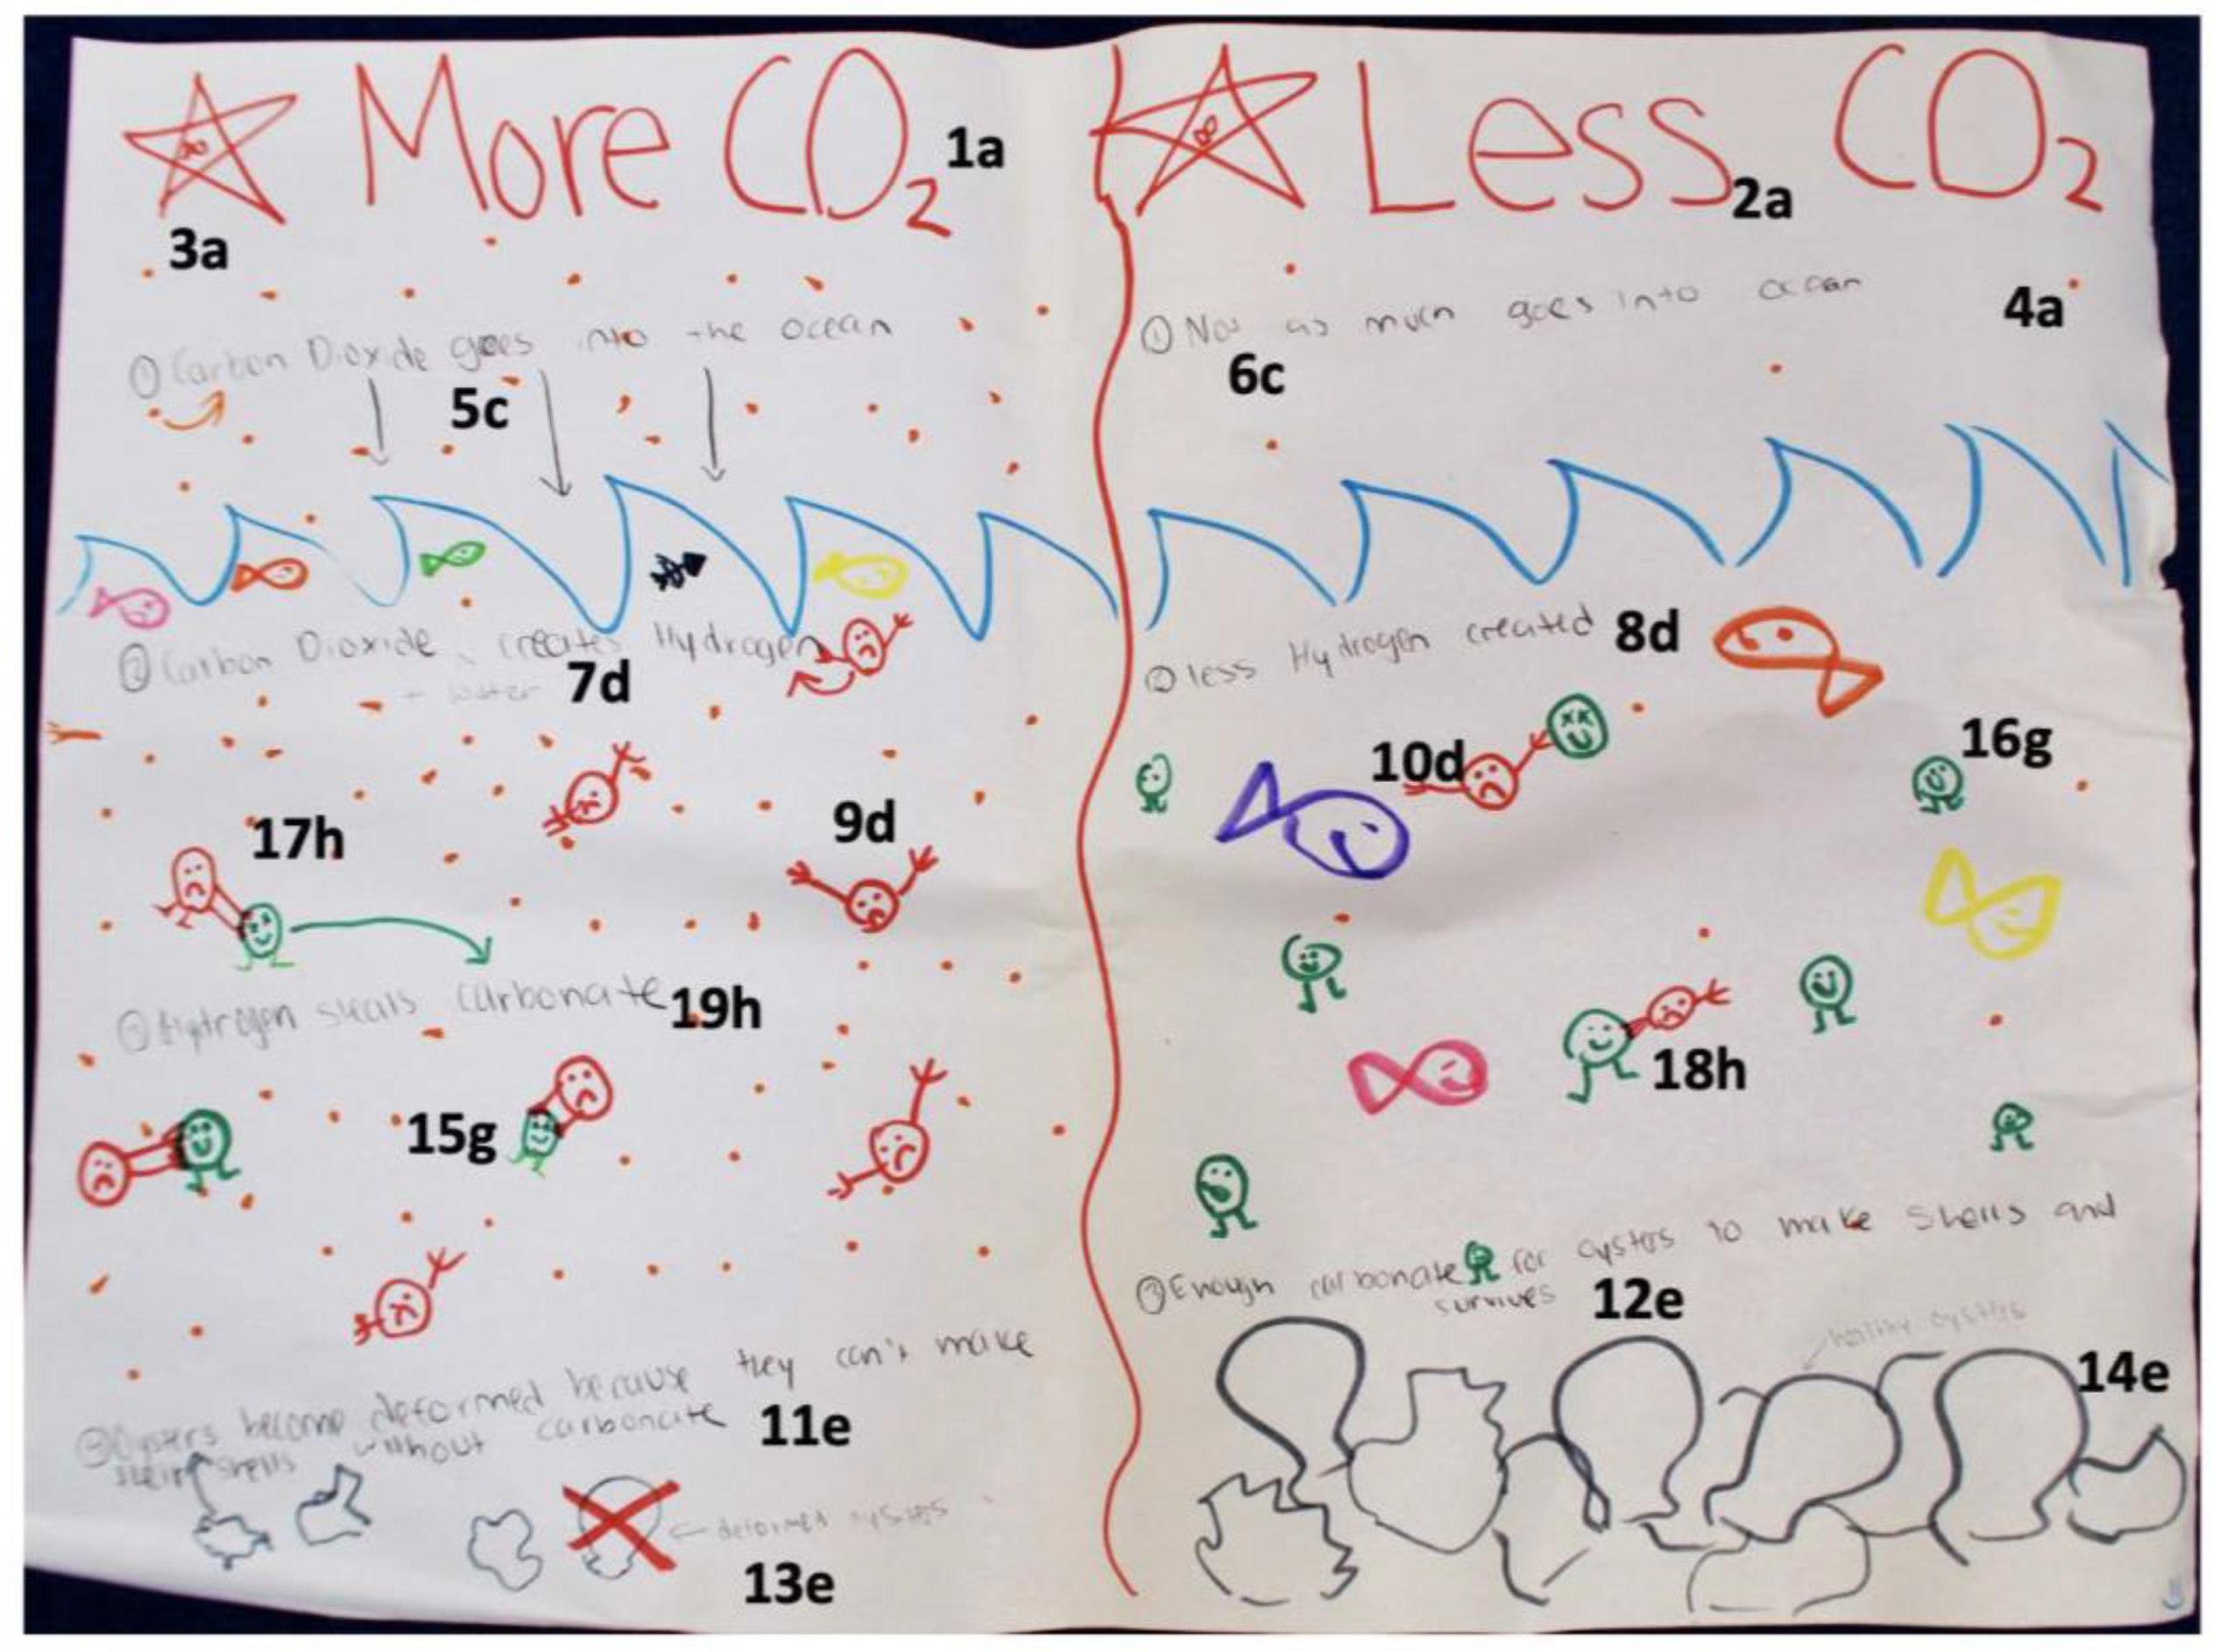
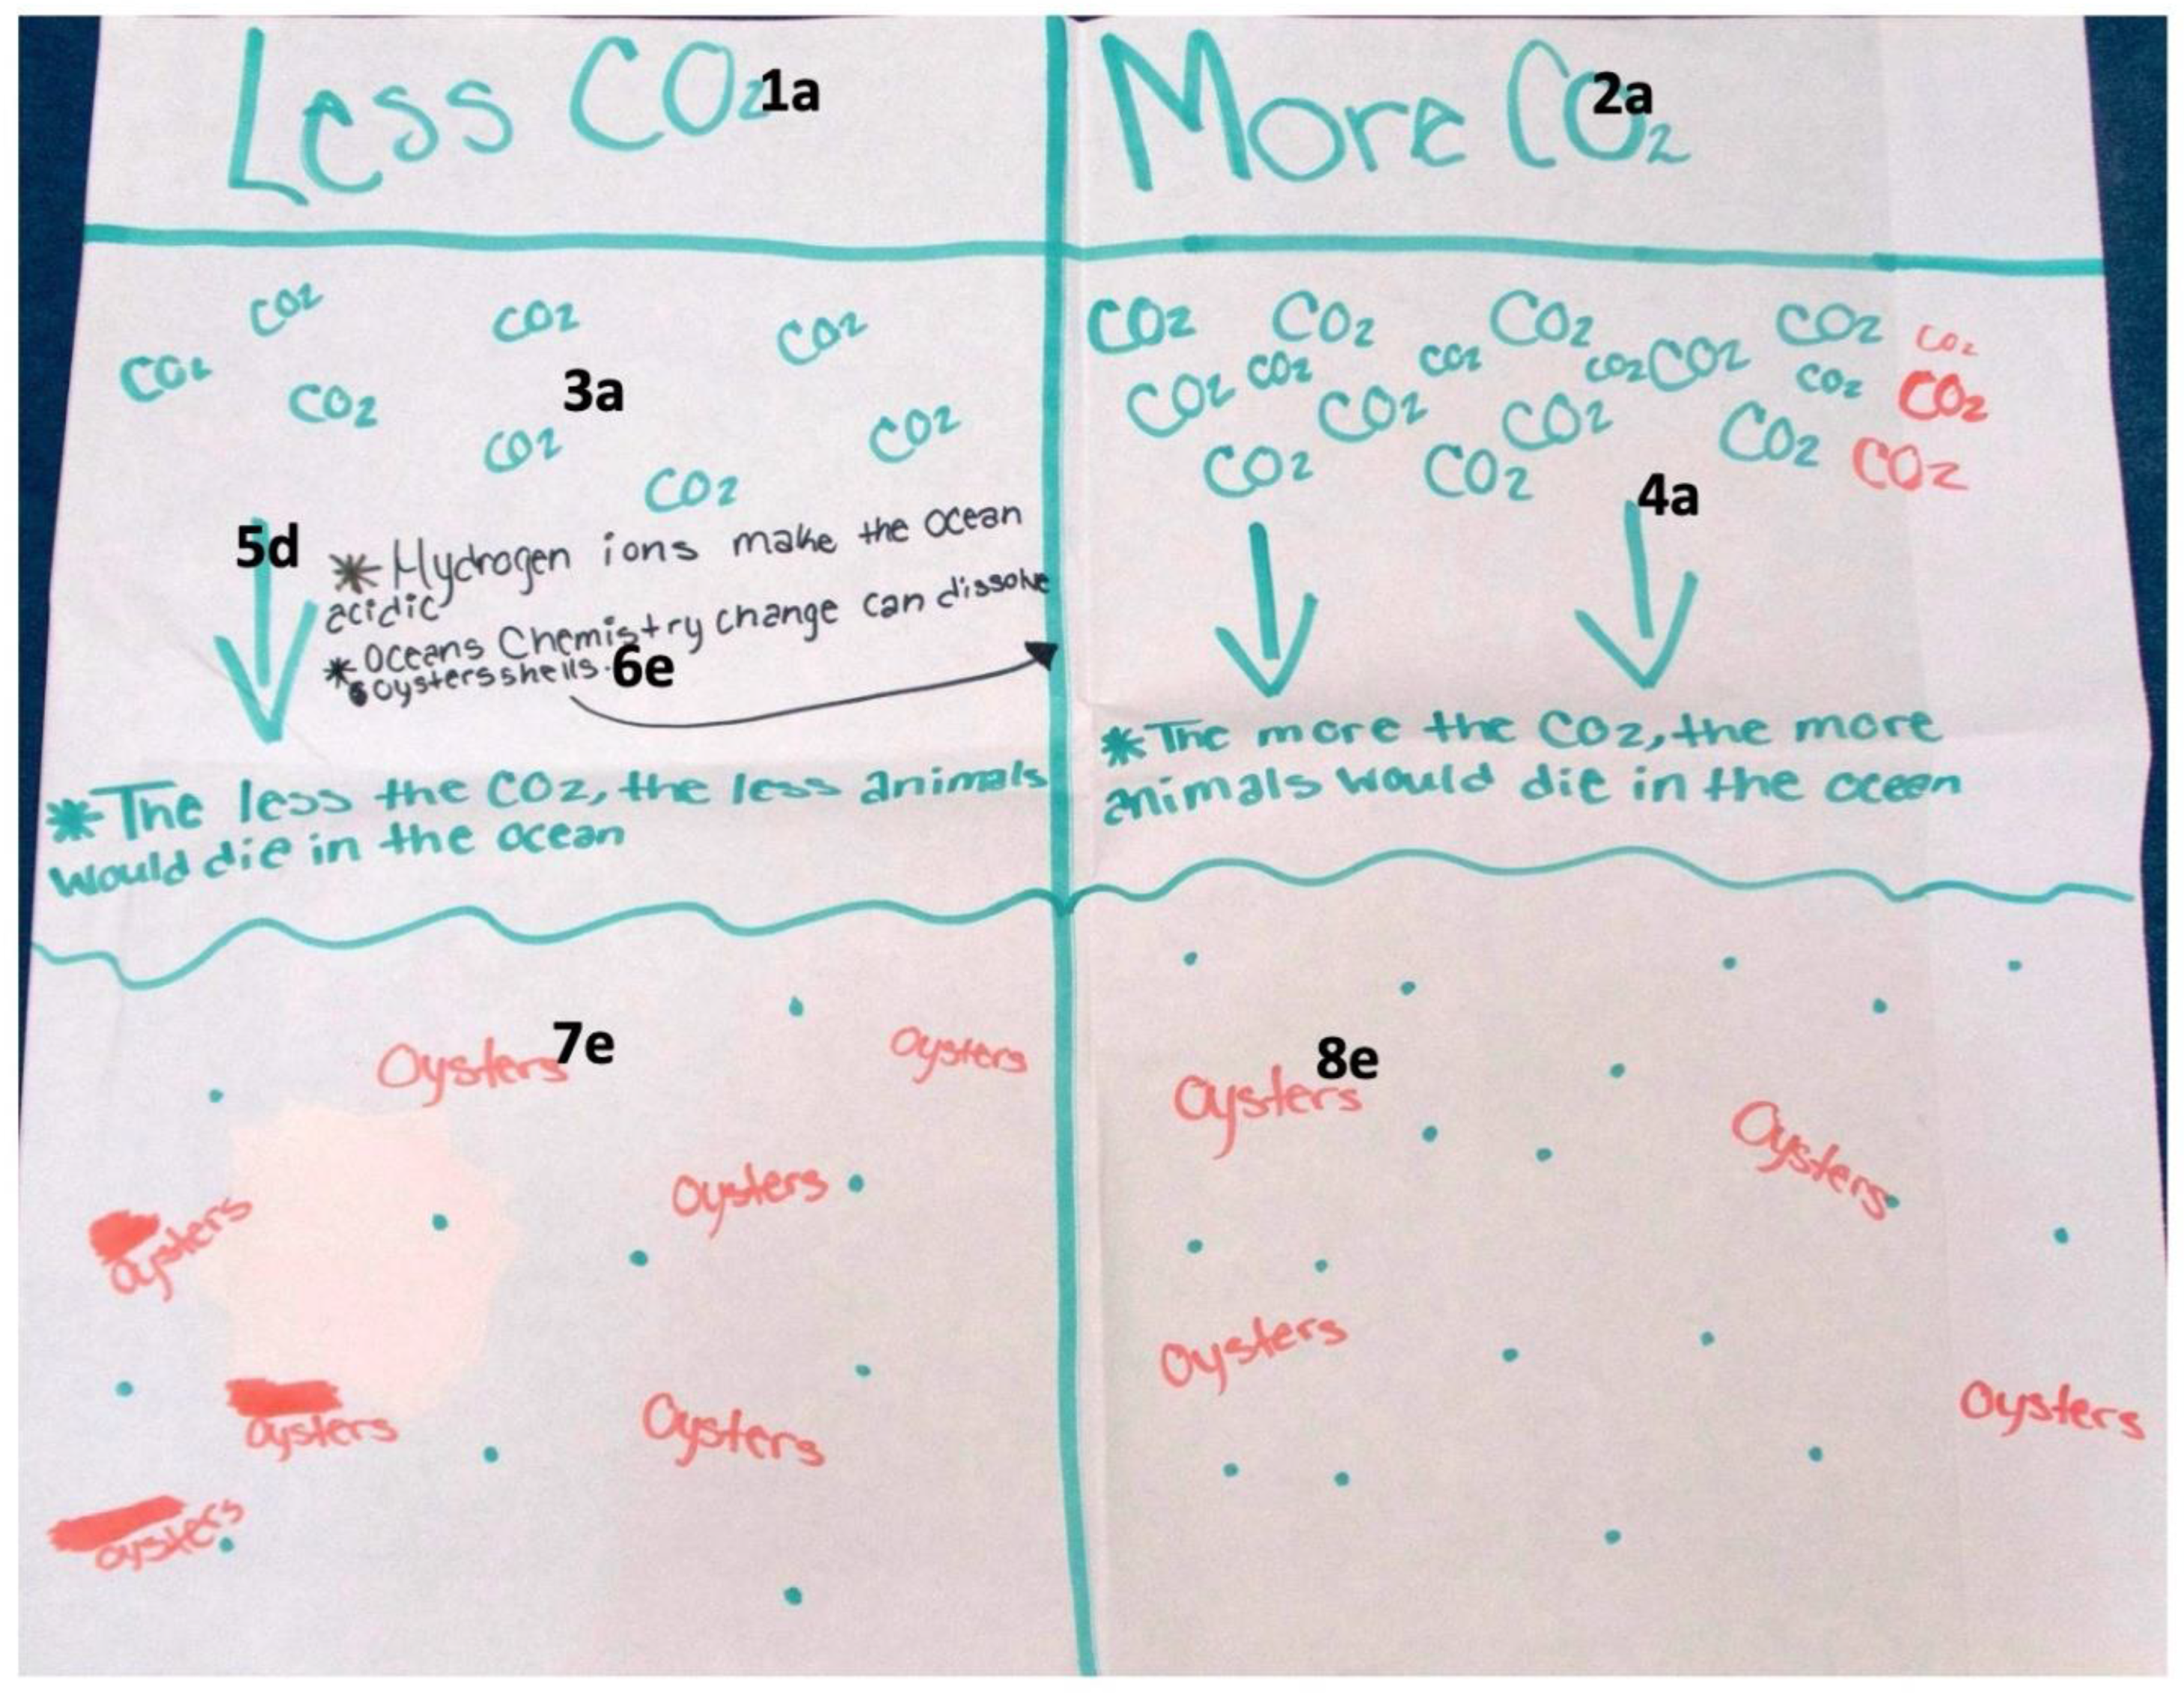
4.2.3. Models with Partial Explanation

These models demonstrate a ‘Partial’ level of cohesiveness when explaining the phenomena to answer the driving question. Models in this category provide a ‘Partial’ explanation and generally only respond to one of the two investigative questions of the module. More than a few key ideas may be missing and/or student representations of these ideas might not align with the scientific findings. Furthermore, these models miss critical connections among key ideas which generally lead to gaps in their explanations.
Figure 5 is an example of an explanatory model that illustrates a ‘Partial’ explanation. Similarly to the previous examples, the model portrays two sections with different CO2 amounts in the atmosphere. The title of each side shows the key idea of ‘CO2 Amounts’ (1a and 2a). The left side (more CO2) demonstrates the students’ attention to the key idea of the ‘Source of CO2’ via drawings of a factory (3b), a house (4b), and a car (5b) emitting CO2. On the right side (less CO2), the students share the same key idea by showing means of transportation that will reduce the CO2 amount, such as drawings of a bike (6b) or a person running (7b). To attend to the way CO2 amounts connect with the key idea of ‘pH and Acidification’, the students equated more CO2 to a low pH environment (left side, 8d), while the side with less CO2 (right side) is shown as being equal to a higher pH environment (9d). The students used several modalities to communicate the key idea of ‘Energy Expenditure in Shell Building’. Using the ‘Written’ modality, the students explained the relationship between levels of acidity and the damage to oysters’ shells (10e, 11e). The students used the ‘Drawn’ modality (with a label) to illustrate several dead (i.e., open) oysters on the “more CO2” (left side, 13e) and drew only live (closed) oysters on the “less CO2” (right side, 14e). The drawn images of the oysters were disconnected from other key ideas. For example, it is not clear what caused the death of the oyster labeled “dead one”. The students presented the key idea of ‘Oysters Filter Water’ by writing “dirty water”, or “clearer water” and connected it to the idea that water is filtered by organisms (15f, 16f). The key idea of ‘Carbonate Availability’ was partially addressed by describing, in writing, the relationship between CO2 levels, the amount of hydrogen, and the amount of carbonate (18g, 19g), but was missing information about the link between hydrogen ions and acidification. The model lacks two key ideas that are critical for a cohesive explanation, those being the ‘Carbon Cycle’ and ‘Chemistry of Shell Building’. For example, while the model attempts to address the key idea of ‘Energy Expenditure in Shell Building’, it fails to explicitly address that oyster larvae struggle to grow shells in more acidic environments. In addition, the model missed the important connection outlining how the carbonate level is affecting oyster larval development. We coded this model as ‘Partial’ due to the lack of several key ideas coupled with a lack of critical connections among the key ideas that were included.

4.2.4. Models with Insufficient Explanation

The models in this category did not provide a sufficiently cohesive explanation of the phenomena. Very few key ideas were present and/or the scientific ideas were mostly disconnected. Figure 6 is an example of an explanatory model that shows an ‘Insufficiently’ cohesive explanation. The model utilized a template similar to the previous example models in that it is divided into two sections with differing amounts of CO2 in the atmosphere. The title of each side shows the key idea of ‘CO2 Amounts’ (1a and 2a). The model attended to this same key idea, as demonstrated by the students also drawing fewer CO2 molecules (left side, 3a) and more CO2 molecules (right side, 4a) to represent CO2 molecules in the atmosphere. To attend to the key idea of ‘pH and Acidification’, the students wrote “Hydrogen ions make the ocean acidic” (5d) and “Oceans Chemistry change can dissolve oysters shells” (6e), using an arrow to indicate that this writing pertains to the right side of the model. The model also communicated the key idea of ‘Energy Expenditure in Shell Building’. In the atmosphere with less CO2, the students expressed in writing that changing ocean chemistry will “dissolve oyster shells” (6e). Moreover, students showed more oysters in the ocean on the left side with ‘less’ atmospheric CO2 (7e) and fewer oysters on the right side with ‘more’ atmospheric CO2 (8e).
Table 5 summarizes the levels of cohesiveness for the explanatory models that are discussed in this section.

4.3. Systems Thinking: Moving beyond Oceans and Oysters

Previous studies suggest that strong models should have the ability to “explain a range of phenomena” and, by doing so, show connections between phenomena [12] (p. 184). In our project, the explanatory models provided an opportunity for students to think about a range of phenomena by taking a systems thinking approach. The background section of this paper emphasized the importance of a systems thinking approach for understanding the complexity of climatic changes. Based on the literature about systems thinking in science, particularly in scientific modeling, we suggested that such an approach focuses on interrelationships and patterns, such as what happens to other marine life when there is a change in atmospheric CO2 [51,52,53]. The activities in our module mostly focus on the Earth’s oceans as a system but also include references to atmospheric CO2 as a system, and we saw that students made links between these two systems in their models. Moreover, we saw that the student models went beyond these two systems and showed the causes and impacts of ocean acidification on oysters across different phenomena in different systems, such as how human food or land use impact (and are impacted by) ocean acidification. Below, we discuss how the students’ explanatory models showed a systems thinking approach and made connections to a variety of systems beyond oceans.
While the driving question of our module focused specifically on oysters, and all the models referenced an ocean system, 21% (32 models) of the student models also attended to the atmospheric system, specifically how changes in atmospheric CO2 will lead to changes in CO2 amounts in the oceans. Figure 7i is an example of how the students represented increased amounts of CO2 in the atmosphere. On the side of the model that depicted increased levels of CO2, there were often expressions of clouds or smoke in the skies. In comparison, sunny skies were typically drawn on the side of the model that represented an atmosphere with less CO2.
A small percentage of the models (11 models, 7%) connected decreasing oyster populations to the impacts on humans. For example, the left side of Figure 7ii shows a drawing with labels of a smiling “healthy human” with a “good fish”. This was drawn on the side of the model that represented a system with less CO2 and more oysters. The right side of Figure 7ii depicts a drawing of a frowning “ill person” near a “bad fish”. This drawing is from the opposite side of the model that represented an environment with more CO2 and less acidic oceans. We noticed in this model that the students were making connections among multiple phenomena related to food webs (e.g., a decreasing oyster population will lead to unhealthy fish and sick people who eat the fish).
Although the driving question asked about the effects of increasing CO2 on oysters specifically, 94 (63%) models included a variety of other marine life in addition to oysters, such as algae, fish, corals, whales, and dolphins. In these instances, students often provided drawings and/or written descriptions of how these other marine organisms were affected when the oceans were more acidic and fewer oysters were available as a food source. For example, in one model, students used a legend (Figure 7iii) to indicate that green represented a “diverse fish” and orange represented a “fish”. That same model depicted both orange “diverse” fish and green “fish” on the side of the model that represented a less acidified ocean (Figure 7iii, left side) while only drawing green “fish” (Figure 7iii, right side) on the side of the model that represented a more acidified ocean, suggesting that changes in ocean acidification levels and decreasing oyster populations led to a less diverse ocean ecosystem.
Thirteen student models communicated the impacts of changes in atmospheric CO2 on land plants (9%) and five student models drew non-human land animals (3%). For example, one model showed a green tree and bushes on the side of the model where there is less CO2 and a less acidified ocean (Figure 7iv, left side), and on the side of that same model that represented an atmosphere and ocean with more CO2, there were no green plants drawn and they wrote “less nature” (Figure 7iv, right side). The right side of Figure 7v demonstrates a model where students drew a sad cat who lives on land where there is more CO2 and an unhealthy ocean. That same model shows a happy cat (Figure 7v, left side) on the side of the model where there is less CO2 and a healthy ocean.

5. Discussions and Future Implications

Building coherent and gapless explanations is crucial for rigorous scientific learning [68,69]. Explanatory models can be used as a tool to promote students’ cohesive explanations and provide them with feedback on the construction of these explanations [15]. The iterative process of explanatory models offers opportunities for epistemic learning, such as supporting or revising ideas with competing evidence. Despite the suggested use of ‘models for’ to support students’ conceptual and epistemic learning, there is a concern that the traditional use of modeling (models of), persists in many classrooms. This limits the role of modeling to visualization and memorization of system components. In this study, we looked at how students used explanatory models to construct evidence-based explanations about how ocean acidification affects oyster development. The modeling process was scaffolded through a series of activities that provided evidence for the key ideas needed to build an explanation to answer the driving question. Based on our findings from 14 classes, we rarely saw student models with ‘Extensive’ explanations that attended to all key ideas with evidence from multiple resources. Furthermore, the majority of the student models showed insufficient explanations that were missing key ideas and references to the related evidence. In order to unpack what leads to models with extensive explanations, or their lack thereof, we developed a coding scheme to qualitatively look at the conceptual elements and epistemic discourses across all 150 explanatory models. The following subsections will discuss our findings and the related implications for research and practice.

5.1. Scaffolding Students for Engagement in Epistemic Aspects of Modeling

For several decades, research has suggested that eliciting students’ reasoning and ideas is more effective than the traditional school science approach of knowledge transmission [70]. However, recent studies on modeling, where students actively present their ideas, suggest that many teachers struggle with this approach and are not able to effectively support their students in identifying and connecting ideas to the scientific phenomena that models aim to explain [16]. In addition to struggling to attend to the specific ideas and explanations that students bring to their models, teachers are also limited in their capacity to provide critical feedback to improve student learning about the scientific phenomena and the modeling practice. We suggest that the coding framework we developed in this study can be used as a feedback tool for teachers to formatively assess and scaffold students’ progress during the modeling practice. As our framework is aligned with integrated three-dimensional science learning [8], it directly supports the NGSS-aligned [9] curriculum design. In developing our coding framework, we first looked at ‘Key Ideas Based on Evidence’ related to the disciplinary core ideas being taught (such as ‘pH and Acidification’ in our module) along with ‘Discourse Modality of Evidence’ (i.e., how students’ modeling practice presents evidence from their student-driven investigations [e.g., ‘Data Table’, ‘Drawn’]). Second, we decided to highlight students’ use of ‘Systems Thinking’ approaches (e.g., connections to the atmosphere, other living organisms) as it is a crosscutting concept that strengthens the explanation of scientific phenomena. Third, to explore the epistemic aspects of the modeling practice, we examined how students used ‘Scientific Representations’ that are epistemic discourses specific to scientific disciplines in the form of language or symbols [71]. Specifically, we looked at how students used scientific representations, grounded in specialized epistemic discourses, such as arrows, to show processes or symbols for chemical molecules. We suggest that teachers or teacher educators can use these categories as a guide to developing a framework to support students on the iterative revisions of models that seek to explain other phenomena. Using this framework, teachers can follow students’ evolving understanding of the key ideas and identify the related evidence students use in developing extensively coherent explanations of the phenomena being studied. In addition, focusing on how students make decisions around which ‘Scientific Representations’ they use can provide opportunities for classroom discussions on epistemic cultures of scientific disciplines that develop norms around when and how to implement these scientific representations.
In scaffolding the development of conceptual understanding of key ideas in students, it may be important to consider the types of activities in which students are engaged. Key ideas that were integrated into explanatory models are most frequently related to activities where students are socially engaged in practices of science. For example, in the activity that focused on the key idea of ‘pH and Acidification’, students designed their own protocols to answer the investigative question while making decisions as a group. This activity also involved students analyzing and interpreting data in groups or pairs. Key ideas that mostly relied on readings and videos as major sources for the activity, such as ‘Oysters Filter Water,’ were present less often in explanatory models and appeared in fewer instances. We therefore suggest future studies on the role of social engagement in scientific activities designed to supporting students’ understanding and use of key ideas for building a cohesive scientific model.

5.2. Diverse Discourse Modes for Building Cohesive Models

The findings from this study contribute to the literature on the diversity of discourse modalities students choose to communicate their ideas. Previous research highlighted the richness of students’ use of multiple literacies that are critical for learning and participating in science [72]. Scholars suggest that the use of both written and drawn modalities improves deeper thinking, epistemic agency, and clarity of explanations. These scholars also highlight that written text can help improve the clarity of drawn models and provide a sequential logic to scientific processes. Further, models that allow multiple representations can be a more equitable and inclusive assessment tool for science classrooms [14] as they provide space for students who might be challenged with one of the modalities. For example, writing in a logical and sequential manner in models can be demanding for emergent bilinguals. In our study, students were encouraged to use a variety of discourse modes in building their explanatory model. Our findings showed that most models were a combination of written and drawn modalities. It is important to note that both models with mostly ‘Drawn’ components and models with mostly ‘Written’ components can achieve extensive explanations. As can be seen in the examples provided in the findings, the textual information is most often used to name drawn images, explain processes, provide a sequence to events, and link different key ideas.
Beyond written text and drawing, we noticed that some students used another modality, ‘Data Tables’ that included data from their own investigations. In some cases, students complemented data tables with textual explanations and visual drawings. In the Ocean Acidification and Oysters module, students collected two sets of data: (1) during the student-designed investigation during the ‘Carbon Dioxide and pH’ activity and (2) during the ‘Carbonate Challenge’ activity. We noticed that this use of a ‘Data Table’ as a modality was rare among the modalities chosen by students. While the role of data is significant in computational models, we see that explanatory models can be a tool to help students integrate what they learn from their data. Future studies can explore meaningful integrations and representations of data as a discourse modality in explanatory models. Data representations can help strengthen the evidence that supports the key ideas in the models.

5.3. Systems Thinking beyond Oceans and Oysters

Our study tackles the process of learning about a critical climate change impact, ocean acidification. According to scientists, unprecedented changes in ocean acidification are related to past mass extinctions. The evidence is alarming scientists who claim recent changes in the oceans can lead to decreased populations of shellfish and then impact the food chain in the marine ecosystem [73]. Due to Earth’s complex environmental system, understanding this phenomenon requires focusing on a systems thinking approach. During professional learning with teachers, we encouraged teachers to make a connection between the atmospheric changes and changes in the oceans. Specifically, our goal was to support an understanding of how changing levels of CO2 in the atmosphere lead to changing CO2 levels and related changes in acidification levels in the oceans. Our intention was to support students in learning about the impact on oyster development. Our videos and readings showed limited connections to how other marine organisms and humans can be affected by the changing oceans and their impact on the food chain.
Despite the limited representation of a variety of species and their links to human ecologies, we saw that many student models communicated a decrease in the number and diversity of marine species beyond oysters. For instance, they drew or wrote about fish, algae, and clams. Some models depicted humans with reduced access to food sources and living in environments where there is less green space or clean water. Although our materials did not highlight the impact on land animals and plants, we noticed that some students did attend to multispecies impacts and their relation to humans in their models. This finding reminds us that youth perceptions of climate injustice can move beyond the traditional anthropocentric view that exceptionally centers humans. Recent research on climate change emphasizes that these human-centric views of climate justice are no longer enough to attend to the climate emergency the world is witnessing today (e.g., [74]). These scholars therefore suggest a multispecies lens regarding climate justice that will acknowledge the past and future destruction of living and non-living things (e.g., animals, rivers) and consider the importance of the relationships we all require to thrive and overcome environmental grand challenges [75]. Inspired by this observation, we suggest that future research on modeling climate change impacts with a systems thinking approach consider a multispecies lens for a more inclusive understanding of the impacts of changing climate.

6. Conclusions and Limitations

Following the publication of the NGSS [9], a committee of experts on science education and assessments worked on a document for Developing Assessments for the Next Generation Science Standards [76]. This document highlights the importance of aligning classroom instruction with formative assessments designed around real-life scientific phenomena. In order to actualize this goal, we need to understand teachers’ capacity to implement this new vision of science teaching and learning. Our analysis of classroom implementation of explanatory models showed that student-developed models usually do not lead to cohesive explanations of phenomena and lack critical conceptual and epistemic components. Although we analyzed 150 models across classrooms with varying demographics, we acknowledge that we were limited to the 14 classes within the mid-Atlantic region of the United States. The participating teachers and their students were new to using explanatory models in their classrooms and some of them explicitly mentioned they struggled to provide feedback on their students’ models.
In addition to looking at the reality of classroom implementation, our study contributes to research and practice by providing a qualitative analysis framework that will help researchers and practitioners to attend to conceptual and epistemic aspects of explanatory models. While integrating three dimensions of learning,—disciplinary core ideas, scientific practices, and crosscutting concepts—the categories we developed in this study can help researchers and practitioners to use explanatory models as NGSS-aligned assessments. In recent years, there has been an effort to use machine learning to support teachers in assessing students’ models [44]. The use of machine learning applications can be strengthened by training them with human coding on real student models. We suggest that our findings can inform future research exploring the role of machine learning to support teachers in assessing student models. We see the potential in using our framework to build a feedback mechanism for iterations of models, however, this study is limited to the analysis of the students’ final models. While this focus allowed us to carry out an in-depth investigation of a large set of models, further studies that analyze each iteration of explanatory models would be informative.
At the center of our perspective, we aimed to work towards an equitable assessment practice that is based on cultural theories of learning and attempted to highlight diverse ways of knowing and learning [77]. The pandemic that we all recently witnessed further exposed the need for equitable assessment systems [78]. Our analysis framework derives from a local cultural phenomenon (i.e., ocean acidification and its impact on oysters) that is familiar to many students in this study. In addition, our framework acknowledges diverse perspectives students use to build their model (e.g., choosing a variety of scientific representations, looking at connections beyond marine life). Since teachers’ scaffolding is critical in students’ understanding of the modeling practice, our hope is that an increasing number of teachers will pay attention to the equitable aspects of modeling while using it as an assessment.

Author Contributions

Conceptualization, A.S.-B. and M.K.S.; methodology, A.S.-B.; formal analysis, A.S.-B., A.M.-R. and M.K.S. investigation, A.S.-B. and M.K.S.; resources, M.K.S.; data curation, A.M.-R.; writing—original draft preparation, A.S.-B.; writing—review and editing, A.S.-B., G.M.-A. and M.K.S.; project administration, A.S.-B., G.M.-A. and M.K.S.; funding acquisition, A.S.-B., G.M.-A. and M.K.S. All authors have read and agreed to the published version of the manuscript.

Funding

This material is based upon work supported by the National Science Foundation under Grant #1239758. Any opin-ions, findings, and conclusions or recommendations expressed in this material are those of the authors and do not necessarily react the views of the National Science Foundation.

Institutional Review Board Statement

The study was approved by the Institutional Review Board of Towson University, MD (protocol code #1905051460 and 12 June 2019).” for studies involving humans.

Informed Consent Statement

Informed consent was waived since researchers only collected anonymous student artifacts with no direct access to participants.

Data Availability Statement

The data presented in this study are available on request from the corresponding author. The data are not publicly available due to institutional guidelines on data protection.

Conflicts of Interest

The authors have no conflict of interest.

References

  1. Gelfert, A. How to Do Science with Models: A Philosophical Primer; Springer: Berlin/Heidelberg, Germany, 2016. [Google Scholar]
  2. Gilbert, J.K. Models and modelling: Routes to more authentic science education. Int. J. Sci. Math. Educ. 2004, 2, 115–130. [Google Scholar] [CrossRef]
  3. Bokulich, A. How scientific models can explain. Synthese 2011, 180, 33–45. [Google Scholar] [CrossRef]
  4. Edmonds, B.; Le Page, C.; Bithell, M.; Chattoe-Brown, E.; Grimm, V.; Meyer, R.; Montañola Sales, C.; Ormerod, P.; Root, H.; Squazzoni, F. Diuerent modelling purposes. J. Artif. Soc. Soc. Simul. 2019, 22. [Google Scholar] [CrossRef]
  5. Passmore, C.; Stewart, J.; Cartier, J. Model-based inquiry and school science: Creating connections. Sch. Sci. Math. 2009, 109, 394–402. [Google Scholar] [CrossRef]
  6. Raghavan, K.; Glaser, R. Model–based analysis and reasoning in science: The MARS curriculum. Sci. Educ. 1995, 79, 37–61. [Google Scholar] [CrossRef]
  7. Windschitl, M.; Thompson, J.; Braaten, M. Beyond the scientific method: Model-based inquiry as a new paradigm of preference for school science investigations. Sci. Educ. 2008, 92, 941–967. [Google Scholar] [CrossRef]
  8. National Research Council. A Framework for K-12 Science Education: Practices, Crosscutting Concepts, and Core Ideas; National Academies Press: Washington, DC, USA, 2012. [Google Scholar]
  9. NGSS Lead States. Next Generation Science Standards: For States, by States; The National Academies Press: Washington, DC, USA, 2013. [Google Scholar]
  10. Baek, H.; Schwarz, C.; Chen, J.; Hokayem, H.; Zhan, L. Engaging elementary students in scientific modeling: The MoDeLS fifth-grade approach and findings. In Models and Modeling: Cognitive Tools for Scientific Enquiry; Springer: Berlin/Heidelberg, Germany, 2011; pp. 195–218. [Google Scholar]
  11. Rudolph, J.L. Portraying epistemology: School science in historical context. Sci. Educ. 2003, 87, 64–79. [Google Scholar] [CrossRef]
  12. Ke, L.; Schwarz, C.V. Using epistemic considerations in teaching: Fostering students’ meaningful engagement in scientific modeling. In Towards a Competence-Based View on Models and Modeling in Science Education; Springer: Berlin/Heidelberg, Germany, 2019; pp. 181–199. [Google Scholar]
  13. Lehrer, R.; Schauble, L. Cultivating Model-Based Reasoning in Science Education; Cambridge University Press: Cambridge, UK, 2006. [Google Scholar]
  14. Schwarz, C.V.; Passmore, C.; Reiser, B.J. Helping Students Make Sense of the World using Next Generation Science and Engineering Practices; NSTA Press: Arlington, VA, USA, 2017. [Google Scholar]
  15. Windschitl, M.; Thompson, J.; Braaten, M. Ambitious Science Teaching; Harvard Education Press: Cambridge, MA, USA, 2020. [Google Scholar]
  16. Guy-Gaytán, C.; Gouvea, J.S.; Griesemer, C.; Passmore, C. Tensions between learning models and engaging in modeling: Exploring implications for science classrooms. Sci. Educ. 2019, 28, 843–864. [Google Scholar] [CrossRef]
  17. Schwarz, C.V.; Reiser, B.J.; Davis, E.A.; Kenyon, L.; Achér, A.; Fortus, D.; Shwartz, Y.; Hug, B.; Krajcik, J. Developing a learning progression for scientific modeling: Making scientific modeling accessible and meaningful for learners. J. Res. Sci. Teach. 2009, 46, 632–654. [Google Scholar] [CrossRef]
  18. Windschitl, M.; Thompson, J. The modeling toolkit: Making student thinking visible with public representations. Sci. Teach. 2013, 80, 63–69. [Google Scholar]
  19. Intergovernmental Panel on Climate Change. Global Warming of 1.5 °C: An IPCC Special Report on the Impacts of Global Warming of 1.5 °C Above Pre-industrial Levels and Related Global Greenhouse Gas Emission Pathways, in the Context of Strengthening the Global Response to the Threat of Climate Change, Sustainable Development, and Efforts to Eradicate Poverty; World Meteorological Organization.: Geneva, Switzerland, 2018. [Google Scholar]
  20. Jang, S.M.; Hart, P.S. Polarized frames on “climate change” and “global warming” across countries and states: Evidence from Twitter big data. Glob. Environ. Change 2015, 32, 11–17. [Google Scholar] [CrossRef]
  21. Plutzer, E.; McCaffrey, M.; Hannah, A.L.; Rosenau, J.; Berbeco, M.; Reid, A.H. Climate confusion among US teachers. Science 2016, 351, 664–665. [Google Scholar] [CrossRef] [PubMed]
  22. Hadorn, G.H.; Hoffmann-Riem, H.; Biber-Klemm, S.; Grossenbacher-Mansuy, W.; Joye, D.; Pohl, C.; Wiesmann, U.; Zemp, E. Handbook of Transdisciplinary Research; Springer: Berlin/Heidelberg, Germany, 2008. [Google Scholar]
  23. Ke, L.; Sadler, T.D.; Zangori, L.; Friedrichsen, P.J. Students’ perceptions of socio-scientific issue-based learning and their appropriation of epistemic tools for systems thinking. Int. J. Sci. Educ. 2020, 42, 1339–1361. [Google Scholar] [CrossRef]
  24. Kelly, G. Inquiry, activity and epistemic practice. In Teaching Scientific Inquiry; Brill: Leiden, The Netharlands, 2008; pp. 99–117. [Google Scholar]
  25. Knorr-Cetina, K.D. Epistemic cultures: Forms of reason in science. Hist. Political Econ. 1991, 23, 105–122. [Google Scholar] [CrossRef]
  26. Knorr Cetina, K. Epistemic Cultures: How the Sciences make Knowledge; Harvard University Press: Cambridge, MA, USA, 1999. [Google Scholar]
  27. Gouvea, J.; Passmore, C. ‘Models of’versus ‘Models for’ Toward an Agent-Based Conception of Modeling in the Science Classroom. Sci. Educ. 2017, 26, 49–63. [Google Scholar] [CrossRef]
  28. Kelly, G.J. Methodological considerations for the study of epistemic cognition in practice. In Handbook of Epistemic Cognition; Routledge: London, UK, 2016; pp. 393–408. [Google Scholar]
  29. Stroupe, D. Examining classroom science practice communities: How teachers and students negotiate epistemic agency and learn science-as-practice. Sci. Educ. 2014, 98, 487–516. [Google Scholar] [CrossRef]
  30. Crawford, B.A.; Capps, D.K. Teacher cognition of engaging children in scientific practices. In Cognition, Metacognition, and Culture in STEM Education: Learning, Teaching and Assessment; Springer: Berlin/Heidelberg, Germany, 2018; pp. 9–32. [Google Scholar]
  31. Pluta, W.J.; Chinn, C.A.; Duncan, R.G. Learners’ epistemic criteria for good scientific models. J. Res. Sci. Teach. 2011, 48, 486–511. [Google Scholar] [CrossRef]
  32. Giere, R.N. Explaining Science: A Cognitive Approach; University of Chicago Press: Chicago, IL, USA, 2010. [Google Scholar]
  33. Kuhn, T. The Essential Tension; University of Chicago Press: Chicago, IL, USA, 1977. [Google Scholar]
  34. Goldman, A.I. Knowledge in a Social World; Oxford University Press: Oxford, UK, 1999. [Google Scholar]
  35. Solomon, M. Social Empiricism; MIT Press: Cambridge, MA, USA, 2007. [Google Scholar]
  36. Bishop, M.A.; Bishop, M.A.; Trout, J. Epistemology and the Psychology of Human Judgment; Oxford University Press on Demand: Oxford, UK, 2005. [Google Scholar]
  37. Machamer, P.; Darden, L.; Craver, C.F. Thinking about mechanisms. Philos. Sci. 2000, 67, 1–25. [Google Scholar] [CrossRef]
  38. Staley, K.W. Robust evidence and secure evidence claims. Philos. Sci. 2004, 71, 467–488. [Google Scholar] [CrossRef]
  39. Bamberger, Y.M.; Davis, E.A. Middle-school science students’ scientific modelling performances across content areas and within a learning progression. Int. J. Sci. Educ. 2013, 35, 213–238. [Google Scholar] [CrossRef]
  40. Fortus, D.; Shwartz, Y.; Rosenfeld, S. High school students’ meta-modeling knowledge. Res. Sci. Educ. 2016, 46, 787–810. [Google Scholar] [CrossRef]
  41. Pierson, A.E.; Clark, D.B.; Sherard, M.K. Learning progressions in context: Tensions and insights from a semester-long middle school modeling curriculum. Sci. Educ. 2017, 101, 1061–1088. [Google Scholar] [CrossRef]
  42. Heijnes, D.; van Joolingen, W.; Leenaars, F. Stimulating scientific reasoning with drawing-based modeling. J. Sci. Educ. Technol. 2018, 27, 45–56. [Google Scholar] [CrossRef]
  43. Tytler, R. The Role of Visualisation in Science: A Response to “Science Teachers’ Use of Visual Representations” Science Teachers’ Use of Visual Representations, edited by Eilam, B. and Gilbert, J., Dordrecht, The Netherlands, Springer, 2014, VIII+ 338pp.,£ 90.00, ISBN 978-3-319-06525-0; Taylor & Francis: Singapore, 2021. [Google Scholar]
  44. Zhai, X.; He, P.; Krajcik, J. Applying machine learning to automatically assess scientific models. J. Res. Sci. Teach. 2022, 59, 1765–1794. [Google Scholar] [CrossRef]
  45. Tversky, B. Spatial schemas in depictions. In Spatial Schemas and Abstract Thought; MIT Press: Boston, MA, USA, 2001; Volume 79, p. 111. [Google Scholar]
  46. Ainsworth, S. DeFT: A conceptual framework for considering learning with multiple representations. Learn. Instr. 2006, 16, 183–198. [Google Scholar] [CrossRef]
  47. Cheng, M.-F.; Lin, J.-L.; Lin, S.-Y.; Cheng, C.-H. Scaffolding middle school and high school students’ modeling processes. J. Balt. Sci. Educ. 2017, 16, 207. [Google Scholar] [CrossRef]
  48. Frydenberg, E. My journey in coping research and practice: The impetus and the relevance. Educ. Dev. Psychol. 2020, 37, 83–90. [Google Scholar] [CrossRef]
  49. Sinatra, G.M.; Lombardi, D. Evaluating sources of scientific evidence and claims in the post-truth era may require reappraising plausibility judgments. Educ. Psychol. 2020, 55, 120–131. [Google Scholar] [CrossRef]
  50. McGowan, V.C.; Bell, P. “I now deeply care about the effects humans are having on the world”: Cultivating ecological care and responsibility through complex systems modelling and investigations. Educ. Dev. Psychol. 2022, 39, 116–131. [Google Scholar] [CrossRef]
  51. Senge, P. The fifth discipline: The art and practice of the learning organization; Doubleday: New York, NY, USA, 1990. [Google Scholar]
  52. Davidz, H.L.; Nightingale, D.J. Enabling systems thinking to accelerate the development of senior systems engineers. Syst. Eng. 2008, 11, 1–14. [Google Scholar] [CrossRef]
  53. Goldstone, R.L.; Wilensky, U. Promoting transfer by grounding complex systems principles. J. Learn. Sci. 2008, 17, 465–516. [Google Scholar] [CrossRef]
  54. King, C.; Jiggins, J.; Coutts, J. Organisational Skills for Overcoming the Invisable Process Barriers to Ecological Sustainable Development (ESD). In Proceedings of the Management for Ecological Sustainability, Brisbane, Australia, September 1998; Centre for Conservation Biology, University of Queensland: Brisbane, Australia, 2000. [Google Scholar]
  55. Leischow, S.J.; Milstein, B. Systems Thinking and Modeling for Public Health Practice; American Public Health Association: Washington, DC, USA, 2006; Volume 96, pp. 403–405. [Google Scholar]
  56. Grossi, A.; Dinku, T. Enhancing national climate services: How systems thinking can accelerate locally led adaptation. One Earth 2022, 5, 74–83. [Google Scholar] [CrossRef]
  57. Hmelo-Silver, C.E.; Marathe, S.; Liu, L. Fish swim, rocks sit, and lungs breathe: Expert-novice understanding of complex systems. J. Learn. Sci. 2007, 16, 307–331. [Google Scholar] [CrossRef]
  58. Verhoeff, R.P.; Knippels, M.-C.P.; Gilissen, M.G.; Boersma, K.T. The theoretical nature of systems thinking. Perspectives on systems thinking in biology education. In Frontiers in Education; Frontiers Media SA: Lausanne, Switzerland, 2018; Volume 3, p. 40. [Google Scholar]
  59. van Ravenzwaaij, J.; Olde Hartman, T.C.; Van Ravesteijn, H.; Eveleigh, R.; Van Rijswijk, E.; Lucassen, P. Explanatory models of medically unexplained symptoms: A qualitative analysis of the literature. Ment. Health Fam. Med. 2010, 7, 223. [Google Scholar] [PubMed]
  60. Wilensky, U.; Reisman, K. Thinking like a wolf, a sheep, or a firefly: Learning biology through constructing and testing computational theories—An embodied modeling approach. Cogn. Instr. 2006, 24, 171–209. [Google Scholar] [CrossRef]
  61. Pörtner, H.; Karl, D.; Boyd, P.; Cheung, W.; Lluch-Cota, S.; Nojiri, Y.; Schmidt, D.; Zavialov, P.; Alheit, J.; Aristegui, J. Ocean Systems. Climate Change 2014: Impacts, Adaptation, and Vulnerability. Part A: Global and Sectoral Aspects. Contribution of Working Group II to the Fifth Assessment Report of the Intergovernmental Panel on Climate Change; Cambridge University Press: Cambridge, UK, 2014; pp. 411–484. [Google Scholar]
  62. Gold, A.U.; Oonk, D.J.; Smith, L.; Boykoff, M.T.; Osnes, B.; Sullivan, S.B. Lens on climate change: Making climate meaningful through student-produced videos. J. Geogr. 2015, 114, 235–246. [Google Scholar] [CrossRef]
  63. Bezemer, J.; Jewitt, C.; Diamantopoulou, S.; Kress, G.; Mavers, D. Using a social semiotic approach to multimodality: Researching learning in schools, museums and hospitals. NCRM Working Paper 2012. Available online: http://eprints.ncrm.ac.uk/2258/4/NCRM_working_paper_0112.pdf (accessed on 21 March 2023).
  64. Kress, G. Discourse analysis and education: A multimodal social semiotic approach. In An Introduction to Critical Discourse Analysis in Education; Routledge: London, UK, 2011; pp. 205–226. [Google Scholar]
  65. Lemke, J.L. Articulating Communities: Sociocultural Perspectives on Science Education. J. Res. Sci. Teach. 2001, 38, 296–316. [Google Scholar] [CrossRef]
  66. Glaser, B.G. The constant comparative method of qualitative analysis. Soc. Probl. 1965, 12, 436–445. [Google Scholar] [CrossRef]
  67. Syed, M.; Nelson, S.C. Guidelines for establishing reliability when coding narrative data. Emerg. Adulthood 2015, 3, 375–387. [Google Scholar] [CrossRef]
  68. Reiser, B.J. What professional development strategies are needed for successful implementation of the Next Generation Science Standards. In Invitational Research Symposium on Science Assessment; ETS: Washington, DC, USA, 2013; pp. 1–22. [Google Scholar]
  69. Reiser, B.J.; Novak, M.; McGill, T.A.; Penuel, W.R. Storyline units: An instructional model to support coherence from the students’ perspective. J. Sci. Teach. Educ. 2021, 32, 805–829. [Google Scholar] [CrossRef]
  70. Rudolph, J.L. Inquiry, instrumentalism, and the public understanding of science. Sci. Educ. 2005, 89, 803–821. [Google Scholar] [CrossRef]
  71. Smith, C.L.; Maclin, D.; Houghton, C.; Hennessey, M.G. Sixth-grade students’ epistemologies of science: The impact of school science experiences on epistemological development. Cogn. Instr. 2000, 18, 349–422. [Google Scholar] [CrossRef]
  72. Ainsworth, S.; Prain, V.; Tytler, R. Drawing to learn in science. Science 2011, 333, 1096–1097. [Google Scholar] [CrossRef] [PubMed]
  73. Guinotte, J.M.; Fabry, V.J. Ocean acidification and its potential effects on marine ecosystems. Ann. New York Acad. Sci. 2008, 1134, 320–342. [Google Scholar] [CrossRef] [PubMed]
  74. Tschakert, P.; Schlosberg, D.; Celermajer, D.; Rickards, L.; Winter, C.; Thaler, M.; Stewart-Harawira, M.; Verlie, B. Multispecies justice: Climate-just futures with, for and beyond humans. Wiley Interdiscip. Rev. Clim. Change 2021, 12, e699. [Google Scholar] [CrossRef]
  75. Celermajer, D.; Chatterjee, S.; Cochrane, A.; Fishel, S.; Neimanis, A.; O’brien, A.; Reid, S.; Srinivasan, K.; Schlosberg, D.; Waldow, A. Justice through a multispecies lens. Contemp. Political Theory 2020, 19, 475–512. [Google Scholar] [CrossRef]
  76. National Research Council. Developing Assessments for the Next Generation Science Standards; National Academies Press: Washington, DC, USA, 2014. [Google Scholar]
  77. Penuel, W.R. Reimagining american education: Possible futures: Possible futures for equitable educational assessment. Phi Delta Kappan 2021, 103, 54–57. [Google Scholar] [CrossRef]
  78. National Academy of Sciences. Educational assessments in the COVID-19 era and beyond. PowerPoint slides 2021. 2021. Available online: https://naeducation.org/wp-content/uploads/2021/03/Educational-Assessments-in-the-COVID-19-Era-and-Beyond_NAEd-Forum-Combined-Slides.pdf (accessed on 21 March 2023).
Figure 1. The sequences of activities that make up the Ocean Acidification and Oysters module and support Explanatory Model development by students to answer the driving question “How might increasing levels of CO2 affect Oysters?”.
Education 13 00496 g001
Figure 2. Example of Coding of an Explanatory Model.
Education 13 00496 g002
Figure 3. An Example of an Explanatory Model with an Extensively Cohesive Explanation.
Education 13 00496 g003
Figure 4. An Example of an Explanatory Model with Sufficiently Cohesive Explanation.
Education 13 00496 g004
Figure 5. An Example of an Explanatory Model with “Partially” Cohesive Explanation.
Education 13 00496 g005
Figure 6. An Example of an Explanatory Model with Insufficiently Cohesive Explanation.
Education 13 00496 g006
Figure 7. Examples of Students’ Representations of Impacts Ocean Acidification Across Systems of Atmosphere, Marine Life, And Terrestrial Life (The different sub numbers (e.g., i., ii, iii…) indicate that these representations come from different student models. Authors combined the different parts from a single model to build coherent visual in iii, iv, and v.
Education 13 00496 g007
Table 1. Demographic of Science Classes Participated in the Study.
Teacher
Pseudonym
Grade and Course Type# Student- Groups Creating
Explanatory Models
School LocationDemographics (Percentages) of Student Population
WhiteAsianAfrican AmericanHispanicAmerican IndianHI/
Pac. Isl. a
Two/More Races
Avery97Rural81.01.18.26.8002.7
Denmark75Suburban49.65.825.213.2005.6
Dylan8/8GT b6/7Urban1.00.293.94.60.10.20.2
Haverford76Suburban2.12.488.23.90.203.3
Kelsey613Suburban49.65.825.213.2005.6
Libby621Urban53.25.017.617.8006.1
Lopez8 Honors8Suburban82.54.93.06.9002.2
Munz9–12 AP c11Rural78.607.19.2004.2
Sandoval8 GT Env. d5Suburban19.34.562.69.5003.5
Smith66Suburban82.60.07.25.1003.1
Thomas10/10 Inc. e6/38Suburban82.72.45.54.5004.3
Williams911Rural90.51.32.02.4003.4
# stands for Number, a HI/Pac. Isl. stands for Hawaiian/Pacific Islander, b GT stands for Gifted and Talented, c AP stands for Advanced Placement, d Env. stands for Environmental, e Inc. stands for Inclusive classrooms.
Table 2. Participants’ Years of Teaching Experience in Science and in Climate Change.
TeacherYears TeachingExperience Teaching Climate Change
Avery23No
Denmark17Yes
Dylan15No
Haverford7.5No
Kelsey10No
Libby8No
Lopez7No
Munz12No
Sandoval16Yes
Smith17No
Thomas17No
Williams11Yes
Table 3. Frequencies of Key Ideas and their Modalities in Explanatory Models.
Key Ideas# Explanatory Models
(Out of 150)
DrawnWrittenDrawn & WrittenData TableDrawn & Written & Data TableWritten & Data Table# Total Codes
(Out of 1928)
Energy Expenditure in Shell Building145127189146101464
CO2 Amounts131112229115002458
pH and Acidification1173021777917341
Carbonate Availability85528435135180
Source of CO274683344000145
Chemistry of Shell Building71117350113139
Carbon Cycle65325140000123
Oysters Filter Water412522400078
# stands for “Number”.
Table 4. Scientific Representations Used in Explanatory Models.
Key IdeasMolecular FormulaWritten Molecule/
Element Names
Arrows for Processes and RelationshipKey or LabelChemical Reaction FormulasDots For MoleculesCircles as Molecules
CO2 Amounts4912118229
pH and Acidification62301332218
Carbon Cycle96221112
Chemistry of Shell Building3253444011
Energy Expenditure in Shell Building2344814307
Oysters Filter Water1111011
Carbonate Availability204842507
Source of CO25176000
Total # of Scientific Representations201195703937545
# stands for “Number”.
Table 5. Levels of Cohesiveness for Exploratory Models with Descriptions and Examples.
Levels of Cohesiveness for Explanatory ModelsDescription of Model Characteristics for (1) Responding to Phenomena, (2) Key Ideas, (3) Connections between Key IdeasExample
Explanatory Models with Extensive ExplanationModels in the ‘Extensive’ category communicated accurately, and with enough detail, the phenomena in response to the driving question. To communicate a coherent, cohesive, sequential, and gapless explanation, the models included evidence from activities to support almost all key ideas and showed clear connections among these key ideas. Figure 3
Models with Sufficient ExplanationSimilar to the ‘Extensive’ category, models categorized as ‘Sufficient’ included mostly complete explanations of the driving question. However, unlike the ‘Extensive’ categories, these models lacked and/or misrepresented more than one key idea. They also tended to include fewer pieces of evidence from the module’s activities. Figure 4
Models with Partial ExplanationThese models demonstrate a ‘Partial’ level of cohesiveness when explaining the phenomena to answer the driving question. Models in this category provide a ‘Partial’ explanation and generally only respond to one of the two investigative questions of the module. More than a few key ideas may be missing and/or student representations of these ideas might not align with the scientific findings. Furthermore, these models miss critical connections among key ideas which generally lead to gaps in their explanations. Figure 5
Models with Insufficient ExplanationThe models in this category did not provide a sufficiently cohesive explanation of the phenomena. Very few key ideas were present and/or the scientific ideas were mostly disconnected.Figure 6
Disclaimer/Publisher’s Note: The statements, opinions and data contained in all publications are solely those of the individual author(s) and contributor(s) and not of MDPI and/or the editor(s). MDPI and/or the editor(s) disclaim responsibility for any injury to people or property resulting from any ideas, methods, instructions or products referred to in the content.

