
Why Do Students Attend STEM Clubs, What Do They Get Out of It, and Where Are They Heading?

Abstract
:1. Introduction
1.1. Benefits of Afterschool STEM Programs
1.2. Equity Pedagogies
1.3. Future Goals
1.4. Focus of Current Study
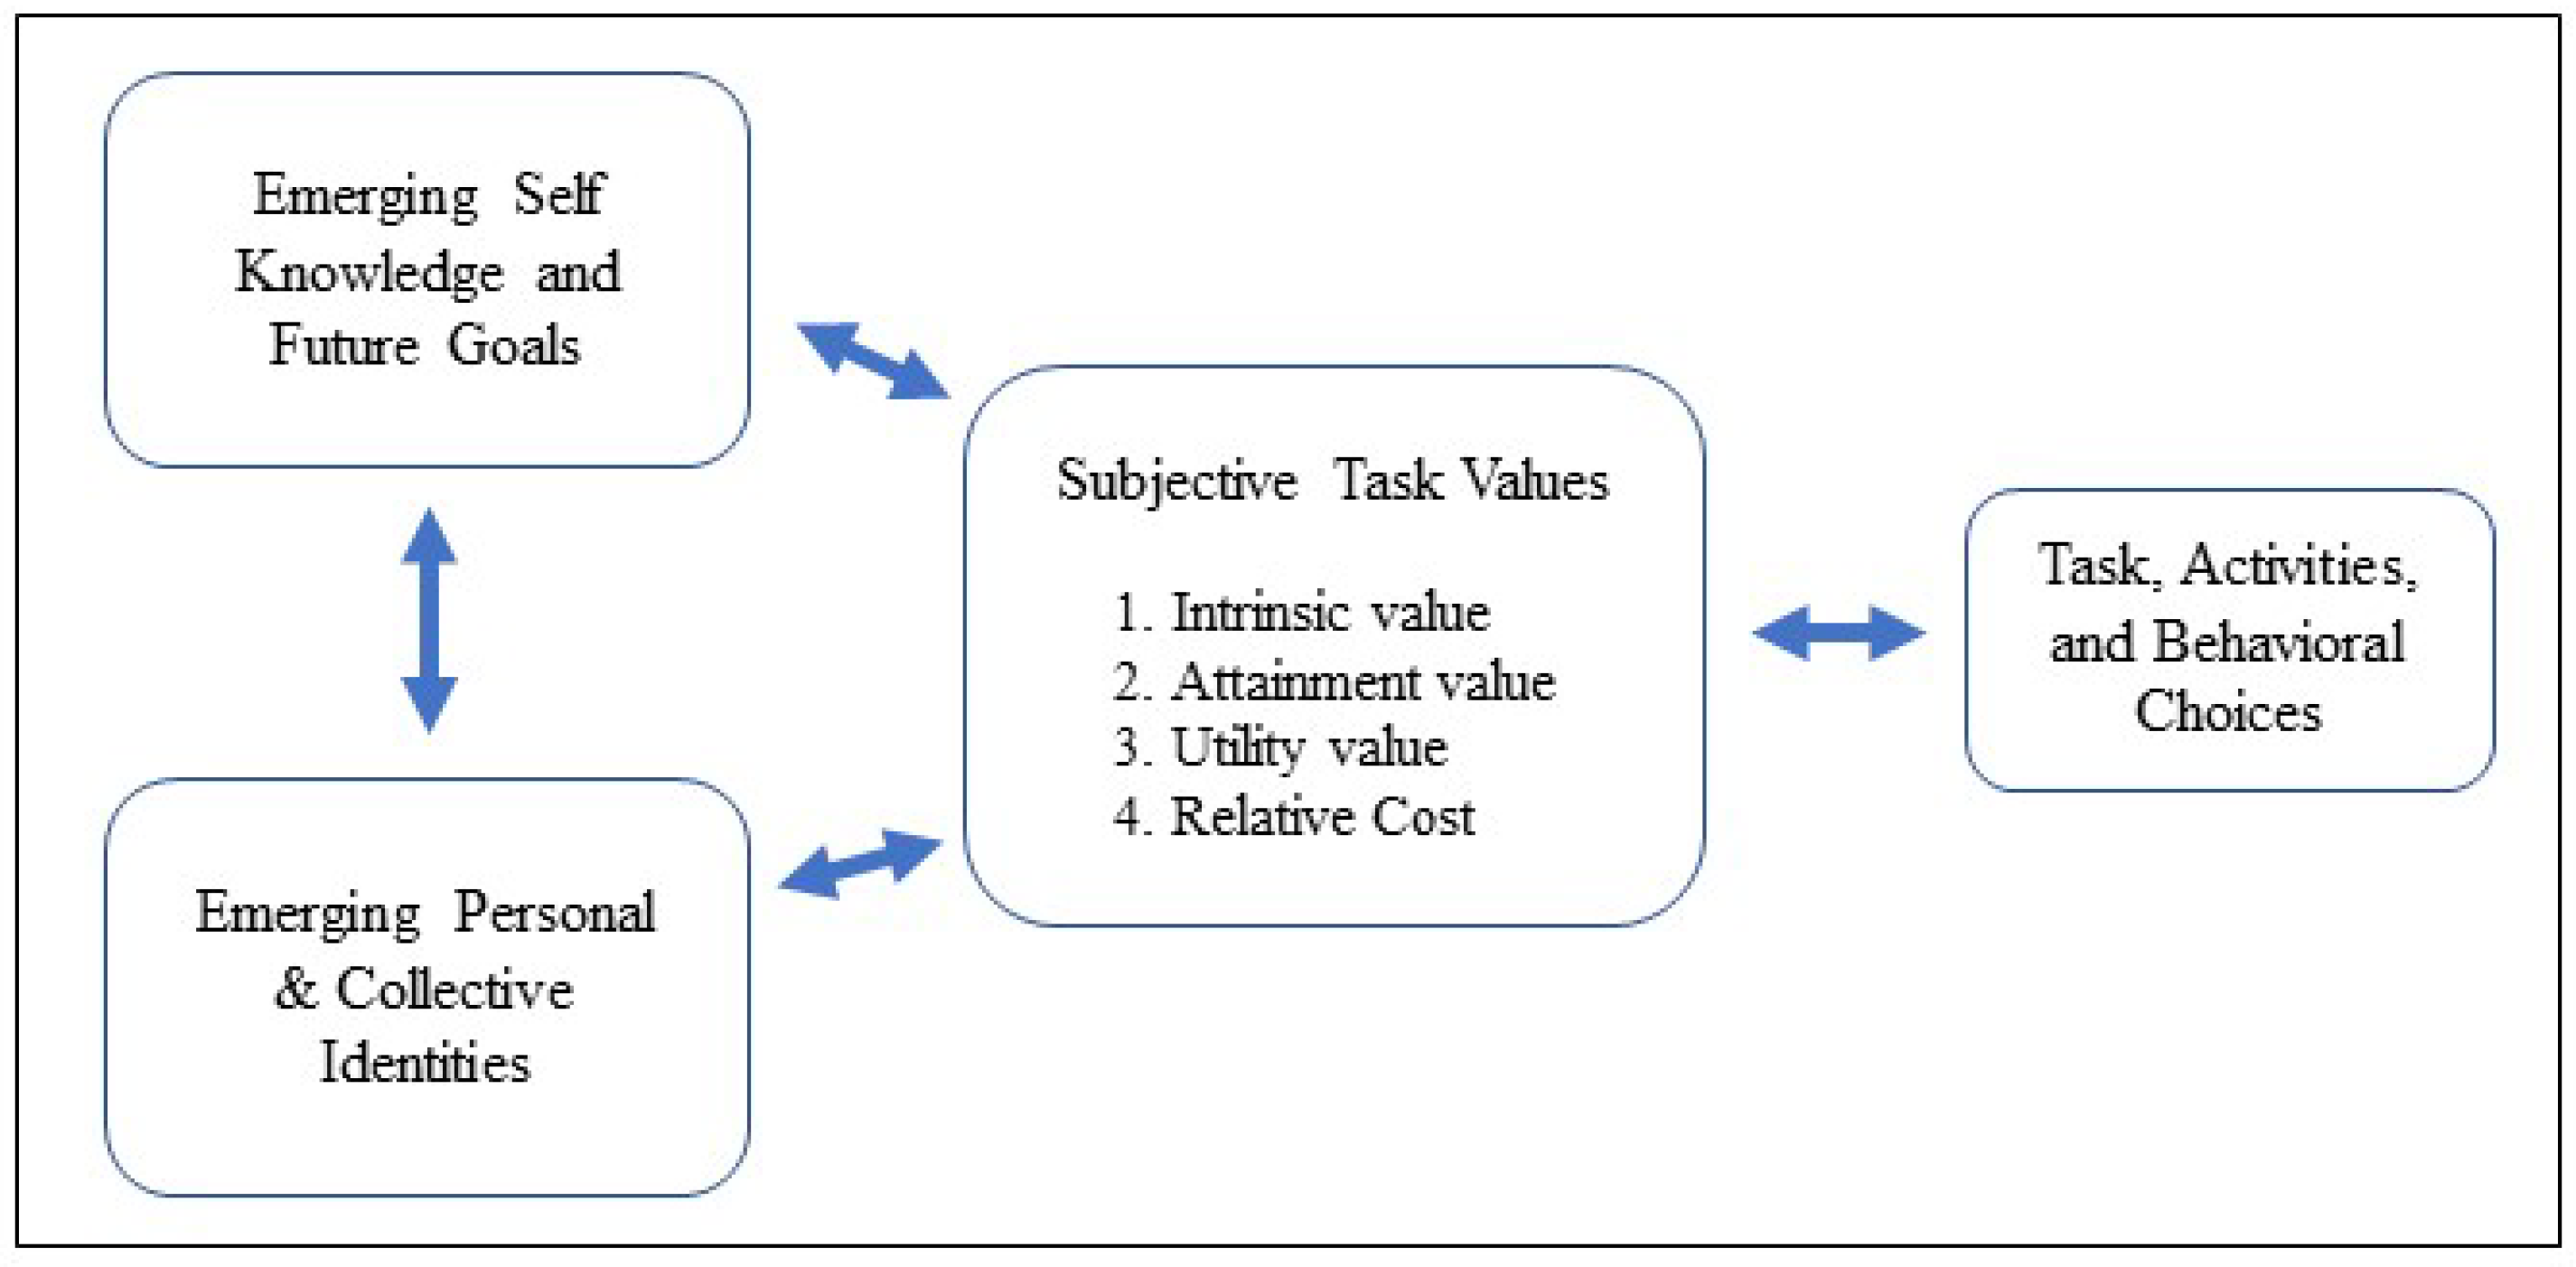
1.5. Theoretical Framework

1.5.1. Intrinsic Value
1.5.2. Attainment Value
1.5.3. Utility Value
1.5.4. Cost
1.5.5. Identity
1.6. Summary
1.7. Research Questions
- How can students’ choices to participate in clubs and their perceptions of the clubs be characterized?
- What were participants’ patterns of attendance?
- What were participants’ perceptions of the STEM clubs?
- What did participants believe was the purpose of the STEM club?
- What motivated students’ STEM club attendance and participation?
- What were students’ post-secondary and future career goals?
2. Materials and Methods
2.1. Research Design
2.2. Context
2.3. Participants
2.3.1. Middle School Participants
2.3.2. Teacher Coaches
2.3.3. Comparing Teacher Coach and Student Demographics
2.4. Data Collection and Analyses
2.4.1. STEM Club Attendance
2.4.2. STEM Club Survey
2.4.3. Student Interviews
3. Results
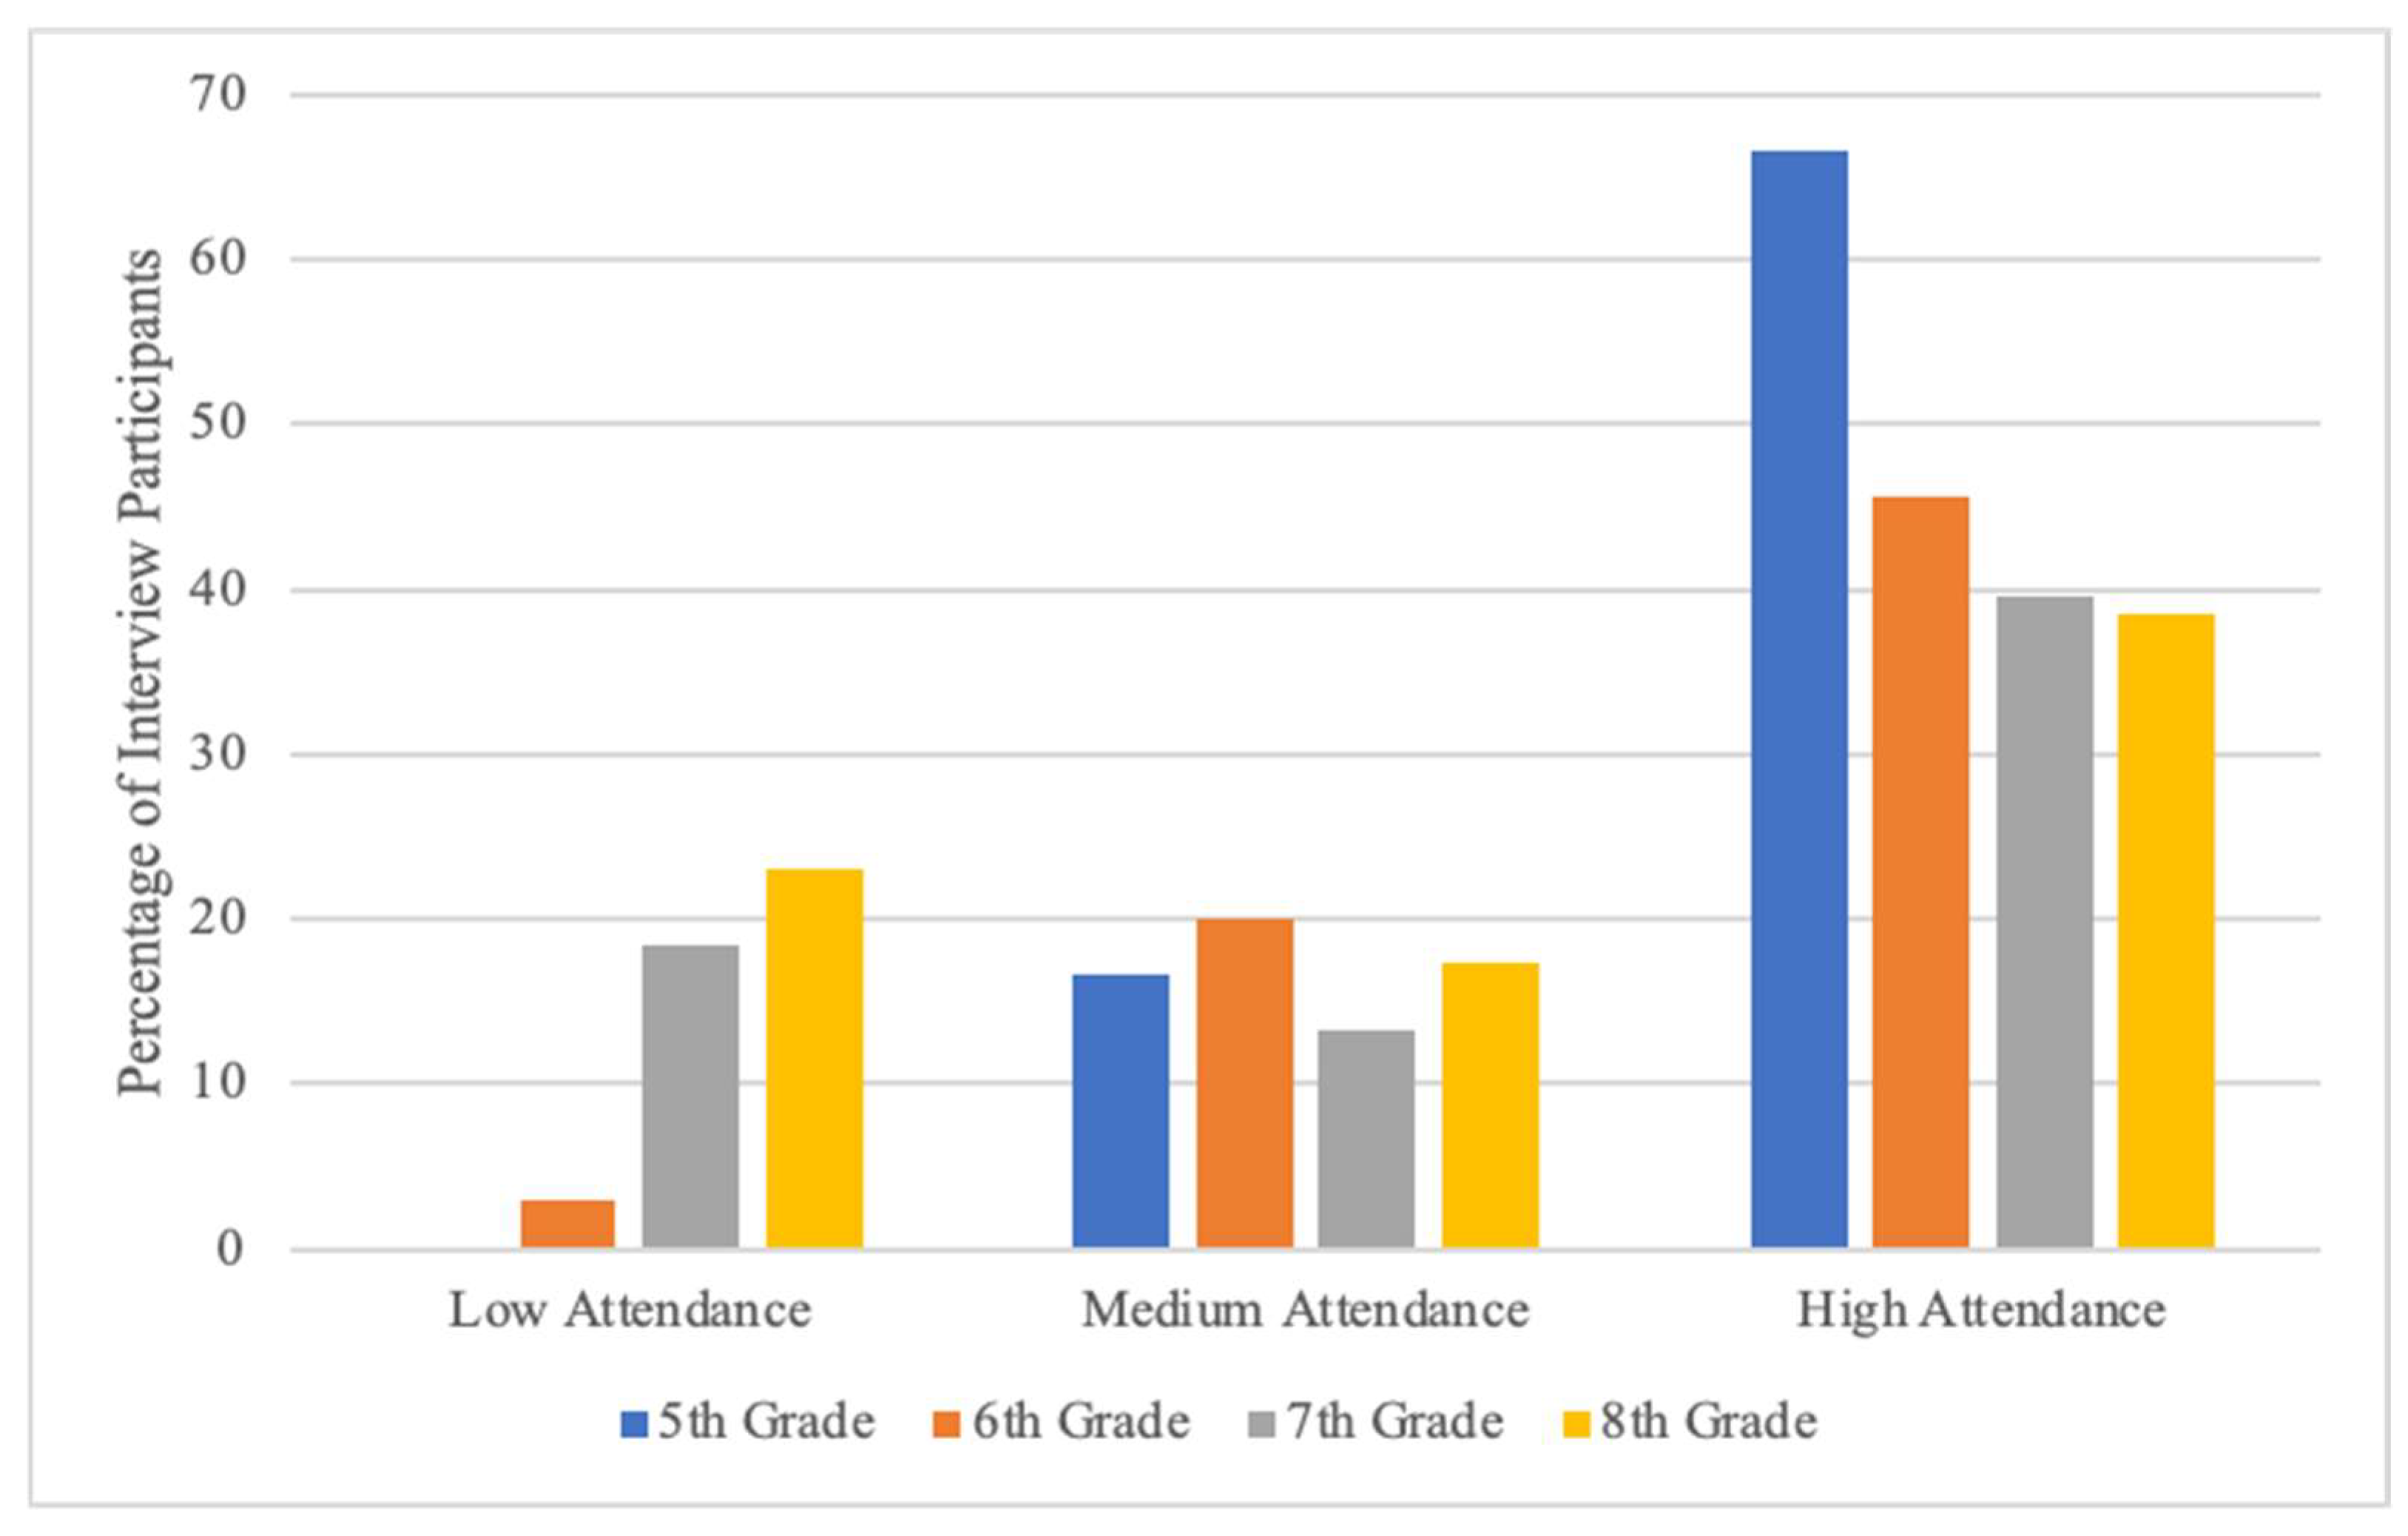
3.1. Patterns of STEM Club Attendance
3.2. STEM Club Survey Item Analysis
3.3. Purpose of STEM Clubs
3.4. What Interviews Revealed about Students’ Motivations for Attending STEM Clubs
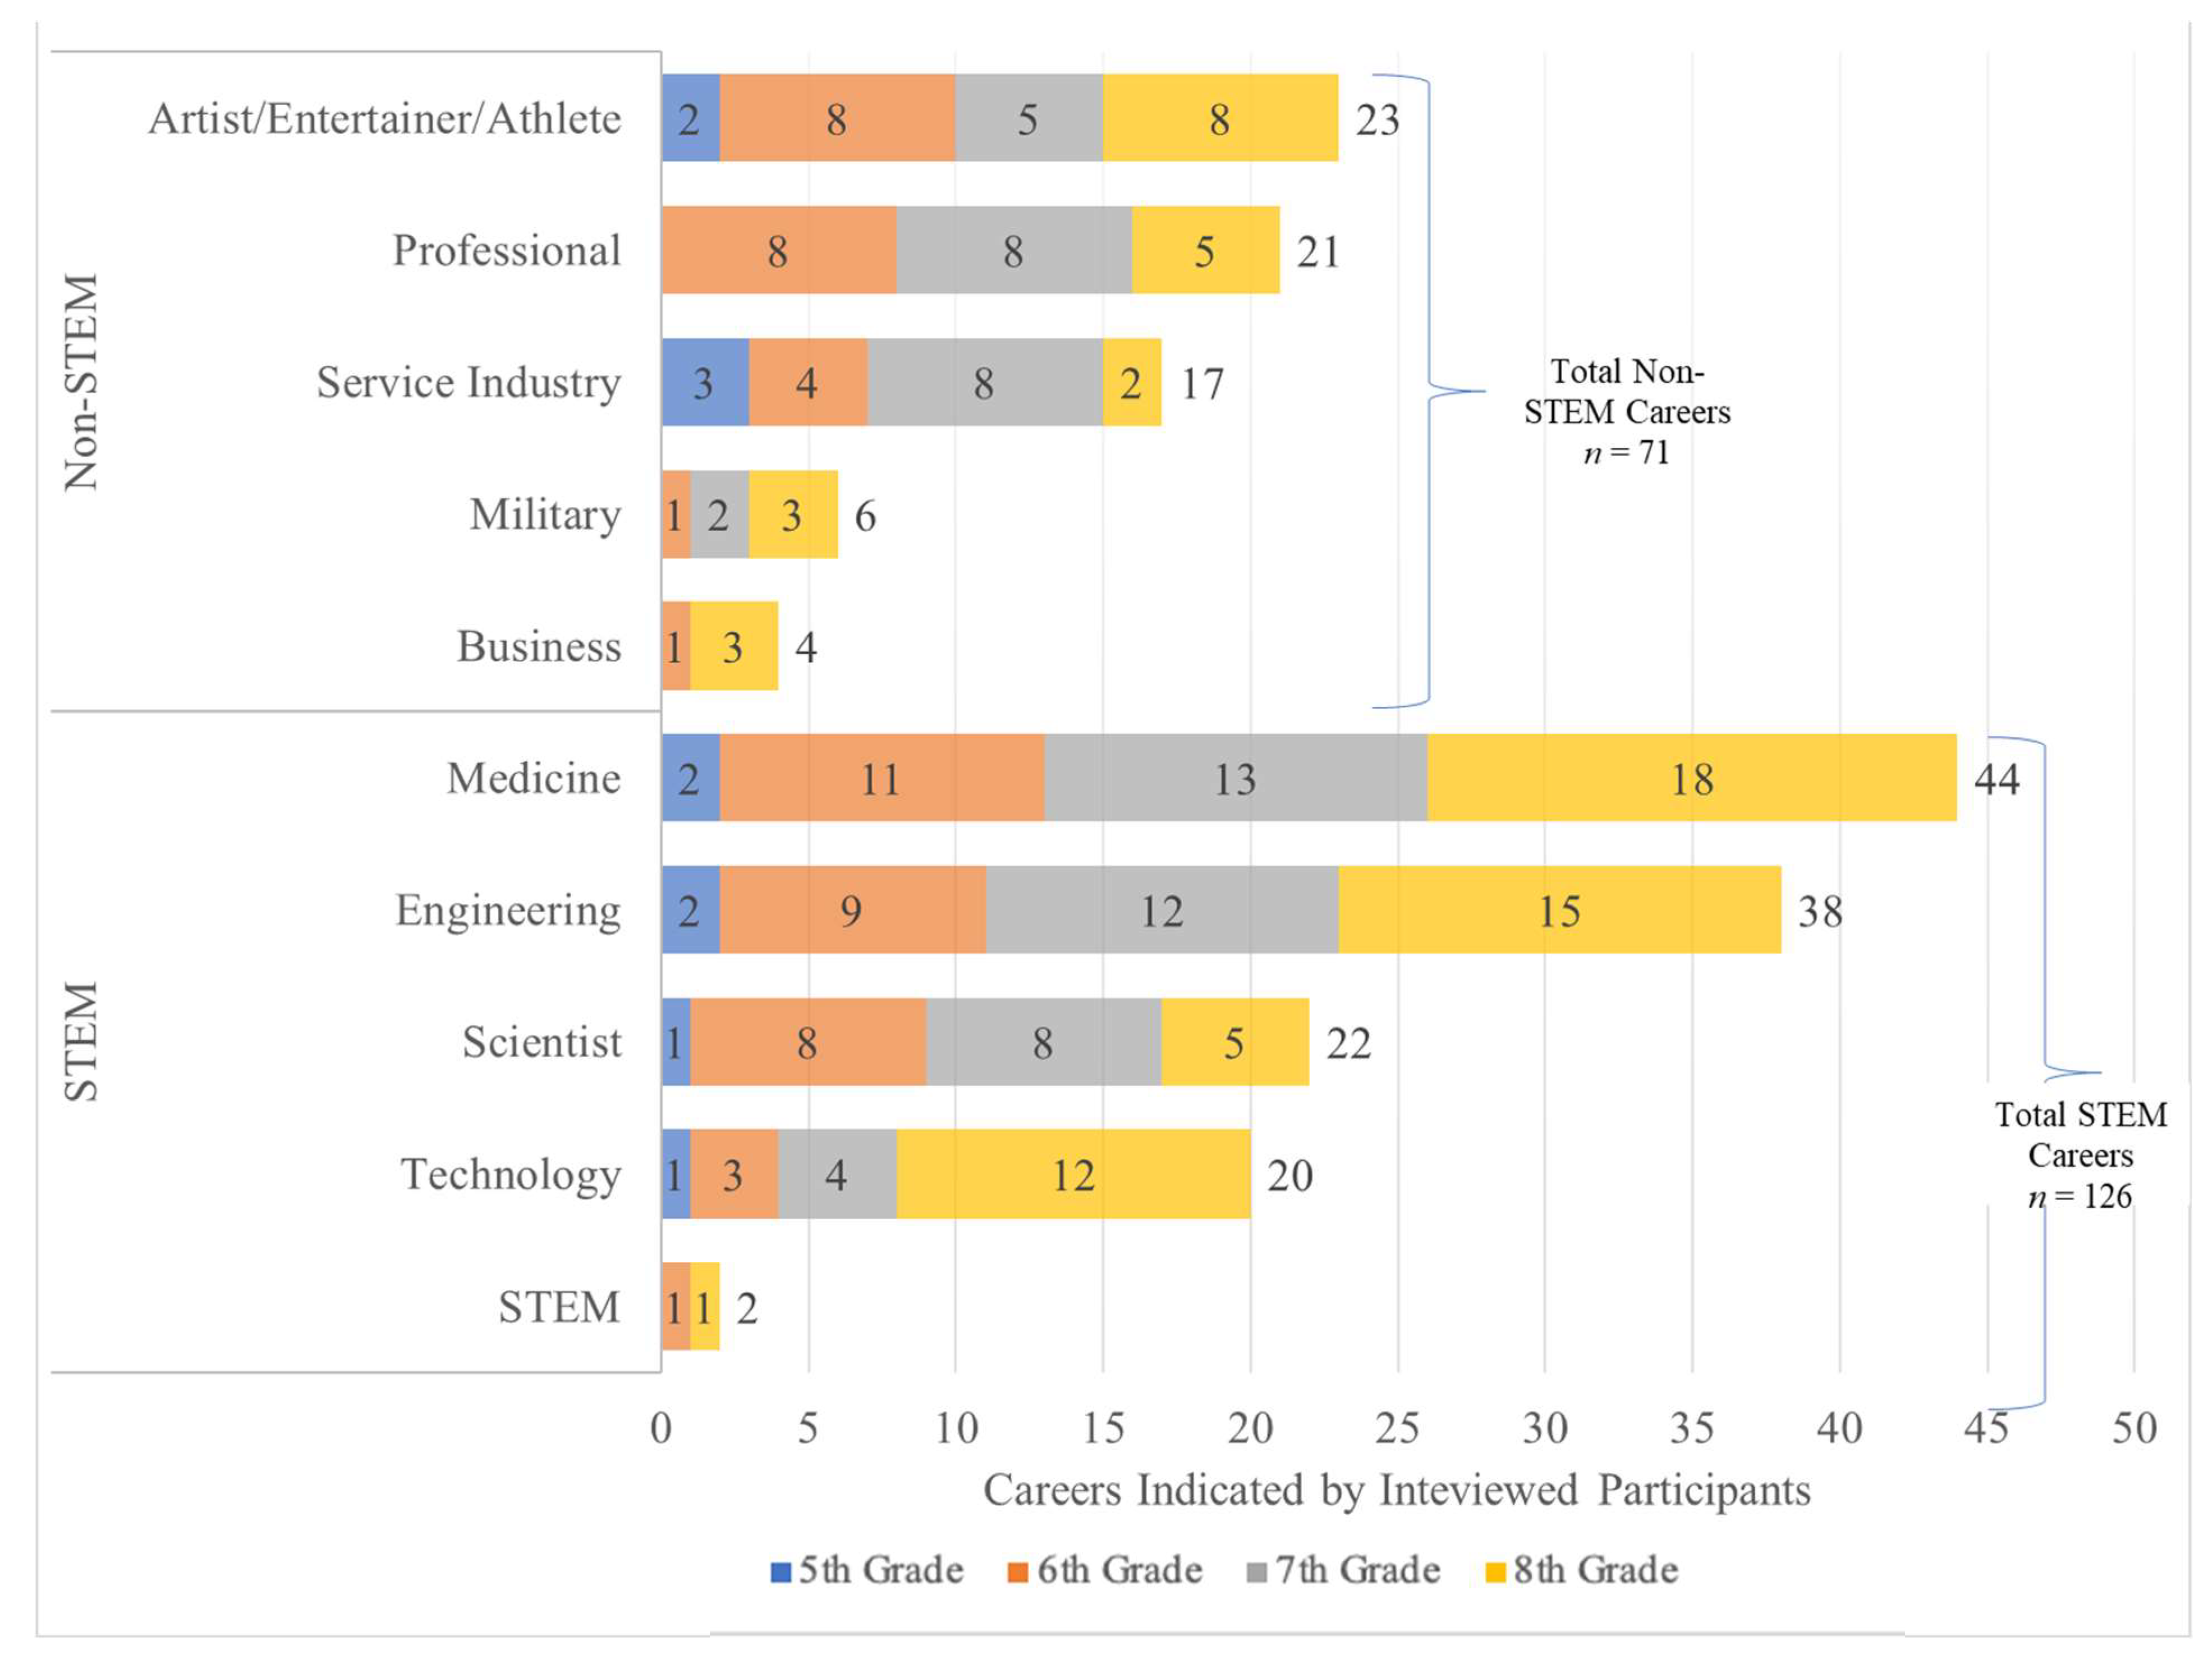
3.5. Post-Secondary Education and Future Career Goals
3.5.1. Post-Secondary Education
3.5.2. Future Careers
4. Discussion
Limitations
5. Conclusions and Recommendations
5.1. Conclusions
- The group work met the social needs of students and also developed many personal skills and a sense of identity as a club member.
- Students talked in depth about education and career pathways and future goals, suggesting the value of linking careers and pathways to each of the activities.
- The culture of the club and its leaders seemed to resonate with all students, based on strong continued attendance and the high participation of African American students.
- Students clearly differentiated between their club experiences and regular school, describing the clubs as more valuable and their interactions with teachers as more positive.
5.2. Recommendations
Author Contributions
Funding
Institutional Review Board Statement
Informed Consent Statement
Data Availability Statement
Acknowledgments
Conflicts of Interest
References
- Hoachlander, G.; Yanofsky, D. Making STEM Real. Educ. Leadersh. 2011, 68, 60–65. [Google Scholar]
- McCrea, B. Engaging Girls in STEM. ET J. 2010. Available online: https://thejournal.com/articles/2010/09/08/engaging-girls-in-stem.aspx (accessed on 4 April 2023).
- Bellanca, J.A.; Brandt, R.S. (Eds.) 21st Century Skills: Rethinking How Students Learn; Leading Edge; Solution Tree Press: Bloomington, IN, USA, 2010; ISBN 978-1-935249-90-0. [Google Scholar]
- Gutierrez, K.S.; Blanchard M., R.; Busch, K.C. What Effective Design Strategies Do Rural, Underserved Students in STEM Clubs Value while Learning about Climate Change? Environ. Educ. Res. 2022, 28, 1043–1069. [Google Scholar] [CrossRef]
- Krishnamurthi, A.; Ottinger, R.; Topol, T. STEM Learning in Afterschool and Summer Programming: An Essential Strategy for STEM Education Reform. 2013. Available online: https://www.expandinglearning.org/sites/default/files/em_articles/2_stemlearning.pdf (accessed on 4 April 2023).
- Blanchard, M.R.; Gutierrez, K.S.; Swanson, K.J. Professional Development to Prepare Teacher-Coaches for Students from Culturally Diverse Groups in After-School STEM Clubs. In International Handbook of Research on Multicultural Science Education; Atwater, M.M., Ed.; Springer International Handbooks of Education; Springer Publishing: New York, NY, USA, 2021. [Google Scholar] [CrossRef]
- Durlak, J.A.; Weissberg, R.P. The Impact of After-School Programs That Promote Personal and Social Skills; Collaborative for Academic, Social, and Emotional Learning: Chicago, IL, USA, 2007. [Google Scholar]
- Vandell, D.L.; Reisner, E.R.; Pierce, K.M. Outcomes Linked to High-Quality Afterschool Programs: Longitudinal Findings from the Study of Promising Afterschool Programs; Policy Studies Associates, Inc.: Washington, DC, USA, 2007. [Google Scholar]
- Mahoney, J.L.; Cairns, B.D.; Farmer, T.W. Promoting Interpersonal Competence and Educational Success through Extracurricular Activity Participation. J. Educ. Psychol. 2003, 95, 409–418. [Google Scholar] [CrossRef]
- Abernathy, T.V.; Vineyard, R.N. Academic Competitions in Science: What Are the Rewards for Students? Clear. House J. Educ. Strateg. Issues Ideas 2001, 74, 269–276. [Google Scholar] [CrossRef]
- Eccles, J.S.; Harold, R.D. Family Involvement in Children’s and Adolescents’ Schooling. In Family-School Links: How Do They Affect Educational Outcomes? Booth, A., Dunn, J.F., Eds.; Lawrence Erlbaum Associate, Inc.: Mahwah, NJ, USA, 1996; pp. 3–35. [Google Scholar]
- Epstein, J.L.; Coates, L.; Salinas, K.; Sanders, M.G.; Simon, B.S. Epstein’s Framework of Six Types of Involvement; Center for the Social Organization of Schools: Baltimore, MD, USA, 2005. [Google Scholar]
- Blanchard, M.R.; Collier, K.M.; Farland-Smith, D.; Topliceanu, A.M. Investigating the Effects of an At-Home, Justice-Centered STEM Curriculum: A Pilot Study. In Proceedings of the 2023 NARST Annual International Conference, Chicago, IL, USA, 18–21 April 2023. [Google Scholar]
- Saw, G.K.; Agger, C.A. STEM Pathways of Rural and Small-Town Students: Opportunities to Learn, Aspirations, Preparation, and College Enrollment. Educ. Res. 2021, 50, 595–606. [Google Scholar] [CrossRef]
- Hill, P.W.; McQuillan, J.; Hebets, E.A.; Spiegel, A.N.; Diamond, J. Informal Science Experiences among Urban and Rural Youth: Exploring Differences at the Intersections of Socioeconomic Status, Gender and Ethnicity. J. STEM Outreach 2018, 1, 1. [Google Scholar] [CrossRef]
- Carrico, C.; Matusovich, H.M.; Paretti, M.C. A Qualitative Analysis of Career Choice Pathways of College-Oriented Rural Central Appalachian High School Students. J. Career Dev. 2019, 46, 94–111. [Google Scholar] [CrossRef]
- Darling-Hammond, L. Can Value Added Add Value to Teacher Evaluation? Educ. Res. 2015, 44, 132–137. [Google Scholar] [CrossRef]
- Kier, M.W.; Khalil, D. Exploring How Digital Technologies Can Support Co-Construction of Equitable Curricular Resources in STEM. Int. J. Educ. Math. Sci. Technol. 2018, 6, 105–121. [Google Scholar] [CrossRef]
- Gutierrez, K.S.; Beck, J.S.; Hinton, K.; Rippard, K.S.; Suh, Y. DevelopingTeacher Candidates’ Multicultural Lenses through Disciplinary Writing Assignments. Teach. Educ. 2022, 57, 386–408. [Google Scholar] [CrossRef]
- Banks, J.A. Cultural Diversity and Education: Foundations, Curriculum, and Teaching; Routledge: Oxford, UK, 2015; ISBN 978-1-317-22246-0. [Google Scholar]
- Gay, G.; Kirkland, K. Developing Cultural Critical Consciousness and Self-Reflection in Preservice Teacher Education. Theory Pract. 2003, 42, 181–187. [Google Scholar] [CrossRef]
- Ladson-Billings, G. The Dreamkeepers: Successful Teachers of African American Children. Harv. Educ. Rev. 1994, 64, 488. [Google Scholar]
- Ladson-Billings, G. Toward a Theory of Culturally Relevant Pedagogy. Am. Educ. Res. J. 1995, 32, 465–491. [Google Scholar] [CrossRef]
- Ladson-Billings, G. Culturally Relevant Pedagogy 2.0: A.k.a. the Remix. Harv. Educ. Rev. 2014, 84, 74–84. [Google Scholar] [CrossRef]
- Paris, D. Culturally Sustaining Pedagogy: A Needed Change in Stance, Terminology, and Practice. Educ. Res. 2012, 41, 93–97. [Google Scholar] [CrossRef]
- Bourdieu, P.; Richardson, J.G. Handbook of Theory and Research for the Sociology of Education. Forms Cap. 1986, 241, 258. [Google Scholar]
- Brown, B.A.; Mangram, C.; Sun, K.; Cross, K.; Raab, E. Representing Racial Identity: Identity, Race, the Construction of the African American STEM Students. Urban Educ. 2017, 52, 170–206. [Google Scholar] [CrossRef]
- Fuesting, M.A.; Diekman, A.B. Not By Success Alone: Role Models Provide Pathways to Communal Opportunities in STEM. Pers. Soc. Psychol. Bull. 2017, 43, 163–176. [Google Scholar] [CrossRef]
- Eddy, C.M.; Easton-Brooks, D. Ethnic Matching, School Placement, and Mathematics Achievement of African American Students from Kindergarten through Fifth Grade. Urban Educ. 2011, 46, 1280–1299. [Google Scholar] [CrossRef]
- Johnson, D.W. “I Am Not a Statistic”: Identities of African American Males in Advanced Science Courses; North Carolina State University: Raleigh, NC, USA, 2014; Available online: http://www.lib.ncsu.edu/resolver/1840.16/9954 (accessed on 4 April 2023).
- Kier, M.W.; Blanchard, M.R. Eliciting Middle School Students’ Voices Through STEM Career Explorations. Int. J. Sci. Math. Educ. 2021, 19, 151–169. [Google Scholar] [CrossRef]
- Ladson-Billings, G. But That’s Just Good Teaching! The Case for Culturally Relevant Pedagogy. Theory Pract. 1995, 34, 159–165. [Google Scholar] [CrossRef]
- Gottfried, M.A.; Williams, D. STEM Club Participation and STEM Schooling Outcomes. Educ. Policy Anal. Arch. 2013, 21, 79. [Google Scholar] [CrossRef]
- Hartley, M.S. Science Clubs: An Underutilised Tool for Promoting Science Communication Activities in School. In Communicating Science to the Public: Opportunities and Challenges for the Asia-Pacific Region; Hin, L.T.W., Subramaniam, R., Eds.; Springer Dordrecht: Berlin, Germany, 2014; pp. 21–31. [Google Scholar]
- Blanchard, M.R.; LePrevost, C.E.; Tolin, A.D.; Gutierrez, K.S. Investigating technology-enhanced teacher professional development in rural, high poverty middle schools. Educ. Res. 2016, 43, 207–220. [Google Scholar] [CrossRef]
- Christensen, R.; Knezek, G. Relationship of Middle School Student STEM Interest to Career Intent. J. Educ. Sci. Environ. Health 2017, 3, 1–13. [Google Scholar] [CrossRef]
- Wang, M.-T.; Degol, J. Motivational Pathways to STEM Career Choices: Using Expectancy–Value Perspective to Understand Individual and Gender Differences in STEM Fields. Dev. Rev. 2013, 33, 304–340. [Google Scholar] [CrossRef]
- Pang, V.O.; Stein, R.; Gomez, M.; Matas, A.; Shimogori, Y. Cultural Competencies: Essential Elements of Caring-Centered Multicultural Education. Action Teach. Educ. 2011, 33, 560–574. [Google Scholar] [CrossRef]
- Barker, B.S.; Nugent, G.; Grandgenett, N.F. Examining Fidelity of Program Implementation in a STEM-Oriented out-of-School Setting. Int. J. Technol. Des. Educ. 2014, 24, 39–52. [Google Scholar] [CrossRef]
- Fuesting, M.A.; Diekman, A.B.; Hudiburgh, L. From Classroom to Career: The Unique Role of Communal Processes in Predicting Interest in STEM Careers. Soc. Psychol. Educ. 2017, 20, 875–896. [Google Scholar] [CrossRef]
- Carnevale, A.P.; Smith, N. Balancing Work and Learning: Implications for Low-Income Students; Georgetown University Library: Washington, DC, USA, 2018. [Google Scholar]
- Sahin, A. STEM Clubs and Science Fair Competitions: Effects on Post-Secondary Matriculation. J. STEM Educ. Innov. Res. 2013, 14, 5–11. Available online: https://www.jstem.org/jstem/index.php/JSTEM/article/view/1781/1504 (accessed on 4 April 2023).
- Desimone, L.M. Improving Impact Studies of Teachers’ Professional Development: Toward Better Conceptualizations and Measures. Educ. Res. 2009, 38, 181–199. [Google Scholar] [CrossRef]
- Tinkler, B.; Tinkler, A. Experiencing the Other: The Impact of Service-Learning on Preservice Teachers’ Perceptions of Diversity. Teach. Educ. Q. 2013, 40, 41–62. [Google Scholar]
- Gay, G. Culturally Responsive Teaching: Theory, Research, and Practice; Teachers College Press: New York, NY, USA, 2018. [Google Scholar]
- Lewis Chiu, C.; Sayman, D.; Carrero, K.M.; Gibbon, T.; Zolkoski, S.M.; Lusk, M.E. Developing Culturally Competent Preservice Teachers. Multicult. Perspect. 2017, 19, 47–52. [Google Scholar] [CrossRef]
- Grant, C.A. An Essay on Searching for Curriculum and Pedagogy for African American Students: Highlighted Remarks Regarding the Role of Gender. Am. Behav. Sci. 2008, 51, 885–906. [Google Scholar] [CrossRef]
- Meaney, K.S.; Bohler, H.R.; Kopf, K.; Hernandez, L.; Scott, L.S. Service-Learning and Pre-Service Educators’ Cultural Competence for Teaching: An Exploratory Study. J. Exp. Educ. 2008, 31, 189–208. [Google Scholar] [CrossRef]
- Stevens, S.E. Is There an Ethical Duty? Cultural Competency. Or. State Bar Bull. 2009, 69, 9–10. Available online: https://www.osbar.org/publications/bulletin/09jan/barcounsel.html (accessed on 4 April 2023).
- Definitions of Multicultural Education—National Association for Multicultural Education. Available online: https://www.nameorg.org/definitions_of_multicultural_e.php (accessed on 4 April 2023).
- Baran, E.; Canbazoglu Bilici, S.; Mesutoglu, C.; Ocak, C. The Impact of an Out-of-School STEM Education Program on Students’ Attitudes toward STEM and STEM Careers. Sch. Sci. Math. 2019, 119, 223–235. [Google Scholar] [CrossRef]
- Carter, P.L.; Welner, K.G. Closing the Opportunity Gap: What America Must Do to Give Every Child an Even Chance; Oxford University Press: Oxford, UK, 2013. [Google Scholar]
- Blanchard, M.R.; Gutierrez, K.S.; Habig, B.; Gupta, P.; Adams, J. Informal STEM program learning. In Handbook of Research on STEM Education; Johnson, C., Mohr-Schroeder, M., Moore, T., English, L., Eds.; Routledge/Taylor & Francis: Abingdon, UK, 2020; pp. 138–151. [Google Scholar] [CrossRef]
- Kricorian, K.; Seu, M.; Lopez, D.; Ureta, E.; Equils, O. Factors Influencing Participation of Underrepresented Students in STEM Fields: Matched Mentors and Mindsets. Int. J. STEM Educ. 2020, 7, 16. [Google Scholar] [CrossRef]
- Chittum, J.R.; Jones, B.D.; Akalin, S.; Schram, Á.B. The Effects of an Afterschool STEM Program on Students’ Motivation and Engagement. Int. J. STEM Educ. 2017, 4, 1–16. [Google Scholar] [CrossRef]
- Dabney, K.P.; Tai, R.H.; Almarode, J.T.; Miller-Friedmann, J.L.; Sonnert, G.; Sadler, P.M.; Hazari, Z. Out-of-School Time Science Activities and Their Association with Career Interest in STEM. Int. J. Sci. Educ. Part B 2012, 2, 63–79. [Google Scholar] [CrossRef]
- Wigfield, A.; Eccles, J.S. Chapter Five—35 Years of Research on Students’ Subjective Task Values and Motivation: A Look Back and a Look Forward. In Advances in Motivation Science; Elliot, A.J., Ed.; Elsevier: Amsterdam, The Netherlands, 2020; Volume 7, pp. 161–198. [Google Scholar] [CrossRef]
- Eccles, J. Who Am I and What Am I Going to Do with My Life? Personal and Collective Identities as Motivators of Action. Educ. Psychol. 2009, 44, 78–89. [Google Scholar] [CrossRef]
- Eccles, J. Expectancies, Values and Academic Behaviors. In Achievement and Achievement Motives: Psychological and Sociological Approaches; Spence, J.T., Ed.; Free man: San Francisco, CA, USA, 1983; pp. 75–146. [Google Scholar]
- Wigfield, A.; Eccles, J.S. The Development of Achievement Task Values: A Theoretical Analysis. Dev. Rev. 1992, 12, 265–310. [Google Scholar] [CrossRef]
- Wigfield, A.; Eccles, J.S. Expectancy–Value Theory of Achievement Motivation. Contemp. Educ. Psychol. 2000, 25, 68–81. [Google Scholar] [CrossRef] [PubMed]
- Eccles, J.S.; Wigfield, A. Motivational Beliefs, Values, and Goals. Annu. Rev. Psychol. 2002, 53, 109–132. [Google Scholar] [CrossRef] [PubMed]
- Lee, H.-C.; Blanchard, M.R. Why Teach with PBL? Motivational Factors Underlying Secondary Teachers’ Use of Problem-Based Learning. Interdiscip. J. Probl.-Based Learn. 2019, 13, 1. [Google Scholar] [CrossRef]
- Ryan, R.M.; Deci, E.L. Intrinsic and Extrinsic Motivations: Classic Definitions and New Directions. Contemp. Educ. Psychol. 2000, 25, 54–67. [Google Scholar] [CrossRef] [PubMed]
- Ryan, R.M.; Deci, E.L. Self-Determination Theory and the Facilitation of Intrinsic Motivation, Social Development, and Well-Being. Am. Psychol. 2000, 55, 68–78. [Google Scholar] [CrossRef] [PubMed]
- Eccles, J.S.; Wigfield, A. In the Mind of the Actor: The Structure of Adolescents’ Achievement Task Values and Expectancy-Related Beliefs. Pers. Soc. Psychol. Bull. 1995, 21, 215–225. [Google Scholar] [CrossRef]
- Nasir, N.S. Identity, Goals, and Learning: Mathematics in Cultural Practice. Math. Think. Learn. 2002, 4, 213–247. [Google Scholar] [CrossRef]
- Creswell, J.W.; Clark, V.L.P. Designing and Conducting Mixed Methods Research; SAGE Publications: Thousand Oaks, CA, USA, 2017; ISBN 978-1-4833-4701-1. [Google Scholar]
- DeCuir-Gunby, J.T.; Schutz, P.A. (Eds.) Race and Ethnicity in the Study of Motivation in Education; Routledge: New York, NY, USA, 2016; ISBN 978-1-315-71690-9. [Google Scholar]
- Pole, K. Mixed Method Designs: A Review of Strategies for Blending Quantitative and Qualitative Methodologies. Mid-West. Educ. Res. 2007, 20, 35–38. [Google Scholar]
- Greene, J.C. The Generative Potential of Mixed Methods Inquiry. Int. J. Res. Method Educ. 2005, 28, 207–211. [Google Scholar] [CrossRef]
- Monroe, M.C.; Plate, R.R.; Oxarart, A.; Bowers, A.; Chaves, W.A. Identifying Effective Climate Change Education Strategies: A Systematic Review of the Research. Environ. Educ. Res. 2019, 25, 791–812. [Google Scholar] [CrossRef]
- Ellis, M.V. Repeated Measures Designs. Couns. Psychol. 1999, 27, 552–578. [Google Scholar] [CrossRef]
- Fabrigar, L.R.; Wegener, D.T.; MacCallum, R.C.; Strahan, E.J. Evaluating the Use of Exploratory Factor Analysis in Psychological Research. Psychol. Methods 1999, 4, 272–299. [Google Scholar] [CrossRef]
- Costello, A.; Osborne, J. Best Practices in Exploratory Factor Analysis: Four Recommendations for Getting the Most from Your Analysis. Pract. Assess. Res. Eval. 2019, 10, 1. [Google Scholar] [CrossRef]
- Yong, A.G.; Pearce, S. A Beginner’s Guide to Factor Analysis: Focusing on Exploratory Factor Analysis. Tutor. Quant. Methods Psychol. 2013, 9, 79–94. [Google Scholar] [CrossRef]
- Ford, J.K.; MacCallum, R.C.; Tait, M. The Application of Exploratory Factor Analysis in Applied Psychology: A Critical Review and Analysis. Pers. Psychol. 1986, 39, 291–314. [Google Scholar] [CrossRef]
- Hu, L.; Bentler, P.M. Cutoff Criteria for Fit Indexes in Covariance Structure Analysis: Conventional Criteria versus New Alternatives. Struct. Equ. Model. Multidiscip. J. 1999, 6, 1–55. [Google Scholar] [CrossRef]
- Van Sonderen, E.; Sanderman, R.; Coyne, J.C. Ineffectiveness of Reverse Wording of Questionnaire Items: Let’s Learn from Cows in the Rain. PLoS ONE 2013, 8, e68967. [Google Scholar] [CrossRef]
- Schmitt, N.; Stuits, D.M. Factors Defined by Negatively Keyed Items: The Result of Careless Respondents? Appl. Psychol. Meas. 1985, 9, 367–373. [Google Scholar] [CrossRef]
- Schriesheim, C.A.; Eisenbach, R.J. An Exploratory and Confirmatory Factor-Analytic Investigation of Item Wording Effects on the Obtained Factor Structures of Survey Questionnaire Measures. J. Manag. 1995, 21, 1177–1193. [Google Scholar] [CrossRef]
- Patton, M.Q. Qualitative Research & Evaluation Methods: Integrating Theory and Practice; SAGE Publications: Thousand Oaks, CA, USA, 2014; ISBN 978-1-4833-0145-7. [Google Scholar]
- Hollman, A.K.; Hollman, T.J.; Shimerdla, F.; Bice, M.R.; Adkins, M. Information Technology Pathways in Education: Interventions with Middle School Students. Comput. Educ. 2019, 135, 49–60. [Google Scholar] [CrossRef]
- Shin, D.D.; Lee, M.; Ha, J.E.; Park, J.H.; Ahn, H.S.; Son, E.; Chung, Y.; Bong, M. Science for All: Boosting the Science Motivation of Elementary School Students with Utility Value Intervention. Learn. Instr. 2019, 60, 104–116. [Google Scholar] [CrossRef]
- Casillas, A.; Robbins, S.; Allen, J.; Kuo, Y.-L.; Hanson, M.A.; Schmeiser, C. Predicting Early Academic Failure in High School from Prior Academic Achievement, Psychosocial Characteristics, and Behavior. J. Educ. Psychol. 2012, 104, 407–420. [Google Scholar] [CrossRef]
- Yeager, D.S.; Walton, G.M. Social-Psychological Interventions in Education: They’re Not Magic. Rev. Educ. Res. 2011, 81, 267–301. [Google Scholar] [CrossRef]
- Sahin, A.; Waxman, H.C. Factors Affecting High School Students’ Stem Career Interest: Findings from A 4-Year Study. J. STEM Educ. Innov. Res. 2021, 22, 5–19. Available online: https://www.jstem.org/jstem/index.php/JSTEM/article/view/2472/2224 (accessed on 4 April 2023).
- Andrews, D.J.C.; Gutwein, M. “Maybe That Concept Is Still with Us”: Adolescents’ Racialized and Classed Perceptions of Teachers’ Expectations. Multicult. Perspect. 2017, 19, 5–15. [Google Scholar] [CrossRef]
- Griffin, D.; Galassi, J.P. Parent Perceptions of Barriers to Academic Success in a Rural Middle School. Prof. Sch. Couns. 2010, 14, 2156759X1001400109. [Google Scholar] [CrossRef]
- National Center for Education Statistics (NCES) Home Page, a Part of the U.S. Department of Education. Available online: https://nces.ed.gov/ (accessed on 4 April 2023).
- Guzey, S.S.; Tank, K.; Wang, H.-H.; Roehrig, G.; Moore, T. A High-Quality Professional Development for Teachers of Grades 3–6 for Implementing Engineering into Classrooms. Sch. Sci. Math. 2014, 114, 139–149. [Google Scholar] [CrossRef]
- Duran, M.; Sendag, S. A Preliminary Investigation into Critical Thinking Skills of Urban High School Students: Role of an IT/STEM Program. Creat. Educ. 2012, 3, 241–250. [Google Scholar] [CrossRef]


| African American | White | Latinx | Asian/PI | Native Am | Multiracial/Other | ||||||||
|---|---|---|---|---|---|---|---|---|---|---|---|---|---|
| School | M | F | M | F | M | F | M | F | M | F | M | F | |
| 1 (NMS) | Teachers | 17% * | 33% | - | 50% | - | - | - | - | - | - | - | - |
| Students | 31% | 23% | 10% | 19% | 7% | - | 2% | - | 2% | 2% | 2% | 3% | |
| 2 (SMS) | Teachers | - | 33% | 33% | - | - | - | - | 17% | - | - | - | 17% |
| Students | 22% | 29% | 12% | 19% | 5% | 5% | 1% | 1% | 1% | - | 2% | 3% | |
| 3 (WMS) | Teachers | 17% | 50% | - | - | - | - | - | 17% | - | - | - | 17% |
| Students | 21% | 33% | 1% | 11% | 2% | 11% | - | 1% | 3% | 8% | 5% | 4% | |
| 4 (EMS) | Teachers | - | 33% | 17% | 50% | - | - | - | - | - | - | - | - |
| Students | 33% | 35% | 10% | 9% | 1% | 6% | 1% | 3% | 2% | - | - | - | |
| Category | Factor 1: Negatively Worded | β | Factor 2: Positively Worded | β |
|---|---|---|---|---|
| Volunteering | I do not feel involved in the STEM Career Club Project. | 0.86 | I participate in the STEM Career Club activities as much as I can. | 0.69 |
| Learning at Home | I do not talk about the STEM Career Club Project at home. | 0.74 | I think parents should talk to their children about what they learned during the STEM Career Club meetings. | 0.81 |
| Communication | I do not feel able to talk to other people about the STEM Career Club Program. | 0.77 | Students and parents are discussing STEM careers and/or STEM ideas more now. | 0.65 |
| Communication | I am not aware of what is happening during the STEM Career Club meetings. | 0.75 | I will be able to select the math and science classes needed by a student for a future career, possibly in STEM. | 0.77 |
| Decision Making | When I come to a STEM Career Club activity, I am not sure what I am supposed to be doing. | 0.84 | STEM Career Club leaders seem open to my ideas or feedback about the club. | 0.64 |
| Collaborating | I do not think the activities of the STEM Career Clubs Program will help students to consider STEM careers. | 0.69 | I am learning new skills from the STEM Career Club Program. | 0.72 |
| Collaborating | The STEM Career Club does not involve any people outside of the school to support the STEM Career Club activities, such as people who work in local businesses or in STEM careers. | 0.61 | I think that the STEM Career Club Project will make a positive difference outside of school, in my community. | 0.69 |
| Collaborating | I am not sure which jobs are considered STEM jobs. | 0.65 | I am becoming more aware of minority role models in/STEM fields. | 0.75 |
| Club Leadership | NA | I think the staff involved in the STEM Career Club truly have the interest of the students and their futures in mind. | 0.70 | |
| STEM Careers | I do not think that/the emphasis on Science, Technology, Engineering, and Math (STEM) in the careers students learn about is important. | 0.40 | NA | |
| Parenting | It is not important for parents to participate in STEM Career Club activities. | 0.72 | NA |
| Grade * | Male * (%) | Female * (%) | Total (%) |
|---|---|---|---|
| 5th ** | 3.1 | 3.3 | 6.4 |
| 6th | 17.5 | 24.3 | 41.8 |
| 7th | 11.3 | 17.4 | 28.7 |
| 8th | 12.3 | 10.8 | 23.1 |
| Total (%) | 44.3 | 55.7 |
| Race * | African American | White (Non- Hispanic) | Hispanic | Asian or Pacific Islander | Native American | Other |
|---|---|---|---|---|---|---|
| Students (%) | 55.0 | 23.4 | 8.9 | 2.0 | 4.5 | 6.2 |
| Year | Low (%) | Medium (%) | High (%) |
|---|---|---|---|
| 1 | 23.4 | 45.9 | 30.7 |
| 2 | 26.4 | 44.8 | 28.8 |
| 3 | 26.2 | 37.8 | 36.1 |
| Participant Level of Involvement | Grade | Gender | ||||
|---|---|---|---|---|---|---|
| 5th | 6th | 7th | 8th | Male | Female | |
| Low | 1.5% | 7.4% | 6.4% | 5.4% | 8.3% | 12.2% |
| Medium | 1.8% | 19.1% | 14.8% | 10.8% | 21.7% | 24.7% |
| High | 3.3% | 15.4% | 7.4% | 6.8% | 14.4% | 18.6% |
| Total | 6.5% | 42.0% | 28.6% | 23.0% | 44.5% | 55.6% |
| Category | Item | Mean | SD |
|---|---|---|---|
| Collaborate | I am learning new skills from the STEM Career Club Program. | 4.4 | 0.7 |
| Collaborate | I think that the STEM Career Club Project will make a positive difference outside of school, in my community. | 4.3 | 0.8 |
| Communication | I will be able to select the math and science classes needed by a student for a future career, possibly in STEM. | 4.2 | 0.8 |
| Decision making | STEM Career Club leaders seem open to my ideas or feedback about the Club. | 4.0 | 0.9 |
| Learning at home | I think parents should talk to their children about what they learned during the STEM Career Club meetings. | 4.1 | 0.9 |
| Volunteering | I participate in the STEM Career Club activities as much as I can. | 4.4 | 0.8 |
| Club Leadership | I think the staff involved in the STEM Career Club truly have the interest of the students and their futures in mind. | 4.3 | 0.9 |
| Overall mean for all survey items (22) | 4.0 |
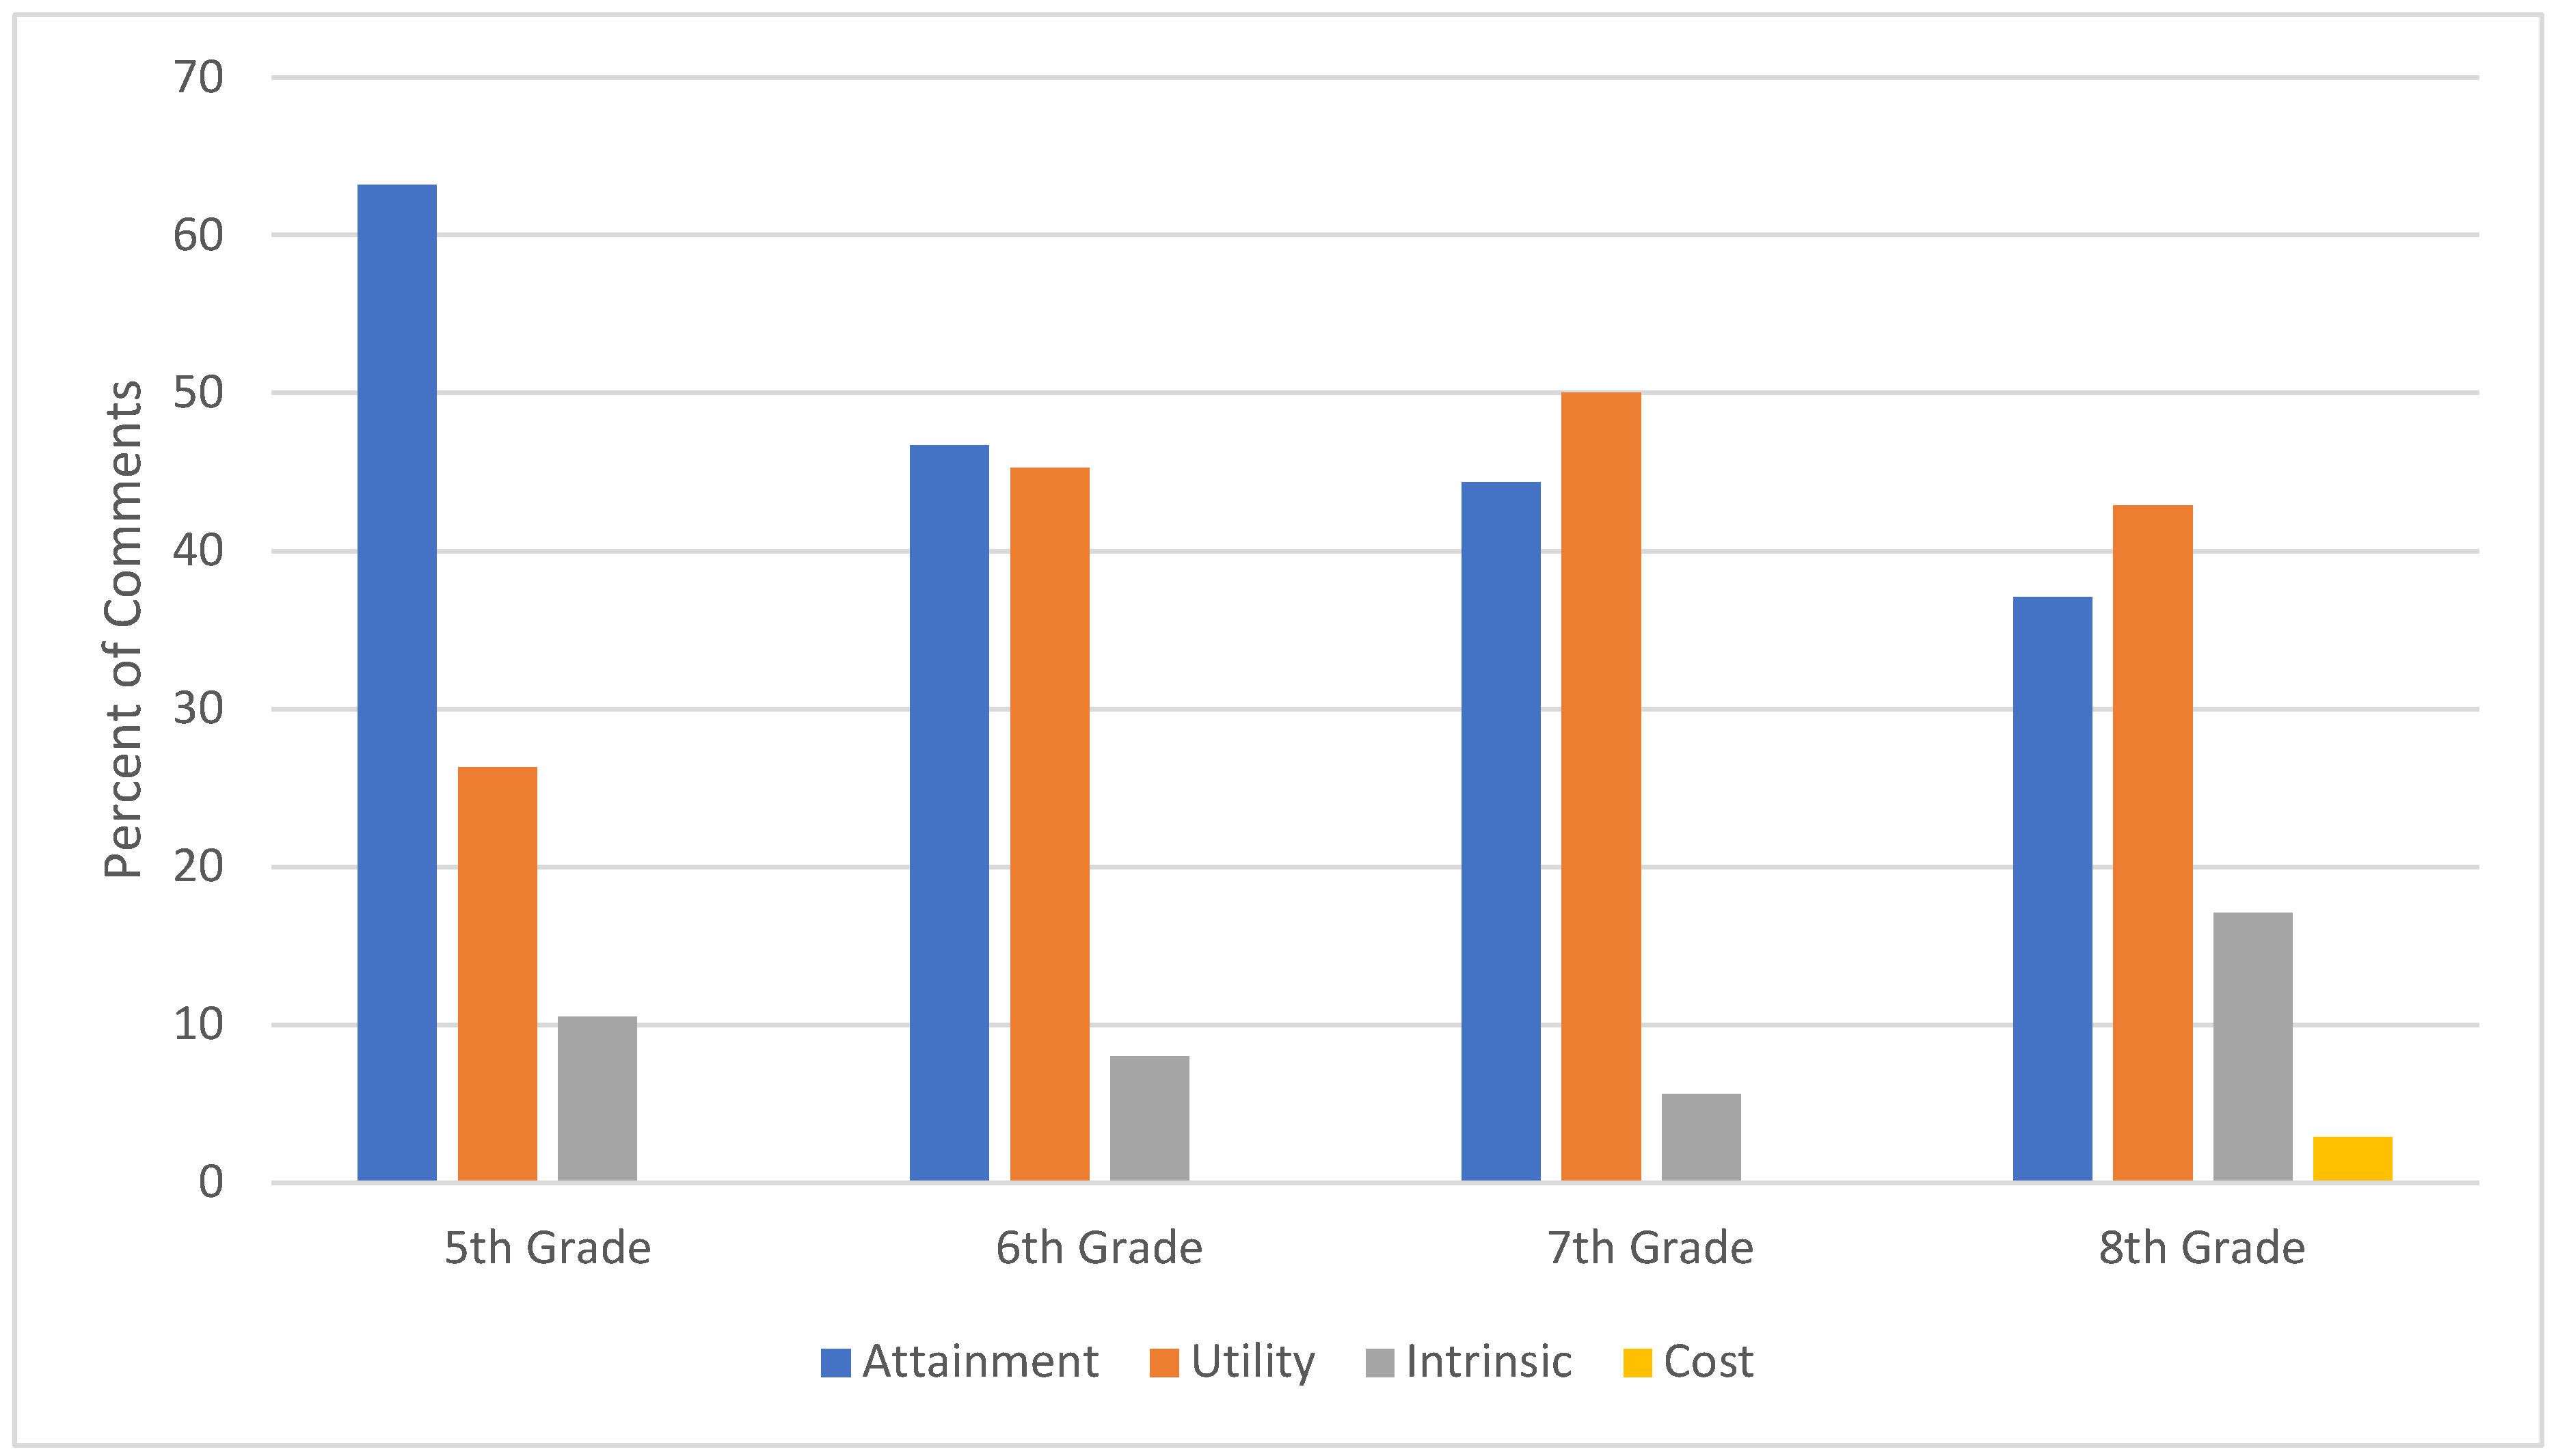
| Intrinsic Value Interest/enjoyment | % of Students who Expressed Value 99% | Examples Given by Students Fun, interesting, enjoyable, exciting, hands-on |
Sample Quotes
| ||
| Utility Value Valued because it helps to reach a variety of long- and short-range goals | % of Students who Expressed Value 55% | Examples Given by Students Good opportunity, helped with class work, developing new skills |
Sample Quotes
| ||
| Attainment Value Important due to core personal values | % of Students who Expressed Value 42% | Examples Given by Students Found out about new careers, learn more and know more, do things that add to who you think you are |
Sample Quotes
| ||
| Identity Personal and collective characteristics | % of Students who Expressed Identity 40% | Examples Given by Students Being smart, funny, creative; having a lot in common with the group |
Sample Quotes
| ||
| Cost What is lost or given up/suffered as a result of engaging in the activity | % of Students who Expressed Identity 21% | Examples Given by Students Boring, teachers did not listen, fighting, confusing, too much or not enough time, had conflicts with attending |
Sample Quotes
| ||
Disclaimer/Publisher’s Note: The statements, opinions and data contained in all publications are solely those of the individual author(s) and contributor(s) and not of MDPI and/or the editor(s). MDPI and/or the editor(s) disclaim responsibility for any injury to people or property resulting from any ideas, methods, instructions or products referred to in the content. |
© 2023 by the authors. Licensee MDPI, Basel, Switzerland. This article is an open access article distributed under the terms and conditions of the Creative Commons Attribution (CC BY) license (https://creativecommons.org/licenses/by/4.0/).
Share and Cite
Blanchard, M.R.; Gutierrez, K.S.; Swanson, K.J.; Collier, K.M. Why Do Students Attend STEM Clubs, What Do They Get Out of It, and Where Are They Heading? Educ. Sci. 2023, 13, 480. https://doi.org/10.3390/educsci13050480
Blanchard MR, Gutierrez KS, Swanson KJ, Collier KM. Why Do Students Attend STEM Clubs, What Do They Get Out of It, and Where Are They Heading? Education Sciences. 2023; 13(5):480. https://doi.org/10.3390/educsci13050480
Chicago/Turabian StyleBlanchard, Margaret R., Kristie S. Gutierrez, Kylie J. Swanson, and Karen M. Collier. 2023. "Why Do Students Attend STEM Clubs, What Do They Get Out of It, and Where Are They Heading?" Education Sciences 13, no. 5: 480. https://doi.org/10.3390/educsci13050480