1. Introduction
From 1994 to 2005, the number of universities and colleges in Taiwan approximately doubled; in addition, the total fertility rate in Taiwan declined from approximately 1.8 in 1995 to 1.2 in 2015, one of the fastest falling rates in the world [
1]. These two factors have caused serious societal problems, one of which is a decreasing rate of enrollment in universities. As enrollments have decreased, competition between universities to recruit students has increased; universities have become commercialized to attract students, which leads to less stringent admission standards. Thus, in this study, we designed a process that helps admissions committees in higher education.
The student selection process is a critical success factor for higher education institutions because every university wants to offer admission to qualified students who are willing to enroll in the university they receive an offer from. On the one hand, admitting unqualified or uninterested students is likely to cause problems in the future. Universities are often forced to do this because failing to achieve enrollment quotas threatens their financial viability; this is an especially serious problem for private institutions. On the other hand, when students are accepted to or are on the waiting list for more than one university, aspects such as the reputation of the institution, department specialties, and faculty strength influence their final decision on which university to attend. Educational institutions can thus benefit from a better understanding of the decision-making behavior of students; we attempt to explain this behavior in this paper.
The reputation or ranking of a department or university is often conflated with the academic achievement of its students. In general, such evaluations are necessarily based on some element of subjectivity. For example, the Department of Accounting cannot be objectively compared with the Department of Finance. Moreover, comparing the achievements of the top two students from two different high schools without using private data, such as their transcripts, is challenging. The goal of our research is to address these problems using objective and publicly available data.
One of the main reasons for public data is the budget issue. In the realm of higher education, the recruitment process, encompassing a range of activities such as campaigning, requires the prudent allocation of limited financial resources. In light of these constraints, utilizing publicly available data emerges as a compelling requirement if they are to use any modeling for assisting their recruitment. The feasibility of obtaining source data from public repositories obviates the need for significant financial investments, thereby enabling academic institutions to channel their resources toward other crucial domains. By adopting our suggested process, they can capitalize on the wealth of information accessible through public data sources and leverage it to inform the admission committee’s decision-making processes. The process we developed aims to predict the likelihood that a prospective student will accept an admission offer from a given university or that a student on a waitlist will wait for an offer; we applied our process to publicly accessible data. We constructed metrics using logistic regression to predict the probability that a student will enroll. This process can also evaluate the decisions of admission committees in terms of the distribution of willingness to enroll among the students who receive an admission offer; developing such an evaluation is the primary goal of our research.
Each individual can apply to only a limited number of departments, and the students can only choose to enroll in one department after receiving admission offers. Several studies on this topic have been conducted. One study investigated the predictors of college enrollment across different age groups and genders [
2]. Another article examined the influence of the Ronald E. McNair Post-Baccalaureate Achievement Program on graduate school enrollment for students from disadvantaged backgrounds [
3]. One study analyzed the datasets of different universities with machine learning to predict the chance of a student being admitted to a specific university [
4]. Another study reviewed and compared various machine learning techniques used for university admission predictions [
5]. A fuzzy logic for an intelligent and automated decision support system to assess a student’s eligibility for admission to a specific university was proposed in another paper [
6], which compared the testing results and received a 96% approval rate.
Studies on admission problems have primarily taken the perspectives of students to predict how competitive a student is (i.e., how likely they are to be accepted) based on various factors; studies have often used a student’s academic profile to predict the probability of admission. However, we seek to predict the probability of enrollment among admitted students. Other studies have focused on students who have applied to certain departments or universities and used the academic profiles of students in their analysis; by contrast, our research focuses on students who enrolled and do not use academic profiles.
Few studies have taken the perspective of admission committees possibly because the supply for higher education has only recently outstripped demand in Taiwan. Our work addresses the current situation in higher education in Taiwan, and our approach is primarily based on empirical experience from one university rather than any given theory. The findings of this study may thus be inapplicable to other universities. Unfortunately, due to the competition between universities, other universities will probably not release their data, and generalizing our findings to other universities is difficult. Moreover, the evolution of the education system may make our process obsolete in the future. Despite this, we hope our pioneering work will be applied to admission processes to help universities balance candidate quality and financial viability.
2. Materials and Methods
Students can apply to universities in Taiwan through three channels. One of the channels is personal applications, which accounted for approximately 60% of applications in 2021; this percentage that has remained steady for years. Personal application requires students to take the General Scholastic Ability Test (GSAT), and students can submit applications to several universities for various departments based on their scores; in this paper, a student’s portfolio was defined as their GSAT scores. Each student can apply to at most 11 departments, referred to as the choice list (CL). Students do not rank their CL; however, the admission committee has access to the CL of those students who have applied to its department.
After reviewing the portfolio in the first phase and going through the interview process in the second, the admission committee decides whether each student is accepted (A), wait-listed (W), or rejected (R). The students are then informed of the committee’s decision and order their preference for the departments they are qualified for and would like to enroll in. If the status of a student’s first choice is A, the student can enroll at that institution. If the status is W, the student will be placed on a waiting list; only when enough other students reject the admission offer and a space becomes available would the student be moved up to the acceptance list.
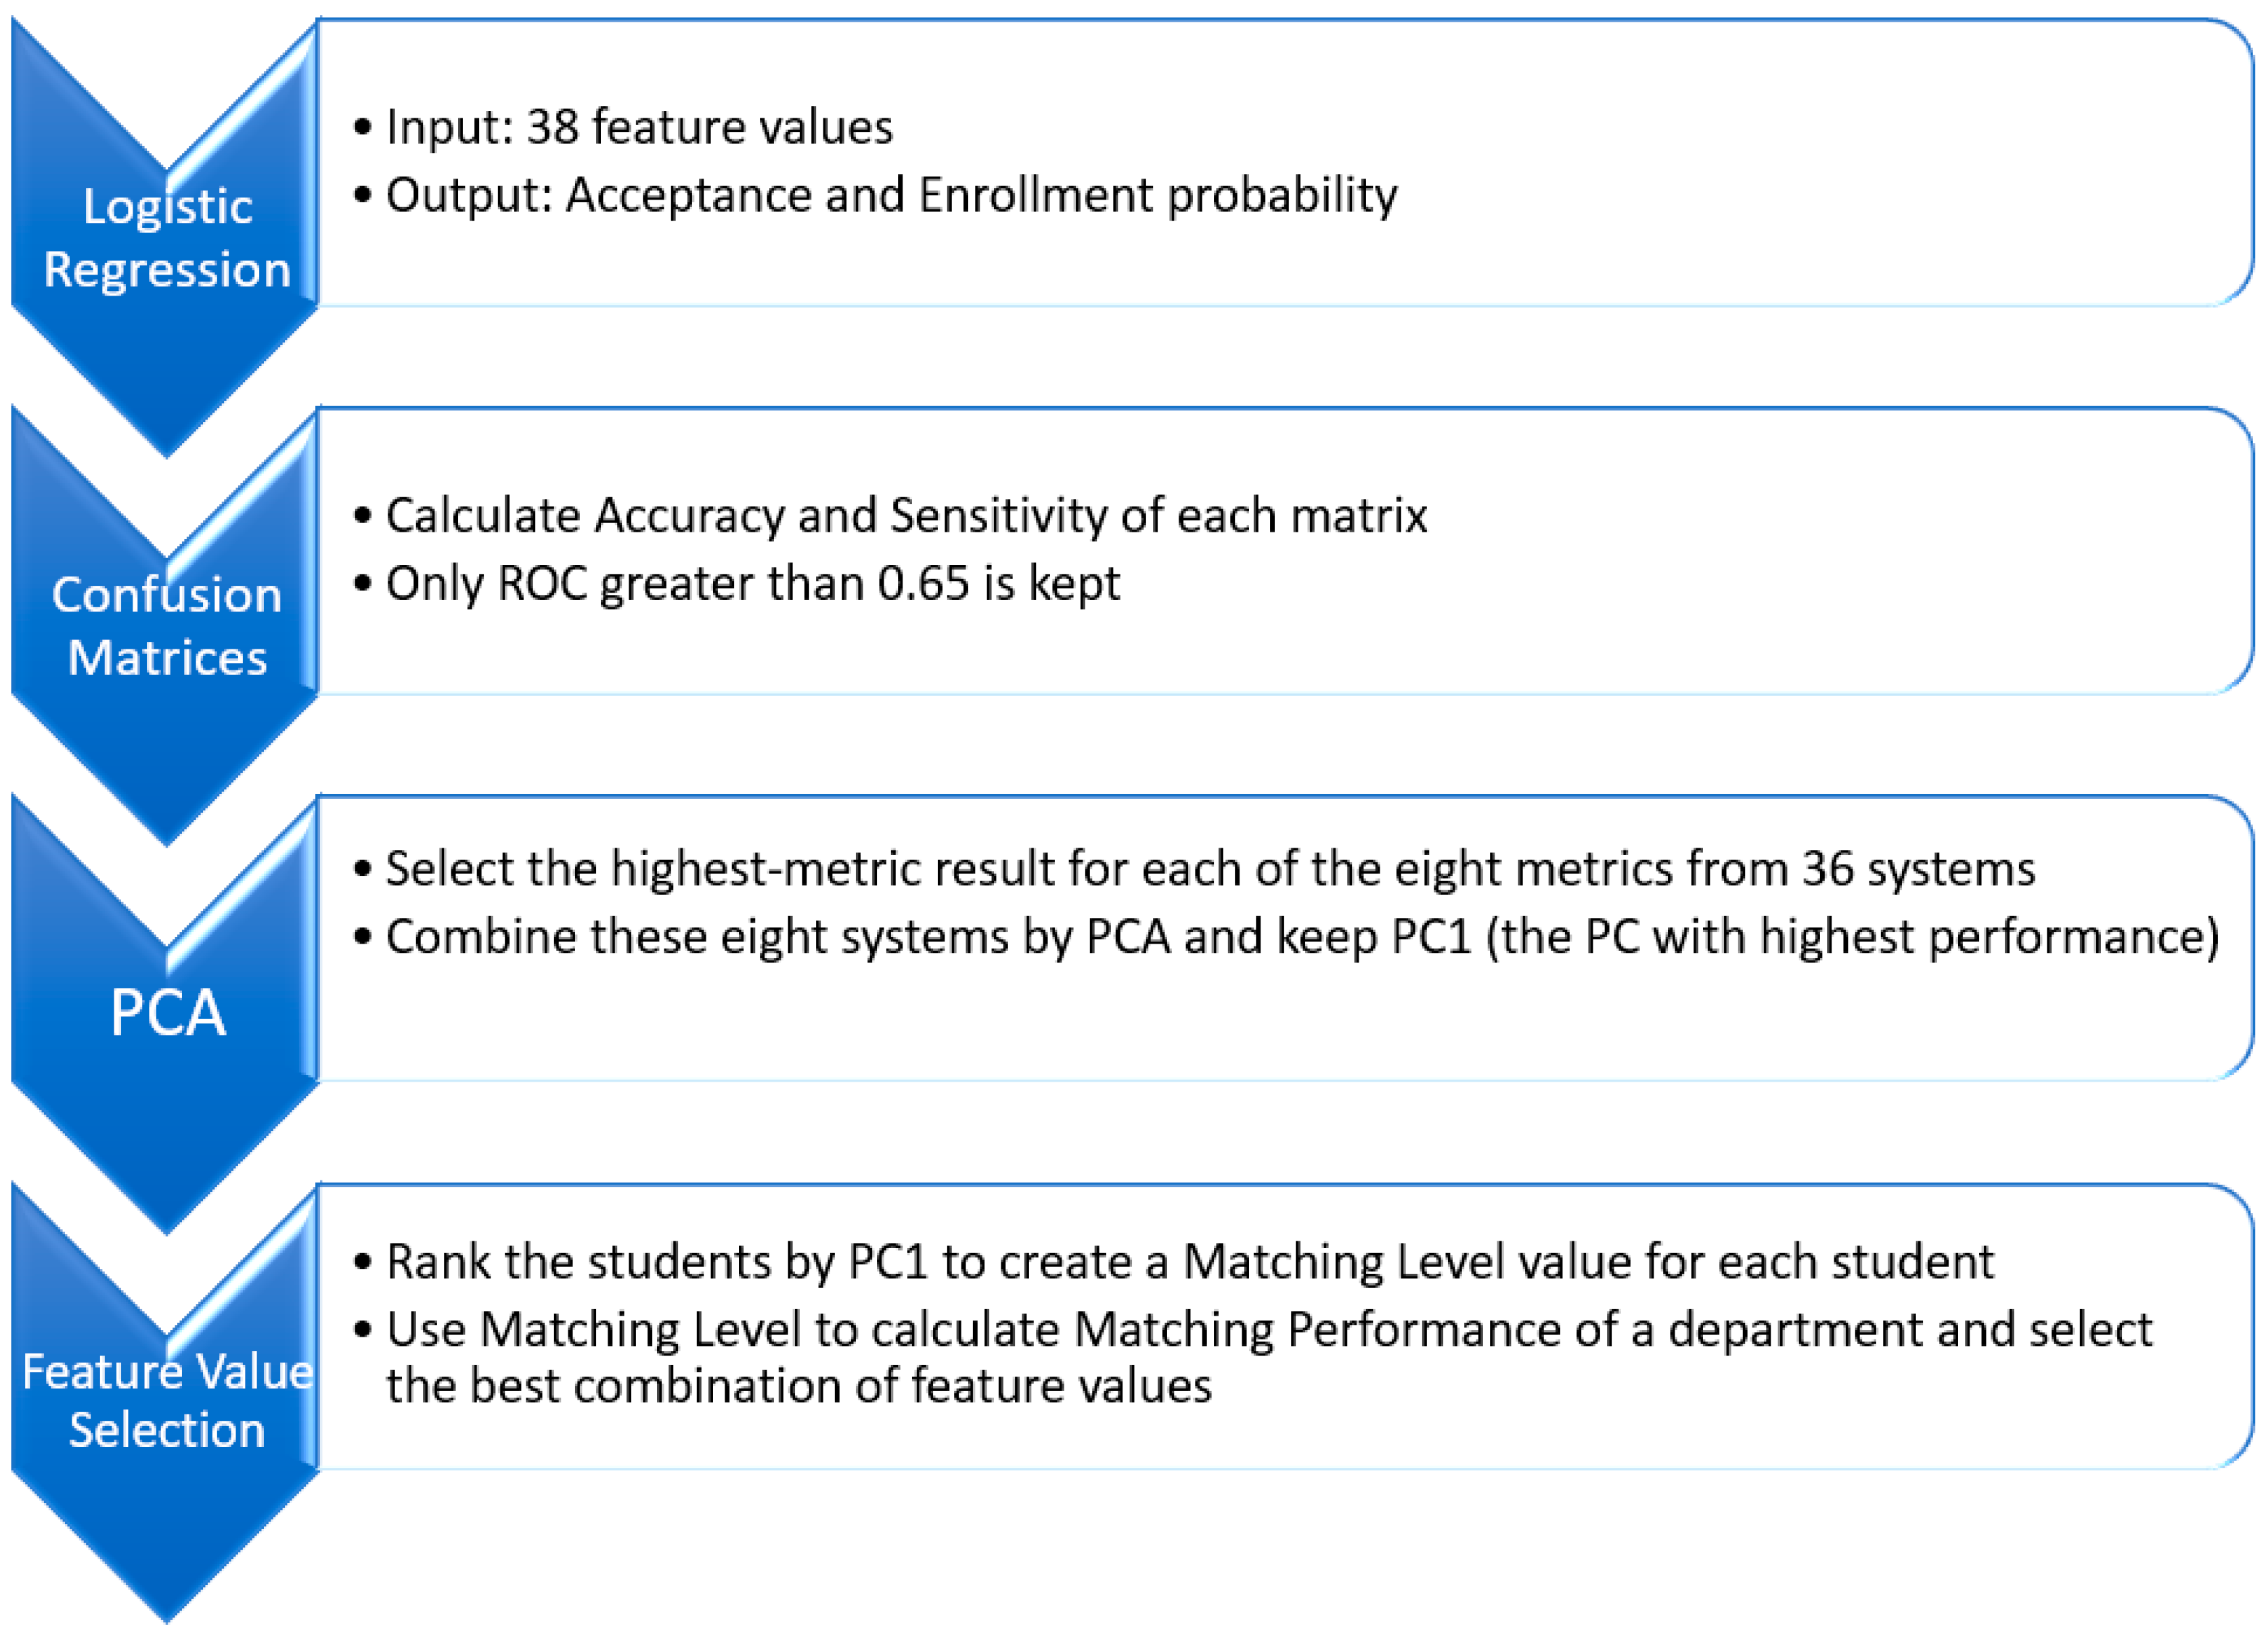
The textual information of the CL was transformed into 38 feature values as the major inputs of logistic regression. Unlike other studies, which have included student scores for specific exams, for example, Graduate Record Examination (GRE) score or grade point average (GPA) [
7], this study did not use nor had access to the score of GSAT, which made the cost of research relatively low.
We separated the 38 feature values into three categories; they are listed in
Table 1.
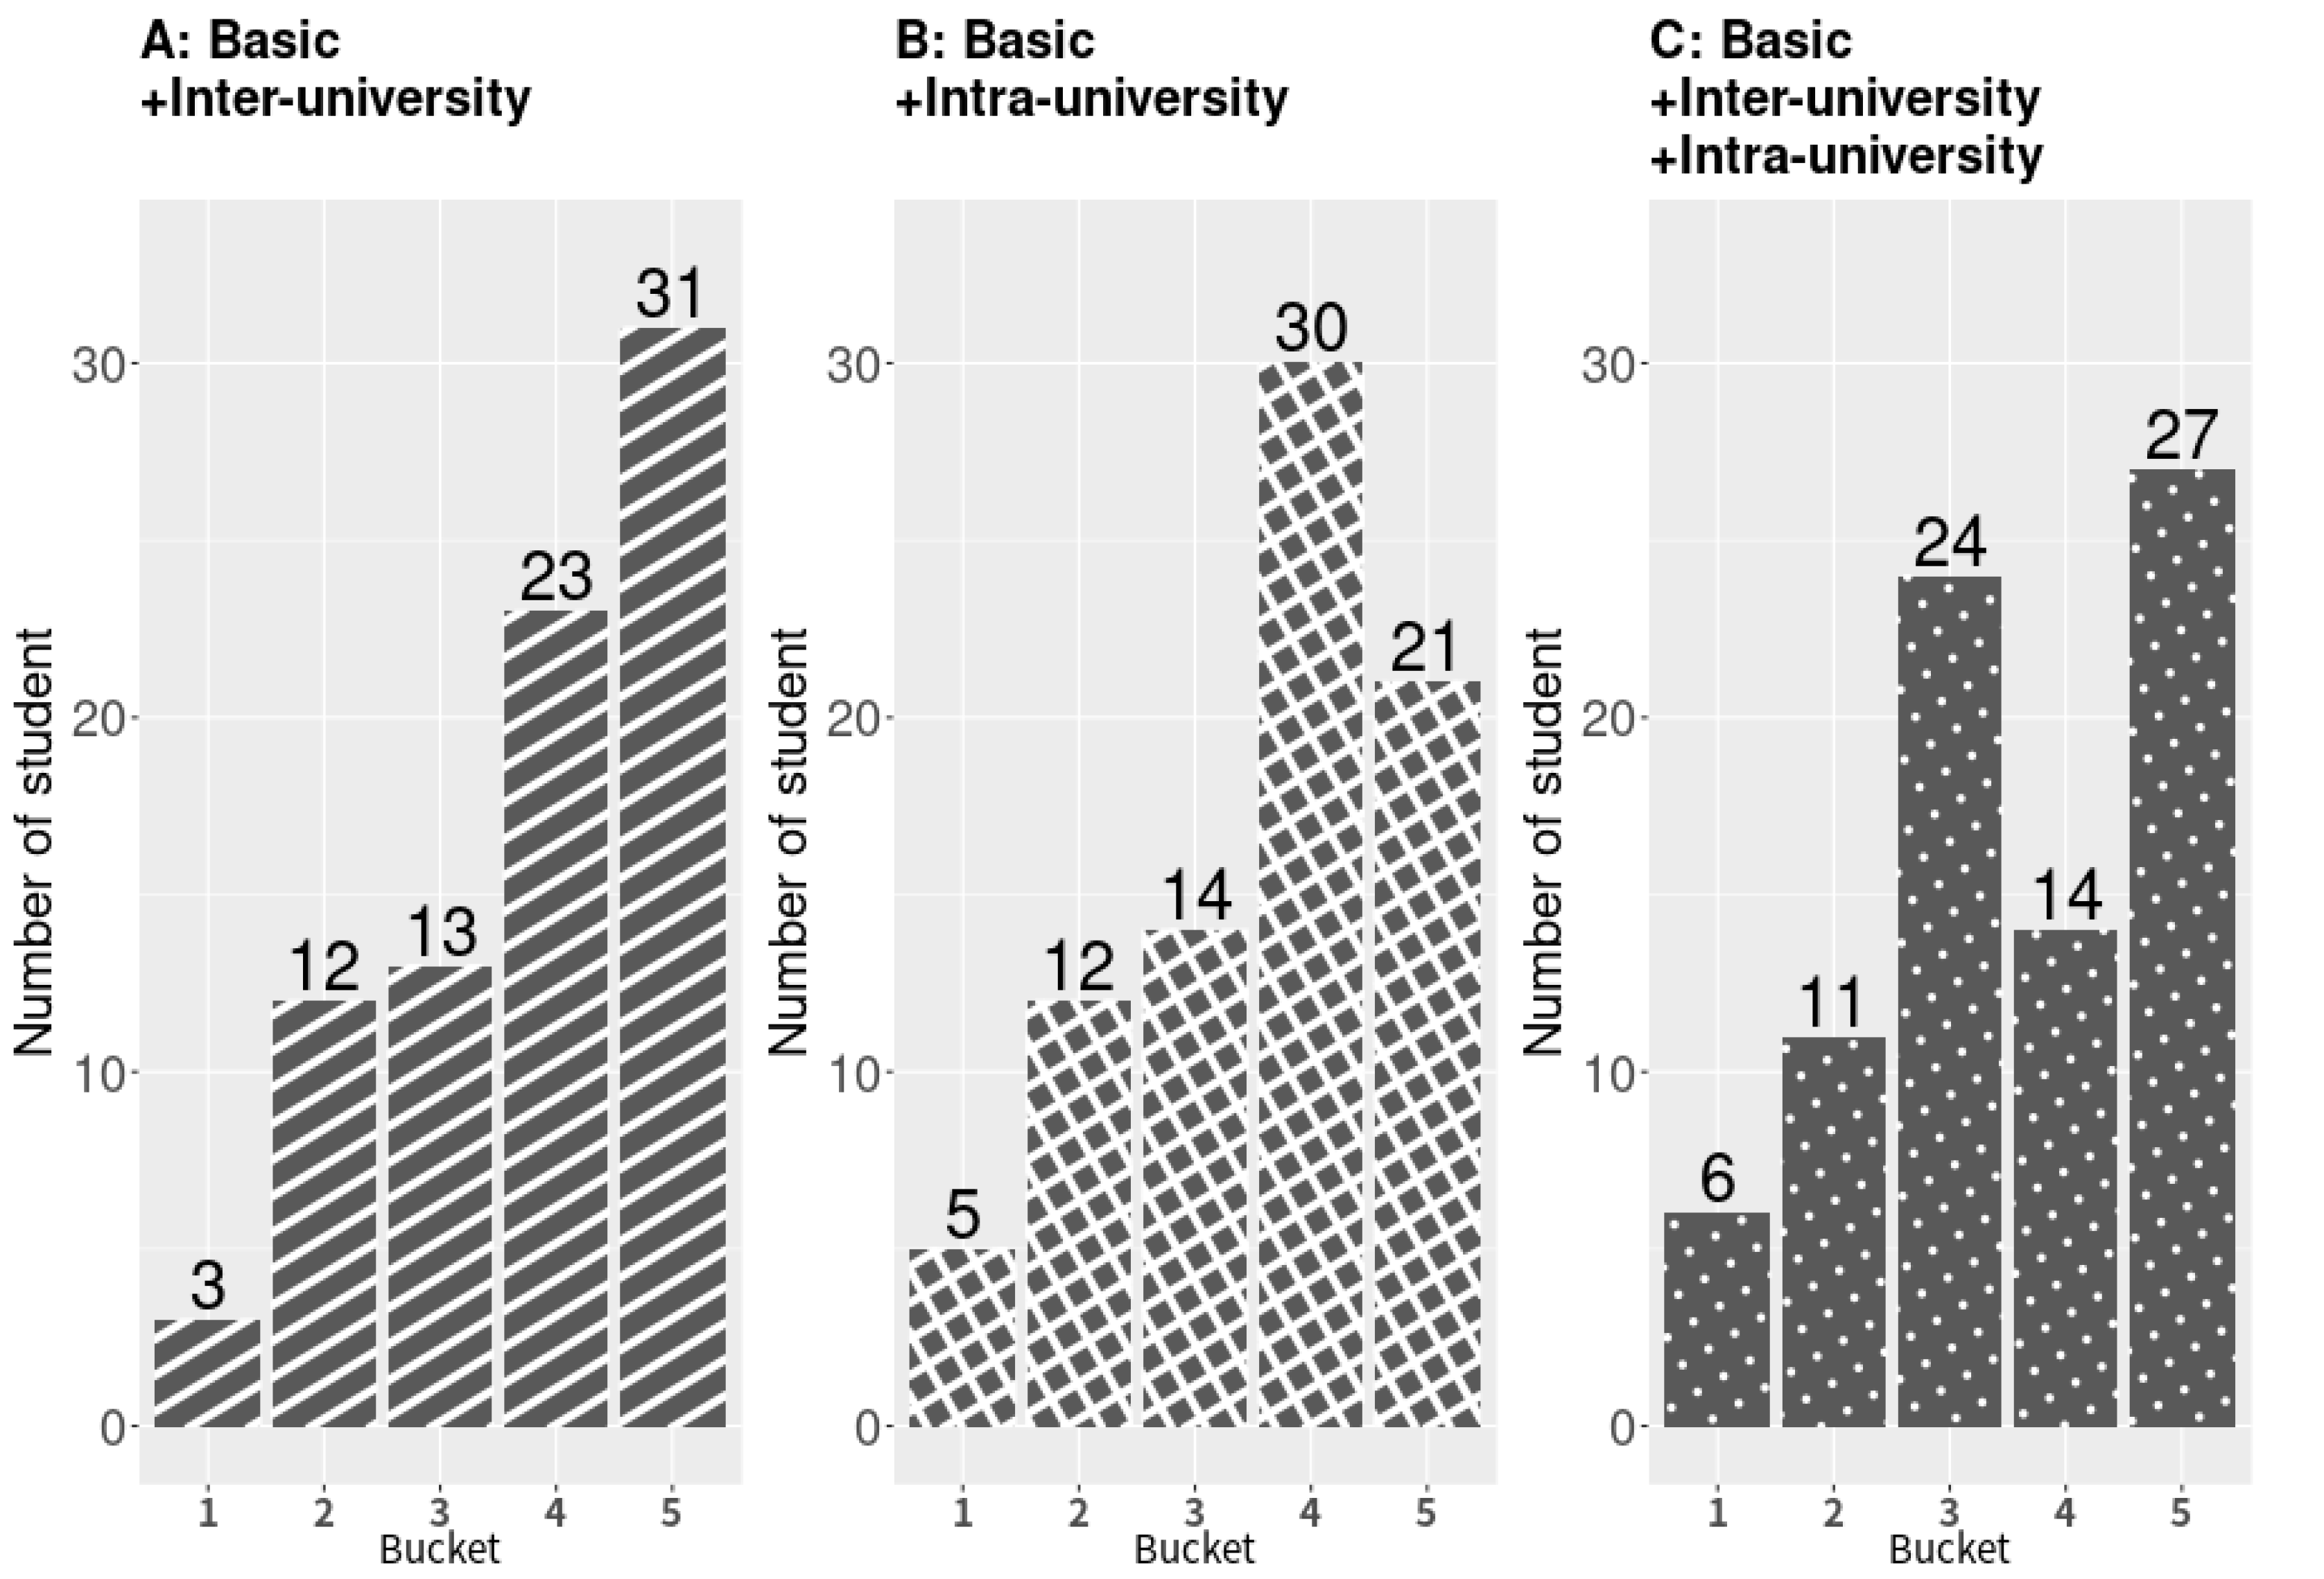
Differences in explanatory power between feature values were not evident. However, department-specific values were likely to be more heavily weighted because departments differed in their admission criteria and preferences. Moreover, the weight of specific values may change every year. Thus, our goal was not to identify the feature values with the highest weight; instead, we aimed to design a process that worked for all departments. We achieved this goal by combining the basic feature values along with either interuniversity or intrauniversity values, or both, to determine the most optimal one for every department, and then select the one with the best performance; the definition of best performance is discussed in
Section 3. We planned to explore disparate combinations of feature values in future studies. However, this study used the following three combinations of feature values in our logistic regression model: (A) basic and interuniversity; (B) basic and intrauniversity; and (C) basic, interuniversity, and intrauniversity.
The geographic location where a student takes the exam GSAT was used as the proxy for the student’s hometown; this was a variable that may be included in the logistic regression.
The modeling data were from the academic year lasting from fall 2018 to spring 2019 of the target university, and we used 2020 data as the criteria data to select from a pool of systems by imposing specific metrics. We then applied our model to test our system by predicting the enrollment outcome of 2021, where the students were enrolled in the university after the summer of 2021. Different from the traditional method of using separate training and testing data from the same pool of data [
9], our method avoids the problem of the influence of the separation method on the model [
10].
The modeling data were categorized into the following three groups: (1) 2018, (2) 2019, and (3) 2018 and 2019.
Table 2 explains how the data were applied.
Table 3 displays the total number of applications from the students who chose at least one department of the target university. For example, if a student applied to two departments in the academic year 2018, their data was counted twice in the total number of applications.
We processed the inputs using the following two approaches: (a) scaling, which involves normalizing the inputs to range from 0 to 1, and (b) principal component analysis (PCA), which is applied to transform the feature values to a new set of variables.
Table 4 includes a summary of the possible designs of the system. Combining the three possible inputs of modeling data as in
Table 2 results in 3 types of modeling data × 3 combinations of feature values × 2 types of location inputs (to include or not to include) × 3 processing methods × 2 predicted targets (acceptance or enrollment) = 108 candidate systems (
Table 4).
In addition to using the feature values, we used 36 for each combination of feature values, totaling 108 systems. We applied these candidate systems to each of the three combinations of feature values and select the system with the highest metric for each department.
For simplicity, we used A, B, and C, as specified in the second column of
Table 4, to represent the aforementioned combinations of feature values. We used logistic regression to estimate the acceptance and enrollment probability [
11] in the following equation in which
is the feature value:
The traditional outcome of logistic regression [
12] is a probability value, with 0.5 as the cutoff point that determines which category an observation belongs to. We ranked each student by the probability of acceptance and enrollment predicted by the model. Because we knew the quota of each department, the model output a positive prediction if and only if an individual’s ranking was high enough to be included in the quota.
By applying this predictive process to the admission and enrollment behavior of students and comparing its predictions with the actual data, we could compose four confusion matrices. The confusion matrix has four possible outcomes: true positive (TP), false positive (FP), false negative (FN), and true negative (TN).
The observed number of enrolled students is displayed in the first column of
Table 5 (ETP + EFP), the enrollment matrix, and in the first column of
Table 6 (AETP + AEFP), the admission-enrollment matrix. This sum should be less than or equal to the admission quota of the respective department. The sum of the first column of
Table 7 and
Table 8 should equal this quota. For example, in
Table 7, the sum of the two numbers (ATP + AFP) in the first column should equal the department quota because the admission committee offers admission to enough students to satisfy the quota. The sum of the first row of these four tables should equal to this quota too since our prediction should be congruent with this fact.
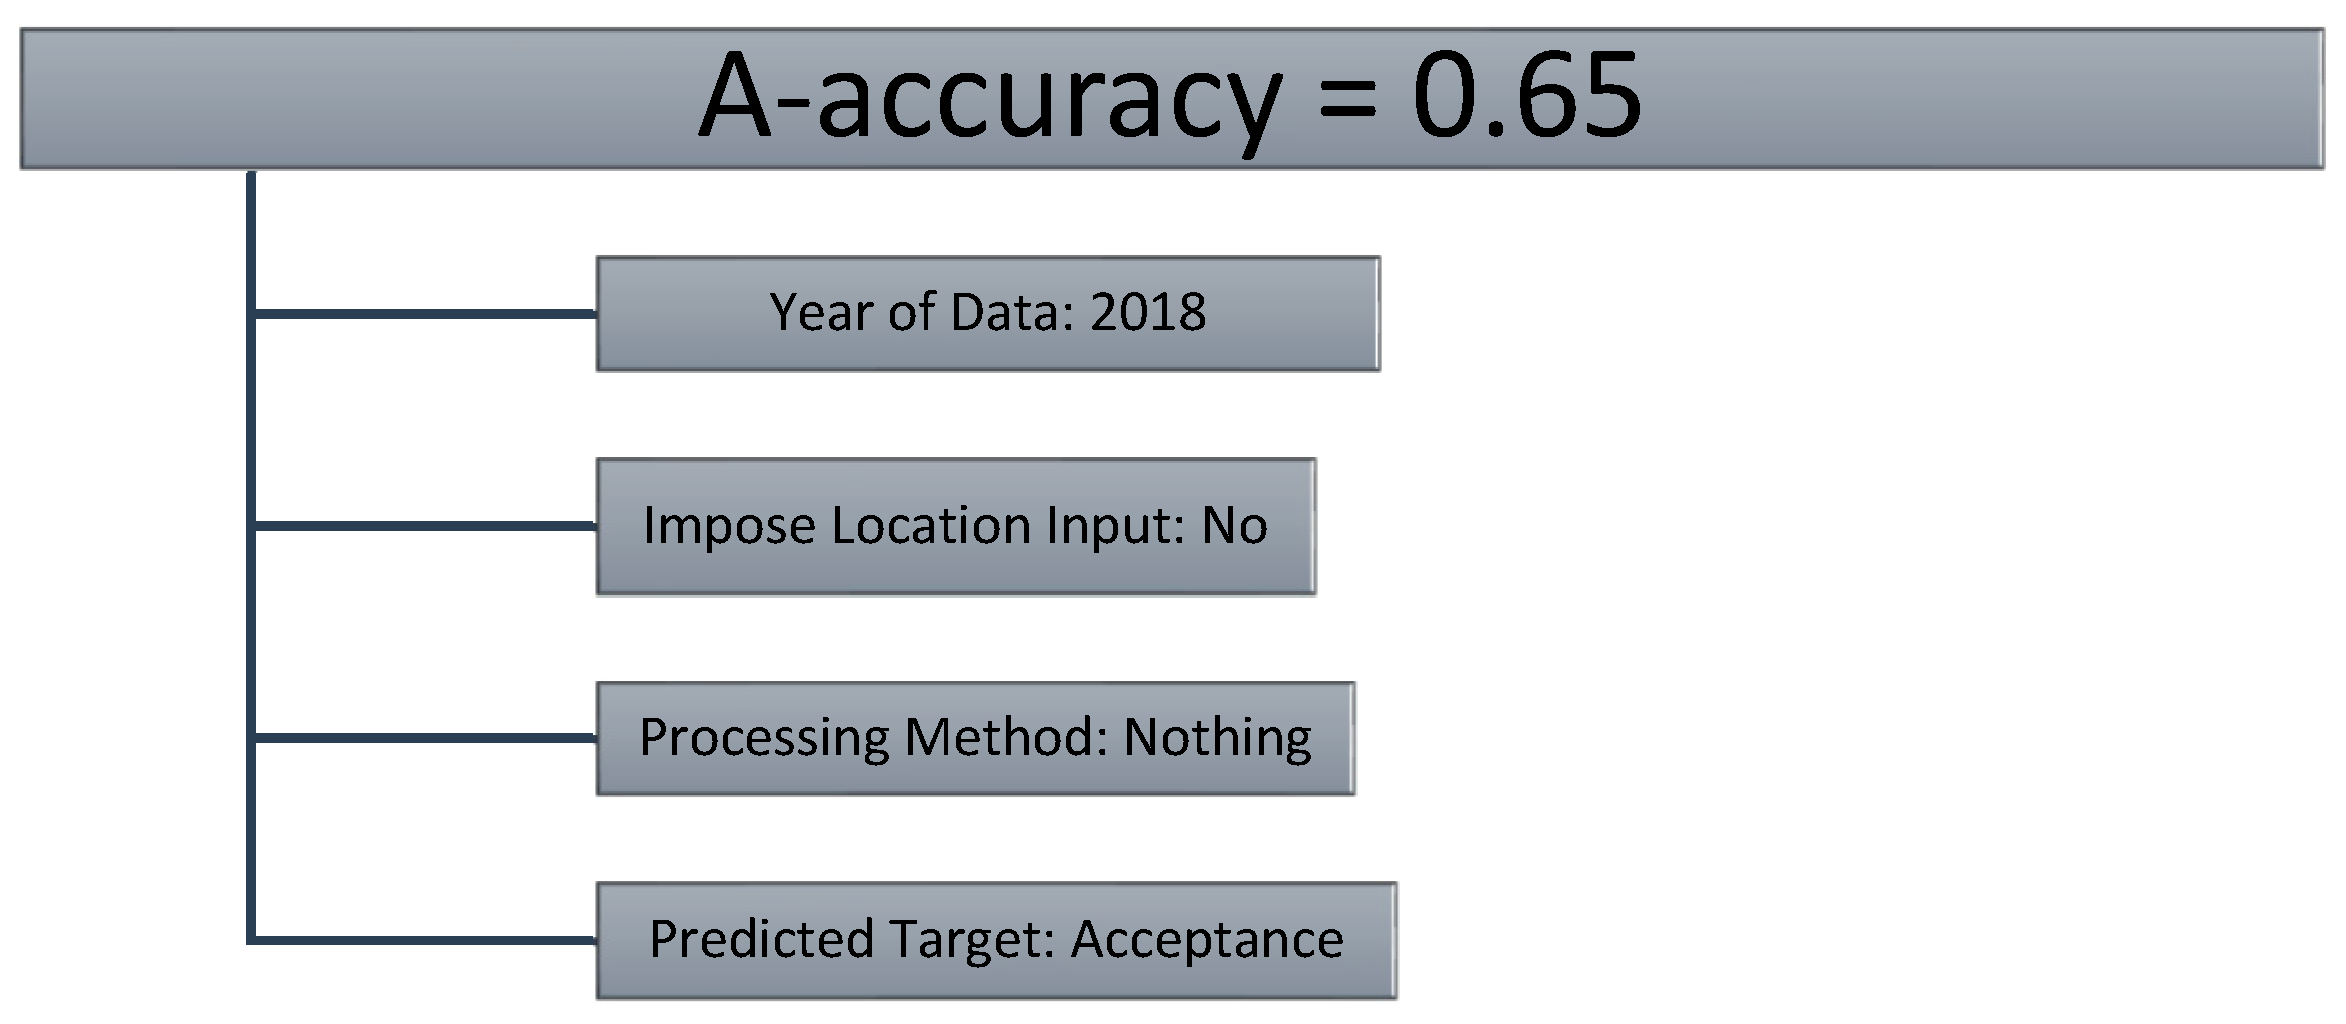
For each matrix, we can compose the following two metrics: (A) accuracy, which equals (TP + TN)/(TP + FN + FP + FN) and measures the performance of the model on how accurately it correctly predicts the outcome, and (B) sensitivity, which equals TP/(TP + FN) and measures the ability of the model to predict the proportion of positive results correctly. With four confusion matrices and two metrics, we have eight metrics to test our system performance. We denoted them using a matrix–metric format; for example, AE–accuracy is the accuracy in the Admission–Enrollment Matrix.
To ensure the quality of our system, we used the receiver operating characteristic curve (ROC) and only included the system in our analysis when the area under the ROC (AUC) was greater than 0.65; the systems with AUC 0.65 or less were deleted. For the goodness of fit of the logistic regression, we used the Hosmer–Lemeshow test and included the results with a
p value greater than 0.05, which indicated statistical significance [
13].
4. Discussion
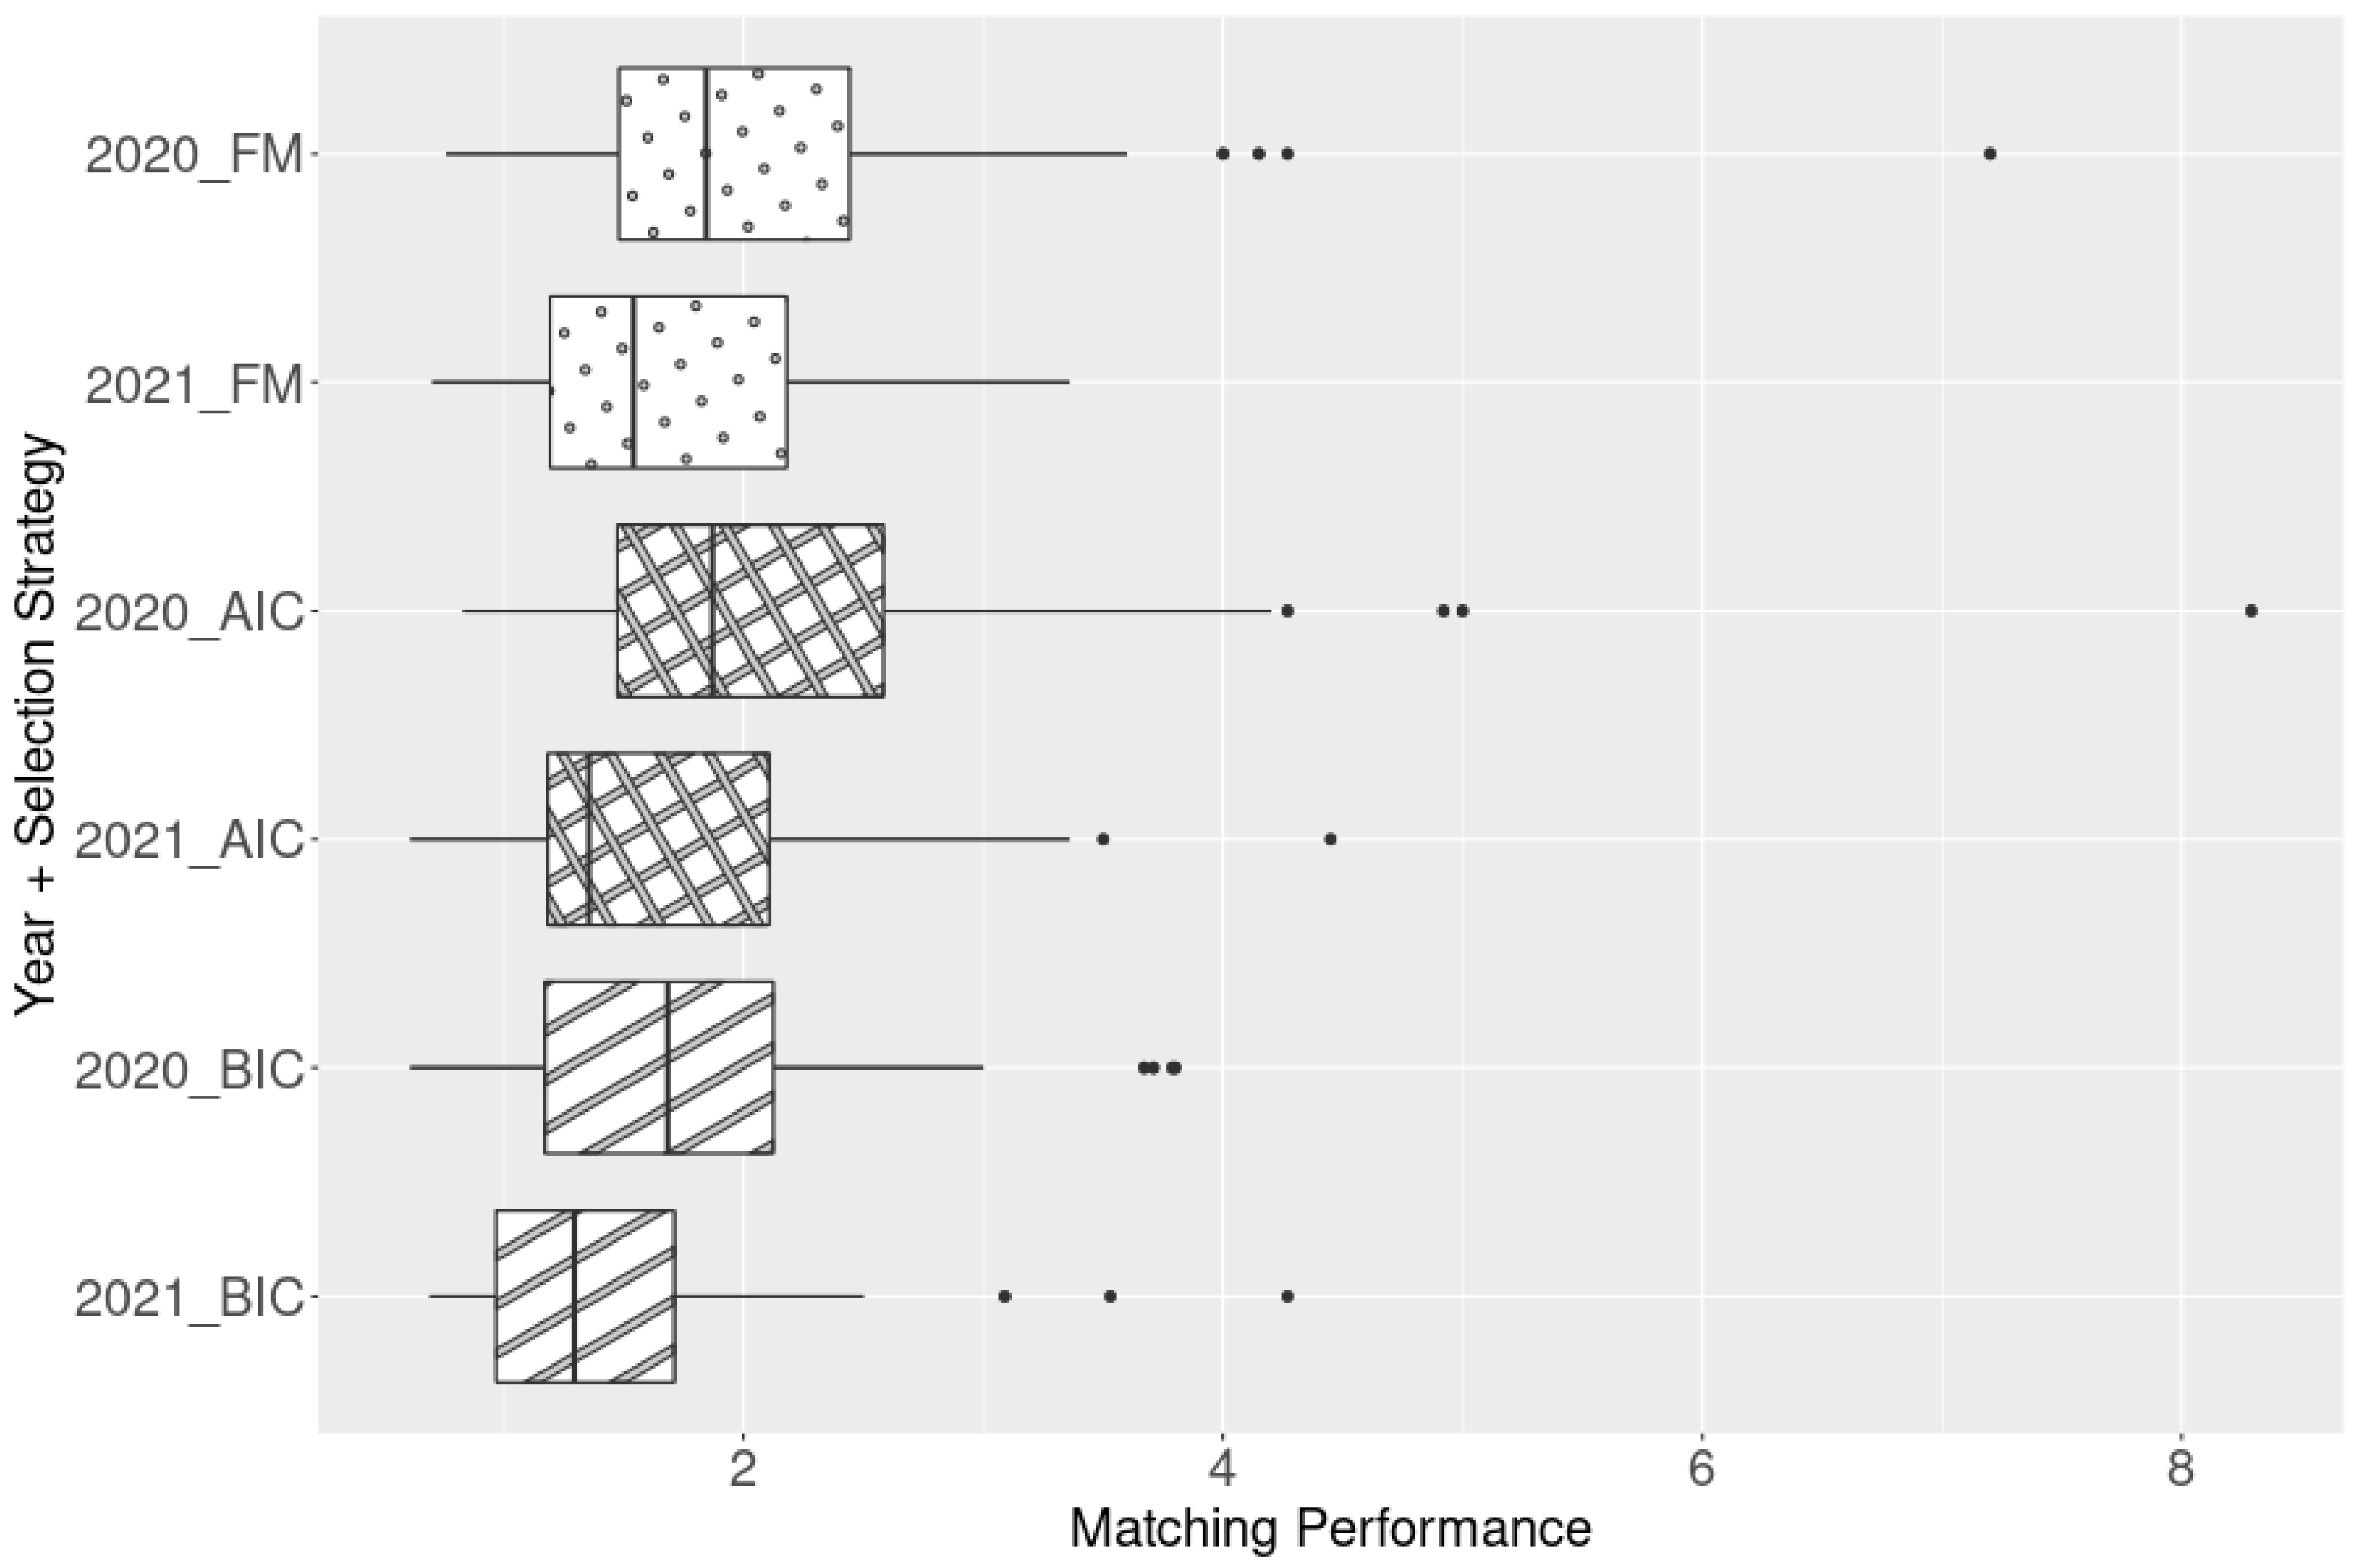
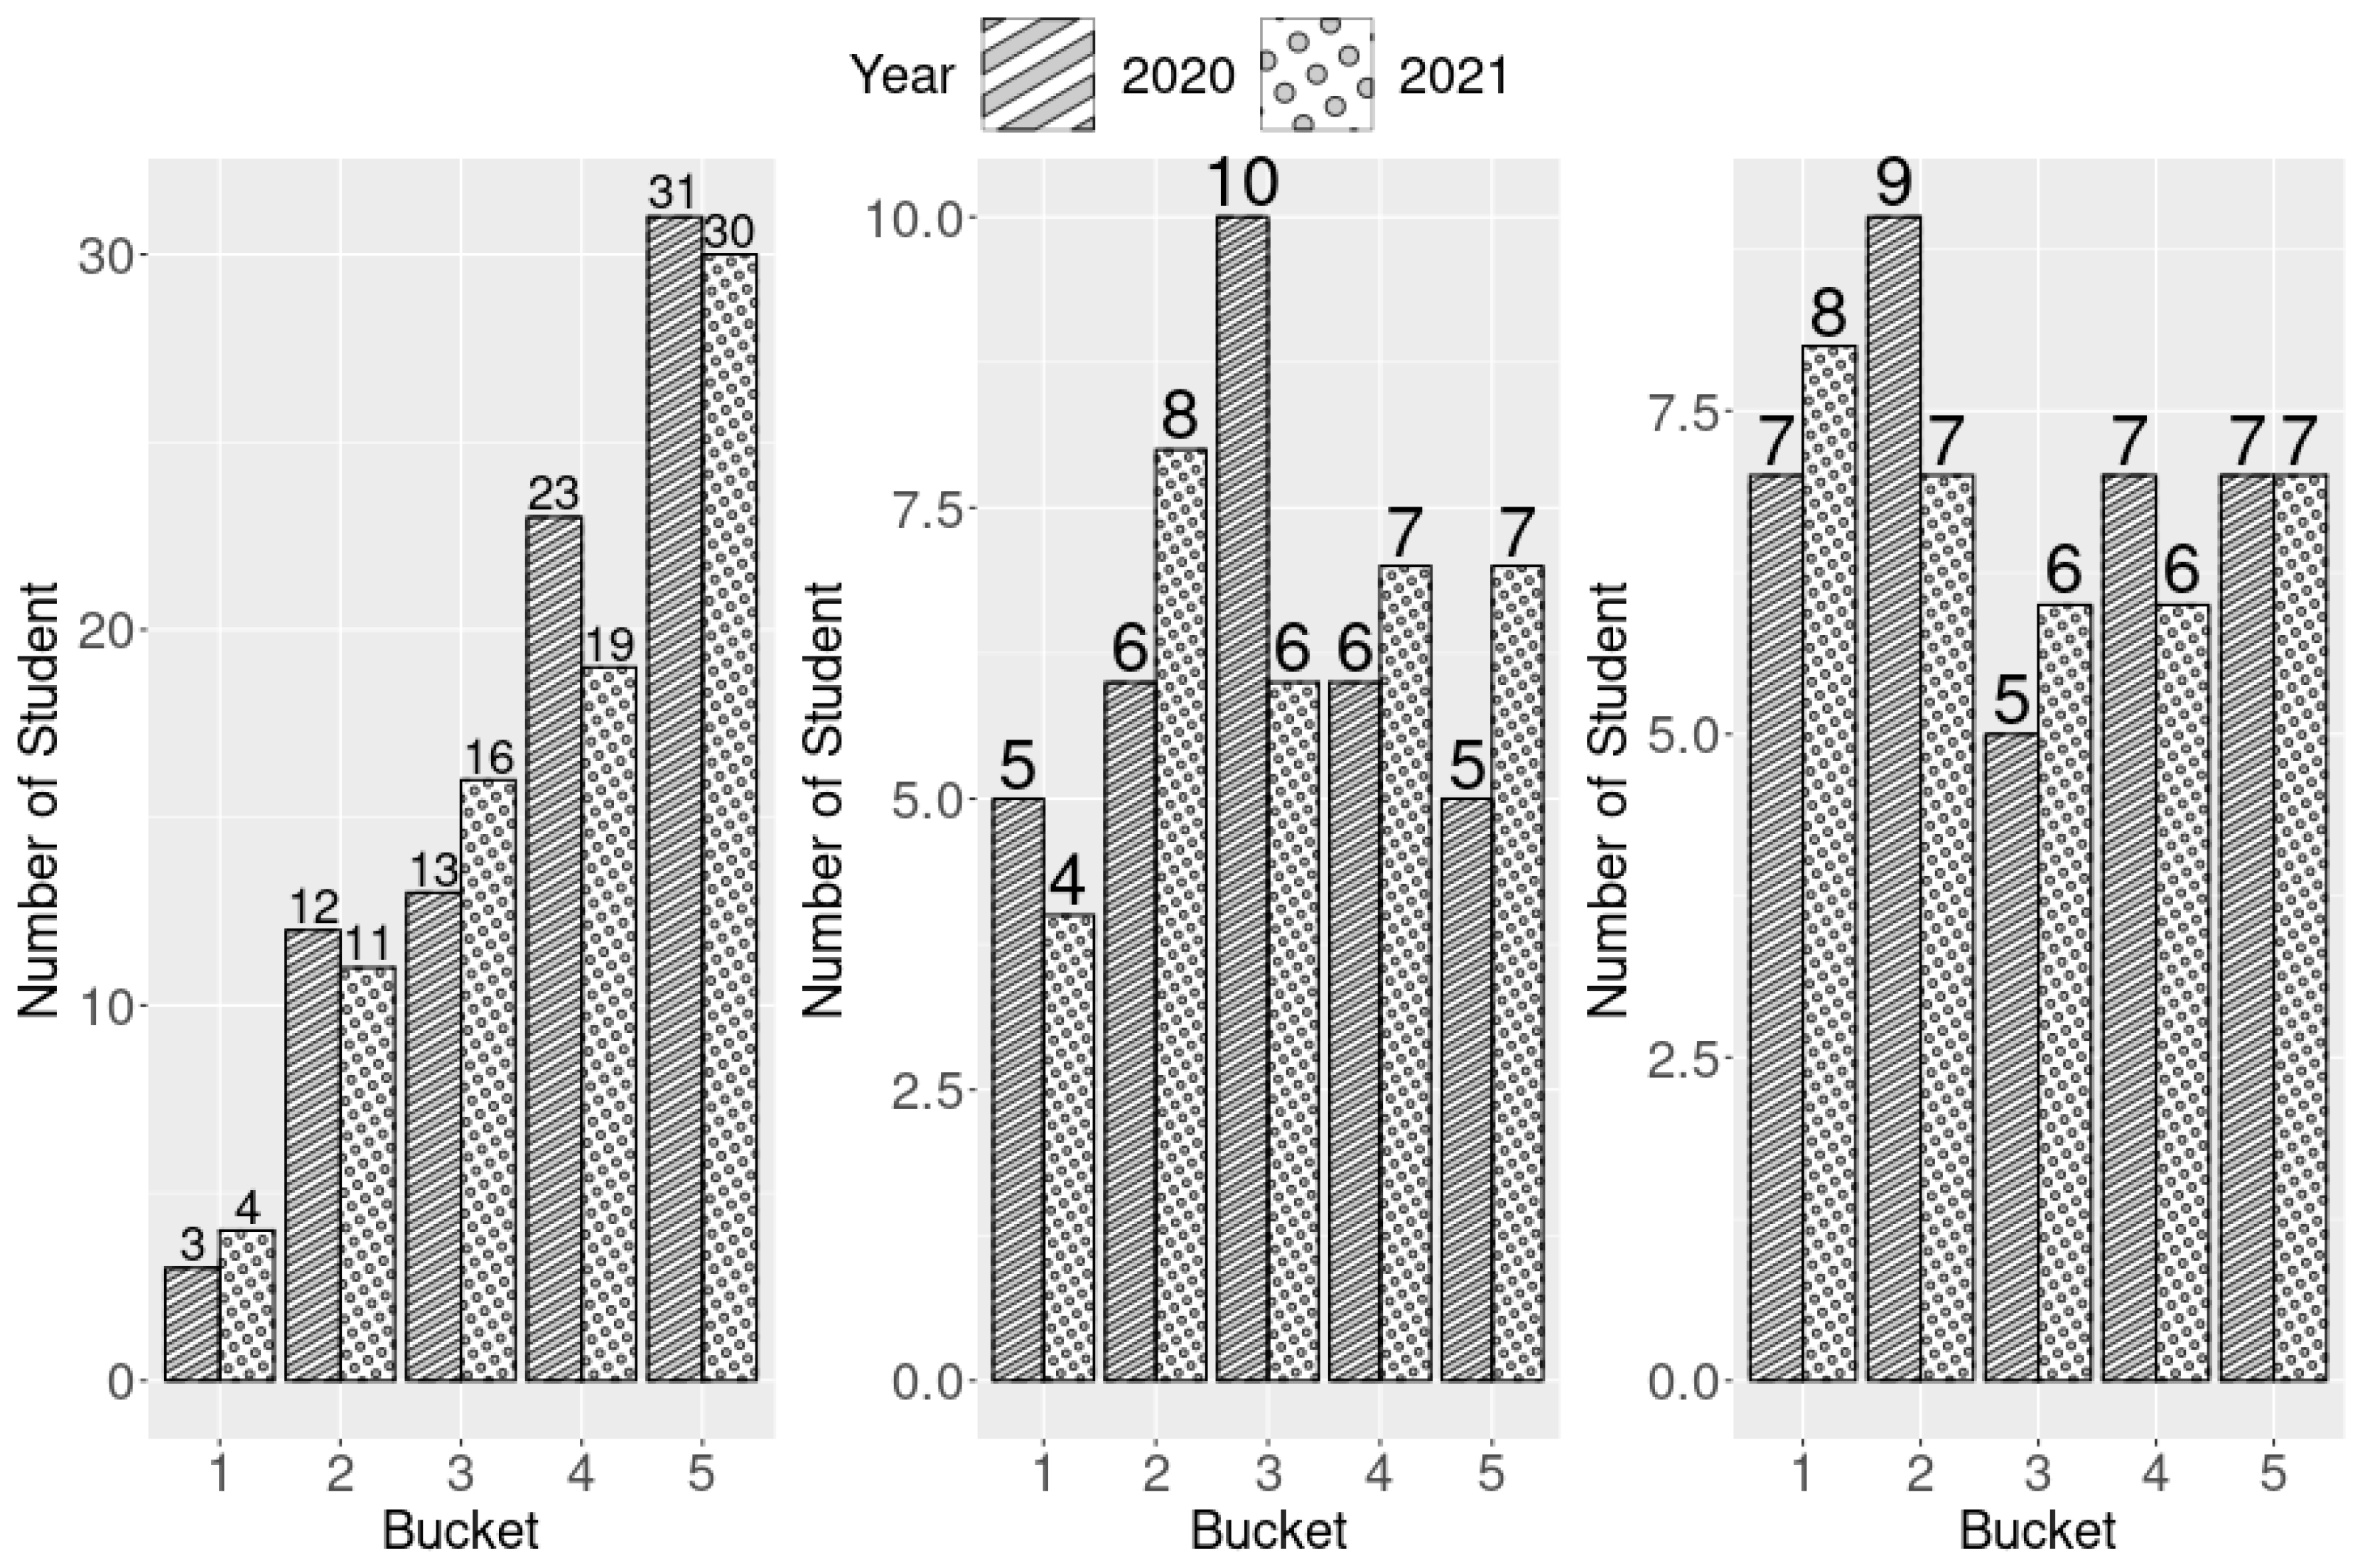
To understand how well our system can predict the acceptance and enrollment data for 2021, we arbitrarily chose an MP value of 1 + 0.25 × (standard deviation) in 2021 as a cutoff point. If the MP value was greater than this number, we considered the prediction of the department applying the respective model to the data to be trending up, meaning most of the actually enrolled students were predicted by the model to have a high probability of enrollment for the year 2021. If this metric was below 1 − 0.25 × (standard deviation), then we considered it to be trending down; otherwise, we considered it to be indistinguishable. This information is displayed in
Table 12.
We then determined whether the trends for 2020 and 2021 matched. Specifically, we determined whether they both trended upward (UU; left graph in
Figure 5), whether they both trended downward (DD), or whether they were both indistinguishable (II). By calculating the number of departments with matching trends and including II but not DD, we obtained a matching trend rate. Because the DD example had the highest MP values among the three combinations, the other two combinations necessarily had a downward trend.
The results of the three models are presented in
Table 13.
Future studies could combine more feature values, which we categorized into only three combinations, to discover combinations that are more effective. We used three combinations for practical reasons; for example, the combined effects of that are groups similar in nature to each other tend to be easier to analyze.
Another point that warrants further research is the maximum number of departments each student is allowed to apply to. Our system has no built-in constraints that limit this number; however, we do not know if our system would be as effective and robust if this number increases. If possible, we aim to apply our approach to the application of universities in countries such as the United States, where students can apply to as many universities as they wish.
We also applied the same system to the data from the academic year 2022 using the modeling data from 2019 and 2020 and the criteria data from 2021. We provided the admission committees of each department with the relative probability that each student that applies to the target university will choose to enroll; its use as a tool was strongly recommended by the director of the admission office. Nonetheless, each committee may choose whether to use this data and how they use it. The fact that the enrollment rate of the target university has improved amid falling enrollment rates of most universities in Taiwan provides strong evidence that our system is of practical use.
5. Conclusions
Decades ago, when admission to university was difficult in Taiwan due to the low number of universities, researchers focused mostly on predicting acceptance by the committee based on student academic performance. However, with an aging population, universities must develop strategies to maintain their financial viability; however, this topic has not received much attention from researchers. In this study, we designed a system to help the admission committee of the target university select students for admission; our goal is to offer admission to qualified students who have a higher probability of accepting an admission offer and enrolling.
Our system predicts the enrollment probability of students using only publicly accessible data about the potential majors students choose. This system could be of great value to the admission committee because it can increase the enrollment rates of each department. After transforming the textual information into 38 feature values, we used them as our inputs in logistic regression. With three combinations of data from various years, three combinations of feature values, with or without imposing location as input, three different processing methods, and two predicted targets; summing these combinations leads to 108 candidate systems. To choose the most suitable system, four confusion matrices and two metrics for each matrix were created, resulting in eight metrics. The system with the highest metric value was picked. By PCA, the eight most suitable systems from the eight metrics were integrated and the first component, PC1, was selected. A summary metric called MP was designed to determine the best-performing combination of feature values. We then used AIC and BIC to repeat the process. The trending up and matching trend rates were imposed to evaluate the predictive power among the Full, AIC, and BIC models. Ultimately, the FM performed better than the AIC and BIC.


