Review

A Literature Review Comparing Experts’ and Non-Experts’ Visual Processing of Graphs during Problem-Solving and Learning

1
Department of Electrical and Computer Engineering, RPTU Kaiserslautern, 67663 Kaiserslautern, Germany
2
Faculty of Physics, LMU Munich, 80539 Munich, Germany
3
Institute of Medical Education, University Hospital, LMU Munich, 80336 Munich, Germany
4
Department of Psychology, LMU Munich, 80539 Munich, Germany
*
Author to whom correspondence should be addressed.
Educ. Sci. 2023, 13(2), 216; https://doi.org/10.3390/educsci13020216
Submission received: 23 December 2022 / Revised: 10 February 2023 / Accepted: 16 February 2023 / Published: 19 February 2023

Abstract

:
The interpretation of graphs plays a pivotal role in education because it is relevant for understanding and representing data and comprehending concepts in various domains. Accordingly, many studies examine students’ gaze behavior by comparing different levels of expertise when interpreting graphs. This literature review presents an overview of 32 articles comparing the gaze behavior of experts and non-experts during problem-solving and learning with graphs up to January 2022. Most studies analyzed students’ dwell time, fixation duration, and fixation count on macro- and meso-, as well as on micro-level areas of interest. Experts seemed to pay more attention to relevant parts of the graph and less to irrelevant parts of a graph, in line with the information-reduction hypothesis. Experts also made more integrative eye movements within a graph in terms of dynamic metrics. However, the determination of expertise is inconsistent. Therefore, we recommend four factors that will help to better determine expertise. This review gives an overview of evaluation strategies for different types of graphs and across various domains, which could facilitate instructing students in evaluating graphs.

1. Introduction

Interpreting data presented in graphs is essential to understanding concepts across domains [1,2], especially for learning mathematics [3], to interpret and represent data [4,5], as well as to use media [6]. Therefore, graph interpretation was highlighted as a valuable skill in PISA and as a 21st-century workforce skill [7]. Graph-comprehension skills differ across individuals and depend on multiple factors: (1) graphical literacy, meaning the ability to interpret information represented in graphical form, for instance, identifying relevant features in any context [8,9,10]; (2) domain knowledge about the represented topic [9,11]; (3) prior knowledge about the underlying mathematical concepts of the graph [8]; (4) task knowledge, such as using a graph to solve a problem or identifying specific data points [12]. It is reasonable to assume that experts should have higher levels of graph-comprehension skills than non-experts. However, the determination of expertise can differ (see section Determination of Expertise). This is an important aspect to keep in mind, as the interpretation of differences in the visual behavior of experts and non-experts may depend on how expertise is determined. This holds true for this review when comparing the visual behavior of experts and non-experts during problem-solving and learning with graphs.
Visual processing of the graph is very important for graph comprehension. We use the term visual processing to emphasize that not only seeing the relevant information, but also actively processing is important for comprehending the depicted information. There is evidence that the visual processing of external representations changes with increasing expertise [13,14]. The underlying assumption is that people mentally process the information they look at [15] (eye-mind hypothesis).
There are various theories why the way we distribute attention might change with increasing expertise. Several of those theories have been supported by eye-tracking studies and literature reviews. For example, the holistic model of image perception states that experts can process an image more efficiently than non-experts [16,17]. This is explained by the enhanced parafoveal processing of experts [16,18]. Experts can analyze an entire image and fixate relevant information earlier than non-experts [16]. Furthermore, experts seem to process information faster than non-experts, as evidenced by shorter fixation durations (see the meta-analysis of Gegenfurtner et al. [17]). This supports the theory of long-term working memory. This theory states that experts learn how to store and retrieve information more effectively, which results in enhanced short-term memory processing [19]. Additionally, the findings of Gegenfurtner et al. [17] support the information-reduction hypothesis [20]. With increasing practice, participants focused more on task-relevant information and less on information that was not relevant to the task [20]. This is called selective attention [10]. These results suggest differences in the visual behavior between experts and non-experts when viewing external representations, such as graphs.
The difference between experts and non-experts’ viewing behaviors can be important in the context of education. For example, experts’ eye movements could be used as visual instructions to help learners make sense of external representations [21]. Knowledge about how experts read graphs could also be used to facilitate students’ information processing [22] or to identify student difficulties in problem-solving or learning with graphs. However, the theories mentioned above use various eye-tracking metrics, such as time to first fixation [16], the fixation count [20], total viewing time [10], or fixation duration [17]. There are similarities between different metrics, e.g., a correlation between total viewing times and fixation count [10] (see also [23] for similar results), but there are also conflicting relations between theoretical models and eye-tracking metrics. For instance, the theory of long-term memory predicts a shorter fixation duration for experts. This, however, is only consistent with the information-reduction hypothesis if experts fixate shorter on irrelevant areas, as this hypothesis predicts more fixations on task-relevant areas for experts than for non-experts [17]. Such possible inconsistencies make it more difficult to interpret how these metrics relate to the differences between experts and non-experts in viewing graphs or diagrams. Furthermore, the way experts and non-experts are defined should be acknowledged, especially in the context of education.
There have been previous literature reviews of eye-tracking in education with various research foci, for example, to summarize the eye-tracking research in physics education [24], to review the scenarios of eye tracking in mathematics education research [25], to compare experts and novices’ gaze behavior in sports and medical education research [26], to present a summary of eye-tracking research within the ”Psychology of Mathematics Education” conference [27], to investigate the relation between eye movements and cognitive processes during multimedia learning [28], or to provide an overview of the applications of eye tracking in education [29]. None of these review articles focuses on a single type of representation, and regarding the pivotal role of graphs in education, we intend to fill this gap with our review.
We hence aim to (1) provide an overview of eye-tracking metrics that have been used to compare the visual processing of experts and non-experts during problem-solving and learning with graphs. We also (2) summarize the previously found differences in visual behavior between experts and non-experts during learning or problem-solving with graphs.
Knowing how experts view graphs can provide guidelines to support students’ visual processing of graphs. For instance, it allows the identification of suitable eye movement modelling examples [30] or relevant areas for signaling support [31]. Moreover, such knowledge can be used to evaluate students’ fluency in the visual processing of graphs [32]. In this literature review, we provide an overview of the domains, the types of graphs, the eye-tracking metrics, and how experts are distinguished in the studies.

2. Materials and Methods

A literature review typically consists of three parts. First, the literature search. This is followed by the data extraction, which is then analyzed in the third part of a literature review. In the following we first present the search process of our literature review and then continue with the method used for data extraction. The results based on the data extraction are shown in the Results section.

2.1. Literature Review

The literature search aimed to find articles that analyzed visual behavior when looking at graphs in the context of problem-solving and learning in Science, Technology, Engineering, and Math (STEM) subjects. All included articles should fulfil the following criteria:
  • Comparison of experts vs. non-experts (population)
  • STEM subject (domain)
  • Learning or problem-solving with graphs, diagrams, or functions (intervention)
  • Analysis of visual behavior via eye-tracking metrics (outcome)
  • Empirical study
  • Full text available in English
This resulted in the following categories and terms (see Table 1). In the search string, categories were linked with the Boolean operator AND and terms with the Boolean operator OR.
To identify relevant articles, we searched for titles and abstracts in the databases ERIC, Scopus, Pedocs, and SpringerLink. One possible search string for Scopus would be (“eye tracking” OR “viewing behavior” OR “visual attention”) AND (“graph” OR “diagram” OR “function”). As search algorithms differed between databases, key terms in the search string were sometimes replaced with corresponding adjectives or adverbs to include alternative phrasings. This search was conducted in February 2022. Therefore, the publication deadline for relevant publications was 31 January 2022. After the screening process, 24 empirical studies met the inclusion criteria and were included. We then conducted a backwards snowball search using Google Scholar for all included articles and found eight more articles. In total, 32 articles were included in this review.

2.2. Data Extraction

Once the search was completed, relevant data were extracted. Based on our research focus on the differences in visual behavior between experts and non-experts during problem-solving or learning with graphs, we extracted the following data:
  • Year of publication
  • STEM subject in which the study was conducted
  • Type of graph
  • Eye-tracking metrics
  • Areas of interest (AOIs) used for the analysis of eye-tracking metrics
  • Expertise determination
  • Key findings
To analyze differences in visual behavior between experts and non-experts, we coded the way authors determined expertise. Furthermore, we coded the domain (STEM subject) and type of graph, as well as the analyzed eye-tracking metrics. To analyze eye-tracking data, the stimuli are split into areas of interest (AOIs). This is useful to investigate the distribution of eye movements across relevant and irrelevant areas. The distribution of eye movements can give insights into the relevance of a representation’s components. Depending on the research aim, an AOI can consist of an entire representation, such as a graph, or smaller components, for example, the axes. Furthermore, the analysis of eye-tracking metrics depends on the granularity of the AOIs.
In this review, we differentiate between macro- and meso-level AOIs and micro-level AOIs when analyzing the gaze behavior of experts and non-experts [33]. We used this distinction to code AOIs based on descriptions in the included studies. Macro-level AOIs consist of an entire graph. These AOIs can be useful to research how graphs are embedded in the learning material, e.g., between questions and answers. Meso-level AOIs divide the graph into large components, such as dividing the graph from the x- and y-axes. This means that more than one AOI covers the graph area, but there are separate information sources, such as single-axis values that are included in the same AOI. Micro-level AOIs split a comprehensive representation into particular elements, that can be based, for example, on specific information that is relevant to study specific sections of a graph, such as an axis with separate numbers on it.

3. Results

We identified 32 articles in our review, that analyzed the visual behavior of experts and non-experts when looking at graphs in the context of problem-solving and learning. An overview of all included studies can be found in Table 2. This table surveys authors, publication years, subjects, graph types, measurements to determine expertise and analyzed eye-tracking metrics.
An overview of the analyzed variables can be seen in the graphs depicted in Figure 1. The included experiments are described in more detail regarding the individual variables in the following sections, starting with the publication period of the included studies.

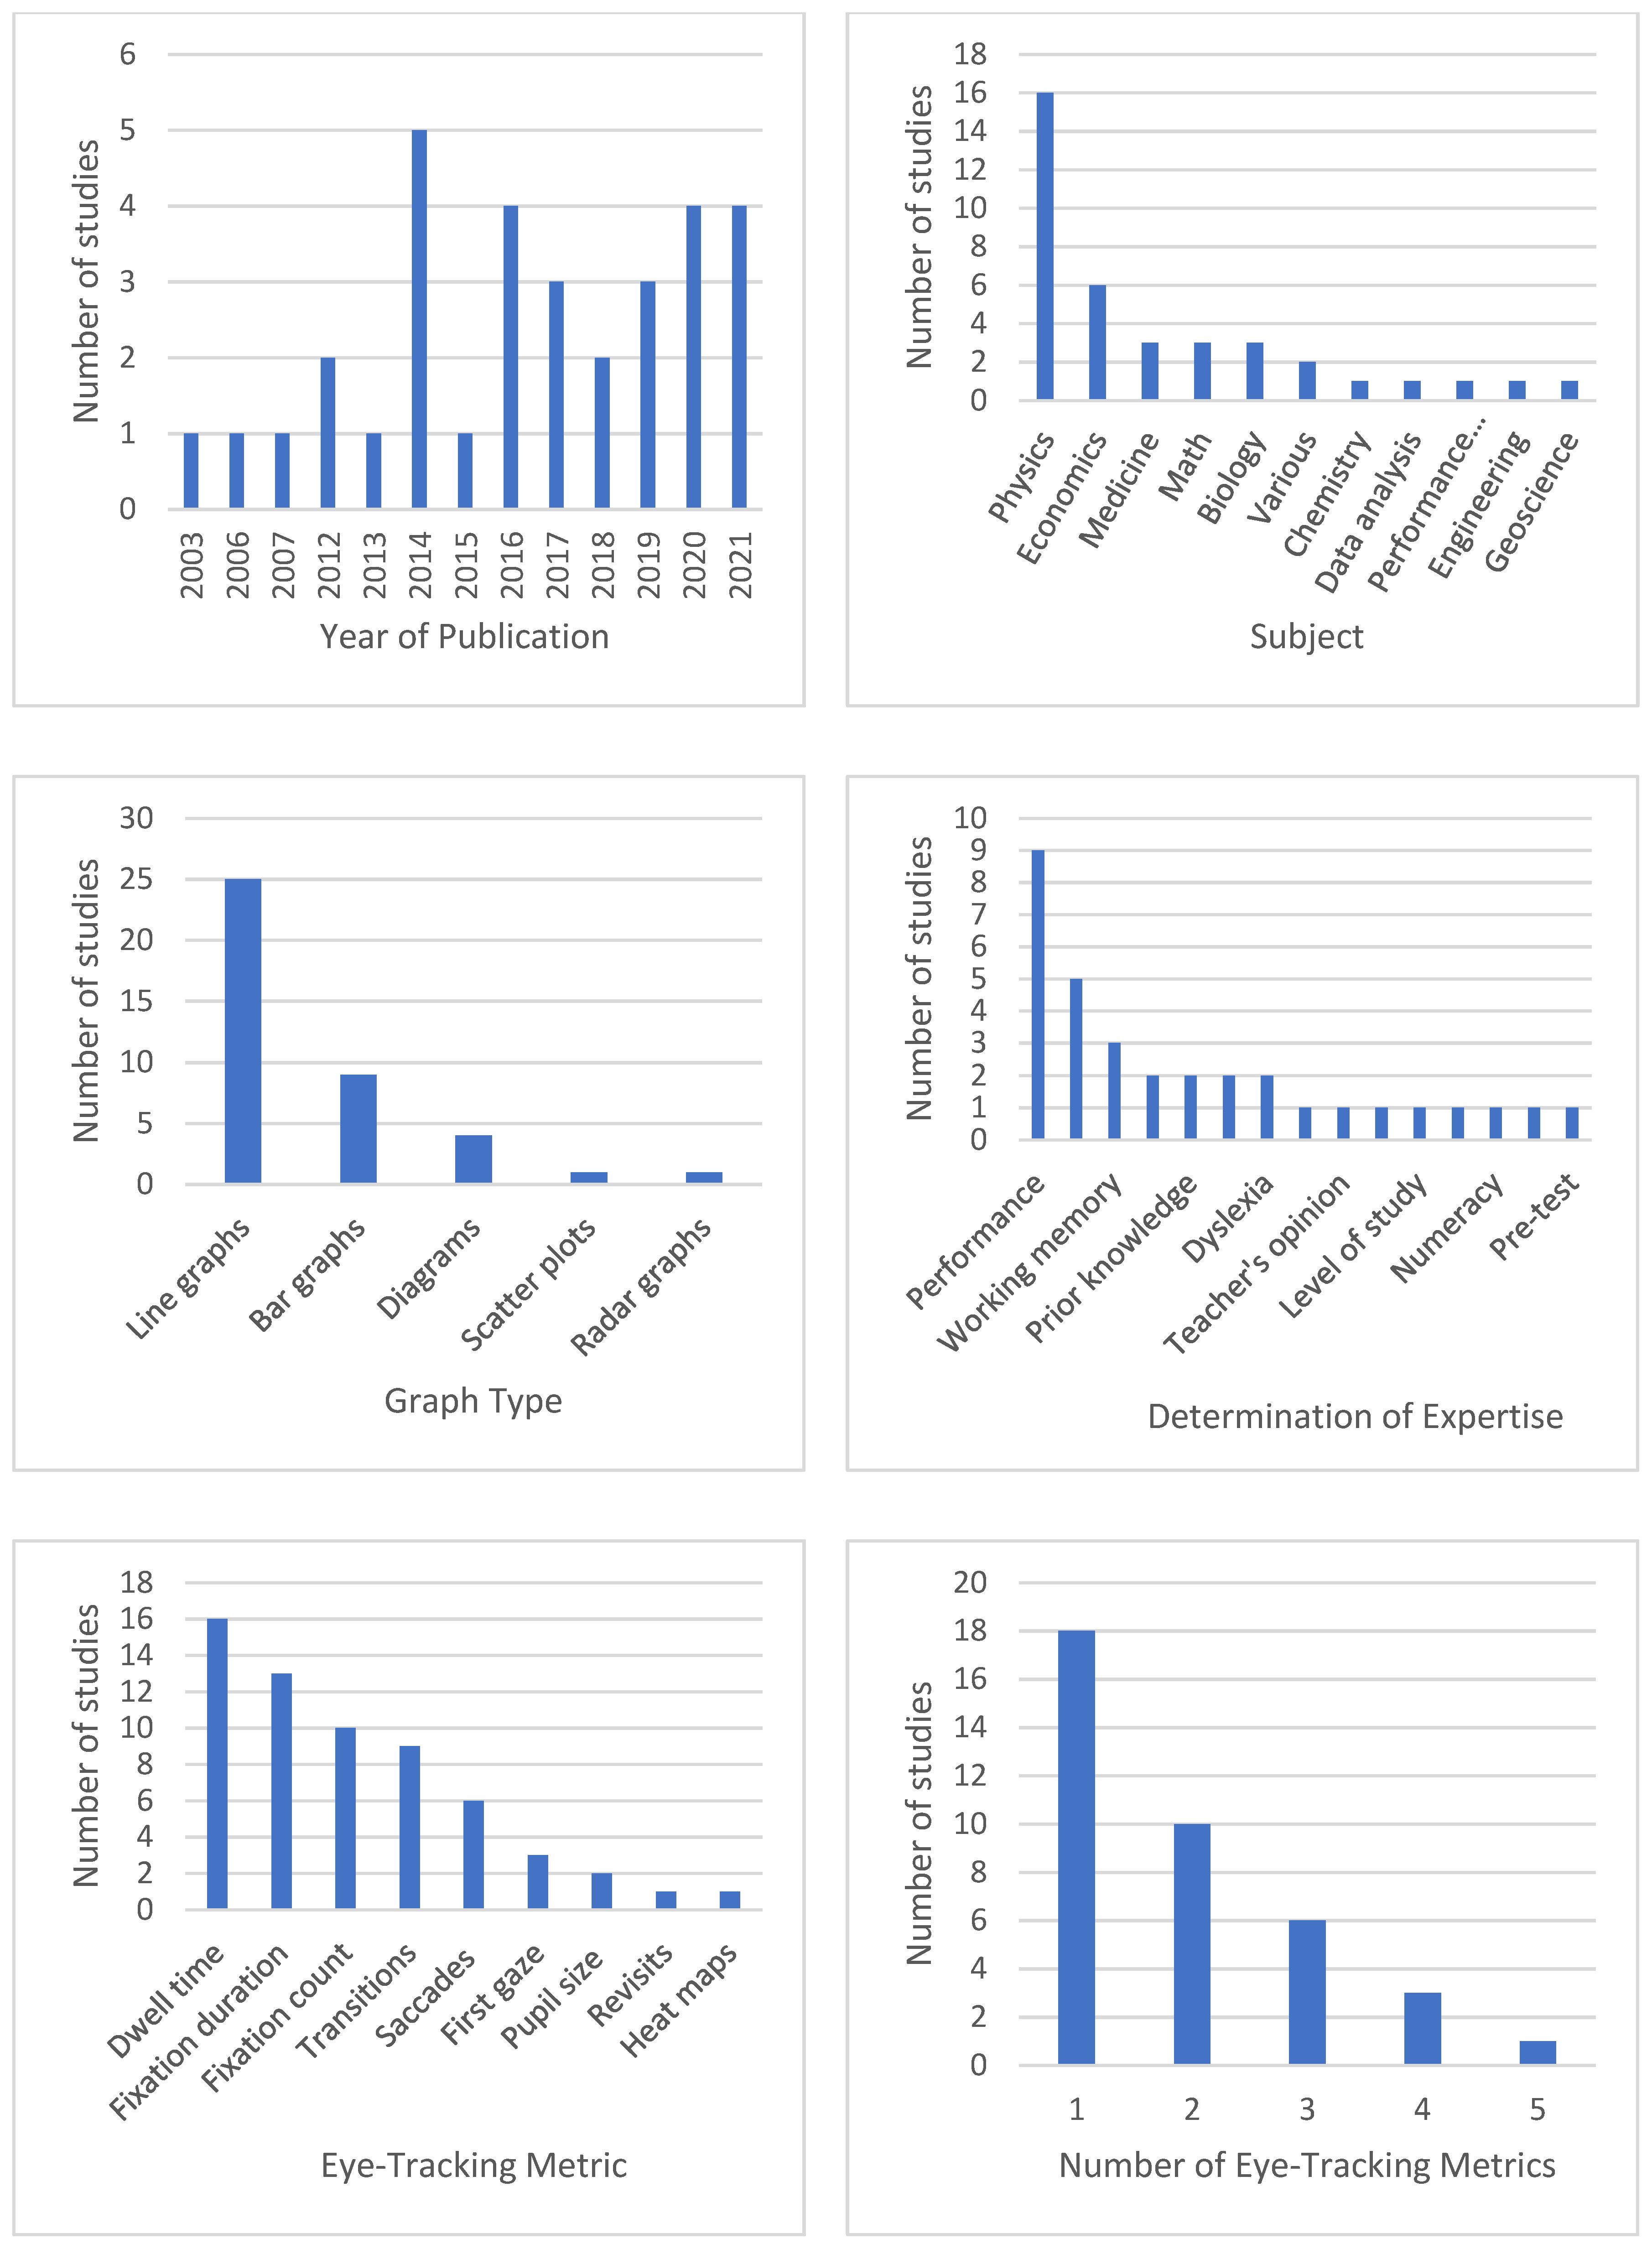
3.1. Publication Period

Of the 32 included articles, the first study was published in 2003 (see Figure 1, top left). In the first decade starting from 2003, only a limited number of six studies were published, whereas most studies (n = 26) were published after 2013. The number of studies in our review did not increase uniformly, as we identified six years between 2003 and 2013 in which no studies with eye tracking that examined the visual behavior of experts and non-experts during problem-solving and learning with graphs were published. After 2014, we could see an increase in the number of publications about visual behavior when looking at graphs, with five publications in 2014 and four each in 2016, 2020, and 2021. Starting in 2018, a more constant number of studies comparing experts and non-experts when learning or solving problems with graphs were published.
This distribution is comparable to other reviews about eye tracking in education. Before 2006, only a few eye-tracking studies were published in math education research [25], increasing until the year 2018. The authors stated that this increase could be due to the technical advances in eye-tracking technology and therefore easier usage [25]. Correspondingly, more terms related to eye tracking (“eye[-]tracking”, “eye[-]movement”, “gaze[-]tracking”, “gaze[-]movement”) were identified via content analysis in the proceedings of the International Group for the Psychology of Mathematics Education, indicating an increased relevance of eye-tracking technology in education research [27].

3.2. Domains and Types of Graphs

In education research, eye-tracking studies about experts and non-experts learning and solving problems with graphs have been conducted in various STEM subjects (see Figure 1, top right). Out of 32 studies, 16 presented graphs based on the subject of physics, for example, works by Dzsotjan et al. [34] or Kozhevnikov et al. [35]. Out of these, three articles compared physics with economics graphs [1,11,36]. Following physics and economics, the second most studies were conducted in medicine [10,37], mathematics [38,39,40], and biology [41,42,43] with three published experiments per subject.
Most of the studies (n = 25) used line graphs (Figure 1, middle left). This finding holds when looking at specific STEM subjects. For example, 13 out of the 16 physics studies presented line graphs. This corresponds to the common topic of kinematics [44,45]. Studies on visual behavior in graphs in a biological domain also used line graphs exclusively [41,42,43]. Studies in a mathematics and medical domain also mostly used line graphs (math: [38,40]; medicine: [10,37]). However, Okan et al. [10] analyzed the visual processing of line and bar graphs in a medical domain. Likewise, bar graphs in combination with line graphs were the focus of studies in a geoscience domain [23]. Furthermore, bar graphs were used in combination with radar graphs [46]. Studies using only bar graphs ranged in topic from economics [47] to data analysis [48].

3.3. Determination of Expertise

To compare the visual behavior of participants of various expertise levels during problem-solving and learning with graphs, researchers classified their participants according to different measures. An overview of the measures used for expertise determination across all experiments can be seen in Figure 1 (middle right). An overview of the expertise determination in individual studies can be found in Table 2. Please note that we cannot identify potential differences and overlaps between the measures used to determine expertise because not all test materials were publicly available. In the Introduction we presented four factors that are often used to determine expertise: (1) graphical literacy, (2) domain knowledge, (3) mathematical prior knowledge, and (4) task knowledge. However, some of the measures used to determine expertise in the studies examined in this review cannot be categorized as one of these four. Clear discrimination between these factors may not always be possible and mapping them with the indicators of expertise used in the studies is complex. For example, an item in which students solve a problem with a graph may contain information about students’ prior knowledge in both domain and math contexts as well as a certain level of graphical literacy skills and task knowledge. In such a case, the performance when solving the item would measure all four factors. Similarly, learning gain [34], teacher’s opinion [49], level of study [41], comparison with professionals [50] and pretest score (e.g., in graph understanding [23]) may all cover the four factors. In contrast, working memory [51], spatial abilities [35], and dyslexia [38,39] do not address any of these factors, whereas the remaining determinators cover only parts of the factors, although one might argue that the latter contains the factor of task knowledge, as dyslexic participants had trouble with reading.
Most researchers determined expertise post-hoc based on participants’ performance in the learning or problem-solving task (e.g., [52,53,54]). Determining expertise a priori based on their domain of study was performed when comparing students of different subjects (e.g., [1,11]) or science with non-science students [55].
Moreover, some authors used multiple measures, for example, working memory capacity and subjective assessments of visualization experience [46].
Although there was a clear preference to use performance and domain to determine experts, other—sometimes unusual—measures were also employed. Many studies compared experts and non-experts via students’ performance on specific tasks, where expertise might be located on a continuous scale, instead of comparing groups with clear distinctions. The variety of ways expertise was determined should be kept in mind when interpreting the eye-tracking metrics and comparing experts and non-experts as described in the next sections.

3.4. Eye-Tracking Metrics

Previous studies used various eye-tracking metrics to compare the visual processes of experts and non-experts during problem-solving and learning with graphs. In the following, we aim to provide an overview of the analyzed eye-tracking metrics in the included studies (research aim 1).
Figure 1 (lower left) shows the eye-tracking metrics that the authors of the 32 included studies used to compare the visual behavior of experts and non-experts. Eye-tracking metrics can be grouped into static and dynamic metrics. The sum of static metrics or the average of eye movements over time, for example, attained by calculating the duration someone fixated on a stimulus for the entire time the stimulus, is shown. Dynamic metrics include information about the change in visual attention over time, e.g., the number of eye-movement switches from one part of the stimulus to another (gaze transitions) or the duration between two fixations (saccadic duration). Static eye-tracking metrics in the included studies were based on fixations. These metrics were evaluated by most studies, e.g., mean fixation duration (e.g., [23,56]) or the fixation count. Another popular static metric was dwell time, which describes the sum of total fixation durations and the total duration of saccades within an AOI [57]. However, definitions of dwell time in the articles differ. Whereas some defined it as the “viewing time” [36] (p. 4), others used more specific definitions, such as “eye movements below an acceleration of 8500°/s2 and a velocity below 30°/s” [11] (p. 5). In some cases, we coded metrics as dwell time based on the description in the papers (e.g., “gaze duration”, p. 335, [58]), although, in general, we classified the used eye-tracking metrics based on the terms the authors used. Dwell time was also used to calculate new metrics, such as the so-called domain-relative attention, which is defined by dividing the relative dwell time of an AOI by the relative area of the AOI [59]. Other static eye-tracking metrics were the mean time to first fixation on an AOI [60], the pupil size (e.g., [58]), and the number of revisits on AOIs [42]. Dynamic eye-tracking metrics that were used to distinguish the visual processing of experts and non-experts during problem-solving and learning with graphs included transitions (e.g., [40]), and saccades (gaze jumps between two fixations, e.g., saccade duration [43]; absolute saccadic direction [1]). One study qualitatively analyzed heat maps without specifying on what metric they were constructed [54].
Since there are noticeable differences in the type of metric between studies, we also analyzed how many eye-tracking metrics were used in each study. We found that most studies examined more than one eye-tracking metric (M = 1.92, SD = 0.9) but this value differed across domains (see Figure 1, lower right). An exception was one study that used five metrics (fixation duration, fixation count, initial gaze, pupil size, and saccade counts [58]). Three studies used four eye-tracking metrics, e.g., for analyzing individual user characteristics when evaluating student performance (fixation count, fixation duration, saccades, and transitions [46]).
As physics is the most common domain in this review (n = 16, see section Domains and Types of Graphs), we wanted to take a closer look at the eye-tracking metrics used in physics studies. An overview of the metrics used to compare experts and non-experts’ visual behaviors when looking at graphs in the domain of physics can be seen in Figure 2. As studies usually collected several eye-tracking metrics (e.g., [34]), the reported number of metrics exceeds the actual number of studies. In all these studies, participants were supposed to solve problems. One exception was a study that analyzed differences in gaze behavior between experts and non-experts before walking the shape of a graph [34]. Static metrics were used to analyze differences in the visual attention of experts and non-experts on relevant and irrelevant areas [1,56]. Comparable to the overall distribution, most studies analyzed dwell time, often comparing physics and non-physics students [1,36]. Both studies found that physics students looked longer at the graph (see section Gaze Behavior below for a closer analysis). Dynamic metrics, such as transitions, were used to predict the performance of students solving the Test of Understanding Graphs in Kinematics (TUG-K [53]).

3.5. Gaze Behavior of Experts and Non-Experts

To summarize the previously found differences in visual behavior between experts and non-experts during problem-solving or learning with graphs (research aim 2), we differentiated the analysis of eye-tracking metrics, whether static or dynamic, depending on the granularity of the AOIs. We therefore consider results based on the way AOIs are defined: at macro- or meso-level and at micro-level (see also section Data Extraction). We first present the results based on the bigger macro- and meso-level AOIs and then go on to the smaller micro-level AOIs.

3.5.1. Macro- and Meso-Level

Macro- and meso-level AOIs consist of an entire graph or analyze mid-sized sections of a graph, such as the axes and the graph. Results of studies using meso- and micro-level AOIs can be seen in Table 3.
Regarding the analysis of meso- and macro-level AOIs, there were varying results when looking at fixation duration, the fixation count, transitions, and dwell time (see Table 3). First, we look at the static metrics that many studies analyzed: fixation duration, fixation count and dwell time. In general, it seems as if experts pay more attention to relevant areas than non-experts (experiment 1 [10], [23,45,59]) and less attention to irrelevant areas [51,54,55]. Experts might also attend less to the graph than non-experts [36,38,43,50,58], although this finding is unclear, as other studies found no differences [11,49,55,58] or concluded that experts look longer at the graph than non-experts ([42]; [10], experiment 2, only for conflicting graphs).
One study with results that contradict other studies in several instances is the one by Huang and Chen [58]. In this case, expertise was based on gender under the assumption that the gender difference in spatial working memory might influence the integration between text and diagram [58]. However, the authors did not find gender differences in this task. Additionally, only one of the three diagrams analyzed together was a graph [58]. The operationalization of expertise could also not be categorized based on the four factors. The results of this experiment might not match the others due to differences in determining expertise. Similarly, another experiment compared the expertise as determined by the teacher [49]. The authors also concluded that the teacher’s opinion was not well suited for grouping students according to performance [49]. The same might hold true for using dyslexia as a determinator of expertise [38]. The reasons for the varying results of the other studies are less clear. Some compared science and non-science students [11,36,55]. Brückner et al. [11] compared physics and economics students, whereas Susac et al. [36] compared physics and psychology students. Although these student groups had different domain knowledge, one could assume that economics students might have more experience with reading graphs (factor graph literacy) as well as more experience with math lectures (factor math prior knowledge). Economics students might have been more similar to physics students than psychology students in this regard, leading to varying results. Tai et al. [43] compared biology, chemistry, and physics students. Besides the differences in expertise determination, the sample sizes might also play a role in the results (e.g., N = 6 [43]).
There were not as many experiments analyzing dynamic eye-tracking metrics as there were for static eye-tracking metrics (see Table 2). Since transitions were the most used dynamic eye-tracking metric, we will take a closer look at them. Two studies found that experts transitioned less often than non-experts between graphs and text [39,58], whereas others found the opposite [42]. An explanation could be that the transitions of experts were more strategic during problem-solving [40], which could lead to experts making the same relative number of transitions as non-experts, taking the total number of transitions into account [10] (experiment 1).

3.5.2. Micro-Level

In contrast to macro- and meso-level AOIs, AOIs at the micro-level are very small and include specific parts of the graph, for example, certain sections of the x-axis. In this section, we will consider experts’ strategies solely on the graph area (i.e., without the question or answer choices). To get an understanding of experts’ strategies at this level, a finer classification of AOIs in the graph domain is warranted, typically considering individual values separately. The results of studies using these types of AOIs can be seen in Table 4.
Similarly, to meso- and macro-level AOIs, regarding static eye-tracking metrics, experiments analyzing micro-level AOIs also found that experts paid more attention to relevant AOIs [1,37,47,52,53,56], including graph information [35,41,46]. Furthermore, experts looked at the entire graph [1]. Moreover, experts seemed to systematically distribute their gaze not only spatially but also temporally [41]. In one example, a faculty member analyzed a graph and the authors showed that efficient information processing meant specifically evaluating graph information and related data at the beginning of viewing. In contrast, inexperienced students jumped between information sources and especially back to the task and the answer choices in no particular order [41].
Few experiments analyzed dynamic eye-tracking metrics in a micro-level analysis (see Table 4). It is difficult to draw a conclusion from such a small sample. In the following section we therefore aim to summarize the visual strategies of experts and non-experts during problem-solving and learning with graphs over the bigger (meso- and macro-level) and smaller (micro-level) AOIs.

4. Discussion

The aim of the present literature review was twofold: (1) We wanted to give an overview of the eye-tracking metrics used to compare experts and non-experts when problem-solving and learning with graphs. Furthermore, we focused on the visual strategies of experts and non-experts guided by the research foci of the identified research articles (2). We further categorized AOIs based on their size, as it might influence the analysis of whether the AOIs are at the bigger meso- and macro-level or at the smaller micro-level.

4.1. Summary of Experts’ and Non-Experts’ Visual Strategies

To analyze the visual strategies of experts and non-experts during problem-solving and learning with graphs, we first summarize the eye-tracking metrics used in the studies and the according experiments included in this literature review (research aim 1). As there were differences between meso-/macro- and micro-level eye-movement analyses of eye-tracking metrics, we examine those separately before summarizing the visual strategies of experts and non-experts (research aim 2). Finally, we discuss the various ways expertise was determined and how this might influence the interpretation of eye-tracking results.

4.1.1. Overview of Eye-Tracking Metrics

Most experiments compared static metrics, such as dwell time, and fixation duration or fixation count, to analyze visual behavior (n = 39). In comparison, only 15 experiments analyzed dynamic eye-tracking metrics, such as transitions and saccades. Static metrics are useful to analyze the visual behavior over the entire time participants looked at stimuli (e.g., see section Eye-Tracking Metrics). Dynamic metrics can be used to analyze the (temporal) strategy of participants when looking at a stimulus. Although many studies only measured one metric (n = 18), researchers analyzed two eye-tracking metrics on average. Four out of 32 experiments used four or more eye-tracking metrics.
Fixation duration and fixation count were useful for both small and large AOIs. Using two or more (uncorrelated) metrics might give researchers more insight into the visual behavior, especially in a combination of static and dynamic metrics. Regarding transitions between AOIs, we recommend a micro-level analysis, because it is very sensitive to differences between experts and non-experts in more detail. As was common in most studies, we also recommend distinguishing between task- or conceptually relevant and irrelevant AOIs.

4.1.2. Meso-and Macro- vs. Micro-Level AOIs

The distinction between relevant and irrelevant AOIs was quite common in the experiments included in the literature review. However, there might be differences when taking the size of the AOIs into account.
In general, the findings between macro- or meso-level AOIs and micro-level AOIs were very similar (e.g., for fixation duration and fixation count, see Table 3 and Table 4), but there were contrary findings when analyzing transitions at different levels. At the meso- and macro-level, experts seemed to make fewer transitions than non-experts (see Table 3). In contrast, at the micro-level, experts made more transitions than non-experts between conceptually relevant AOIs (see Table 4). On a micro-level analysis, experts transitioned more between AOIs, whereas experts seemed to make fewer transitions between AOIs when looking at macro- and meso-level AOIs. One reason could be that experts seemed to pay closer attention to the relevant details of the graph (e.g., [52,53,56]). However, only one experiment analyzed transitions at the micro-level [53]; consequently, it will be necessary to confirm these results before a conclusion can be drawn. We nevertheless can make some statements taking previous theories into account.
As mentioned in the Introduction, there are several theories why there are differences in the visual behavior of experts and non-experts. The results of some experiments included in the literature review support several of those theories. For example, at macro- and meso-level AOIs, Okan et al. [10] demonstrated the so-called information-reduction hypothesis [17,20] in a comparison of participants with high and low graph literacy as investigated in a pre-test. In two studies, AOIs were defined at the meso-level and experts were classified using a graph comprehension test [10]. Consistent with the information-reduction hypothesis, the authors observed that experts were better at identifying task-relevant areas in a graph, which allowed them to spend a greater relative amount of time evaluating relevant information. Specifically, the authors showed that participants with high graph understanding reviewed axes’ labels and scaling more frequently to avoid errors [10] (experiment 1). This corresponds to results by Rouinfar and colleagues [59], who found that participants who solved the problem correctly paid more attention to relevant areas of a diagram than incorrect solvers. Rouinfar et al. compared the influence of color highlighting on information extraction with 80 physics students and they stressed the importance of the ability to organize and integrate information to solve a problem correctly. This result confirmed that the improved performance was caused by a learned automatism in task performance (automatism hypothesis) and not by increased awareness of the relevant domains [59] (priority hypothesis). Similarly, Okan et al. [10] observed that the highest number of transitions seemed to occur between the graph region and the question and between the graph region and the axes [10] (experiment 1), which are relevant areas as well. At the micro-level, experts also paid more attention to relevant AOIs, which is in line with the results at the meso- and macro-level and the information-reduction hypothesis [17].
There were not enough experiments to conclusively identify distinct differences between experts and non-experts for specific measures. However, taken together the results of these experiments are in line with existing hypotheses. We therefore believe that we can make some statements about the visual strategies of experts and non-experts during problem-solving and learning with graphs that we will present in the following.

4.1.3. Visual Strategies of Experts and Non-Experts during Problem-Solving and Learning with Graphs

Based on our results, we can make a statement about what distinguishes visual expertise in problem-solving and learning with graphs. Experts systematically looked at relevant information, such as scales as well as labels (e.g., experiment 1 [10]), and performed more integrative eye movements within a graph in terms of dynamic metrics (see Table 3, transitions, revisits, saccades). Therefore, in addition to the formation of chunks [61], information reduction [17,20] is central to expertise related to graphs.
There were some conclusions regarding differences between experts and non-experts viewing specific AOIs. First, experts seemed to spend a relatively short amount of time on the task and answer choices during problem-solving [36,43,50,53], which might also be attributed to the fact that experts did not (or hardly) perform comparisons between answer choices [45]. Instead, experts paid more relative attention to axis scaling, axis labels, and graph progression [53], as well as to conceptually relevant AOIs [37].
Moreover, at least in data extraction, an order of information extraction appeared by comparing several works [41,46,62]. The most efficient order of information extraction seemed to emerge when participants looked at the given variables early on (if this indication existed) and directly identified them in the graph [41,46]. Thereby, a recognition of the respective axis and its scaling could take place (experiment 1 [10]; [53]), followed by a jump back to the task [41] to identify the target variable, which is then looked for directly in the graph [62]. Depending on cognitive abilities and the task difficulty, one may jump back to variable information [41]. The expertise seems easily transferable to other styles of graphs (e.g., linear vs. radial) but not (or only by further training) to other types of graphs (e.g., line and bar graphs) [63].
However, possible deviations from this strategy at high expertise have not been identified yet. Furthermore, influences or trade-offs that lead to deviation from this optimal strategy in experts remain unclear. In addition, the optimal temporal sequence for more complex tasks was not determined. A complex task would be, for example, determining the slope or the area underneath a graph. So far, in two tasks, it seemed that students with correct solutions looked longer along the graph (when determining the slope) and into the areas below and above the graph (when determining the area) [52].
There have also been some inconsistencies in our results (see Gaze Behavior of Experts and Non-Experts). These might be due to the determination of expertise in individual studies. As mentioned in the beginning, four factors are important when determining expertise in this area: (1) graphical literacy [8,9,10]; (2) domain knowledge [9,11]; (3) math prior knowledge [8]; (4) task knowledge [12].
In our review, performance, learning gain, level of study, comparison with professionals, and a pretest were measures used to determine expertise that may have fulfilled all four factors of graph-comprehension skills. A teacher’s opinion may also consider all four factors. However, this did not prove to be a good indicator of expertise. Of these measures, performance was the most common one (Figure 1, middle right). Learning gain, level of study, comparison with professionals, and pretest were only used to determine expertise in one study, respectively (see Table 2). A direct comparison between studies using the same expertise determinator is generally possible, but the nine studies using performance vary strongly regarding AOI sizes and eye-tracking metrics, which makes them unsuitable for direct comparison. However, there are no conflicts in the findings. In sum, we recommend using objective measures for determining expertise and using tests that explicitly address all four factors to allow for replicability and comparability.

4.2. Limitations

Our review of the literature about visual processing comparing experts and non-experts during problem-solving and learning with graphs has several limitations. First, we did not concentrate on one specific definition of expertise determination. Therefore, studies used various measures to define and compare groups of varying expertise. This could be one reason for the contrasting results. It also made drawing overarching conclusions difficult.
Second, there were some inconsistencies in using terms for eye-tracking metrics. For example, the difference between dwell time and viewing time was not always clear. In one case, the basis for the calculation of heat maps was not reported [54].
Third, in analyzing the various articles on eye tracking during learning and problem-solving with graphs, the resolution of the eye-tracking systems was not considered. This means that the accuracy with which the results were reported may be subject to variation. An increase in spatial and temporal resolution, as well as accuracy, over the period studied may well be expected due to technological advancements in eye-tracking devices.
We do not claim completeness for the studies included in our review. Our search process was not entirely systematic, which might have led to an incomplete list of included studies. We also did not include grey literature, which might have resulted in a publication bias towards positive and significant results. Moreover, results were only coded by the first author; we could therefore not assess the validity of our codes. However, the codes were straightforward, apart from the eye-tracking metrics concerning dwell time, which made coding relatively easy.

4.3. Future Research

We aimed to examine relevant articles that investigated gaze behavior during problem-solving and learning with graphs. One of the main limitations of this literature review was the differing definitions of expertise determination. We therefore suggest the consideration of the four factors (1) graphical literacy, (2) domain knowledge, (3) mathematical prior knowledge, and (4) task knowledge. For example, expertise is sometimes established only based on the study progress [41]. This leaves it unclear to the reader to what extent participants are truly experts. Ideally, a criterion based on an assessment that tests the four factors would be established. In addition to these four factors, efficiency in visual processing, if applicable, may also be used as a criterion of expertise determination [32].
In general, it is probably the best idea to find a field consensus for the definition of experts. In the case of graphs, it might be difficult to identify the specific field to which graphs belong, and to find a consortium of researchers that represents all relevant fields. Therefore, we suggest an iterative empirical approach: Due to the lack of consensus for the definition of experts, we propose a research-informed and domain-independent identification of a group of experts. As a next step, it is necessary to verify and consequently to refine such identification of experts, which in turn needs to be tested again.
In the case of graphs, we believe that the most important variables are the AOIs that experts used to solve the task for various types of graphs and domains, how long they need to focus on it, and how they connect these areas (in terms of gaze transitions). Once there is such validated definition of experts, the visual processes of those experts would be a great implementation for teaching the understanding and efficient processing of graphs, how to approach graphs in unknown fields, i.e., to transfer the skills to other domains, how to best implement information in graphs, and how to design graphs.
We assumed that the articles identified in this review would be largely limited to stationary eye-tracking systems, as graphs in experiments in education research are primarily presented digitally on a computer screen. In fact, only three studies examined gaze behavior during problem-solving or learning with mobile eye-tracking systems [34,38,50]. This observation could be expected given the more diverse technological solutions and easier feasibility of stationary eye-tracking studies. As most studies with mobile eye tracking were published recently, we believe that their number will increase in the future. In terms of analysis of eye-tracking metrics, graphs mainly analyze spatial distributions of gaze. We could identify only one paper [41] that evaluated a temporal sequence of attention in problem-solving with graphs. However, others made the first steps, such as looking at the total fixation time on an AOI vs. the fixation time in the first two seconds in an AOI [56]. Accordingly, the evidence on expert strategies is also limited only to the spatial distribution of gaze. It would be interesting to see whether there are also temporal differences between experts and non-experts during problem-solving or learning with graphs.
We found two papers that depicted an evolution in subjects’ gaze behavior while problem-solving or learning with graphs [11,59]. In both cases, there was no specific instruction to influence gaze behavior. Accordingly, the extent to which learning gains in graph comprehension are associated with changes in gaze behavior is currently under research. Furthermore, studying whether the results of problem-solving activities are transferable to learning would be very valuable. In this way, it would also be interesting to analyze the various phases of problem-solving separately. As mentioned above, there could be an ideal strategy to extract information from graphs and a closer look at these phases could be interesting.
Visual processing during problem-solving and learning might also depend on the education level of the participants. Most studies were conducted with college or university students; there are currently only three studies that investigate the gaze behavior of high school students during graph viewing [40,45,52]. Consequently, most papers have investigated an advanced stage of gaze behavior in graphs; there were no studies that analyzed the gaze behavior of children just learning about graphs. An account of the gaze behavior of students, who are just acquiring the understanding of graphs, and appropriate instructional suggestions based on this, are therefore currently missing. Our sample might also be biased towards physics because half of the included experiments (n = 16) used graphs in this domain. Although some studies compared various STEM contexts (e.g., biology, chemistry, and physics [43]), future research would benefit from comparisons in more domains as well as more types of graphs, since most experiments analyzed line graphs. Due to our limited sample, replication studies of the experiments presented here, for example with differing eye-tracking metrics or in other domains, might further strengthen the current evidence base.

5. Conclusions

Experts and non-experts differ in the way they interpret graphs. We reviewed 32 articles about experts and non-experts solving problems and learning with graphs. Most commonly examined eye-tracking metrics were static, such as fixation duration and fixation count. Experts seemed to focus longer on relevant areas and to identify the relevant variables in the graphs faster than non-experts. Their visual processing also seemed to be more systematic than that of non-experts: first identifying the given variables and then directly looking for the target variable in the task and the graph. Regarding dynamic process metrics, we suggest studying transitions between small areas of interest, and we encourage considering temporal metrics in future research. Furthermore, expertise was determined in different ways across studies, which are partially not in line with previous determinators of expertise in graph comprehension, limiting the replicability and comparability of findings. As a starting point for future research, we therefore recommend a clear definition of expertise and propose four factors of graph-comprehension skills as a starting point for consideration: (1) graphical literacy, (2) domain knowledge, (3) mathematical prior knowledge, and (4) task knowledge.

Author Contributions

Conceptualization, J.K. and S.K.; methodology, S.K. and V.R.; formal analysis, S.K. and V.R.; investigation: S.K. and V.R., validation: M.B., F.F., M.R.F., A.H., S.I.H., J.K., S.K., V.R. and J.M.Z.; data curation, V.R.; writing—original draft preparation, S.K. and V.R.; writing—review and editing, M.B., F.F., M.R.F., A.H., S.I.H., J.K., S.K., V.R. and J.M.Z.; visualization: V.R.; supervision, J.K. and S.K.; project administration, S.K. All authors have read and agreed to the published version of the manuscript.

Funding

This research received no external funding.

Institutional Review Board Statement

Not applicable.

Informed Consent Statement

Not applicable.

Data Availability Statement

Data is contained within the article.

Conflicts of Interest

The authors declare no conflict of interest.

References

  1. Klein, P.; Küchemann, S.; Brückner, S.; Zlatkin-Troitschanskaia, O.; Kuhn, J. Student understanding of graph slope and area under a curve: A replication study comparing first-year physics and economics students. Phys. Rev. Phys. Educ. Res. 2019, 15, 1–17. [Google Scholar] [CrossRef] [Green Version]
  2. Stern, E.; Aprea, C.; Ebner, H.G. Improving cross-content transfer in text processing by means of active graphical representation. Learn. Instr. 2003, 13, 191–203. [Google Scholar] [CrossRef]
  3. Duval, R. A cognitive analysis of problems of comprehension in a learning of mathematics. Educ. Stud. Math. 2006, 61, 103–131. [Google Scholar] [CrossRef]
  4. Gutiérrez, F.; Seipp, K.; Ochoa, X.; Chiluiza, K.; De Laet, T.; Verbert, K. LADA: A learning analytics dashboard for academic advising. Comput. Hum. Behav. 2018, 107, 105826. [Google Scholar] [CrossRef]
  5. Leinhardt, G.; Zaslavsky, O.; Stein, M.K. Functions, Graphs, and Graphing: Tasks, Learning, and Teaching. Rev. Educ. Res. 1990, 60, 1–64. [Google Scholar] [CrossRef]
  6. Gould, R. Data literacy is statistical literacy. Stat. Educ. Res. J. 2017, 16, 22–25. [Google Scholar] [CrossRef]
  7. Program for International Student Assessment (PISA). PISA 2022 Mathematics Framework. 2022. Available online: https://pisa2022-maths.oecd.org/ (accessed on 22 September 2022).
  8. Curcio, F.R. Comprehension of Mathematical Relationships Expressed in Graphs. J. Res. Math. Educ. 1987, 18, 382–393. [Google Scholar] [CrossRef]
  9. Freedman, E.G.; Shah, P. Toward a model of knowledge-based graph comprehension. In Diagrammatic Representation and Inference; Lecture Notes in Computer Science (Including Subseries Lecture Notes in Artificial Intelligence and Lecture Notes in Bioinformatics); Springer: Berlin/Heidelberg, Germany, 2002; Volume 2317, pp. 18–30. [Google Scholar] [CrossRef]
  10. Okan, Y.; Galesic, M.; Garcia-Retamero, R. How people with low and high graph literacy process health graphs: Evidence from eye-tracking. J. Behav. Decis. Mak. 2015, 29, 271–294. [Google Scholar] [CrossRef] [Green Version]
  11. Brückner, S.; Zlatkin-Troitschanskaia, O.; Küchemann, S.; Klein, P.; Kuhn, J. Changes in Students’ Understanding of and Visual Attention on Digitally Represented Graphs Across Two Domains in Higher Education: A Postreplication Study. Front. Psychol. 2020, 11, 1–20. [Google Scholar] [CrossRef]
  12. Friel, S.N.; Curcio, F.R.; Bright, G.W. Making sense of graphs: Critical factors influencing comprehension and instructional implications. J. Res. Math. Educ. 2001, 32, 124. [Google Scholar] [CrossRef] [Green Version]
  13. Kok, E.M.; Jarodzka, H.; de Bruin, A.; BinAmir, H.A.N.; Robben, S.G.F.; Van Merriënboer, J.J.G. Systematic viewing in radiology: Seeing more, missing less? Adv. Health Sci. Educ. 2015, 21, 189–205. [Google Scholar] [CrossRef] [Green Version]
  14. Mudrick, N.V.; Azevedo, R.; Taub, M. Integrating metacognitive judgments and eye movements using sequential pattern mining to understand processes underlying multimedia learning. Comput. Hum. Behav. 2019, 96, 223–234. [Google Scholar] [CrossRef]
  15. Just, M.A.; Carpenter, P.A. A theory of reading: From eye fixations to comprehension. Psychol. Rev. 1980, 87, 329–354. [Google Scholar] [CrossRef] [PubMed]
  16. Kundel, H.L.; Nodine, C.F.; Conant, E.F.; Weinstein, S.P. Holistic component of image perception in mammogram interpretation: Gaze-tracking study. Radiology 2007, 242, 396–402. [Google Scholar] [CrossRef] [PubMed]
  17. Gegenfurtner, A.; Lehtinen, E.; Säljö, R. Expertise differences in the comprehension of visualizations: A meta-analysis of eye-tracking research in professional domains. Educ. Psychol. Rev. 2011, 23, 523–552. [Google Scholar] [CrossRef]
  18. Sheridan, H.; Reingold, E.M. The holistic processing account of visual expertise in medical image perception: A review. Front. Psychol. 2017, 8, 1620. [Google Scholar] [CrossRef]
  19. Ericsson, K.A.; Kintsch, W. Long-Term Working Memory. Psychol. Rev. 1995, 102, 211–245. [Google Scholar] [CrossRef]
  20. Haider, H.; Frensch, P.A. Eye movement during skill acquisition: More evidence for the information-reduction hypothesis. J. Exp. Psychol. Learn. Mem. Cogn. 1999, 25, 172. [Google Scholar] [CrossRef]
  21. Xie, H.; Zhao, T.; Deng, S.; Peng, J.; Wang, F.; Zhou, Z. Using eye movement modelling examples to guide visual attention and foster cognitive performance: A meta-analysis. J. Comput. Assist. Learn. 2021, 37, 1194–1206. [Google Scholar] [CrossRef]
  22. Noroozi, O.; Alikhani, I.; Järvelä, S.; Kirschner, P.A.; Juuso, I.; Seppänen, T. Multimodal data to design visual learning analytics for understanding regulation of learning. Comput. Hum. Behav. 2019, 100, 298–304. [Google Scholar] [CrossRef]
  23. Atkins, R.M.; McNeal, K.S. Exploring differences among student populations during climate graph reading tasks: An eye tracking study. J. Astron. Earth Sci. Educ. (JAESE) 2018, 5, 85–114. [Google Scholar] [CrossRef]
  24. Hahn, L.; Klein, P. Eye tracking in physics education research: A systematic literature review. Phys. Rev. Phys. Educ. Res. 2022, 18, 013102. [Google Scholar] [CrossRef]
  25. Strohmaier, A.R.; MacKay, K.J.; Obersteiner, A.; Reiss, K.M. Eye-tracking methodology in mathematics education research: A systematic literature review. Educ. Stud. Math. 2020, 104, 147–200. [Google Scholar] [CrossRef]
  26. Brams, S.; Ziv, G.; Levin, O.; Spitz, J.; Wagemans, J.; Williams, A.M.; Helsen, W.F. The relationship between gaze behavior, expertise, and performance: A systematic review. Psychol. Bull. 2019, 145, 980. [Google Scholar] [CrossRef]
  27. Lilienthal, A.J.; Schindler, M. Current Trends in Eye Tracking Research in Mathematics Education: A PME Literature Review: A PME Survey. In Proceedings of the Annual Meeting of the International Group for the Psychology of Mathematics Education (PME-43), Pretoria, South Africa, 7–12 July 2019; Volume 4, p. 62. [Google Scholar]
  28. Alemdag, E.; Cagiltay, K. A systematic review of eye tracking research on multimedia learning. Comput. Educ. 2018, 125, 413–428. [Google Scholar] [CrossRef]
  29. Lai, M.-L.; Tsai, M.-J.; Yang, F.-Y.; Hsu, C.-Y.; Liu, T.-C.; Lee, S.W.-Y.; Lee, M.-H.; Chiou, G.-L.; Liang, J.-C.; Tsai, C.-C. A review of using eye-tracking technology in exploring learning from 2000 to 2012. Educ. Res. Rev. 2013, 10, 90–115. [Google Scholar] [CrossRef]
  30. Jarodzka, H.; Balslev, T.; Holmqvist, K.; Nyström, M.; Scheiter, K.; Gerjets, P.; Eika, B. Conveying clinical reasoning based on visual observation via eye-movement modelling examples. Instr. Sci. 2012, 40, 813–827. [Google Scholar] [CrossRef] [Green Version]
  31. Van Gog, T. 11 The Signaling (or Cueing) Principle in Multimedia Learning. In The Cambridge Handbook of Multimedia Learning; Cambridge University Press: Cambridge, UK, 2014; pp. 263–278. [Google Scholar]
  32. Rau, M.A. Conditions for the effectiveness of multiple visual representations in enhancing STEM learning. Educ. Psychol. Rev. 2016, 29, 717–761. [Google Scholar] [CrossRef]
  33. Andrá, C.; Lindström, P.; Arzarello, F.; Holmqvist, K.; Robutti, O.; Sabena, C. Reading mathematics representations: An eye-tracking study. Int. J. Sci. Math. Educ. 2015, 13, 237–259. [Google Scholar] [CrossRef]
  34. Dzsotjan, D.; Ludwig-Petsch, K.; Mukhametov, S.; Ishimaru, S.; Kuechemann, S.; Kuhn, J. The Predictive Power of Eye-Tracking Data in an Interactive AR Learning Environment. In UbiComp/ISWC 2021—Adjunct Proceedings of the 2021 ACM International Joint Conference on Pervasive and Ubiquitous Computing and Proceedings of the 2021 ACM International Symposium on Wearable Computers; Association for Computing Machinery: New York, NY, USA, 2021; pp. 467–471. [Google Scholar] [CrossRef]
  35. Kozhevnikov, M.; Motes, M.A.; Hegarty, M. Spatial visualization in physics problem solving. Cogn. Sci. 2007, 31, 549–579. [Google Scholar] [CrossRef]
  36. Susac, A.; Bubic, A.; Kazotti, E.; Planinic, M.; Palmovic, M. Student understanding of graph slope and area under a graph: A comparison of physics and nonphysics students. Phys. Rev. Phys. Educ. Res. 2018, 14, 020109. [Google Scholar] [CrossRef] [Green Version]
  37. Keller, C.; Junghans, A. Does guiding toward task-relevant information help improve graph processing and graph comprehension of individuals with low or high numeracy? An eye-tracker experiment. Med. Decis. Mak. 2017, 37, 942–954. [Google Scholar] [CrossRef]
  38. Kim, S.; Lombardino, L.J.; Cowles, W.; Altmann, L.J. Investigating graph comprehension in students with dyslexia: An eye tracking study. Res. Dev. Disabil. 2014, 35, 1609–1622. [Google Scholar] [CrossRef]
  39. Kim, S.; Wiseheart, R. Exploring Text and Icon Graph Interpretation in Students with Dyslexia: An Eye-tracking Study. Dyslexia 2017, 23, 24–41. [Google Scholar] [CrossRef] [PubMed]
  40. Zhu, M.; Feng, G. An exploratory study using social network analysis to model eye movements in mathe-matics problem solving. In Proceedings of the Fifth International Conference on Learning Analytics and Knowledge, Poughkeepsie, NY, USA, 16–20 March 2015; pp. 383–387. [Google Scholar]
  41. Harsh, J.A.; Campillo, M.; Murray, C.; Myers, C.; Nguyen, J.; Maltese, A.V. “Seeing” Data Like an Expert: An Eye-Tracking Study Using Graphical Data Representations. CBE—Life Sci. Educ. 2019, 18, ar32. [Google Scholar] [CrossRef] [PubMed]
  42. Ho, H.N.J.; Tsai, M.-J.; Wang, C.-Y.; Tsai, C.-C. Prior knowledge and online inquiry-based science reading: Evidence from eye tracking. Int. J. Sci. Math. Educ. 2013, 12, 525–554. [Google Scholar] [CrossRef]
  43. Tai, R.H.; Loehr, J.F.; Brigham, F.J. An exploration of the use of eye-gaze tracking to study problem-solving on standardized science assessments. Int. J. Res. Method Educ. 2006, 29, 185–208. [Google Scholar] [CrossRef]
  44. Kekule, M. Students’ approaches when dealing with kinematics graphs explored by eye-tracking research method. In Proceedings of the Frontiers in Mathematics and Science Education Research Conference, FISER, Famagusta, North Cyprus, 1–3 May 2014; pp. 108–117. [Google Scholar]
  45. Klein, P.; Lichtenberger, A.; Küchemann, S.; Becker, S.; Kekule, M.; Viiri, J.; Kuhn, J. Visual attention while solving the test of understanding graphs in kinematics: An eye-tracking analysis. Eur. J. Phys. 2020, 41, 1–16. [Google Scholar] [CrossRef]
  46. Toker, D.; Conati, C.; Steichen, B.; Carenini, G. Individual user characteristics and information visualization: Connecting the dots through eye tracking. In Proceedings of the SIGCHI Conference on Human Factors in Computing Systems, Paris, France, 27 April–2 May 2013; pp. 295–304. [Google Scholar]
  47. Vila, J.; Gomez, Y. Extracting business information from graphs: An eye tracking experiment. J. Bus. Res. 2016, 69, 1741–1746. [Google Scholar] [CrossRef]
  48. Toker, D.; Conati, C. Eye tracking to understand user differences in visualization processing with highlighting interventions. In Proceedings of the International Conference on User Modeling, Adaptation, and Personalization, Aalborg, Denmark, 7–11 July 2014; Springer: Cham, Switzerland, 2014; pp. 219–230. [Google Scholar]
  49. Skrabankova, J.; Popelka, S.; Beitlova, M. Students’ Ability to Work with Graphs in Physics Studies Related to Three Typical Student Groups. J. Balt. Sci. Educ. 2020, 19, 298–316. [Google Scholar] [CrossRef] [Green Version]
  50. Ahmed, A.; Hurwitz, D.; Gestson, S.; Brown, S. Differences between Professionals and Students in Their Visual Attention on Multiple Representation Types while Solving an Open-Ended Engineering Design Problem. J. Civ. Eng. Educ. 2021, 147, 04021005. [Google Scholar] [CrossRef]
  51. Strobel, B.; Grund, S.; Lindner, M.A. Do seductive details do their damage in the context of graph comprehension? Insights from eye movements. Appl. Cogn. Psychol. 2018, 33, 95–108. [Google Scholar] [CrossRef] [Green Version]
  52. Küchemann, S.; Klein, P.; Becker, S.; Kumari, N.; Kuhn, J. Classification of Munich, 10 February 2023 Students’ Conceptual Understanding in STEM Education using Their Visual Attention Distributions: A Comparison of Three Machine-Learning Approaches. In In Proceedings of the 12th International Conference on Computer Supported Education (CSEDU), Prague, Czech Republic, 2–4 May 2020; Volume 1, pp. 36–46. [Google Scholar]
  53. Küchemann, S.; Becker, S.; Klein, P.; Kuhn, J. Gaze-Based Prediction of Students’ Understanding of Physics Line-Graphs: An Eye-Tracking-Data Based Machine-Learning Approach. In Computer Supported Education: 12th International Conference, CSEDU 2020, Virtual Event, May 2–4, 2020, Revised Selected Papers 12; Springer International Publishing: Berlin/Heidelberg, Germany, 2020; pp. 450–467. [Google Scholar] [CrossRef]
  54. Viiri, J.; Kekule, M.; Isoniemi, J.; Hautala, J. Eye-tracking the Effects of Representation on Students’ Problem Solving Approaches. In Proceedings of the FMSERA Annual Symposium, Finnish Mathematics and Science Education Research Association (FMSERA), Joensuu, Finland, 27–28 October 2016; pp. 88–98. [Google Scholar]
  55. Yen, M.H.; Lee, C.N.; Yang, Y.C. Eye movement patterns in solving scientific graph problems. In Proceedings of the International Conference on Theory and Application of Diagrams, Canterbury, UK, 2–6 July 2012; Springer: Berlin/Heidelberg, Germany, 2012; pp. 343–345. [Google Scholar]
  56. Madsen, A.M.; Larson, A.M.; Loschky, L.C.; Rebello, N.S. Differences in visual attention between those who correctly and incorrectly answer physics problems. Phys. Rev. Spéc. Top.-Phys. Educ. Res. 2012, 8, 010122. [Google Scholar] [CrossRef] [Green Version]
  57. Holmqvist, K.; Nyström, M.; Andersson, R.; Dewhurst, R.; Jarodzka, H.; Van de Weijer, J. Eye Tracking: A Compre-Hensive Guide to Methods and Measures; OUP Oxford: Oxford, UK, 2011. [Google Scholar]
  58. Huang, P.-S.; Chen, H.-C. Gender differences in eye movements in solving text-and-diagram science problems. Int. J. Sci. Math. Educ. 2015, 14, 327–346. [Google Scholar] [CrossRef]
  59. Rouinfar, A.; Agra, E.; Larson, A.M.; Rebello, N.S.; Loschky, L.C. Linking attentional processes and conceptual problem solving: Visual cues facilitate the automaticity of extracting relevant information from diagrams. Front. Psychol. 2014, 5, 1094. [Google Scholar] [CrossRef] [Green Version]
  60. Richter, J.; Wehrle, A.; Scheiter, K. How the poor get richer: Signaling guides attention and fosters learning from text-graph combinations for students with low, but not high prior knowledge. Appl. Cogn. Psychol. 2020, 35, 632–645. [Google Scholar] [CrossRef]
  61. Simon, H.A. How big is a chunk? By combining data from several experiments, a basic human memory unit can be identified and measured. Science 1974, 183, 482–488. [Google Scholar] [CrossRef] [PubMed]
  62. Peebles, D.; Cheng, P.C.-H. Modeling the effect of task and graphical representation on response latency in a graph reading task. Hum. Factors J. Hum. Factors Ergon. Soc. 2003, 45, 28–46. [Google Scholar] [CrossRef] [PubMed] [Green Version]
  63. Goldberg, J.; Helfman, J. Eye tracking for visualization evaluation: Reading values on linear versus radial graphs. Inf. Vis. 2011, 10, 182–195. [Google Scholar] [CrossRef]
Figure 1. Overview of the number of studies related to the visual behavior of experts and non-experts’ during learning and problem-solving with graphs per year (top left); number of studies using graphs of a certain subject (multiple mentions are possible, top right); types of graphs used in the studies (middle left); overview of the measure for determining expertise (multiple mentions are possible, middle right); overview of eye-tracking metrics used in the studies included in the literature review (low left); number of eye-tracking metrics used for analyzing visual behavior when looking at graphs (low right).
Education 13 00216 g001
Figure 2. The number and types of eye-tracking metrics used in studies investigating the visual behavior of experts and non-experts learning or problem-solving with physics graphs.
Education 13 00216 g002
Table 1. Categories and terms used for searching.
CategoriesTerms
Visual behavior“eye tracking”, “viewing behavior”, “visual attention”
Graphs“graph”, “diagram”, “function”
Table 2. Overview over studies included in the literature review, including eye-tracking metrics (FD: fixation duration, FC: fixation count; DT: dwell time; S: saccades; FG: first gaze; PS: pupil size; T: transitions; NRV: number of revisits; AOI: area of interest; SD: standard deviation).
ReferenceYear of
Publication
SubjectGraph TypeDetermination of ExpertiseEye-Tracking Metrics
Ahmed et al.2021EngineeringLine graphsProfessionalsFD (average, total), FC (average, total)
Atkins and McNeal2018GeoscienceLine and bar graphsPre-testFD (normalized, total)
Brückner et al.2020Physics, EconomicsLine graphsDomainDT (total, on relevant AOIs)
Dzsotjan et al.2021PhysicsLine graphsLearning gainMultiple features including DT (total, mean; SD of both)
Harsh et al.2019BiologyLine graphs, diagramsLevel of studyFC (normalized), DT (normalized), S (normalized)
Huang and Chen2016PhysicsDiagramSpatial working memoryDT (average), FC (total stimulus, on AOIs), FG, PS, S
Ho et al.2014BiologyLine graphsPrior knowledgeFD (total), T, NRV
Kekule2014PhysicsLine graphsPerformanceHeat maps based on FC
Keller and Junghans2017MedicineLine graphsNumeracyFD (relative), FC (relative)
Kim et al.2014MathLine graphsDyslexiaDT, FG.
Kim and Wisehart2017MathBar graphsDyslexiaDT, T
Klein et al.2019Physics, FinanceLine graphsDomainDT (total; AOI and entire stimulus), FC (average; AOI), S
Klein et al.2020PhysicsLine graphsPerformanceDT
Kozhevnikov et al.2007PhysicsLine graphsSpatial abilityFD (relative)
Küchemann et al.2020PhysicsLine graphsPerformanceDT
Küchemann et al.2021PhysicsLine graphsPerformanceDT (total, relative), T
Madsen et al.2012PhysicsDiagrams, line graphsPerformanceFD (normalized; overall, first two seconds)
Okan et al.2016aMedicineLine and bar graphsGraph literacyFD (total)
Okan et al.2016bMedicineLine and bar graphsGraph literacyFD
Peebles and Cheng2003EconomicsLine graphsNA Not applicable
Richter et al.2021EconomicsLine graphsPrior knowledgeDT, FG, T, PS
Rouinfar et al.2014PhysicsDiagramPerformanceDomain relative ration (relative dwell time /relative area of AOI)
Skrabankova et al.2020PhysicsLine graphsTeacher’s opinionT, FC
Strobel et al.2019Various topicsBar graphsWorking memory capacityFD (total)
Susac et al.2018Physics, FinanceLine graphsDomainDT
Tai et al.2006Various topicsLine graphsDomainFD, DT, S
Toker et al.2013Evaluating student performanceBar and radar graphsWorking memory capacity, visualization experienceFD (total, relative, mean, SD), FC (total, relative), S,T
Toker and Conati2014Data analysisBar graphsPerceptual speed, working memoryFC, FD, S
Viiri et al.2017PhysicsLine graphsPerformanceHeat maps
Vila and Gomez2016EconomicsBar graphsPerformanceDT
Yen et al.2012Physics, various topicsLine graphsDomainDT (normalized), FC
Zhu and Feng2015MathLine graphsPerformanceT
Viiri et al.2017PhysicsLine graphsPerformanceHeat maps
Vila and Gomez2016EconomicsBar graphsPerformanceDT
Yen et al.2012Physics, various topicsLine graphsDomainDT (normalized), FC
Zhu and Feng2015MathLine graphsPerformanceT
Comparison with a scanpath assumed optimal for the task.
Table 3. Overview of findings of studies analyzing eye-tracking metrics based on meso- and macro-level AOIs.
Dependent VariableFindings and References
Fixation durationExperts have longer average fixation durations, but spend a shorter time on the graph than non-experts [50]
Experts have the same fixation duration on a graph as non-experts [55,58]
Experts fixate less on seductive details [54]
Experts pay more attention to trends than non-experts, but non-experts pay more attention to the title and the axes [23]
Experts look longer at the graph than non-experts ([42]; [10], experiment 2, only for conflicting graphs)
Experts look longer at relevant areas (experiment 1 [10]; [59])
Experts look less at irrelevant axes’ labels [54,55]
Fixation countOn average, experts fixate less often on graphs than non-experts [43,58]
Experts and non-experts make the same number of fixations [49]
Experts look less often at irrelevant regions [55]
TransitionsExperts transitioned less often between a graph and text [39,51]
Experts switch more often between graphs and between graphics and text than non-experts [42]
Experts made “more strategic transitions among AOI triples” [40] (p. 1)
Experts made fewer transitions than non-experts on harder tasks [48]
Experts made the same relative number of transitions as non-experts (experiment 1 [10])
First gaze/fixationExperts initially spend more time on the graph than non-experts [58]
Experts look at the graph data later than non-experts [60]
Dwell timeNon-experts spend more time on the graph than experts [36,38]
There are no differences in total dwell time between experts and non-experts [11]
Experts look longer at the correct answer [45]
Experts (i.e., students without dyslexia) paid less attention to the x-axis [39]
SaccadesExperts make fewer saccades than non-experts [43]
RevisitsExperts visit the graph more often than non-experts [42]
Table 4. Overview of findings of studies analyzing eye-tracking metrics based on micro-level AOIs.
Dependent VariableFindings and References
Fixation durationExperts spend more time on graph information (such as title and variables) than non-experts [41,46]
Experts look at the entire graph [1]
Experts spend more time on relevant areas [1,37,47]
Fixation countExperts fixate on the axes more often [35]
Experts visit graph information (such as title and variables) more often than non-experts [41]
Experts fixate more often on task-relevant AOIs [37]
TransitionsExperts transition more often between conceptually relevant areas [53]
RevisitsExperts study the axes, axes labels and line segments more often [35]
Dwell timeExperts look longer at conceptually relevant areas [52,53,56]
Experts spend less time on areas that can be used to calculate the solution [53]
Experts spend less time on areas found relevant for non-experts [56]
SaccadesExperts look along the graph slope [1]
Disclaimer/Publisher’s Note: The statements, opinions and data contained in all publications are solely those of the individual author(s) and contributor(s) and not of MDPI and/or the editor(s). MDPI and/or the editor(s) disclaim responsibility for any injury to people or property resulting from any ideas, methods, instructions or products referred to in the content.

