Article

Assessing Learners’ Conceptual Understanding of Introductory Group Theory Using the CI2GT: Development and Analysis of a Concept Inventory

by
Joaquin Marc Veith
1,*,
Philipp Bitzenbauer
2 and
Boris Girnat
1
1
Institut für Mathematik und Angewandte Informatik, Stiftungsuniversität Hildesheim, 31141 Hildesheim, Germany
2
Physikalisches Institut, Friedrich-Alexander-Universität Erlangen-Nürnberg, 91058 Erlangen, Germany
*
Author to whom correspondence should be addressed.
Educ. Sci. 2022, 12(6), 376; https://doi.org/10.3390/educsci12060376
Submission received: 14 April 2022 / Revised: 24 May 2022 / Accepted: 26 May 2022 / Published: 27 May 2022

Abstract

:
Prior research has shown how incorporating group theory into upper secondary school or undergraduate mathematics education may positively impact learners’ conceptual understanding of mathematics in general and algebraic concepts in particular. Despite a recently increasing number of empirical research into student learning of introductory group theory, the development of a concept inventory that allows for the valid assessment of a respective conceptual understanding constitutes a desideratum to date. In this article, we contribute to closing this gap: We present the development and evaluation of the Concept Inventory of Introductory Group Theory—the CI2GT. Its development is based on a modern mathematics education research perspective regarding students‘ conceptual mathematics understanding. For the evaluation of the CI2GT, we follow a contemporary conception of validity: We report on results from two consecutive studies to empirically justify that our concept inventory allows for a valid test score interpretation. On the one hand, we present N = 9 experts‘ opinions on various aspects of our concept inventory. On the other hand, we administered the CI2GT to N = 143 pre-service primary school teachers as a post-test after a two weeks course into introductory group theory. The data allow for a psychometric characterization of the instrument, both from classical and probabilistic test theory perspectives. It is shown that the CI2GT has good to excellent psychometric properties, and the data show a good fit to the Rasch model. This establishes a valuable new concept inventory for assessing students’ conceptual understanding of introductory group theory and, thus, may serve as a fruitful starting point for future research into student learning of abstract algebra.

1. Introduction

Prior studies have shown that including introductory group theory into mathematics education may have a positive impact on learners’ conceptual understanding of mathematics in general, and of algebraic concepts in particular [1,2,3,4,5,6]. However, learners also encounter hurdles when studying group theory, and students’ difficulties regarding concepts of group theory—and of abstract algebra in more general—have been explored in various research projects [7,8,9,10,11]. In recent years, the research focus has increasingly shifted towards a description of the students’ conceptual development when learning about group theory [12]. Understanding students’ learning progression about abstract algebra concepts, such as introductory group theory, can help in developing guidelines for the evidence-based construction of new or refinement of existing learning environments in the future.
The description of students’ learning processes regarding introductory group theory inter alia necessarily requires:
  • To adequately define what conceptual understanding of group theory means;
  • To operationalize this construct via test items leading to a concept inventory that allows for the valid investigation of students’ conceptual understanding of introductory group theory.
Substantial progress has already been made regarding the first desideratum (cf. [13]). For the second one, however, only one concept inventory has been developed so far—the Group Theory Concept Assessment or, in short, GTCA (cf. [14]). Since group theory is rich of different contents and appears in different contexts throughout a variety of mathematics and science courses, various concept inventories are required to adequately measure each subaspect. The GTCA focuses mainly on mathematics students in university and thus includes somewhat advanced notions not all group theory learners are exposed to. For example, secondary school students or primary school teachers only enter this area on a superficial level and never learn about normal subgroups. This is where this research project comes in: The aim of this study is to develop and evaluate a new concept inventory on introductory group theory—the CI2GT.

2. Literature Review

In this section we present the status quo of research regarding learning of group theory and locate our concept inventory within this body of work.

2.1. Conceputal Understanding of Group Theory

Conceptual understanding of introductory group theory comprises conceptual understanding of mathematics on the one hand and introductory group theory on the other hand. Regarding conceptual understanding, we follow Melhuish and conceive that
“[…] conceptual understanding reflects knowledge of concepts and linking relationships that are directly connected to (or logically necessitated by) the definition of a concept or meaning of a statement.”
[15] (p. 2)
This description is closely related to the one provided by Andamon:
“Conceptual mathematics understanding is a knowledge that involves thorough understanding of underlying and foundation concepts behind the algorithms performed in mathematics.”
[16] (p. 1)
Both views focus on the fundamental nature of the mathematical objects in contrast to the process-related understanding when dealing with them. Thus, the task at hand is to capture said nature and use it to adapt the conceptual understanding construct to group theory. In this regard, the procedure documented in the development of the GTCA can be used as a reference (cf. [14]). First and foremost a somewhat unique feature of group theory is the abstract nature of its concepts [17]. The magnitude of abstraction is further underpinned by Edwards and Ward [18] who distinguish between stipulated and extracted definitions. An extracted definition is a definition that is extracted from common usage of the object and a stipulated definition is independent of such exemplifications. In the literature the notions of group theory are seen as stipulated definitions [10,18] and instances of how mixing up those notions is tied to learning difficulties have been found using the examples of cyclical groups (cf. [19]) and binary operations (cf. [20]). In other words, conceptual understanding of group theory can be tested already by just simple aspects of introductory notions and definitions. For instance, groups are comprised of a set, a binary operation and some axioms—so three different subaspects need to be coordinated by learners in a meaningful way and failure of such a coordination has been documented in the literature, i.e., regarding cyclical groups [21].
In conclusion, these research results not only show how conceptual understanding is understood from a group theory perspective but they also provide fruitful insights into how items of a corresponding concept inventory can be developed, namely, by challenging aspects of fundamental definitions. As mentioned in Section 1, only one concept inventory for group theory has been developed so far—the GTCA. For literature on similar concept inventories, we refer the reader to [22] regarding the PCA (Precalculus Concept Assessment) and to [23] regarding the CCI (Calculus Concept Inventory). As mentioned in Section 1, in terms of group theory, the GTCA is aimed at university mathematics with extensive prior subject knowledge. However, there are many study courses where group theory is barely exceeding mere definitions—and without a mathematical profile of these courses, the notions are not linked with proofs or extensive exercises. This means, inter alia, that introductory topics such as cosets and kernels which are part of the GTCA are not always studied when working with group theory. Simply leaving out the respective items is not an option since they served as additional knowledge sources and are linked to the other items. Thus, a concept inventory is needed to assess the conceptual understanding of group theory for complete beginners and learners without extensive mathematical background. We will therefore present such an instrument in this article. In this respect, it is noteworthy that the author of the GTCA provided empirical evidence according to which conceptual understanding of introductory group theory can psychometrically be considered a one-dimensional construct [15] (p. 18).

2.2. APOS Theory

A widely used framework for conceptual understanding of collegiate mathematics is presented by the APOS (Action, Process, Object, Schema) Theory, a constructivist theory developed by Dubinsky and McDonald [24] and based on Piaget.
“APOS Theory is principally a model for describing how mathematical concepts can be learned; it is a framework used to explain how individuals mentally construct their understandings of mathematical concepts. [⋯] Individuals make sense of mathematical concepts by building and using certain mental structures (or constructions) which are considered in APOS Theory to be stages in the learning of mathematical concepts.”
[25] (p. 17)
In this context, an Action is a transformation of a mathematical object that by the individual is perceived as essentially external, meaning that a step-by-step instruction is required. When such an action is repeated and reflected upon the learner can make an internal mental construction that no longer requires external stimuli. Such a mental construction is called Process, and such a process can be performed mentally without actually doing it. In other words, once internalized, the learners can manipulate mathematical objets in their minds. In a next step an Object is constructed from a process when the learner becomes aware of the process as a totality. In other words, the ideas are now internalized to a degree where they allow for a generalization which enables transfer of knowledge. Finally, a Schema for a mathematical object is a collection of all the related actions, processes, objects and other similar schemas. With this it becomes clear how to somewhat quantify conceptual understanding: One has to determine how many schemas need to be arranged in a meaningful way in order to make sense of the object.
For example, when understanding the concept of group operations, one needs to generalize the notion of binary operations. In a first step a student has to understand that a binary operation for a group is an associative map f : M × M M for some set M and in a next step has to look at the properties implied by the group structure, meaning that the set M is required to have a neutral element with respect to f and moreover an inverse for each element. Thus, developing an item for each of those steps by adding more and more schemas allows a concept inventory to asses the stage of conceptual understanding the respondent is located in according to APOS Theory. We further illustrate this by presenting three example items from our concept inventory (cf. Table 1).
Table 1 shows that progressively more schemas are required to make sense of the problem. Accordingly, three different stages of conceptual understanding of group operations are measured. We will come back to these items in Section 6.2.3 when evaluating the concept inventory. In conclusion, we note how APOS Theory enables to track students’ progression as they construct conceptual understanding of a certain knowledge domain.

3. Objectives of This Study

The research objectives of this paper are threefold:
1.
We aim at providing a new concept inventory to assess conceptual understanding of introductory group theory (for a proper definition of the target group cf. Section 4.1).
2.
We present an in-depth psychometric characterization of the concept inventory both from the viewpoint of classical test theory as well as item response theory.
3.
Lastly, an evidence-based argument for valid test score interpretation is to be established throughout the article.
For the last goal, our study is based on a validity concept by Messick [26]. We formulate an intended test score interpretation as well as assumptions this interpretation is based on (cf. [27,28]): As discussed in Section 2, we intend to interpret the test score as a measure of conceptual understanding of introductory group theory. The underlying assumptions this interpretation is based on are provided in Table 2 where we also assigned an analysis method to empirically verify each assumption. In summary, evidence-based justification of these assumptions allows for a valid test score interpretation.
The objectives of this study alongside Table 2 can be considered as a structurizing element of this paper. In a first step, we outline the details of the development process of our concept inventory CI2GT (cf. Section 4) and in the subsequent sections we present two consecutive studies dedicated to the empirical justification of the assumptions that our intended test score interpretation is based on.

4. Development of the CI2GT

In this section, we provide a detailed overview of the development process of our Concept Inventory for Introductory Group Theory CI2GT. Therefore, we follow the development process for new test instruments outlined in the literature (cf. [30]). Concept inventories offer a way to assess students’ conceptual knowledge with regard to a specific topic. A concept inventory is an “instrument designed to evaluate whether a person has an accurate and working knowledge of a concept or concepts” [31] (p. 1), mainly using single- or multiple-choice items, respectively. Concept inventories may be beneficial both for evaluating the effectiveness of a particular pedagogy and for assuring that students grasp the core concepts of a given domain (cf. [23]). Beyond this, concept inventories have been used for exploring student conceptions (cf. [32]) or to model areas of competence (cf. [23]).

4.1. Determining the Target Group and Test Objective

The primary target group are secondary school students. The secondary target group are university students in early stages of their academic studies of mathematics, e.g., pre-service mathematics teachers. The primary test objective is conceptual understanding of introductory aspects of group theory.

4.2. Description of Knowledge Domain

A detailed literature-based description of the knowledge domain of introductory aspects of group theory is not possible because there are no comparable concept inventories and the research of educational aspects of group theory is still in its infancy [1]. Consequently, it is not clear yet how to operationalize the construct conceptual understanding of introductory aspects of group theory in a theoretically based way. Thus, there is no standard procedure to approach such an area and we heavily leaned on two previous studies we conducted: Firstly, an extensive literature review revealed how the area of abstract algebra in general is sliced up in mathematics education research [1]. Secondly, first insights into learners’ cognitive processes when dealing with introductory aspects of group theory have been gained from a qualitative interview study [12]. The results of those two studies enabled a breakdown of the knowlege domain into six subareas:
1.
Definitional fundamentals: Binary operations on arbitrary sets and properties of those operations such as associativity or closure.
2.
The neutral element and inverses: Elements that emphasize certain properties of a binary operation, i.e., “reversing something”.
3.
Cyclical and Dihedral groups: Groups that are generated by one or two elements and have a strong geometric connotation, i.e., rotating a regular n-gon.
4.
Cayley Tables: Tables that contain every possible result of the binary operation and thus the entire information about the group.
5.
Subgroups: Subsets of the underlying set that are groups themselves if equipped with the same operation.
6.
Homomorphisms: Structure-preserving maps between groups that eventually allow to differentiate groups from a mathematical point of view.
To ensure content validity in an early stage of research, a blueprint according to Flateby [33] was developed as a guideline, since it “provides the necessary structure to foster validity” [33] (p. 8). A blueprint is a table containing the subareas of the knowledge domain as well as the competence levels they address—in this case copying, applying and transfer of strategies. Because such a table further specifies the developed items and their relations to the knowledge domain, a blueprint is sometimes also referred to as a table of item specifications.

4.3. Decision of Task Format

The decision of task format was based on economic reasons. For assessing conceptual understanding empirically, concept inventories mainly rely on single-choice or multiple-choice items (cf. [34]). For this test we decided to use a dichotomous single-choice variant with one point assigned to each item. However, this enables the participants to simply guess correctly if they do not know the answer which consequently leads to overestimating the participants understanding. For example, with a test consisting of 20 dichotomous single-choice items with three answers each completely guessing yields an expected score of 20 3 . Thus, the items were designed in a two-tier way. In the first tier, the participants selected exactly one of three options. In the second tier, the participants additionally rated their confidence with the answer given before on a five-point Rating scale (1 = I guessed, …, 5 = very sure). A point was assigned if the correct answer was chosen and the participant did not guess, meaning that 3 or higher had to be marked in the second tier. This design allows to minimize the effect of guessing on the one hand and on the other hand enables identifying student difficulties by investigating which incorrect answers were given confidently [35]. All items can be found in Appendix A.

4.4. Creating Appropriate Distractors

Because the concept inventory consists of single-choice items, the quality of the concept inventory is significantly determined by the quality of the distractors (cf. [36]). For the development of authentic distractors we relied on:
  • An extensive literature review on mathematics education research regarding teaching and learning of abstract algebra. (cf. [1])
  • An interview study which we conducted to collect students conceptions prior to test development (cf. [12]). For example, we found that the meaning of the symbol 0 usually becomes inflated in the context of neutral elements (cf. item 5) or that closure is a property often left unchecked (cf. item 3).
We will discuss the suitability of the developed distractors in more detail in Section 6.1 and Section 6.2.

5. Methods and Samples

As mentioned in Section 3, two studies have been conducted to provide an empirical basis for the research objectives:
1.
An expert survey with N = 9 experts from mathematics education research.
2.
A quantitative evaluation with N = 143 pre-service primary school teachers
The study design of both studies will be explained respectively in Section 5.1 and Section 5.2. An overview of the entire development process is illustrated in Figure 1.

5.1. Expert Survey: Study Design and Data Analysis

An expert survey was conducted in order to (a) check content validity, (b) collect expert’s opinions about the overall representativeness of the developed items, as well as (c) collect their judgements regarding all distractors.

5.1.1. Study Design

For each of the 20 items, N = 9 experts from mathematics education and pure mathematics were asked to answer four questions on a 5-point Rating scale ( 1 = strongly disagree, …, 5 = agree completely). The questions on the expert questionnaire remained the same for every item of the concept inventory (cf. Table 3) and the scale was adapted from [30]. In addition, an opportunity for free-response feedback was included.

5.1.2. Data Analysis

The expert ratings will be presented using Diverging Stacked Bar Charts (cf. [37]). For these charts, the bars from a stacked bar chart are aligned relative to the scale’s centre (0%). Agreement from the participants results in a shift to the right, and disagreement results in a shift to the left. In other words, the more area is covered in the right half of the chart, the more experts are agreeing with the statements from the questionnaire. To further increase the visual stimuli, we color coded the bars where green means agreement and red means disagreement (cf. Figures 3–6). In addition, to check whether the experts in general agree (voting 4 or 5) or not agree (voting 3 or lower) with the statements, we further divided the data into two categories and computed inter-rater reliability expressed by Fleiss’ κ . We interpreted Fleiss’ κ according to [38], meaning that values between 0.6 and 0.8 indicate substantial agreement and values above 0.8 indicate almost perfect agreement.

5.2. Quantitative Evaluation: Study Design and Data Analysis

5.2.1. Study Design

After developing the 20 items’ corresponding distractors, the preliminary test version was completed by N = 143 pre-service primary school teachers in their first semester of academic studies. None of the participants had any prior instruction in abstract algebra beyond school mathematics. Our concept inventory was administrated as a post-test after a two-week program where the students had been introduced to group theory.

5.2.2. Data Analysis: Classical Test Theory

In a next step, the psychometric descriptives in the sense of classical test theory are evaluated according to [39]. Here, we refer to the accepted tolerance range of 0.2 to 0.8 for item difficulty (cf. [40]) and values above 0.2 for discriminatory power (cf. [34]). For response distribution we refer to the accepted minimum value of 5 % (cf. [30]). Furthermore, the reliability of the concept inventory was investigated using Guttmann’s Split-Half-Coefficient as well as Cronbach’s alpha as an estimator for internal consistency. For both coefficients, values above 0.7 are considered acceptable (cf. [41]). Regarding criterion validity, the students’ test score was correlated with the final exam score of an introductory mathematics course on linear algebra.

5.2.3. Data Analysis: Rasch Scaling

As a final analysis method, we leveraged Dichotomous Rasch Scaling to investigate the instruments’ construct validity. In this section we will briefly expound the general idea of this method and discuss the parameters we used to further classify our concept inventory.
The advantages of probabilistic test theory compared to classical test theory are well documented (cf. [42,43]). An important aspect of the Rasch model is that
“it is not just another statistical technique to apply to data, but it is a perspective as to what is measurement, why measurement matters and how to achieve better quality measurement in an educational setting.”
[44] (p. 1)
In contrast to classical test theory (CTT), the underlying assumption of Item Response Theory (IRT) is that each participant has an ability level that can be estimated and that this ability level determines the probability of this participant solving a given item. IRT then models the relationship between the ability level and individual item characteristics. The goal is to divorce these two concepts and thus allow to study the instruments’ items more independently of the sample which is a crucial aspect for test development [43].
The pre-conditions of Rasch Scaling (cf. [45]) were investigated by verifying that
  • Skewness and kurtosis of the items do not exceed the range of 2 to + 2 ;
  • The items are locally independent;
  • Uni-dimensionality of the concept inventory can be assumed.
We used a dichotomous Rasch Model for which certain characteristics are studied. In a first step, the participants’ ability levels and the item difficulties are estimated. Then for each item a logit-function is fitted to the data—this yields an Item Characteristic Curve (ICC, cf. [46]) that contains the entire information of the item (cf. Figure 2). The x-axis measures the underlying ability level in Logits. The y-axis indicates the probability of solving an item and is scaled from 0 to 1.
The higher the estimated ability of the participant the higher the probability of solving the item. With a trait level of 1.13 Logits, for example, the probability of solving item 7 is 50%, indicated by the green line in Figure 2. Obviously, if less ability is required to obtain such a chance, the item is less difficult. Thus, the trait level that is necessary for a probability of 0.5 serves as a parameter to represent the items’ difficulty. In other words, the item difficulty of item 7 is 1.13 Logits.
The clarification as to how well the Rasch Scaling of an item fits is ascribed to the residuals of the ICC. An example is given in Figure 2. For item 7 of our concept inventory, we see that a person with a ability level of 0 Logits has a slightly lower probability to solve this item than estimated by the modeling curve, indicated by score residual y. This abberation is then used to calculate the goodness-of-fit parameters Outfit MNSQ and Infit MNSQ. For a proper statistical definition of these values, we refer the reader to [47]. Since the expected value of Outfit MNSQ is 1, any obtained value above this indicates unmodeled noise. Items with a high Outfit MNSQ represent underfit of the model to the data and therefore do not contribute much to estimating the latent trait. Any value below this indicates overfit and thus items with a low Outfit MNSQ are generally seen as unproblematic. However, they are likely to be redundant and can be dropped from the concept inventory [48]. The same holds for the Infit MNSQ. All parameters were computed using the software R (Version 4.1.2) and its packages TAM (Version 3.7-16) and eRm (Version 1.0-2). In the following we will abbreviate Infit MNSQ of item i with v i and Outfit MNSQ with u i , respectively.

6. Results

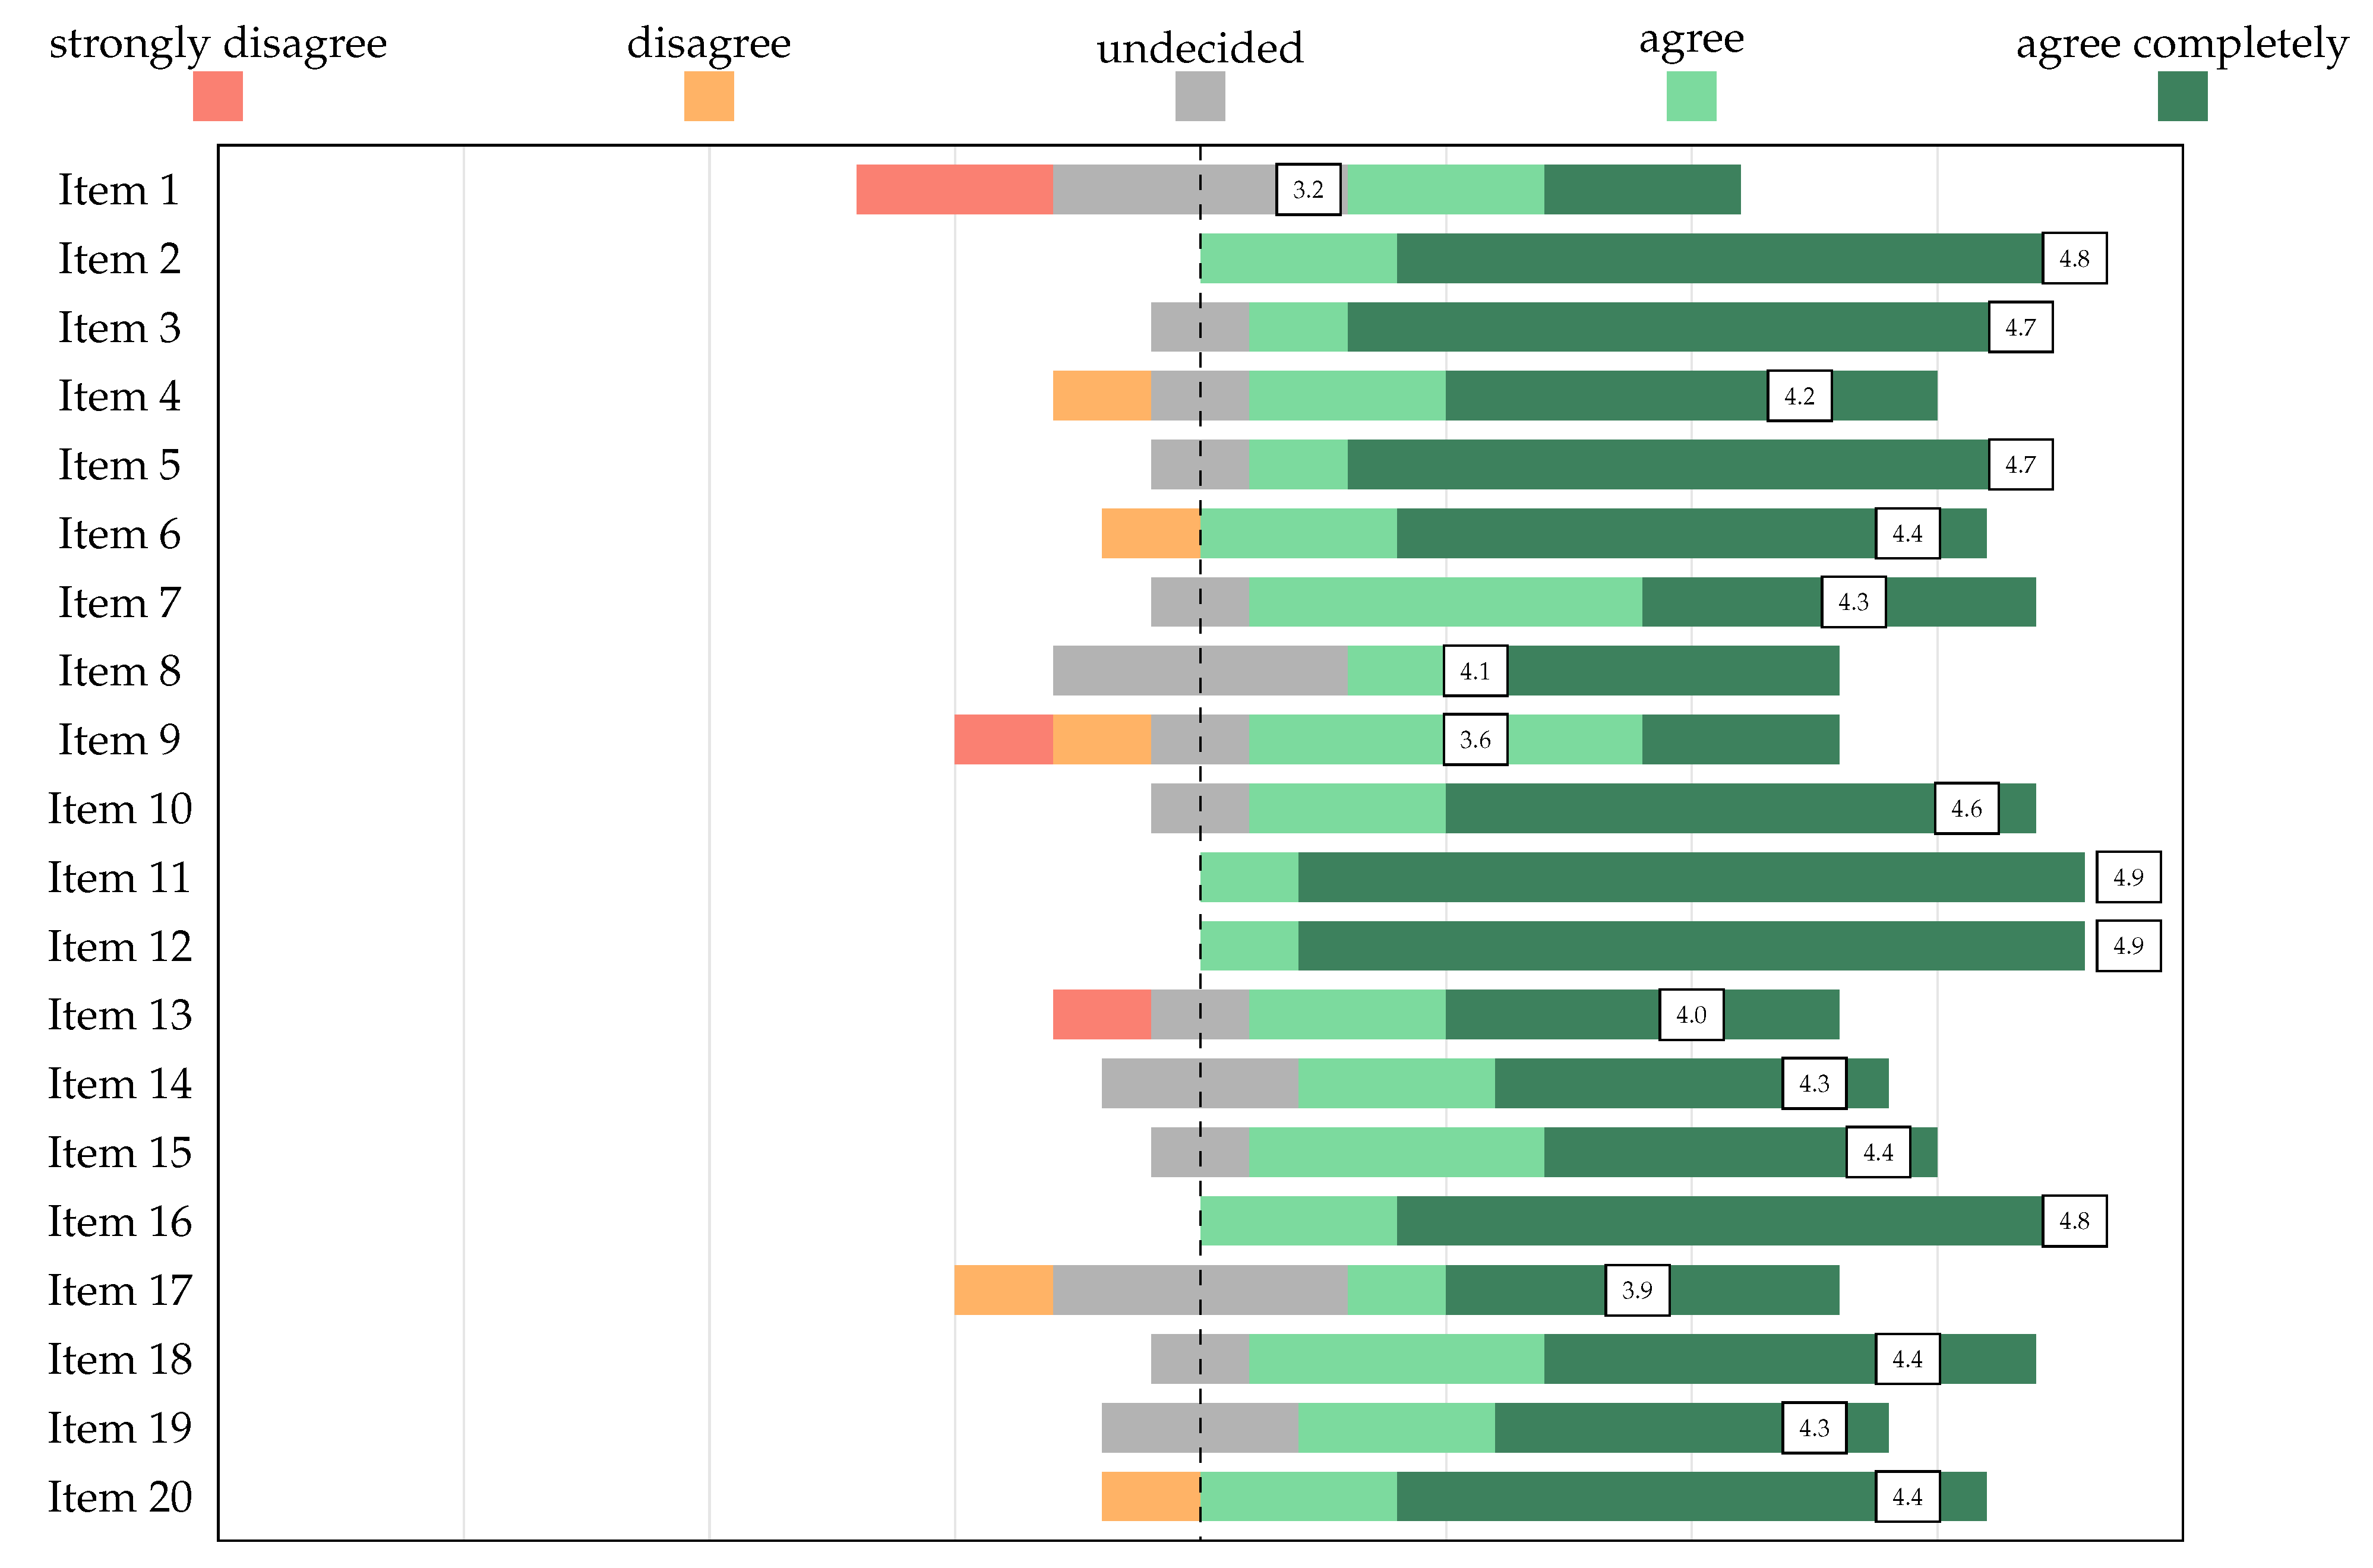
6.1. Results of the Expert Survey

The results of the expert survey are presented in Table 4, Table 5, Table 6 and Table 7. As mentioned in Section 5.1, the color coded feedback can quickly be checked with the Diverging Stacked Bar Charts (cf. Figure 3, Figure 4, Figure 5 and Figure 6).
Figure 3 shows the experts’ strong agreement regarding the items’ relevancy for learning about group theory. This result is important to assure content validity of the concept inventory. However, not only is it necessary for the items to assess relevant aspects about group theory in general, but they also need to adequately represent the knowledge domain of the teaching concept the test is based on. Thus, the experts also judged the fitting of the items to the knowledge domain, and the results are shown in Figure 4.
We see that the items assess crucial aspects of the knowledge domain according to experts, with items 7 and 19 having the lowest rating. However, both are still acceptable with a mean value of 3.0 , so we decided to keep them for didactic reasons: Item 7 serves as a link between group theory and school mathematics and thus allows to investigate potential connections. Item 19 is an inverse problem which in [12] was found to challenge learners in a different way. Together with the experts’ rating of the items’ relevance, the results substantiate the instruments’ content validity.
Figure 5 shows that the developed distractors for each item left a positive impression on the experts. Only item 1 stands out as two experts strongly disagreed with the authenticity of distractor 2. They remarked that associativity to some extend might also be described as a rule stating that, when composing three or more elements, the order does not matter—in other words, when looking at a b c the two expressions a ( b c ) and ( a b ) c might be viewed as two different orders of composition. However, for content reasons, the item was retained.
Finally, we evaluate the clarity of task assignment (cf. Figure 6). Here, the experts unanimously agree that there is no ambiguitiy within the formulations for each item. Only the two critical voices regarding distractor 2 of item 1 carried over.

Interim Conclusion on Expert Survey results

In summary, with the results of the expert survey we conclude that the items (a) comprise relevant aspects of group theory for learners, (b) adequately represent the knowledge domain, (c) have authentic distractors and (d) have clear task assignments. These results help to verify validity assumptions A1, A2 and A3 (cf. Table 2).

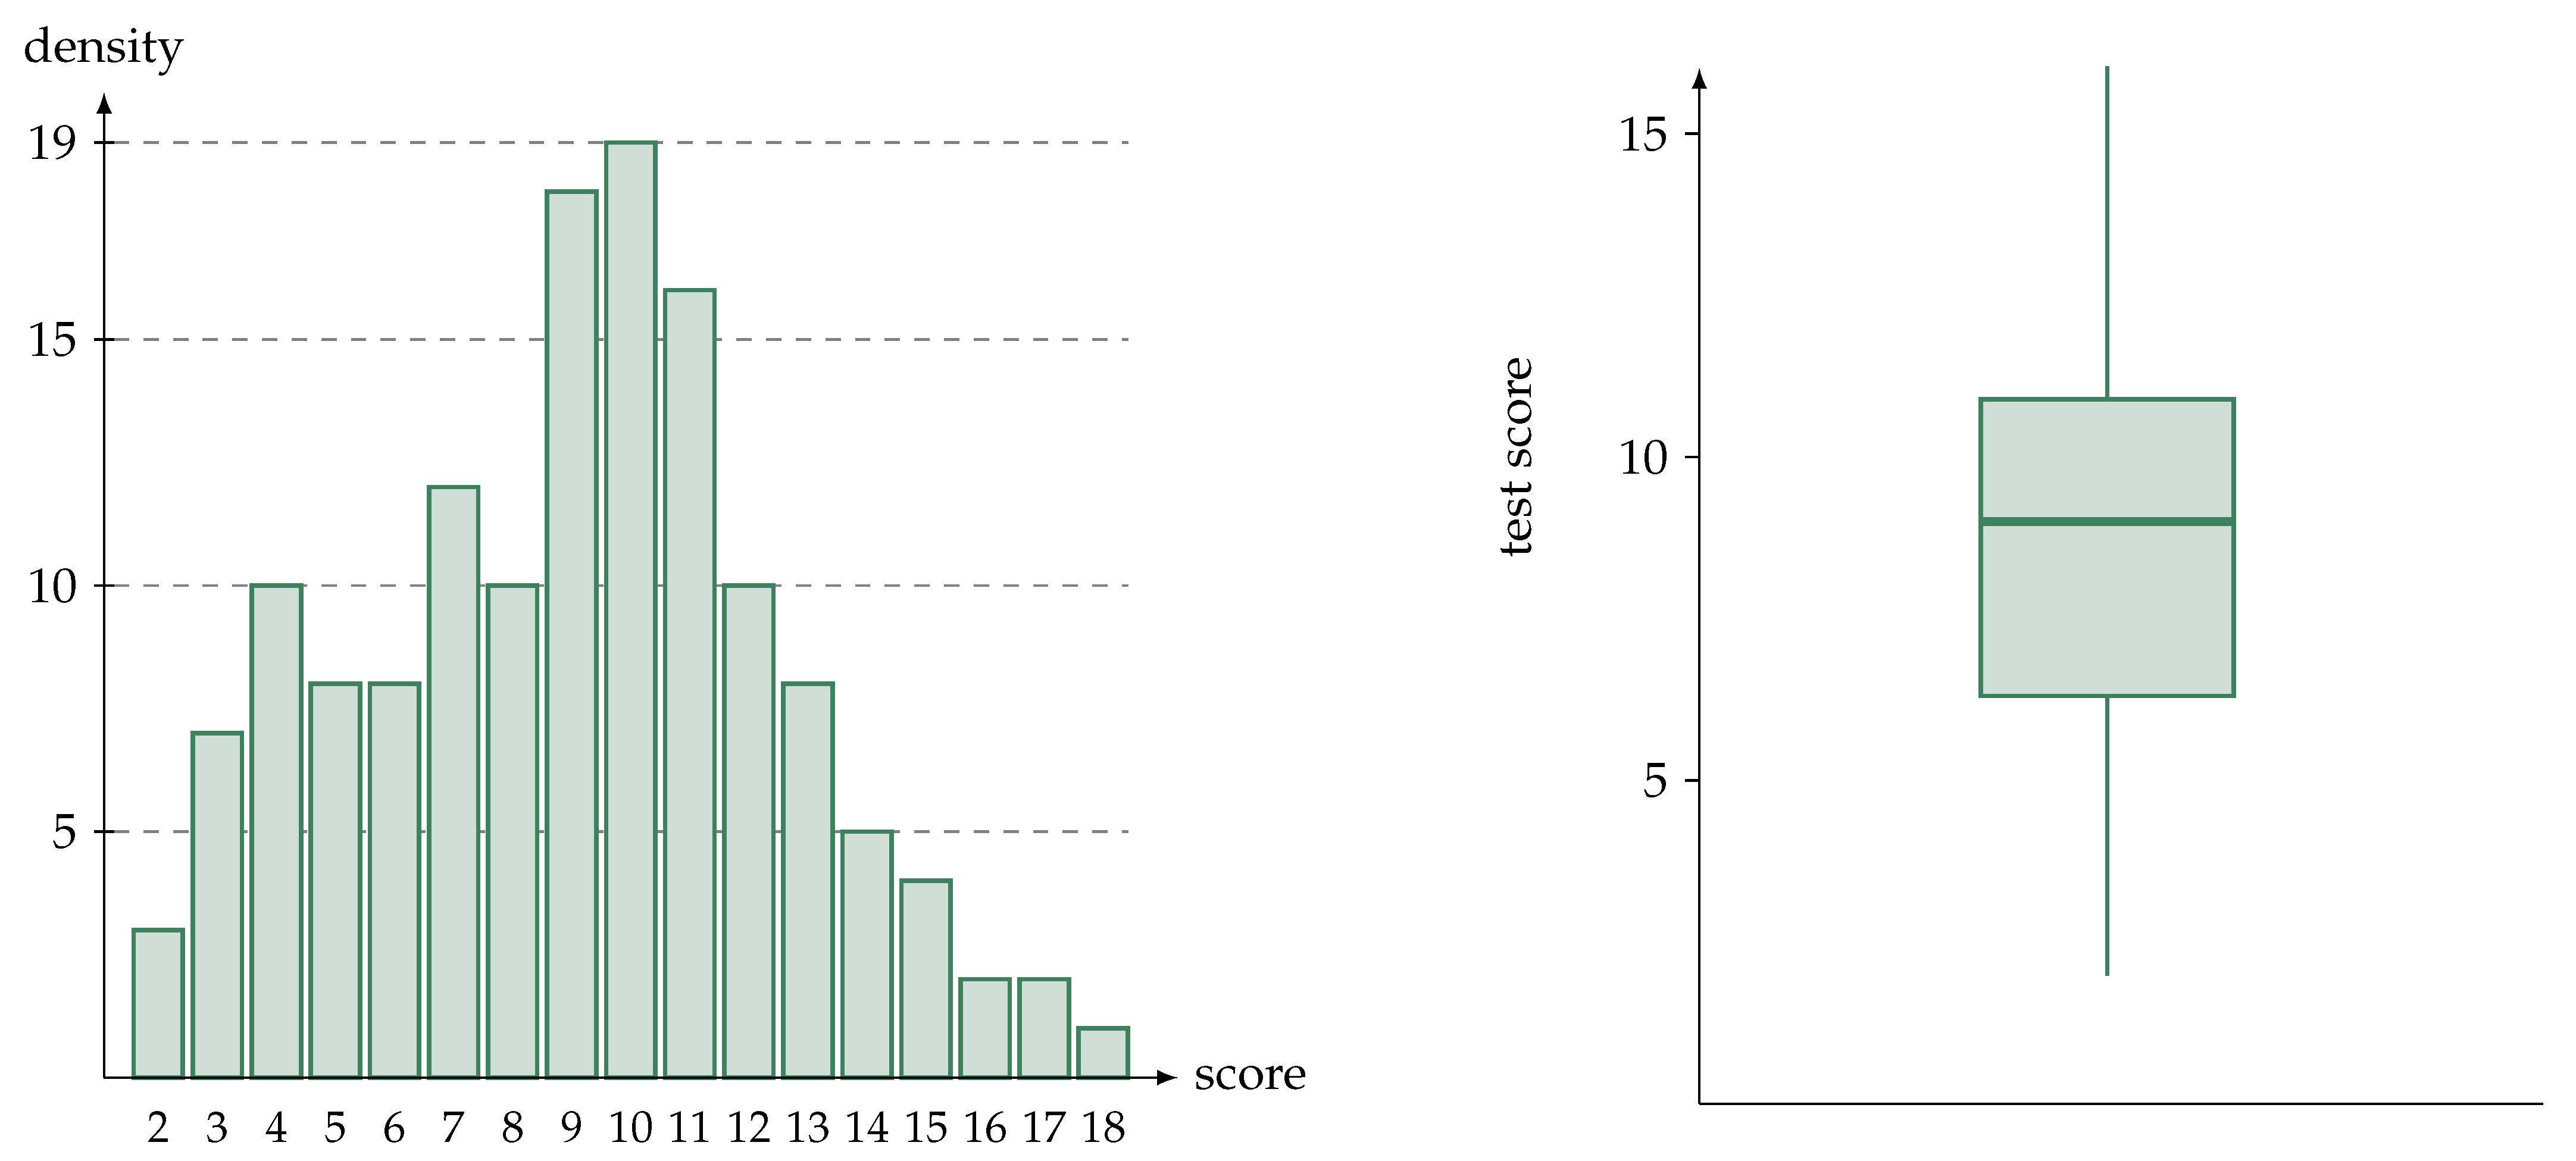
6.2. Results of the Quantitative Evaluation of the CI2GT

6.2.1. Psychometric Characterization Using Classical Test Theory

In this section we examine the results of the quantitative study from the viewpoint of classical test theory. The metrics reported in Table 9 refer to the 20 items developed for the preliminary test version.
With 20 dichotomous items, participants could score a maximum of 20 points. The students reached a mean score of μ = 8.99 points with a standard deviation of σ = 3.54 points, ranging from 2 points (three participants) to 18 points (1 participant) and are shown in Figure 7. Criterion validity was checked correlating the subjects’ test score to the result of the final exam of a mathematics introductory course ( r = 0.27 , p < 0.01 ), substantiating the validity assumption A4 (cf. Table 2).
The response distribution is presented in Table 8. The options have been swapped for this article so that answer 1 is always the correct answer and the order matches the one in the Appendix A. For the concept inventory itself, the implementation in Moodle randomized the order automatically. We see that only answer 3 of item 2 was selected by less than 5% of the participants, so generally no redesign of distractors is mandatory apart from that. However, items 8, 10 and 14 may be revisited at a later stage of the iterative re-design process. In total, we can observe that the distractors presented plausible answers that seemed correct but do not apply.
The item difficulties as well as their discriminatory power and the adjusted Cronbach’s α n ¯ are shown in Table 9. Here, by the adjusted Cronbach’s α n ¯ we mean the Cronbach’s α of the scale when item n is excluded.

6.2.2. Interim Conclusion on the Psychometric Characterization

Table 9 reveals that items 4, 6 and 13 have non-sufficient psychometric qualities. The poor item difficulty and discriminatory power of item 13 in conjunction with the fact that Cronbach’s alpha can be raised if this item is dropped made further investigation unnecessary—the item was excluded at this point. For items 4 and 6 we argue that the psychometric qualities are not as poor compared to item 13 and having more items is overall desirable in terms of content validity as long as Cronbach’s alpha does not decrease. After all, Table 8 shows that a seemingly problematic aspect is their difficulty and adjusting the distractors might save them. However, for reasons we will elaborate in Section 6.2.3 items of this difficulty are desired within the instrument and thus items 4 and 6 are retained. In addition, Items 1 and 2 also have non-sufficient discriminatory power. However, since they have good difficulties and Cronbach’s α is retained, we decided to keep them for content reasons. In conclusion, the quantitative evaluation suggests that item 13 is dropped and items 4 and 6 need to further be investigated.

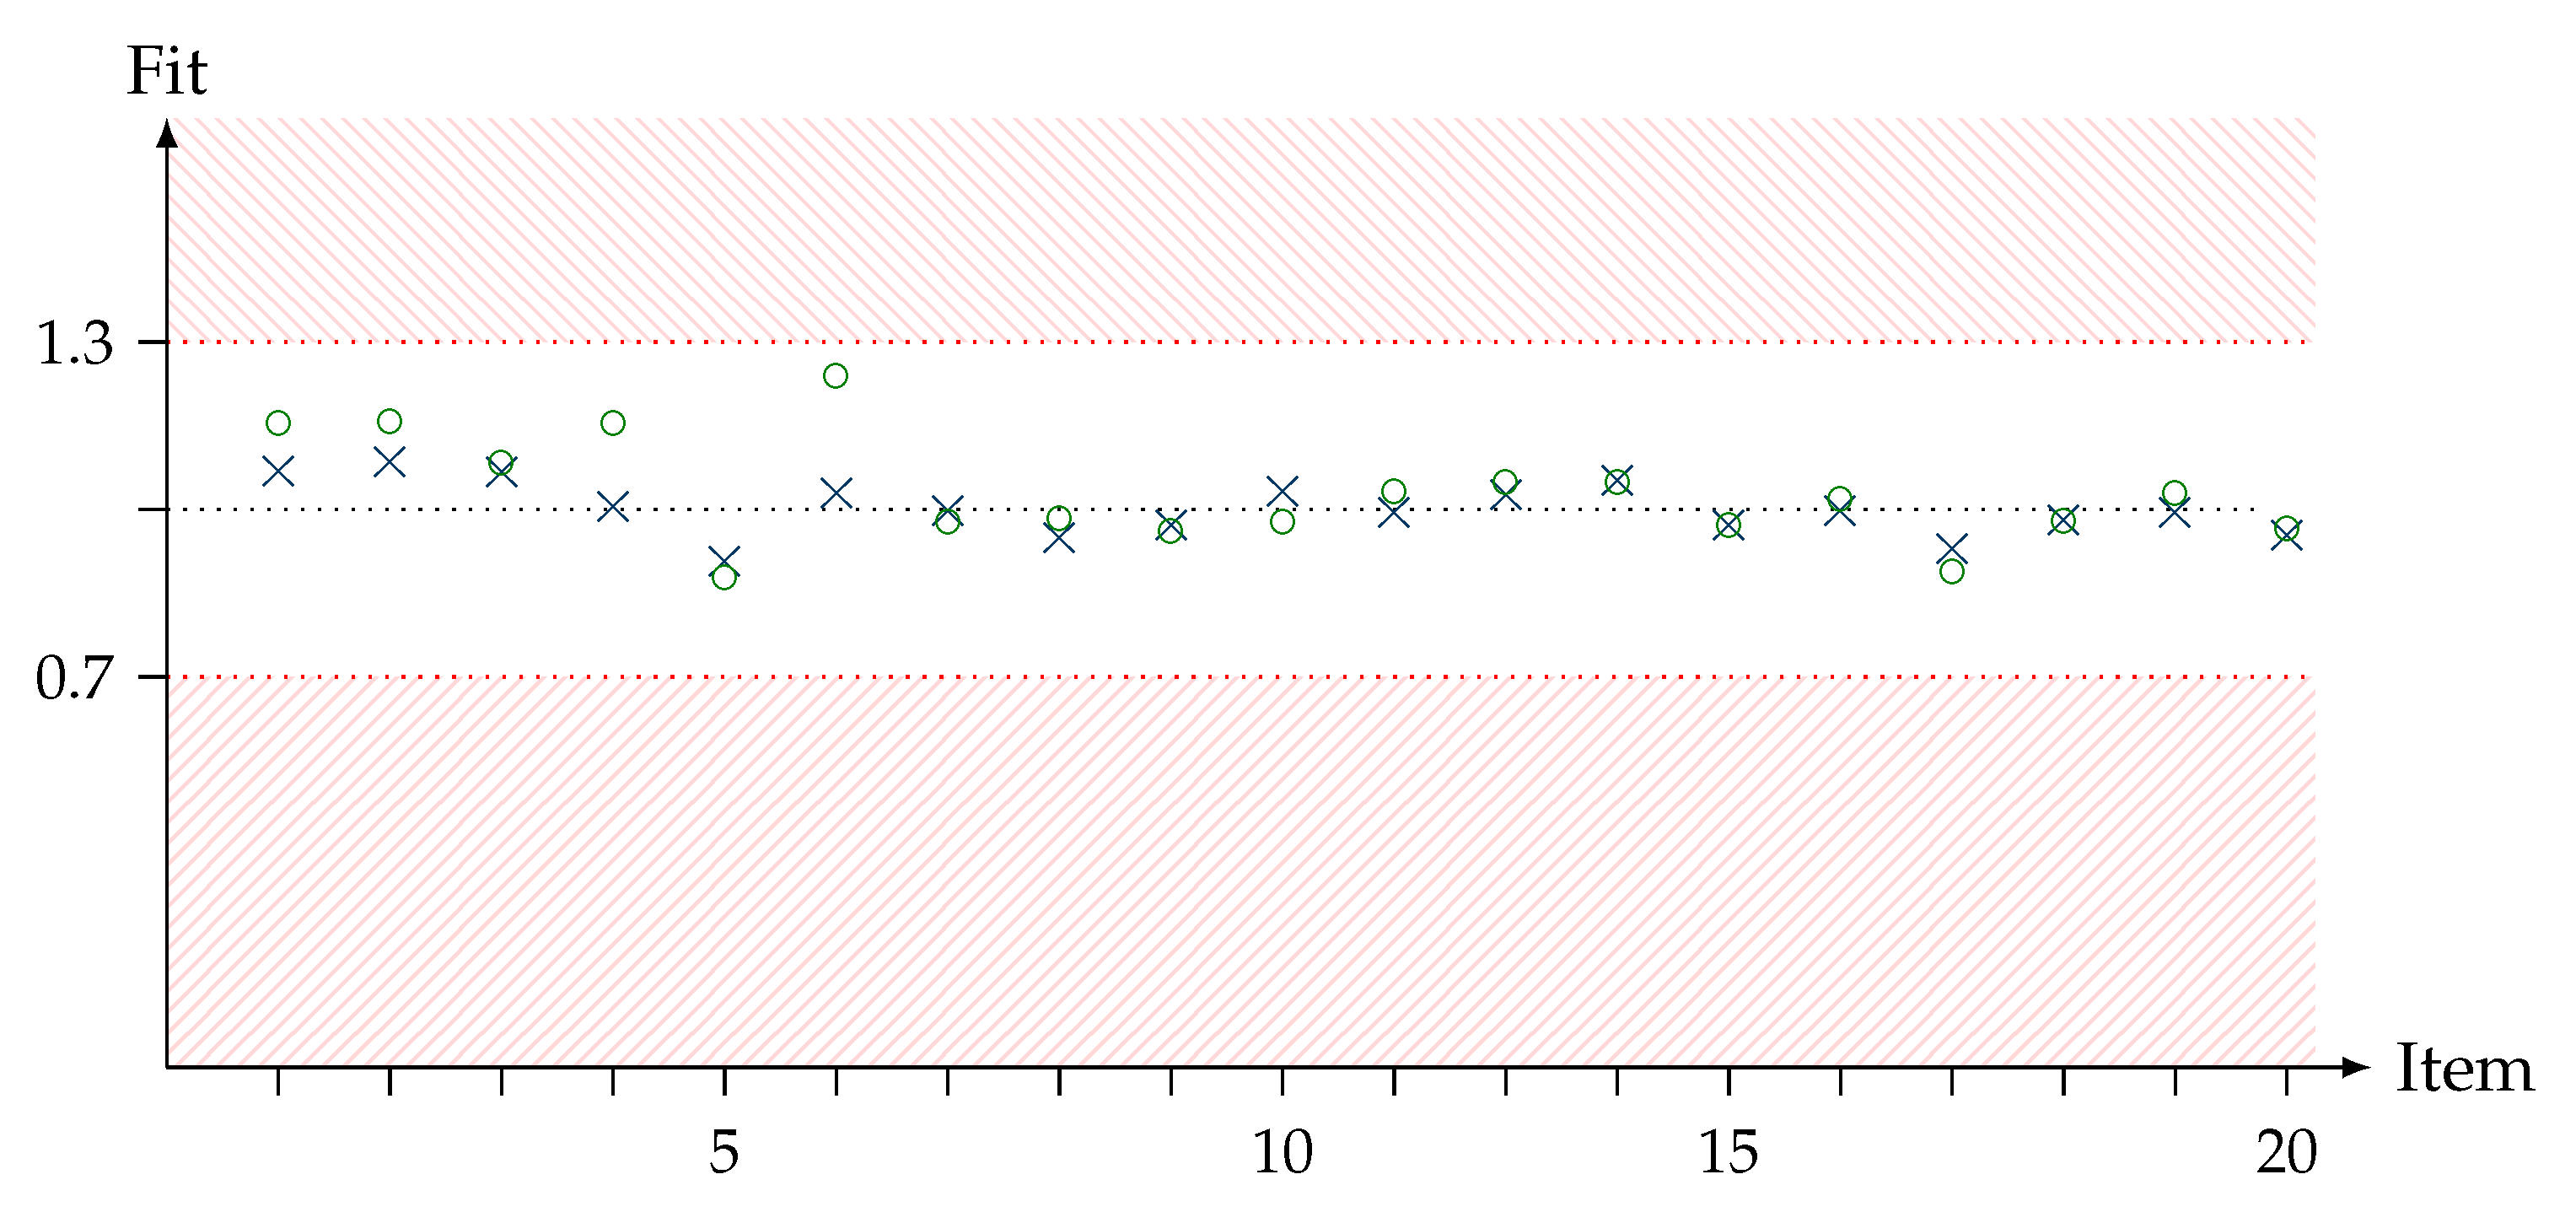
6.2.3. Results of the Rasch Scaling

A dichotomous Rasch Model was justified by the data: The local independence was verified by checking the Q 3 correlation matrix for values higher than 0.2 (cf. [49,50]). Furthermore, we used the R-package sirt (version 3.9-4) to confirm essential unidimensionalty of the concept inventory finding weighted indices DETECT = 0.141 (< 0.20 ), ASSI = 0.095 (< 0.25 ) and RATIO= 0.130 (< 0.36 ) [51]. Here, on a side note we want to allude to the earlier mentioned fact that the GTCA was found to be unidimensional as well (cf. Section 2). Lastly, the items’ kurtosis and skewness were checked where we refer to the criterion 2 < Kurtosis , Skewness < 2 from [52]. To ensure this, items 4 and 6 should to be dropped (cf. Table 10). In conclusion all assumptions of the Rasch Scaling can be affirmed according to [53]. The WLE reliability was found to be 0.67 which exceeds the lower threshold of 0.5 [44]. Table 10 presents an overview of all parameters discussed in Section 5.2.3.
We observe that the item fit statistics are very close to the expected value of 1. For accepted ranges of the infit and outfit statistics we refer to 0.7 < v i , u i < 1.3 by [44]. We see that this range holds for each item, indicating the items’ strong fit to the model. We observe ranges
0.916 = v 5 v i v 2 = 1.072 and 0.875 = u 5 u i u 6 = 1.236 .
The compact fit scattering is visualized in Figure 8.
To further examine the suitability of the items the relationship between the two estimated Rasch parameters (item difficulty and ability level) were investigated. The Item Characteristic Curves of all items on a common scale is shown in Figure 9.
The item difficulty ranges from 1.16 to 2.17 Logits with a mean value of 0.20 (cf. Table 10. A mean difficulty close to 0 reflects that the instrument in total is well balanced and the items are neither too difficult nor too easy. However, the ability variable within the sample ranged from 1.95 to 2.63 Logits, meaning that some participants are located at the lower level of the ability scale (< 1.16 ) which exceeded the item difficulty scale. Thus, in this area the concept inventory did not contain items to optimally record and differentiate between participants with different levels of competence. A deeper look into this descrepancy is enabled using a Wright-Map (cf. Figure 10). The Wright-Map shows that the outer areas of the trait scale are not populated densely and in the dense area the item difficulties correspond adequately. Merely for trait levels of roughly 1.5 and + 1.5 Logits an item may be developed accordingly since participants with that ability level are expected in most samples and a small jump in difficulty can be observed between item 1 and item 4.

6.2.4. Interim Conclusion on the Rasch Scaling

Finally, we want to come back to Table 1 to show how the logit scale may be interpreted. The anchored example items showed a progression in the sense of APOS Theory and their difficulties react accordingly; item 2 has a difficulty of 1.16 , item 5 has a difficulty of 0.41 and item 6 has a difficulty of 2.17 (cf. Table 11, Table 12 and Table 13).
More precisely, adding the schema of neutral elements responded in a difficulty shift of 1.5 Logits and adding the schema of inverses added another 1.8 Logits on top of it. We want to refrain from generalizing those findings but the results of the Rasch Scaling indicate that going up on the ability scale by 1.5 units roughly equivalates to the student constructing another schema for group operations. This means that students on the lower end of the ability level spectrum are still stuck in the first phase of constructing conceptual understanding of this mathematical notion while students near trait level 0 already successfully established more than one schema and students on the upper end have reached a high conceptual understanding enriched by a variety of schemas. This substantiates how APOS Theory may serve as a tool to calibrate the scale of this concept inventory.
Overall, we infer that the dichotomous Rasch Model fits the data very well and the items very precisely measure various levels of a latent ability which was interpreted as conceptual understanding of introductory aspects of group theory (cf. Section 2 and Section 4.1). This concludes the investigation of construct validity and thus the verification of validity assumption A1 (cf. Table 2).

7. Discussion

The measurement of conceptual understanding via concept inventories has a long tradition in mathematics education research. However,
“it is not sufficient for developers to create tools to measure conceptual understanding; educators must also evaluate the extend to which these tools are valid and reliable indicators of student understanding.”
[34] (p. 455)
Thus, in the development of the CI2GT a quantitative pilot study with N = 143 students as well as an expert survey and an acceptance survey (cf. [12]) have been conducted in addition to an extensive literature research (cf. [1]). These studies combined allow to substantiate reliability and validity claims. Moreover, within the course of these studies, three items have been revealed to be of problematic psychometric quality—namely, items 4, 6 and 13. However, we argue that developing a concept inventory is not just about crunching numbers. One also has to take into account how severely standardized ranges are violated by certain items and whether they represent a relevant aspect of the construct that is to be measured. In the case of items 4 and 6, we see that difficulty and discriminatory power differ by just 0.06 0.08 from usually accepted ranges and they do not negatively interfere with Cronbach’s α . In other words, the question arises whether it is worth to have two outliers in the scale and in return receive an overall larger scale and more items to work with. We answer this question by referring to the Rasch scaling. Figure 10 has shown a substantial benefit of having items with difficulty greater than 2 in the concept inventory and both items 4 and 6 precisely measure at the upper end of the ability scale. In addition, as discussed in Section 2.2 and Section 6.2.3, item 6 can be used to calibrate the scale. Thus, it can be summarized that items 4 and 6 serve a didactical purpose and in this aspect enrich the concept inventory more than the small deviation from accepted ranges might hurt it. This is underpinned by a judgment scheme for concept inventories developed by Jorion et al. [34] where such outlier items are taken into account when judging the quality of a concept inventory (cf. Table 14).
Regarding item 13, however, the psychometric properties have shown to be too poor. We therefore decided to drop it entirely, leaving us with a new concept inventory for introductory group theory—the CI2GT—consisting of 19 items with an internal consistency of α = 0.71 and a Guttman’s Split-Half Coefficient of 0.71 (cf. [54]). As mentioned above, for a final judgement of the instrument as a whole, Jorion et al. [34] provide a categorial judgement scheme and assignment rules. We adapted their table by replacing the judgement of a confirmatory factor analysis by a judgement of Rasch Scaling in accordance to [44,53] (cf. Table 14), extending the already existing judgement row for IRT. We conclude with the observation that the quality of the CI2GT ranges from average to excellent.

8. Conclusions

In this article we reported on the development of the CI2GT. This development process was based on contemporary views of conceptual understanding of introductory group theory from literature. This allowed to implement an intended test score interpretation of the CI2GT as a measure of this latent construct. We further provided insights into all steps of a comprehensive evaluation of the concept inventory using a variety of surveys and methods, ranging from qualitative studies with individual learners and experts to a quantitative study and modeling via Rasch scaling. Viewpoints of classical test theory were merged with viewpoints of probabilistic test theory.
However, one should also keep in mind the limitations of this concept inventory. As mentioned in Section 1, group theory as a mathematical model of symmetry is a large field with numerous different applications both in mathematics and non-mathematics science. Consequently, many researchers and educators find different aspects of it important or emphasize different notions. A literature review and an expert survey can only do this many-sidedness justice to a certain extend. We therefore want to stress the link between the CI2GT and the subaspects represented by its items. On the other hand, the instrument is to be refined by future studies to steadily increase the accuracy at which conceptual understanding of group theory is measured. This illustrates how developing a concept inventory is an on-going iterative process of evaluation and refinement (cf. Figure 1).
Most importantly, however, the instrument shall be used to empirically investigate the learning and conceptual understanding of group theory, enriching this emerging research field which is still largely unexplored. For example, it may serve as a tool to inquire quality of instructions by measuring differences in conceptual understanding for treatment and comparison classes in parallel settings. In the future, we will use this concept inventory to complement already existing insights into learning of group theory from qualitative studies with insights from quantitative studies. In other words, the CI2GT offers a multitude of opportunities to facilitate future research into educational aspects of group theory.

Author Contributions

Conceptualization, All authors; writing—original draft preparation, J.M.V.; writing—review and editing, J.M.V. and P.B.; investigation, J.M.V.; supervision, B.G. All authors have read and agreed to the published version of the manuscript.

Funding

This research was funded by the Department of Mathematics and applied Informatics, University of Hildesheim.

Institutional Review Board Statement

Ethical review and approval were waived for this study due to the fact that the study was in accordance with the Local Legislation and Institutional Requirements: Research Funding Principles https://www.dfg.de/en/research_funding/principles_dfg_funding/research_data/index.html and General Data Protection Regulation https://www.datenschutz-grundverordnung.eu/wp-content/uploads/2016/04/CONSIL_ST_5419_2016_INIT_EN_TXT.pdf (accessed on 15 April 2022).

Informed Consent Statement

Informed consent was obtained from all subjects involved in the study to publish this paper.

Data Availability Statement

The data presented in this study are available on request from the corresponding author.

Conflicts of Interest

The authors declare no conflict of interest.

Appendix A

Education 12 00376 i001Education 12 00376 i002

References

  1. Veith, J.M.; Bitzenbauer, P. What Group Theory Can Do for You: From Magmas to Abstract Thinking in School Mathematics. Mathematics 2022, 10, 703. [Google Scholar] [CrossRef]
  2. Wasserman, N.H. Introducing Algebraic Structures through Solving Equations: Vertical Content Knowledge for K-12 Mathematics Teachers. PRIMUS 2014, 24, 191–214. [Google Scholar] [CrossRef]
  3. Even, R. The relevance of advanced mathematics studies to expertise in secondary school mathematics teaching: Practitioners’ views. ZDM Math. Educ. 2011, 43, 941–950. [Google Scholar] [CrossRef]
  4. Shamash, J.; Barabash, M.; Even, R. From Equations to Structures: Modes of Relevance of Abstract Algebra to School Mathematics as Viewed by Teacher Educators and Teachers. In Connecting Abstract Algebra to Secondary Mathematics, for Secondary Mathematics Teachers; Springer: Switzerland, Basel, 2018; pp. 241–262. [Google Scholar] [CrossRef]
  5. Burn, R. What Are the Fundamental Concepts of Group Theory? Educ. Stud. Math. 1996, 31, 371–377. [Google Scholar] [CrossRef]
  6. Baldinger, E.E. Learning Mathematical Practices to Connect Abstract Algebra to High School Algebra. In Connecting Abstract Algebra to Secondary Mathematics, for Secondary Mathematics Teachers; Springer: Switzerland, Basel, 2018; pp. 211–239. [Google Scholar] [CrossRef]
  7. Shimizu, J.K. The Nature of Secondary Mathematics Teachers’ Efforts to Make Ideas of School Algebra Accessible. Ph.D. Thesis, The Pennsylvania State University, State College, PA, USA, 2013. [Google Scholar]
  8. Zbiek, R.M.; Heid, M.K. Making Connections from the Secondary Classroom to the Abstract Algebra Course: A Mathematical Activity Approach. In Connecting Abstract Algebra to Secondary Mathematics, for Secondary Mathematics Teachers; Springer: Switzerland, Basel, 2018; pp. 189–209. [Google Scholar] [CrossRef]
  9. Leron, U.; Dubinsky, E. An abstract algebra story. Am. Math. Mon. 1995, 102, 227–242. [Google Scholar] [CrossRef]
  10. Melhuish, K.; Fagan, J. Connecting the Group Theory Concept Assessment to Core Concepts at the Secondary Level. In Connecting Abstract Algebra to Secondary Mathematics, for Secondary Mathematics Teachers; Springer: Switzerland, Basel, 2018; pp. 19–45. [Google Scholar] [CrossRef]
  11. Veith, J.M.; Bitzenbauer, P. Two Challenging Concepts in Mathematics Education: Subject-Specific Thoughts on the Complex Unit and Angles. Eur. J. Sci. Math. Educ. 2021, 9, 244–251. [Google Scholar] [CrossRef]
  12. Veith, J.M.; Bitzenbauer, P.; Girnat, B. Towards Describing Student Learning of Abstract Algebra: Insights into Learners’ Cognitive Processes from an Acceptance Survey. Mathematics 2022, 10, 1138. [Google Scholar] [CrossRef]
  13. Baroody, A.J.; Feil, Y.; Johnson, A.R. An alternative reconceptualization of procedural and conceptual knowledge. J. Res. Math. Educ. 2007, 38, 115–131. [Google Scholar] [CrossRef]
  14. Melhuish, K. The Design and Validation of a Group Theory Concept Inventory. Ph.D. Thesis, Portland State University, Portland, OR, USA, 2015. [Google Scholar]
  15. Melhuish, K. The Group Theory Concept Assessment: A Tool for Measuring Conceptual Understanding in Introductory Group Theory. Int. J. Res. Undergrad. Math. Educ. 2019, 5, 359–393. [Google Scholar] [CrossRef]
  16. Andamon, J.C.; Tan, D.A. Conceptual Understanding, Attitude And Performance In Mathematics Of Grade 7 Students. Int. J. Sci. Technol. Res. 2018, 7, 96–105. [Google Scholar]
  17. Weber, K.; Larsen, S. Teaching and Learning Group Theory. In Making The Connection; Carlson, M.P., Rasmussen, C., Eds.; Mathematical Association of America: Washington, DC, USA, 2008; pp. 139–151. [Google Scholar]
  18. Edwards, B.W.; Ward, M.B. Surprises from mathematics education research: Student (mis) use of mathematical definitions. Am. Math. Mon. 2004, 111, 411–424. [Google Scholar] [CrossRef] [Green Version]
  19. Lajoie, C.; Mura, R. What’s in a Name? A Learning Difficulty in Connection with Cyclic Groups. Learn. Math. 2000, 20, 29–33. [Google Scholar]
  20. Novotná, J.; Hoch, M. How structure sense for algebraic expressions or equations is related to structure sense for abstract algebra. Math. Educ. Res. J. 2008, 20, 93–104. [Google Scholar] [CrossRef]
  21. Dubinskiy, E.; Dautermann, J.; Leron, U.; Zazkis, R. On learning fundamental concepts of group theory. Educ. Stud. Math. 1994, 27, 267–305. [Google Scholar] [CrossRef]
  22. Carlson, M.; Oehrtman, M.; Engelke, N. The pre-calculus concept assessment: A tool for assessing students’ reasoning abilities and understandings. Cogn. Instr. 2010, 28, 113–145. [Google Scholar] [CrossRef]
  23. Epstein, J. The calculus concept inventory—Measurement of the effect of teaching methodology in mathematics. Not. Am. Math. Soc. 2013, 160, 1018–1027. [Google Scholar] [CrossRef]
  24. Dubinsky, E.; Mcdonald, M.A. APOS: A Constructivist Theory of Learning in Undergraduate Mathematics Education Research. In The Teaching and Learning of Mathematics at University Level; Springer: Switzerland, Basel, 2001; pp. 275–282. [Google Scholar] [CrossRef]
  25. Arnon, I.; Cottrill, J.; Dubinsky, E.; Oktac, A.; Fuentes, S.R.; Trigueros, M.; Weller, K. Mental Structures and Mechanisms: APOS Theory and the Construction of Mathematical Knowledge. In APOS Theory; Springer: Ney York, NY, USA, 2014; pp. 17–26. [Google Scholar] [CrossRef]
  26. Messick, S. Validity of Psychological Assessment. Validation of Inferences from Persons’ Responses and Performances as Scientific Inquiry into Score Meaning. Am. Psychol. 1995, 5D, 741–749. [Google Scholar] [CrossRef]
  27. Kane, M.T. Current concerns in validity theory. J. Educ. Meas. 2001, 38, 319–342. [Google Scholar] [CrossRef]
  28. Kane, M.T. Validating the Interpretations and Uses of Test Scores. J. Educ. Meas. 2013, 50, 1–73. [Google Scholar] [CrossRef]
  29. Meinhardt, C. Entwicklung und Validierung eines Testinstruments zu Selbstwirksamkeitserwartungen von (Angehenden) Physiklehrkräften in Physikdidaktischen Handlungsfeldern, 1st ed.; Logos: Berlin, Germany, 2018. [Google Scholar] [CrossRef] [Green Version]
  30. Bitzenbauer, P. Development of a Test Instrument to Investigate Secondary School Students’ Declarative Knowledge of Quantum Optics. Eur. J. Sci. Math. Educ. 2021, 9, 57–79. [Google Scholar] [CrossRef]
  31. Lindell, R.S.; Peak, E.; Foster, T.M. Are they all created equal? A comparison of different concept inventory development methodologies. AIP Conf. Proc. 2007, 883, 14. [Google Scholar]
  32. Zenger, T.; Bitzenbauer, P. Exploring German Secondary School Students’ Conceptual Knowledge of Density. Sci. Educ. Int. 2022, 33, 86–92. [Google Scholar] [CrossRef]
  33. Flateby, T.L. A Guide for Writing and Improving Achievement Tests; University of South Florida: Tampa, FL, USA, 1996; Available online: https://evaeducation.weebly.com/uploads/1/9/6/9/19692577/guide.pdf (accessed on 15 April 2022).
  34. Jorion, H.; James, B.D.; Schroeder, K.; DiBello, L.; Pellegrino, J.W. An Analytic framework for Evaluating the Validity of Concept Inventory Claims. J. Eng. Educ. 2015, 104, 454–496. [Google Scholar] [CrossRef]
  35. Hasan, S.; Bagayoko, D.; Kelley, E.L. Misconceptions and the certainty of response index. Phys. Educ. 1999, 34, 294–299. [Google Scholar] [CrossRef]
  36. Moosbrugger, H.; Kelava, A. Testtheorie und Fragebogenkonstruktion, 2nd ed.; Springer: Berlin/Heidelberg, Germany, 2012. [Google Scholar] [CrossRef]
  37. Robbins, N.; Heiberger, R. Plotting Likert and other rating scales. In Proceedings of the 2011 Joint Statistical Meeting, Miami Beach, FL, USA, 30 July 2011–4 August 2011; pp. 1058–1066. [Google Scholar]
  38. Landis, J.R.; Koch, G.G. The Measurement of Observer Agreement for Categorial Data. Biometrics 1977, 33, 159–174. [Google Scholar] [CrossRef] [Green Version]
  39. Engelhardt, P.V. An Introduction to Classical Test Theory as Applied to Conceptual Multiple-Choice Tests; Tennessee Technological University: Cookeville, TN, USA, 2009; Available online: https://www.compadre.org/Repository/document/ServeFile.cfm?ID=8807&DocID=1148 (accessed on 15 April 2022).
  40. Kline, T.J.B. Psychological Testing: A Practical Approach to Design and Evaluation, 1st ed.; SAGE Publications, Inc.: Newbury Park, CA, USA, 2005. [Google Scholar] [CrossRef] [Green Version]
  41. Taber, K.S. The Use of Cronbach’s Alpha When Developing and Reporting Research Instruments in Science Education. Res. Sci. Educ. 2018, 48, 1273–1296. [Google Scholar] [CrossRef]
  42. Embretson, S.E. The new rules of measurement. Psychol. Assess. 1996, 8, 341–349. [Google Scholar] [CrossRef]
  43. Hambleton, R.K.; Jones, R.W. Comparison of classical test theory and item response theory and their applications to test development. Educ. Meas. Issues Pract. 1993, 12, 38–47. [Google Scholar] [CrossRef]
  44. Planinic, M.; Boone, W.J.; Susac, A.; Ivanjek, L. Rasch analysis in physics education research: Why measurement matters. Phys. Rev. Phys. Educ. Res. 2019, 15, 020111. [Google Scholar] [CrossRef] [Green Version]
  45. Cantó-Cerdán, M.; Cacho-Martínez, P.; Lara-Lacárcel, F.; García-Munoz, A. Rasch analysis for development and reduction of Symptom Questionnaire for Visual Dysfunctions (SQVD). Sci. Rep. 2021, 11, 14855. [Google Scholar] [CrossRef]
  46. Wu, M.L.; Adams, R.J.; Wilson, M.R.; Haldane, S.A. ACER ConQuest: Version 2.0. Generalised Item Response Modelling Software, 1st ed.; ACER Press: Camberwell, Australia, 2007. [Google Scholar]
  47. Wright, B.D.; Geofferey, N.M. Rating Scale Analysis, 1st ed.; MESA Press: Chicaco, IL, USA, 1982. [Google Scholar]
  48. Hölzl-Winter, A.; Wäschle, K.; Wittwer, J.; Watermann, R.; Nückles, M. Entwicklung und Validierung eines Tests zur Erfassung des Genrewissens Studierender und Promovierender der Bildungswissenschaften. Zeitschrift für Pädagogik 2015, 61, 185–202. [Google Scholar] [CrossRef]
  49. Chen, W.-H.; Thissen, D. Local Dependence Indexes for Item Pairs Using Item Response Theory. J. Educ. Behav. Stat. 1997, 22, 265–289. [Google Scholar] [CrossRef]
  50. Christensen, K.B.; Makransky, G.; Horton, M. Critical Values for Yen’s Q3: Identification of Local Dependence in the Rasch Model Using Residual Correlations. Appl. Psychol. Meas. 2017, 41, 178–194. [Google Scholar] [CrossRef]
  51. Jang, E.E.; Roussos, L. An Investigation into the Dimensionality of TOEFL Using Conditional Covariance-Based Nonparametric Approach. J. Educ. Meas. 2007, 44, 1–21. [Google Scholar] [CrossRef]
  52. George, D.; Mallery, P. SPSS for Windows Step by Step: A Simple Guide and Reference, 1st ed.; Allyn & Bacon: Boston, CA, USA, 2010. [Google Scholar]
  53. Nguyen, T.H.; Han, H.; Kim, M.T.; Chan, K.S. An Introduction to Item Response Theory for Patient-Reported Outcome Measurement. Patient 2014, 7, 23–35. [Google Scholar] [CrossRef] [Green Version]
  54. Kerlinger, F.N.; Lee, H.B. Foundations of Behavioral Research, 4th ed.; Hartcourt College Publishers: San Diego, CA, USA, 2000. [Google Scholar]
Figure 1. Overview of the development of our concept inventory. The acceptance survey can be found in [1]. The curved grey arrows indicate the cyclical nature of the revision process—revising a concept inventory is an on-going iterative process.
Education 12 00376 g001
Figure 2. Example of an Item Characteristic Curve for item 7 of our inventory. The data line is black and the estimated ICC based on this data is blue. The green dotted line indicates the item’ difficulty.
Education 12 00376 g002
Figure 3. Diverging Stacked Bar Chart for the experts’ ratings on the statement “The content of this item is relevant for learning about group theory” ( κ = 0.67 ).
Education 12 00376 g003
Figure 4. Diverging Stacked Bar Chart for the experts’ ratings on the statement “This item assesses a crucial aspect of the knowledge domain” ( κ = 0.74 ).
Education 12 00376 g004
Figure 5. Diverging Stacked Bar Chart for the experts’ ratings on the statement “This item’s distractors are authentic” ( κ = 0.70 ).
Education 12 00376 g005
Figure 6. Diverging Stacked Bar Chart for the experts’ ratings on the statement “The formulation of task assignment is clear and unambiguous” ( κ = 0.82 ).
Education 12 00376 g006
Figure 7. Histogram (left) and Boxplot (right) of the students’ test score.
Education 12 00376 g007
Figure 8. Infit MNSQ (blue cross) and Outfit MNSQ (green circle) for the concept inventory where item 13 has been dropped.
Education 12 00376 g008
Figure 9. The Item Characteristic Curves of all 17 items of our concept inventory on a common scale. The central bandwidth is 3.33 Logits. The dark blue outlier still indicating moderate solving probability for low trait levels belongs to item 2. As seen in Figure 10, more items of simmilar difficulty are desirable for the sample. The difficulty gap on the upper end of the scale is observed by the outliers in dark green which belong to items 4 and 6.
Education 12 00376 g009
Figure 10. Wright-Map of the piloting sample for our concept inventory.
Education 12 00376 g010
Table 1. Three example items of our concept inventory and the corresponding schemas according to APOS Theory. The complete instrument can be found in the Appendix A.
Item No.DescriptionSchemasNumber of Schemas
2Assessing whether a binary operation on M is a map f : M × M M , a map f : M M × M
or a map f : M × M M .
binary operations1
5Finding the neutral element of 🟉 where 🟉 : Z × Z Z such that a 🟉 b : = a + b 5 .binary operations,
identity element
2
6Finding the inverse of x Q \ { 0 } with respect to • where : Q \ { 0 } × Q \ { 0 } Q \ { 0 } such that a b : = a · b 7 .binary operations,
identity element,
inverse element
3
Table 2. Assumptions upon which our intended test score interpretation is based (cf. [29]) and how they were substantiated empirically.
AssumptionsAnalysis Method
A1: The items adequately represent the one-dimensional construct conceptual understanding of introductory group theoryRasch analysis (cf. Section 5.2.3 and Section 6.2.3), Expert Survey (cf. Section 5.1 and Section 6.1).
A2: The items are unambiguous and the instructions are clear from a mathematical and didactical point of viewExpert survey
A3: The items and distractors are authenticResponse distribution (cf. Section 6.2), Expert Survey
A4: The construct is distinguishable from different or similar constructsCorrelation analysis (cf. Section 6.2)
Table 3. Item battery from the expert survey. X ranged from 1 to 20 and represented the item that is referred to in the middle column.
X.1The content of this item is relevant for learning about group theory.□1□2□3□4□5
X.2This item assesses a crucial aspect of the knowledge domain.□1□2□3□4□5
X.3The item’s distractors are authentic.□1□2□3□4□5
X.4The formulation of task assignment is clear and unambiguous.□1□2□3□4□5
Table 4. Mean values μ and standard deviations σ of the experts’ responses for all 20 items.
The content of this item is relevant for learning about group theory
μ σ μ σ
Item 14.40.7Item 114.20.7
Item 24.30.9Item 124.30.9
Item 34.70.5Item 133.40.9
Item 44.90.3Item 143.40.9
Item 54.10.8Item 153.40.9
Item 64.10.8Item 163.40.9
Item 73.71.1Item 174.10.8
Item 84.10.6Item 184.30.7
Item 94.60.7Item 193.11.0
Item 104.40.7Item 204.30.5
Table 5. Mean values μ and standard deviations σ of the experts’ responses for all 20 items.
This item assesses a crucial aspect of the knowledge domain
μ σ μ σ
Item 14.50.8Item 114.20.8
Item 24.30.7Item 124.40.7
Item 34.70.5Item 133.91.0
Item 44.70.7Item 143.91.0
Item 54.11.2Item 153.91.0
Item 64.21.1Item 163.91.1
Item 73.01.4Item 174.20.7
Item 84.00.8Item 184.60.5
Item 94.70.5Item 193.00.9
Item 104.21.0Item 204.10.8
Table 6. Mean values μ and standard deviations σ of the experts’ responses for all 20 items.
The item’s distractors are authentic
μ σ μ σ
Item 13.21.5Item 114.90.3
Item 24.80.4Item 124.90.3
Item 34.70.7Item 134.01.4
Item 44.21.1Item 144.30.9
Item 54.70.7Item 154.40.7
Item 64.41.0Item 164.80.4
Item 74.30.7Item 173.91.2
Item 84.11.0Item 184.40.7
Item 93.61.3Item 194.30.9
Item 104.60.7Item 204.41.0
Table 7. Mean values μ and standard deviations σ of the experts’ responses for all 20 items.
The formulation of task assignment is clear and unambiguous
μ σ μ σ
Item 13.71.7Item 114.41.3
Item 24.90.3Item 125.00.0
Item 35.00.0Item 134.01.1
Item 45.00.0Item 144.41.1
Item 55.00.0Item 154.41.1
Item 65.00.0Item 164.80.4
Item 74.90.3Item 174.40.9
Item 84.31.5Item 184.41.3
Item 94.21.1Item 194.90.4
Item 104.61.0Item 204.61.3
Table 8. Distribution of the participants’ responses.
Answer Option 1Answer Option 2Answer Option 3
Item 10.270.660.07
Item 20.810.150.04
Item 30.630.180.19
Item 40.170.100.73
Item 50.530.330.14
Item 60.340.150.52
Item 70.330.360.31
Item 80.710.230.06
Item 90.450.220.34
Item 100.720.220.06
Item 110.620.190.19
Item 120.380.130.50
Item 130.180.620.20
Item 140.490.460.05
Item 150.690.200.10
Item 160.800.100.10
Item 170.730.090.18
Item 180.520.220.27
Item 190.650.180.17
Item 200.660.100.24
Table 9. Psychometric properties of each item.
Item Difficulty PDiscriminatory Power DAdjusted Cronbach’s Alpha α n ¯
Item 10.270.130.70
Item 20.730.130.70
Item 30.580.210.70
Item 40.140.180.70
Item 50.410.450.67
Item 60.130.120.70
Item 70.270.300.69
Item 80.590.340.68
Item 90.450.350.68
Item 100.660.260.69
Item 110.600.300.69
Item 120.340.280.69
Item 130.100.010.71
Item 140.280.200.70
Item 150.550.340.68
Item 160.690.260.69
Item 170.620.430.67
Item 180.380.330.68
Item 190.580.280.69
Item 200.620.360.68
Table 10. Overview of the relevant parameters for a dichotomous Rasch Model. SE is the standard error of item difficulty.
ItemSkewnessKurtosisItem DifficultySEInfit MNSQOutfit MNSQ
Item 11.25−0.441.340.211.071.16
Item 2−1.08−0.85−1.160.201.071.16
Item 3−0.33−1.91−0.370.181.061.08
Item 42.112.482.040.251.011.15
Item 50.36−1.890.410.180.920.88
Item 62.293.282.170.261.031.24
Item 71.04−0.941.120.200.980.97
Item 8−0.39−1.87−0.440.180.960.98
Item 90.21−1.970.240.180.970.96
Item 10−0.71−1.52−0.780.191.020.98
Item 11−0.42−1.84−0.470.181.001.03
Item 12−0.67−1.560.750.191.011.05
Item 141.00−1.021.080.201.061.05
Item 15−0.19−1.99−0.210.180.970.97
Item 16−0.85−1.30−0.930.191.001.02
Item 17−0.51−1.76−0.570.180.910.89
Item 180.48−1.790.540.180.980.98
Item 19−0.33−1.91−0.370.181.011.03
Item 20−0.51−1.71−0.570.180.960.96
Table 11. Item 2 of the CI2GT. The full concept inventory is provided in Appendix A.
Item 2: A binary operation on a set M is ⋯
⋯ a map f : M × M M .
⋯ a map f : M M × M .
⋯ a map f : M × M M × M .
Very sureSureUndecidedUnsureGuessed
Table 12. Item 5 of the CI2GT. The full concept inventory is provided in Appendix A.
Item 5: One can show that a 🟉 b : = a + b 5 defines an operation on Z such that ( Z , 🟉 ) is a group. The neutral element of this operation is ⋯
⋯ 5
⋯ 0
5
Very sureSureUndecidedUnsureGuessed
Table 13. Item 6 of the CI2GT. The full concept inventory is provided in Appendix A.
Item 6: One can show that a b : = ab 7 defines an operation on Q \ { 0 } such that ( Q \ { 0 } , ) is a group. The inverse of x Q \ { 0 } is given by ⋯
49 x
49 x 2
7 x
Very sureSureUndecidedUnsureGuessed
Table 14. Categorial Judgment Scheme and Assignment Rules for Evaluating a Concept Inventory (with dropped item 13) adopted from [34]. The ranges from Infit MNSQ and Outfit MNSQ are adopted from [44,53]. Values in parenthesis indicate the number of items that can fall outside of this recommendation.
AnalysisExcellentGoodAveragePoorCI2GT
Classical Test theory
Item Statistics
Difficulty 0.2 0.8 0.2 0.8 (3) 0.1 0.9 0.1 0.9 (3)good
Discrimination> 0.2 > 0.1 >0> 0.2 good
Total score reliability
α of total score> 0.9 > 0.8 > 0.65 > 0.5 average
α -with-item-deletedAll items less than overall α (3)(6)(9)excellent
Item Response Theory
Individual item measures
Infit MNSQ 0.7 1.3 0.6 1.4 0.5 1.5 excellent
Outfit MNSQ 0.7 1.3 0.6 1.4 0.5 1.5 excellent
All items fit the model(2)(4)(6)(8)excellent
Publisher’s Note: MDPI stays neutral with regard to jurisdictional claims in published maps and institutional affiliations.

