

Towards Digitalization in Early Childhood Education: Pre-Service Teachers’ Acceptance of Using Digital Storytelling, Comics, and Infographics in Saudi Arabia

Abstract
:1. Introduction
2. Literature Review
2.1. Digital Technology Integration in Early Childhood Education
2.2. The Context of Early Childhood Education in Saudi Arabia
2.3. Pre-Service Teachers in Early Childhood Education
2.4. Digital Storytelling in Early Childhood
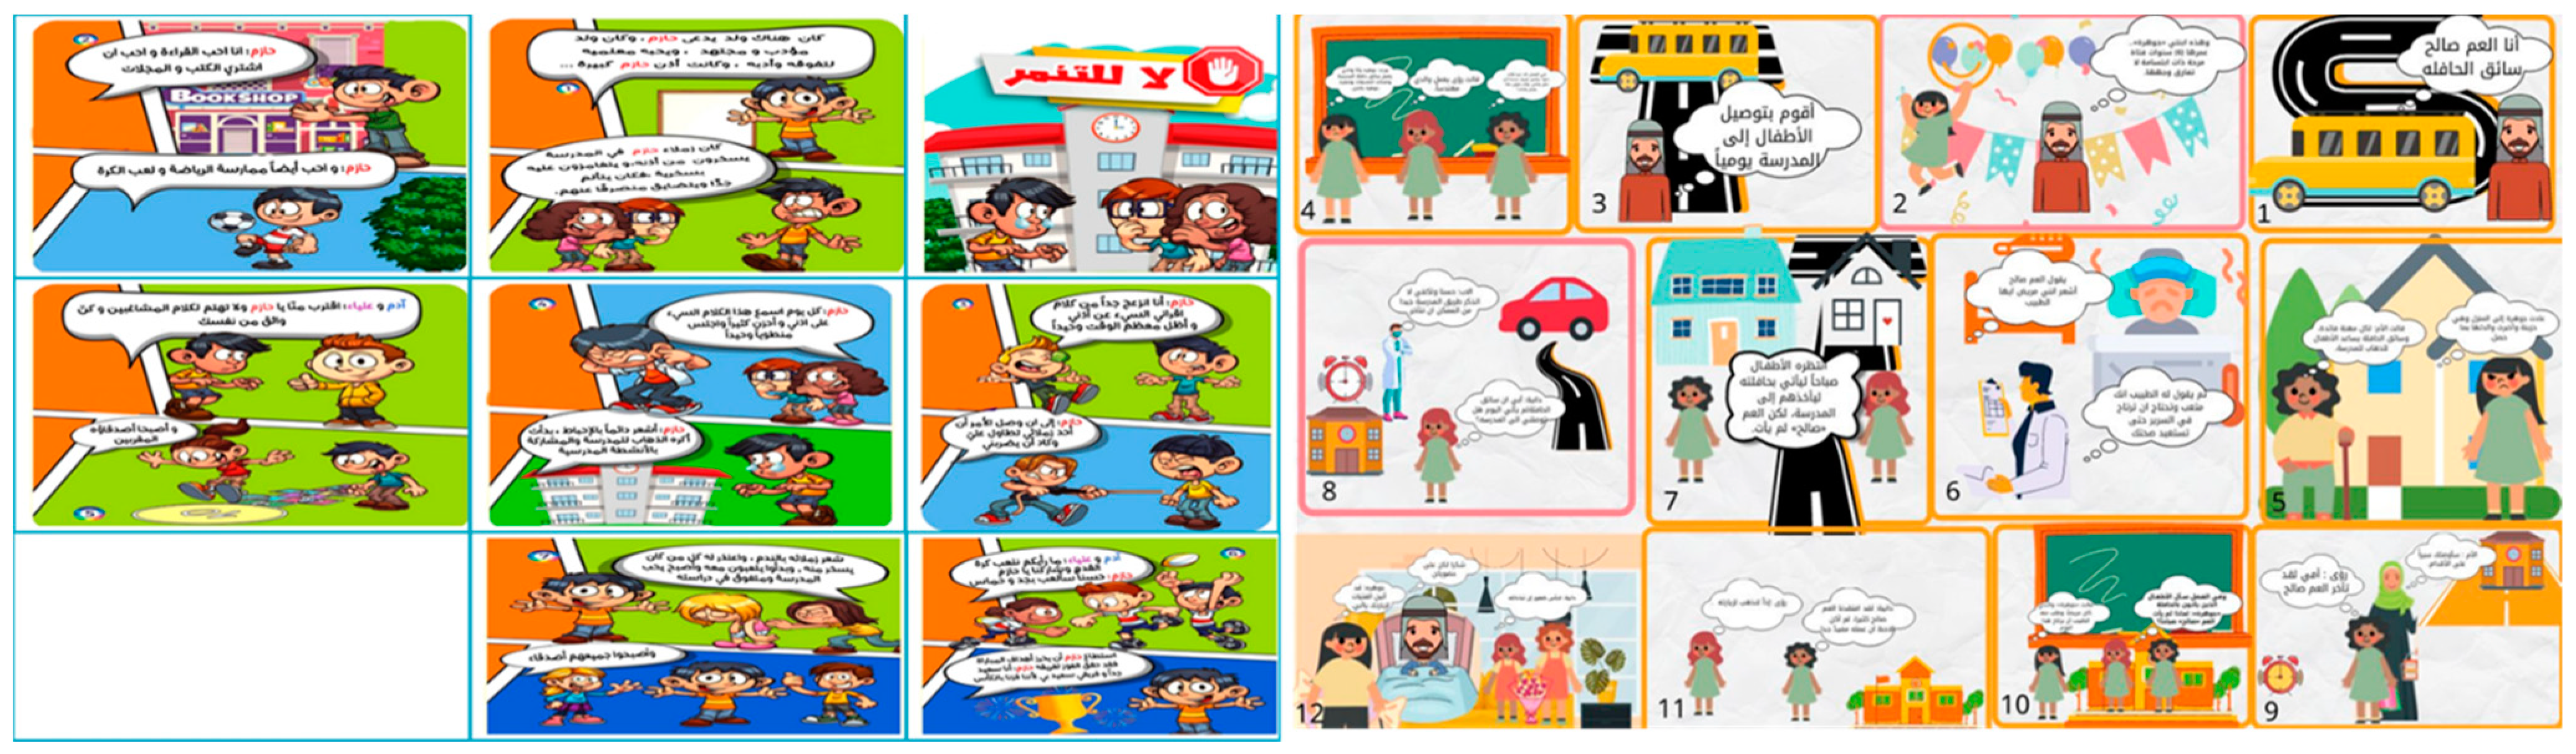
2.5. Digital Comics in Early Childhood
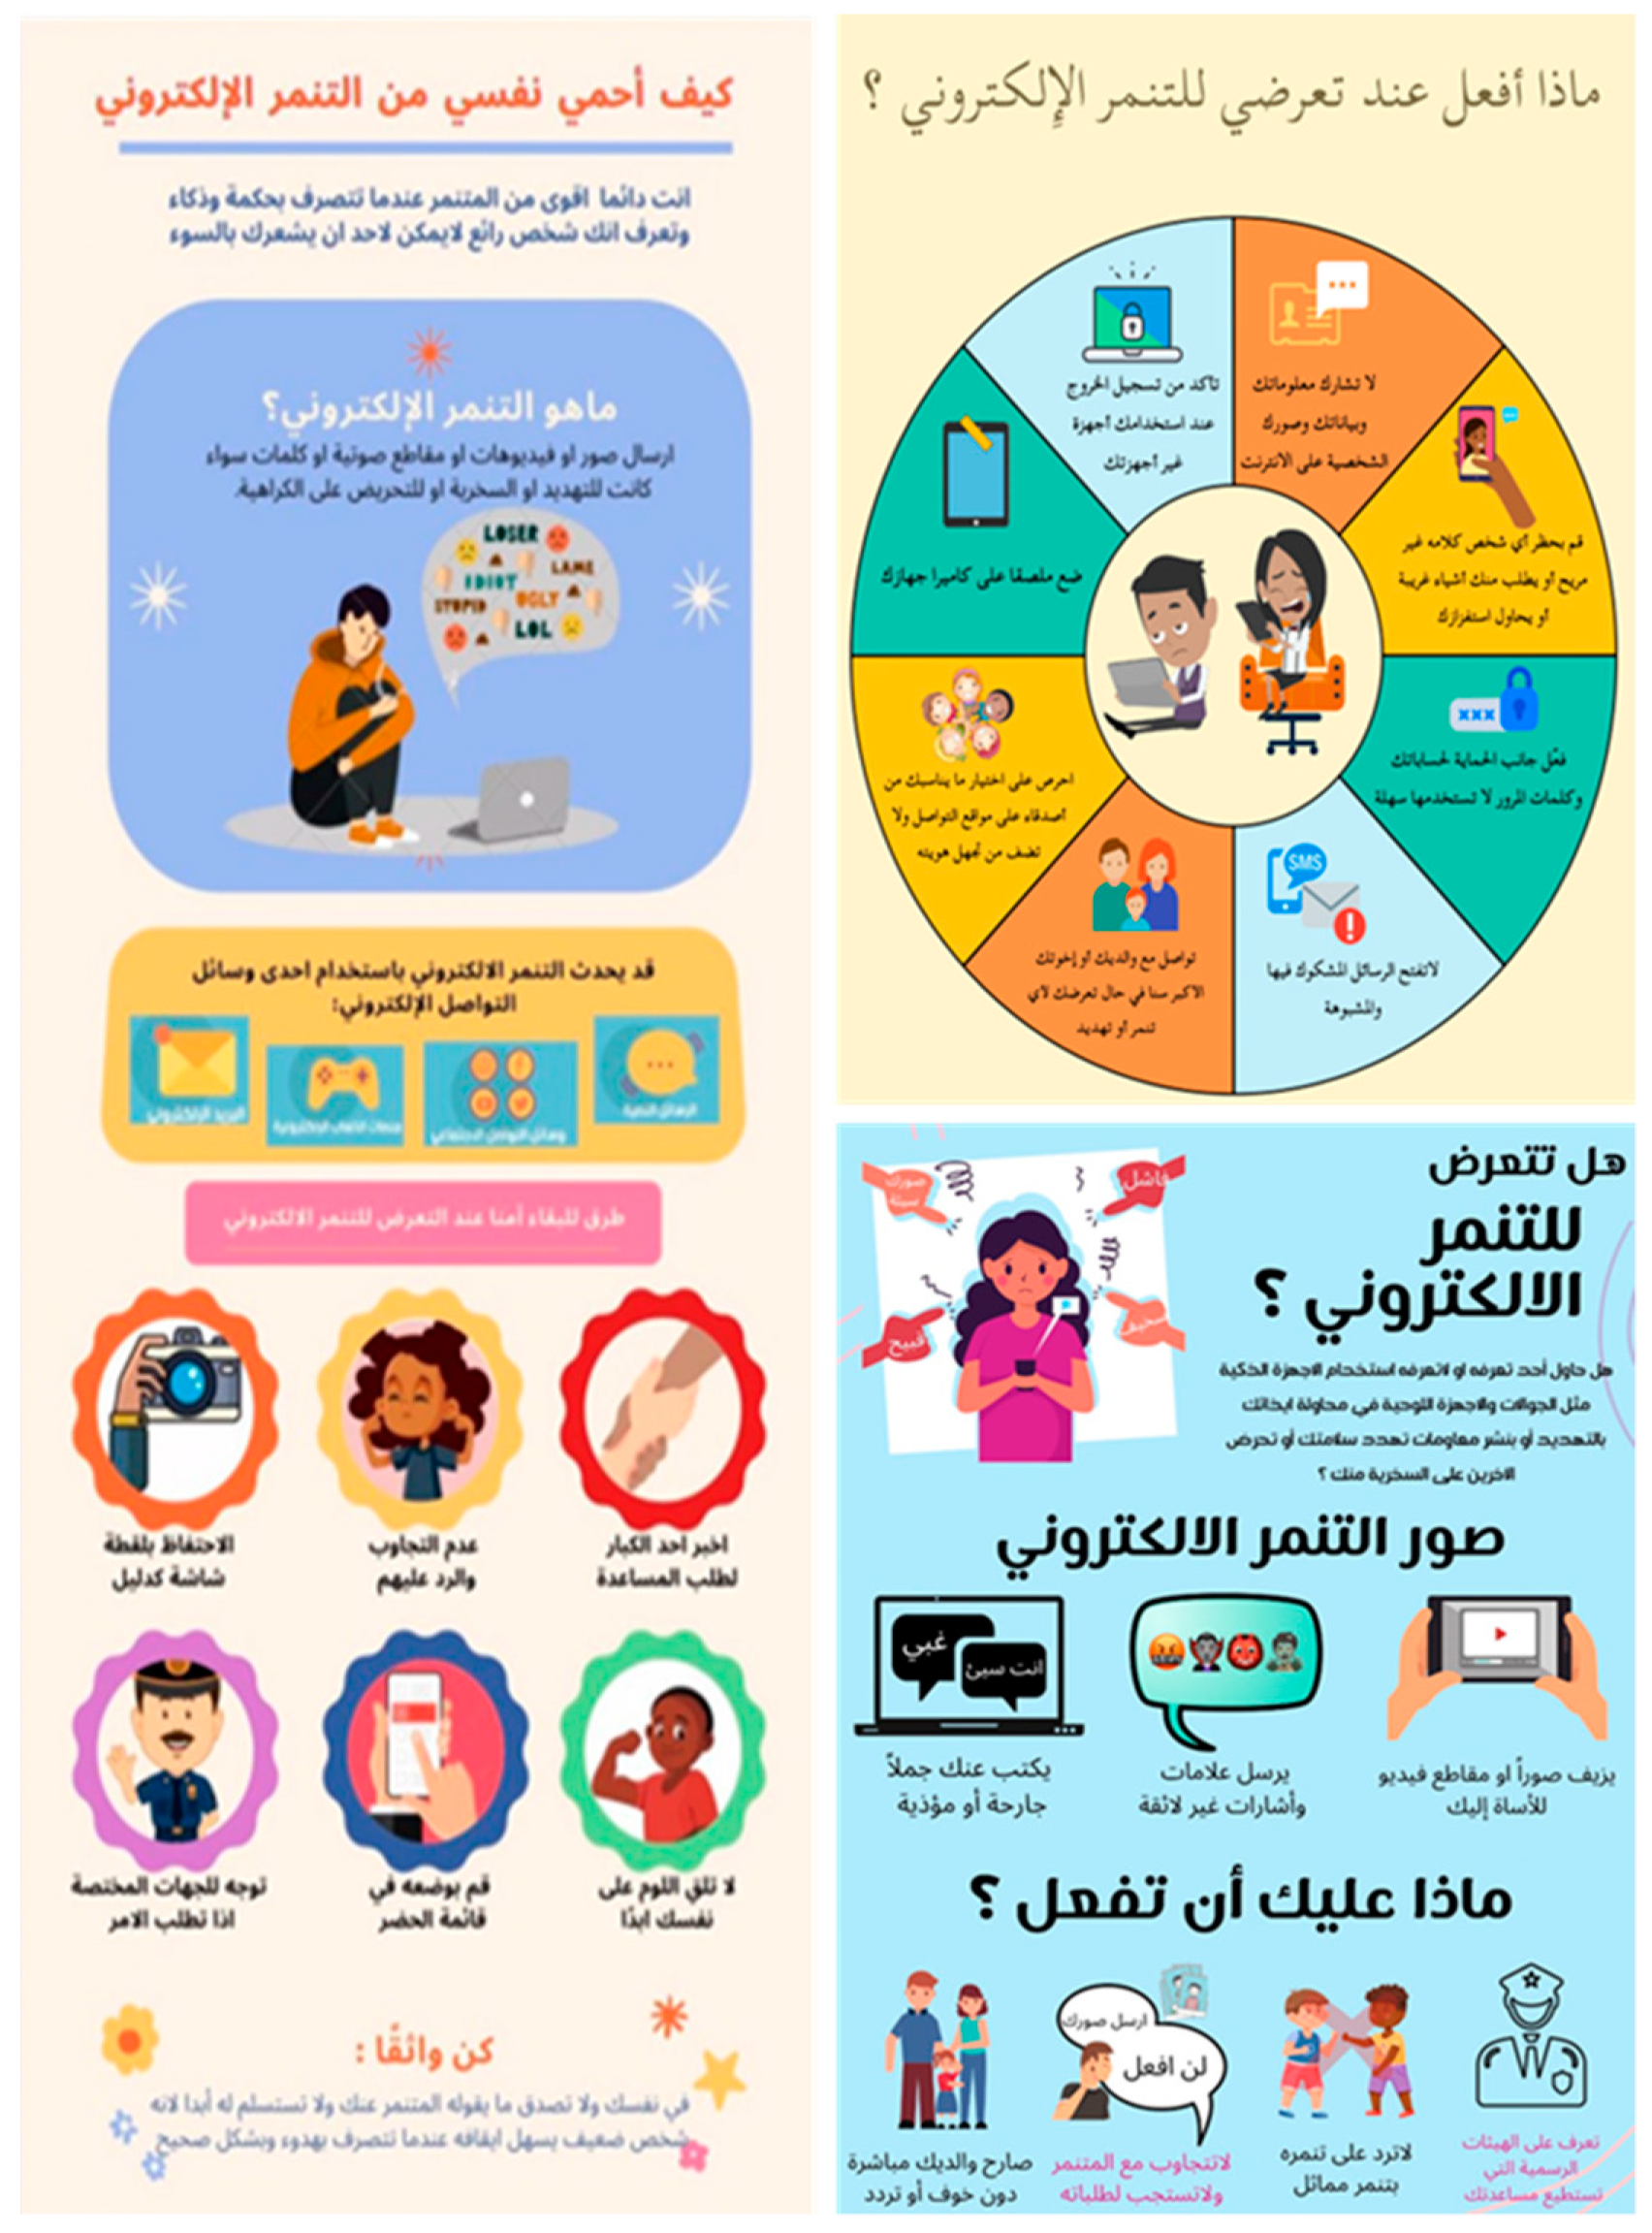
2.6. Digital Infographics in Early Childhood
3. Theoretical Framework and Hypotheses
4. Method
4.1. Context and Sample
- Clarity of learning objectives.
- Design quality (fonts, colors, sequences, consistency, and attractiveness).
- Inclusion of content related to the subject.
- Validity of the written and spoken language.
- Inclusion of clear images and graphics.
- Inclusion of appropriate and clear audio.
- Navigation and links.
- Creativity.
- Teamwork.
4.2. Instrument
4.3. Data Collection and Analysis
5. Findings
5.1. Instrument’s Reliability and Validity
5.2. Regression Analysis
5.2.1. Regression Analysis of the Digital Storytelling Model
5.2.2. Regression Analysis of the Digital Comics Model
5.2.3. Regression Analysis of the Digital Infographics Model
6. Discussion and Implications
7. Conclusion and Limitations
Funding
Institutional Review Board Statement
Informed Consent Statement
Data Availability Statement
Conflicts of Interest
References
- Luo, W.; Berson, I.R.; Berson, M.J.; Li, H. Are Early Childhood Teachers Ready for Digital Transformation of Instruction in Mainland China? A Systematic Literature Review. Child. Youth Serv. Rev. 2021, 120, 105718. [Google Scholar] [CrossRef]
- Alkhayat, L.; Ernest, J.; LaChenaye, J. Exploring Kuwaiti Preservice Early Childhood Teachers’ Beliefs About Using Web 2.0 Technologies. Early Child. Educ. J. 2020, 48, 715–725. [Google Scholar] [CrossRef]
- Alelaimat, A.M.; Ihmeideh, F.M.; Alkhawaldeh, M.F. Preparing Preservice Teachers for Technology and Digital Media Integration: Implications for Early Childhood Teacher Education Programs. Int. J. Early Child. 2021, 52, 299–317. [Google Scholar] [CrossRef]
- Anisimova, E. Digital Literacy of Future Preschool Teachers. J. Soc. Stud. Educ. Res. 2020, 11, 230–253. [Google Scholar]
- Dong, C.; Mertala, P. It is a Tool, but Not a ‘Must’: Early Childhood Preservice Teachers’ Perceptions of ICT and Its Affordances. Early Years 2019, 41, 540–555. [Google Scholar] [CrossRef] [Green Version]
- Vidal-Hall, C.; Flewitt, R.; Wyse, D. Early Childhood Practitioner Beliefs About Digital Media: Integrating Technology into a Child-Centred Classroom Environment. Eur. Early Child. Educ. Res. J. 2020, 28, 167–181. [Google Scholar] [CrossRef]
- Romero Tena, R.; López Lozano, L.; Puig Gutiérrez, M. Types of Use of Technologies by Spanish Early Childhood Teachers. Eur. J. Educ. Res. 2020, 9, 511–522. [Google Scholar] [CrossRef] [Green Version]
- Albeshr, M.M. Activating the role of digital citizenship in kindergarten institutions in light of the vision of the Kingdom of Saudi Arabia 2030. In Proceedings of the Second International Conference on Education in the Arab World: Problems and Solutions, Makkah Al-Mukarramah, Saudi Arabia, 4–6 March 2022; pp. 1–20. [Google Scholar]
- Alotaibi, M.S. Early Childhood Education and the Saudi Vision 2030. Educ. J. Fac. Educ. Sohag 2021, 91, 181–204. [Google Scholar] [CrossRef]
- Faraj, S.E.; Aljmey, W.A.; Bashatoh, M.O.; Talbah, M.H.; Alwahab, S.K. The Role of the Early Childhood Teacher in Managing Extra-Curricular Activities to Enhance the Values and National Identity of the Kindergarten Child in the Light of the 2030 Vision. J. Educ. Sci. 2020, 3, 1–40. [Google Scholar]
- Bugis, Y.M. Creating Digital Stories with Saudi Arabian Preservice Teachers: Using the Analysis, Design, Development, Implementation, and Evaluation Model to Promote Lesson Plan Development. Ph.D. Thesis, University of Northern Colorado, Greeley, CO, USA, 2018. [Google Scholar]
- Al Lily, A.E.; Alhazmi, A.A.; Abunasser, F.M.; Buarki, H.J.; Gomaa, A.A.S.E.; Al Hanandeh, A.M.; Elayyan, S.R.; Alghamdi, A.M.; Almufeez, K.A.; Aldoghmi, M.A.; et al. Covidian Education: An Enquiry into Arab Culture. Technol. Soc. 2021, 66, 1–10. [Google Scholar] [CrossRef]
- Aladsani, H.K.; Al-Abdullatif, A.M.; Almuhanna, M.; Gameil, A. Ethnographic Reflections of K–12 Distance Education in Saudi Arabia: Shaping the Future of Post-Pandemic Digital Education. Sustainability 2022, 14, 9931. [Google Scholar] [CrossRef]
- Gjelaj, M.; Buza, K.; Shatri, K.; Zabeli, N. Digital Technologies in Early Childhood: Attitudes and Practices of Parents and Teachers in Kosovo. Int. J. Instr. 2020, 13, 165–184. [Google Scholar] [CrossRef]
- Taghizadeh, M.; Yourdshahi, Z.H. Integrating Technology into Young Learners’ Classes: Language Teachers’ Perceptions. Comput. Assist. Lang. Learn. 2020, 33, 982–1006. [Google Scholar] [CrossRef]
- Donohue, C.; Schomburg, R. Technology and Interactive Media in Early Childhood Programs: What We’ve Learned from Five Years of Research, Policy, and Practice. Young Child. 2017, 72, 72–78. [Google Scholar]
- Salem, F.A.O. A Proposed Conception to Activate the Role of Kindergarten Teacher in the Development of Digital Technology in Light of Contemporary Crises. SVU—Int. J. Educ. Sci. 2021, 4, 475–510. [Google Scholar]
- Shinas, V.H.; Wen, H. Preparing Teacher Candidates to Implement Digital Storytelling. Comput. Educ. Open 2022, 3, 1–8. [Google Scholar] [CrossRef]
- Alghamdi, J.; Mostafa, F.; Abubshait, A. Exploring Technology Readiness and Practices of Kindergarten Student-Teachers in Saudi Arabia: A Mixed-Methods Study. Educ. Inf. Technol. 2022, 27, 7851–7868. [Google Scholar] [CrossRef]
- Edwards, S. New Concepts of Play and the Problem of Technology, Digital Media and Popular-Culture Integration with Play-Based Learning in Early Childhood Education. Technol. Pedag. Educ. 2016, 25, 513–532. [Google Scholar] [CrossRef]
- Kharashi, N. The Benefits and Challenges of Using Technology in Early Childhood Education. Read. Knowl. J. 2019, 215, 1–25. [Google Scholar] [CrossRef]
- Xie, K.; Vongkulluksn, V.W.; Justice, L.M.; Logan, J.A. Technology Acceptance in Context: Preschool Teachers’ Integration of a Technology-Based Early Language and Literacy Curriculum. J. Early Child. Teach. Educ. 2019, 40, 275–295. [Google Scholar] [CrossRef]
- Otterborn, A.; Schönborn, K.; Hultén, M. Surveying Preschool Teachers’ Use of Digital Tablets: General and Technology Education Related Findings. Int. J. Technol. Design Educ. 2019, 29, 717–737. [Google Scholar] [CrossRef] [Green Version]
- Al-Abdullatif, A.M. Auditing the TPACK Confidence of Preservice Teachers: The Case of Saudi Arabia. Educ. Inf. Technol. 2019, 24, 3393–3413. [Google Scholar] [CrossRef]
- Murcia, K.; Cross, E. Empowering early childhood teachers to develop digital technology pedagogies: An Australian action research case study. In STEM, Robotics, Mobile Apps in Early Childhood and Primary Education; Springer: Singapore, 2022; pp. 33–53. [Google Scholar]
- Alasimi, A.A. Saudi Early Childhood Teachers’ Attitudes about the Use of Technology in Early Childhood Classrooms. Ph.D. Thesis, Kent State University, Kent, OH, USA, 2018. [Google Scholar]
- Alsuwidan, S.I. The Teacher Perspective on Integrating Technology into Their Early Childhood Classrooms in Saudi Arabia. Ph.D. Thesis, Saint Louis University, St. Louis, MO, USA, 2018. [Google Scholar]
- Altun, D. Investigating Preservice Early Childhood Education Teachers’ Technological Pedagogical Content Knowledge (TPACK) Competencies Regarding Digital Literacy Skills and Their Technology Attitudes and Usage. J. Educ. Learn. 2019, 8, 249–263. [Google Scholar] [CrossRef]
- Mertala, P. Teachers’ Beliefs About Technology Integration in Early Childhood Education: A Meta-Ethnographical Synthesis of Qualitative Research. Comput. Hum. Behav. 2019, 101, 334–349. [Google Scholar] [CrossRef]
- Papadakis, S.; Vaiopoulou, J.; Sifaki, E.; Stamovlasis, D.; Kalogiannakis, M. Attitudes Towards the Use of Educational Robotics: Exploring Preservice and In-Service Early Childhood Teacher Profiles. Educ. Sci. 2021, 11, 204. [Google Scholar] [CrossRef]
- Lim, N.Z.L.; Zakaria, A.; Aryadoust, V. A Systematic Review of Digital Storytelling in Language Learning in Adolescents and Adults. Educ. Inf. Technol. 2022, 27, 6125–6155. [Google Scholar] [CrossRef]
- Wu, J.; Chen, D.T.V. A Systematic Review of Educational Digital Storytelling. Comput. Educ. 2020, 147, 103786. [Google Scholar] [CrossRef]
- Wisnumurti, P.K.; Setyaningsih, E.; Wahyuni, D.S. Digital Storytelling in TEYL: A Narrative Inquiry of a preservice Teacher. J. Lang. Lang. Teach. 2021, 9, 1–13. [Google Scholar] [CrossRef]
- Kurniawan, M. Digital Storytelling: Teachers’ Guide to Attract Children’s Interest and Motivation in Kindergarten’s English Language Learning. Satya Widya 2021, 37, 16–24. [Google Scholar] [CrossRef]
- Purnama, S. Teachers’ Experiences of Using Digital Storytelling in Early Childhood Education in Indonesia: A Phenomenological Study. J. Pendidikan Islam 2021, 10, 279–298. [Google Scholar]
- Parsazadeh, N.; Cheng, P.Y.; Wu, T.T.; Huang, Y.M. Integrating Computational Thinking Concept into Digital Storytelling to Improve Learners’ Motivation and Performance. J. Educ. Comput. Res. 2021, 59, 470–495. [Google Scholar] [CrossRef]
- Leung, S.K.Y.; Chiu, J.L.Y.; Lam, Y. Online Storytelling for Young Children During the Pandemic. Child. Educ. 2021, 97, 68–71. [Google Scholar] [CrossRef]
- Sagri, M.; Sofos, F.; Mouzaki, D. Digital Storytelling, Comics and New Technologies in Education: Review, Research and Perspectives. Int. Educ. J. Comp. Perspect. 2019, 17, 97–112. [Google Scholar]
- Gürsoy, G. Digital Storytelling: Developing 21st-century Skills in Science Education. Eur. J. Educ. Res. 2021, 10, 97–113. [Google Scholar] [CrossRef]
- Anilan, B.; Berber, A.; Anilan, H. The Digital Storytelling Adventures of the Teacher Candidates. Turk. Online J. Qual. Inq. 2018, 9, 262–287. [Google Scholar] [CrossRef] [Green Version]
- Özkaya, P.G. Investigating Research Trends on Digital Storytelling: A Bibliometric and Visualized Analysis. Int. J. Progress. Educ. 2022, 18, 379–396. [Google Scholar]
- Al-Abdullatif, A.M.; Al-Dokhny, A.A.; Drwish, A.M. Critical Factors Influencing Preservice Teachers’ Use of the Internet of Things (IoT) in Classrooms. Int. J. Interact. Mobile Technol. 2022, 16, 85–102. [Google Scholar] [CrossRef]
- Belda-Medina, J. Promoting Inclusiveness, Creativity and Critical Thinking Through Digital Storytelling Among EFL Teacher Candidates. Int. J. Incl. Educ. 2022, 26, 109–123. [Google Scholar] [CrossRef]
- Akcanca, N. An Alternative Teaching Tool in Science Education: Educational Comics. Int. Online J. Educ. Teach. 2020, 7, 1550–1570. [Google Scholar]
- Phoon, H.Y.; Roslan, R.; Shahrill, M.; Said, H.M. The Role of Comics in Elementary School Science Education. Formatif J. Ilmiah Pendidik. MIPA 2020, 10, 67–76. [Google Scholar] [CrossRef]
- Sidiropoulou, C.; Pagouni, I.; Dinas, K.D. Multimodal texts and linguistic development in early childhood education: Comics’ impact on oral language skills. In Proceedings of the 4th International Conference Education Across Borders Education in the 21st Century: Challenges and Perspectives, Florina, Greece, 19–20 October 2018; pp. 645–654. [Google Scholar]
- Saputra, V.H.; Pasha, D. Comics as learning medium during the Covid-19 pandemic. In Proceedings of the International Conference on Science and Engineering, Yogyakarta, Indonesia, 27 October 2020; Volume 4, pp. 330–334. [Google Scholar]
- Danh, N.T.; Hoi, H.T. Use of Comics to Enhance Students’ Japanese Ability as Well as to Awake Their Hidden Potential. Int. J. Early Child. Special Educ. 2022, 14, 412–418. [Google Scholar] [CrossRef]
- Syarah, E.S.; Yetti, E.; Fridani, L.; Yufiarti, Y.; Hapidin, H.; Pupala, B. Electronic Comics in Elementary School Science Learning for Marine Conservation. J. Pendidik. IPA Indones. 2019, 8, 500–511. [Google Scholar]
- Istiq’faroh, N.; Mustadi, A. Improving Elementary School Students’ Creativity and Writing Skills Through Digital Comics. Ilkogr. Online 2020, 19, 426–435. [Google Scholar] [CrossRef]
- Akcanca, N. The Opinions of Prospective Teachers on the Design and Use of Digital Educational Comics as a Technological Teaching Material in Science Education. Int. J. Curric. Instr. 2021, 13, 2268–2288. [Google Scholar]
- Drwish, A.; Al-Dokhny, A.A. The Two Patterns of Providing Infographics (Fixed/Moving) Via the Web and Their Impact on Developing Visual Thinking Skills for Autistic Children and Their Attitudes Towards It. J. Educ. Technol. Ser. Stud. Res. Papers 2015, 25, 265–364. [Google Scholar]
- Kalimbetova, E.K.; Ilesbay, A.B. Infographics as a Means for Teaching Younger School Children. Psychology and Sociology Series 2020, 72, 129–135. [Google Scholar] [CrossRef]
- Delgado, J.C.; Iñiguez, M.; Garcia, C.; Cuenca, W.; Ordoñez, G.; Rodas, G. Infographics as a pedagogical instrument for dealing with children with hearing loss. In Proceedings of the EDULEARN20 Conference, Virtual, 6–7 July 2020; Volume 6, p. 7. [Google Scholar]
- Odewumi, M.O.; Bello, I. Learning Alphabets Through Infographics. Indones. J. Educ. Stud. 2020, 23, 1–10. [Google Scholar] [CrossRef]
- Kostas, I. The Utilization of Infographics in Refugee Children Education. Acad. Lett. 2021, 2, 1–9. [Google Scholar] [CrossRef]
- Bahjat, R.M. The Effectiveness of Using Educational Infographics in Developing the Perceptual Visual and Language Skills of the Kindergarten Child. J. Stud. Child. Educ. 2020, 12, 134–200. [Google Scholar]
- Davis, F.D.; Bagozzi, R.P.; Warshaw, P.R. User Acceptance of Computer Technology: A Comparison of Two Theoretical Models. Manag. Sci. 1989, 35, 982–1003. [Google Scholar] [CrossRef] [Green Version]
- Weng, F.; Yang, R.J.; Ho, H.J.; Su, H.M. A TAM-based Study of the Attitude Towards Use Intention of Multimedia Among School Teachers. Appl. Syst. Innov. 2018, 1, 36. [Google Scholar] [CrossRef] [Green Version]
- Park, S.Y. An Analysis of the Technology Acceptance Model in Understanding University Students’ Behavioral Intention to Use E-Learning. J. Educ. Technol. Soc. 2009, 12, 150–162. [Google Scholar]
- Teo, T.; Fan, X.; Du, J. Technology Acceptance Among Preservice Teachers: Does Gender Matter? Australas. J. Educ. Technol. 2015, 31, 235–251. [Google Scholar] [CrossRef]
- Abdel Hamid, H.E. Advanced Statistics for Educational, Psychological and Social Sciences; Dar Al-Fikr Al-Arabi: Cairo, Egypt, 2016. [Google Scholar]
- Hair, J.F.; Risher, J.J.; Sarstedt, M.; Ringle, C.M. When to Use and How to Report the Results of PLS-SEM. Eur. Bus. Rev. 2019, 31, 2–24. [Google Scholar] [CrossRef]
- Al-Abdullatif, A.M.; Alsaeed, M.S. Evaluating Visible Learning: Mathematics Teachers’ Practices in Technology-Enhanced Classrooms. Cogent Educ. 2019, 6, 1–24. [Google Scholar] [CrossRef]
- Romero-Tena, R.; Barragán-Sánchez, R.; Llorente-Cejudo, C.; Palacios-Rodríguez, A. The Challenge of Initial Training for Early Childhood Teachers. A Cross Sectional Study of Their Digital Competences. Sustainability 2020, 12, 4782. [Google Scholar] [CrossRef]


| Constructs | Items |
|---|---|
| Perceived usefulness (PU) |
|
| |
| |
| |
| |
| Perceived ease of use (PEU) |
|
| |
| |
| |
| |
| Attitude towards using (AU) |
|
| |
| |
| |
| Intention to use (IU) |
|
| |
| |
|
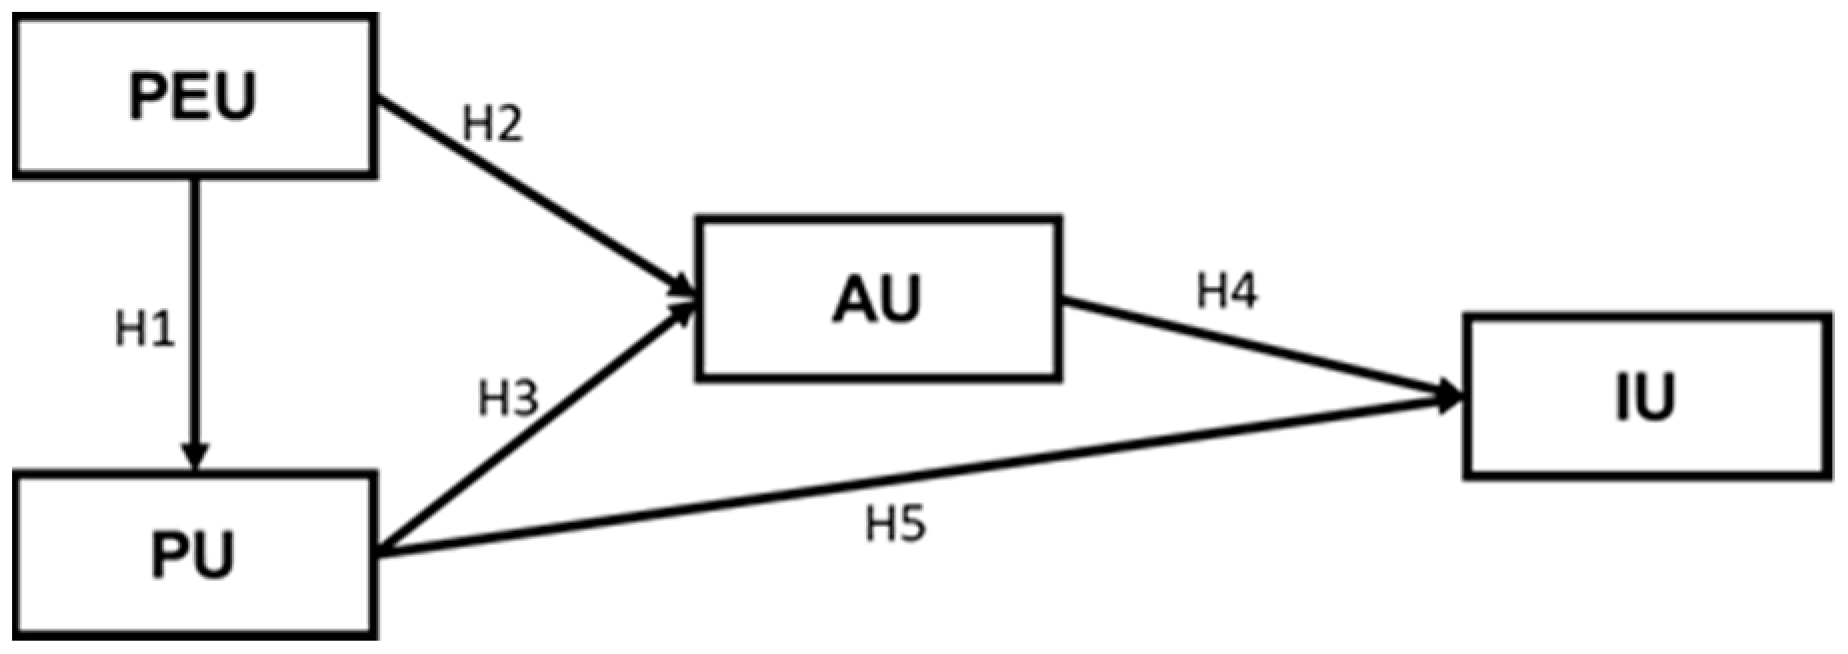
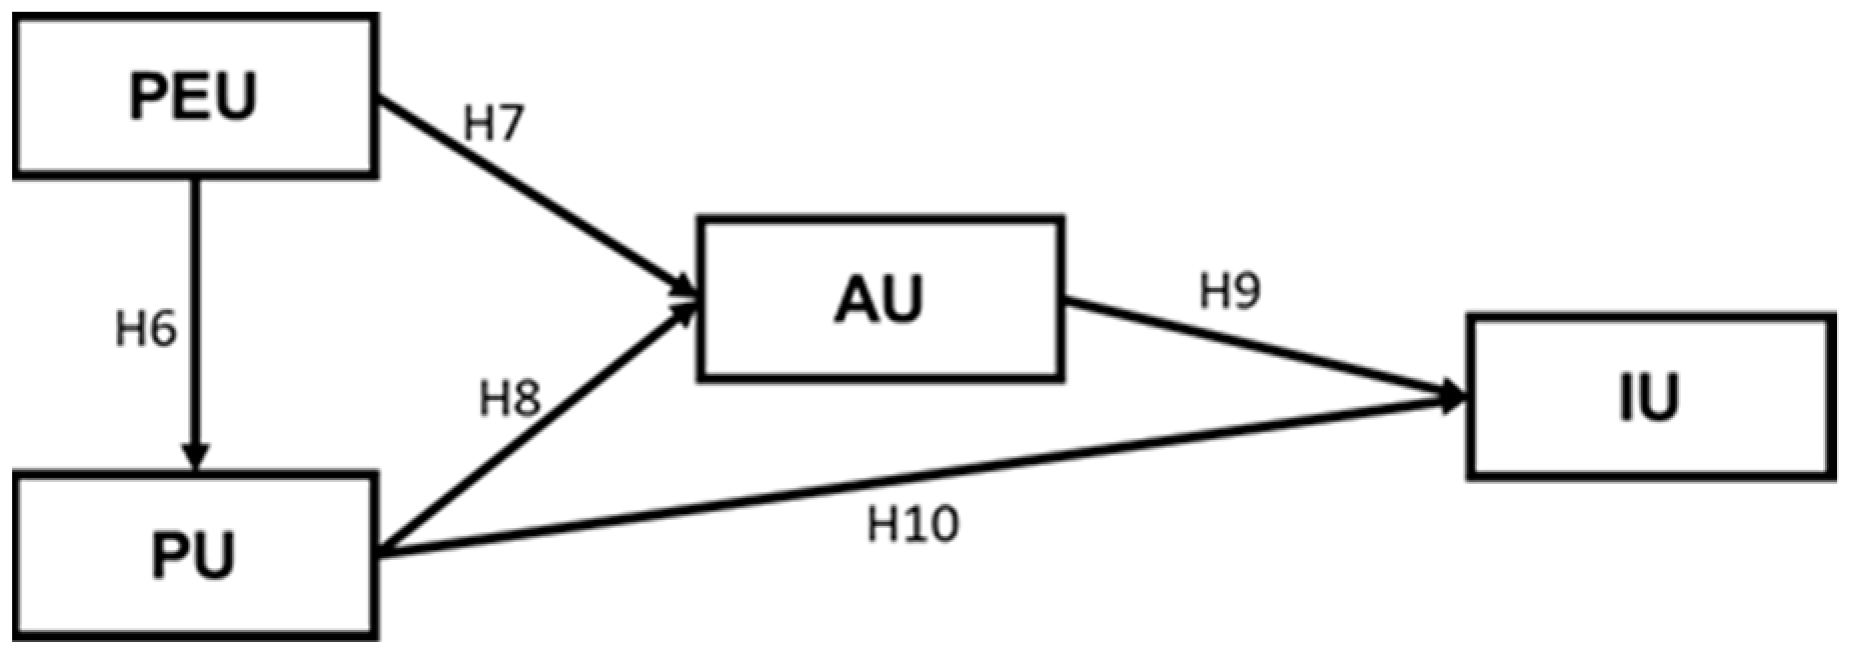
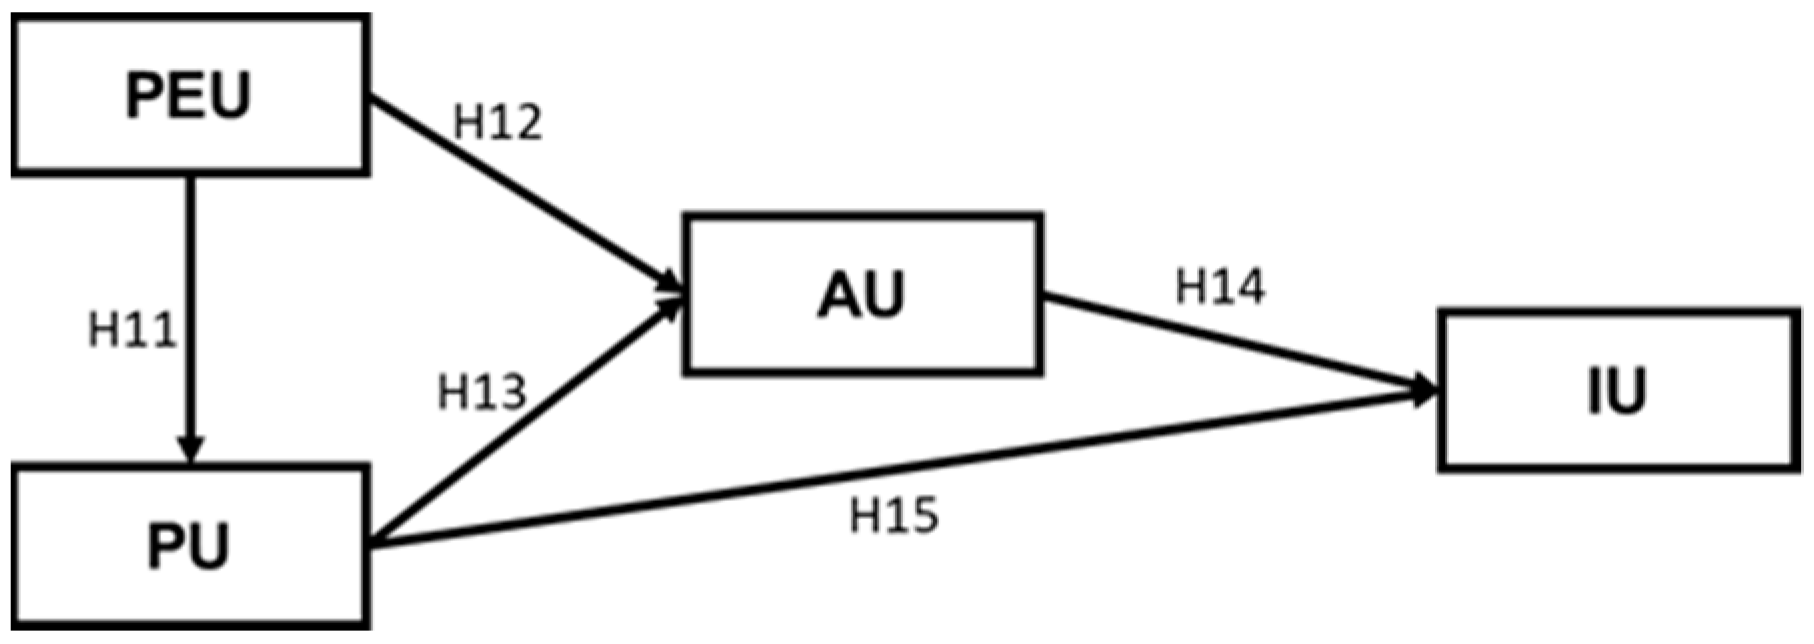
| Digital Technology | Hypotheses (H) | Dependent Variables (DV) | Independent Variables (IV) | Regression |
|---|---|---|---|---|
| Digital storytelling | H1 | PU | PEU | Simple |
| H2 | AU | PEU | Multiple | |
| H3 | AU | PU | ||
| H4 | IU | AU | Multiple | |
| H5 | IU | PU | ||
| Digital comics | H6 | PU | PEU | Simple |
| H7 | AU | PEU | Multiple | |
| H8 | AU | PU | ||
| H9 | IU | AU | Multiple | |
| H10 | IU | PU | ||
| Digital infographics | H11 | PU | PEU | Simple |
| H12 | AU | PEU | Multiple | |
| H13 | AU | PU | ||
| H14 | IU | AU | Multiple | |
| H15 | IU | PU |
| Variables | Items | Mean | Standard Deviation | Corrected Item-Total Correlation | Cronbach’s Alpha if Item Deleted | Cronbach’s Alpha |
|---|---|---|---|---|---|---|
| PEU | PEU1 | 4.33 | 0.71 | 0.720 * | 0.863 | 0.886 |
| PEU2 | 4.27 | 0.83 | 0.649 * | 0.881 | ||
| PEU3 | 4.47 | 0.73 | 0.650 * | 0.878 | ||
| PEU4 | 4.40 | 0.72 | 0.801 * | 0.845 | ||
| PEU5 | 4.20 | 0.81 | 0.822 * | 0.838 | ||
| PU | PU1 | 4.17 | 0.79 | 0.658 * | 0.918 | 0.902 |
| PU2 | 4.07 | 0.87 | 0.816 * | 0.866 | ||
| PU3 | 4.07 | 0.83 | 0.765 * | 0.878 | ||
| PU4 | 3.80 | 0.92 | 0.784 * | 0.874 | ||
| PU5 | 3.87 | 0.86 | 0.861 * | 0.856 | ||
| AU | AU1 | 4.43 | 0.77 | 0.796 * | 0.692 | 0.819 |
| AU2 | 4.60 | 0.72 | 0.790 * | 0.700 | ||
| AU3 | 4.40 | 0.62 | 0.617 * | 0.839 | ||
| AU4 | 4.47 | 0.78 | 0.836 * | 0.826 | ||
| IU | IU1 | 4.27 | 0.87 | 0.841 * | 0.939 | 0.946 |
| IU2 | 4.33 | 0.88 | 0.944 * | 0.908 | ||
| IU3 | 4.33 | 0.84 | 0.906 * | 0.922 | ||
| IU4 | 4.00 | 0.80 | 0.854 * | 0.950 |
| H | DV | IV | Pearson Correlation | Sig |
|---|---|---|---|---|
| H1 | PU | PEU | 0.565 ** | 0.0001 |
| H2 | AU | PEU | 0.817 ** | 0.0001 |
| H3 | PU | 0.635 ** | 0.0001 | |
| H4 | IU | AU | 0.731 ** | 0.0001 |
| H5 | PU | 0.491 ** | 0.0001 |
| Coefficients | ||||||||
|---|---|---|---|---|---|---|---|---|
| Model | B | Std. Error | Beta | t | Sig | R2 | Collinearity Statistics | |
| Tolerance | VIF | |||||||
| (Constant) | 3.924 | 3.583 | 1.095 | 0.279 | 0.319 | |||
| PEU | 0.764 | 0.158 | 0.565 | 4.839 | 0.000 * | 1.000 | 1.000 | |
| Coefficients | ||||||||
|---|---|---|---|---|---|---|---|---|
| Model | B | Std. Error | Beta | t | Sig | R2 | Collinearity Statistics | |
| Tolerance | VIF | |||||||
| (Constant) | 3.164 | 1.379 | 2.294 | 0.026 | 0.712 | |||
| PEU | 0.527 | 0.073 | 0.673 | 7.242 | 0.000 * | 0.681 | 1.468 | |
| PU | 0.148 | 0.054 | 0.256 | 2.751 | 0.008* | 0.681 | 1.468 | |
| Coefficients | ||||||||
|---|---|---|---|---|---|---|---|---|
| Model | B | Std. Error | Beta | t | Sig | R2 | Collinearity Statistics | |
| Tolerance | VIF | |||||||
| (Constant) | 0.849 | 2.278 | 0.373 | 0.711 | 0.535 | |||
| AU | 0.898 | 0.161 | 0.703 | 5.572 | 0.000 * | 0.596 | 1.677 | |
| PU | 0.033 | 0.093 | 0.045 | 0.354 | 0.725 | 0.596 | 1.677 | |
| H | DV | IV | Pearson Correlation | Sig |
|---|---|---|---|---|
| H6 | PU | PEU | 0.731 ** | 0.0001 |
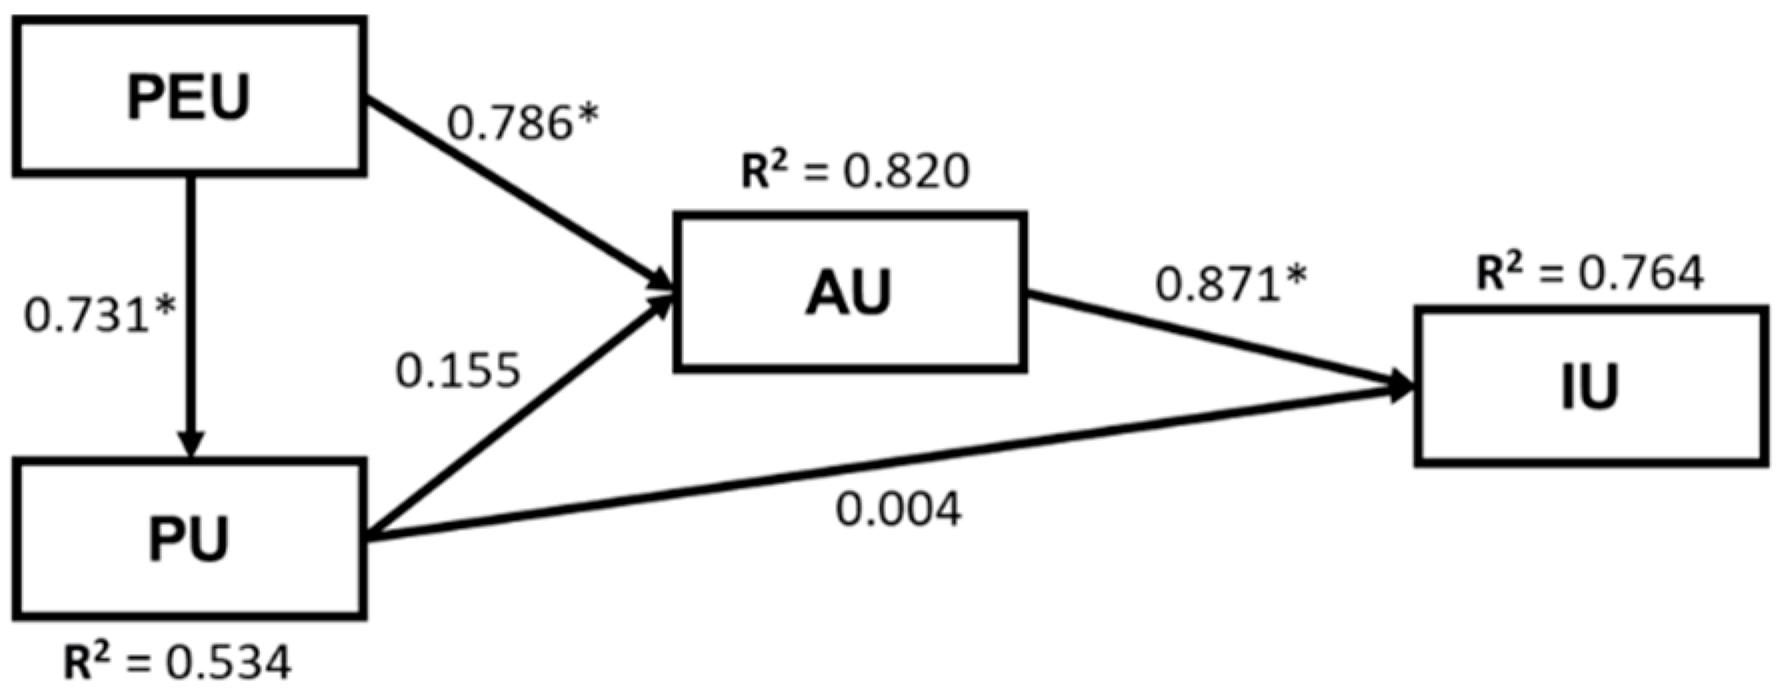
| H7 | AU | PEU | 0.899 ** | 0.0001 |
| H8 | PU | 0.729 ** | 0.0001 | |
| H9 | IU | AU | 0.874 ** | 0.0001 |
| H10 | PU | 0.640 ** | 0.0001 |
| Coefficients | ||||||||
|---|---|---|---|---|---|---|---|---|
| Model | B | Std. Error | Beta | t | Sig | R2 | Collinearity Statistics | |
| Tolerance | VIF | |||||||
| (Constant) | 4.912 | 1.997 | 2.460 | 0.017 | 0.534 | |||
| PEU | 0.755 | 0.100 | 0.731 | 7.569 | 0.000 * | 1.000 | 1.000 | |
| Coefficients | ||||||||
|---|---|---|---|---|---|---|---|---|
| Model | B | Std. Error | Beta | t | Sig | R2 | Collinearity Statistics | |
| Tolerance | VIF | |||||||
| (Constant) | 1.335 | 1.048 | 1.274 | 0.209 | 0.820 | |||
| PEU | 0.641 | 0.072 | 0.786 | 8.852 | 0.000 * | 0.466 | 2.146 | |
| PU | 0.122 | 0.070 | 0.155 | 1.745 | 0.087 | 0.466 | 2.146 | |
| Coefficients | ||||||||
|---|---|---|---|---|---|---|---|---|
| Model | B | Std. Error | Beta | t | Sig | R2 | Collinearity Statistics | |
| Tolerance | VIF | |||||||
| (Constant) | −2.217 | 1.514 | −1.464 | 0.150 | 0.764 | |||
| AU | 1.087 | 0.127 | 0.871 | 8.590 | 0.000 * | 0.468 | 2.137 | |
| PU | 0.004 | 0.100 | 0.004 | 0.041 | 0.967 | 0.468 | 2.137 | |
| H | DV | IV | Pearson Correlation | Sig |
|---|---|---|---|---|
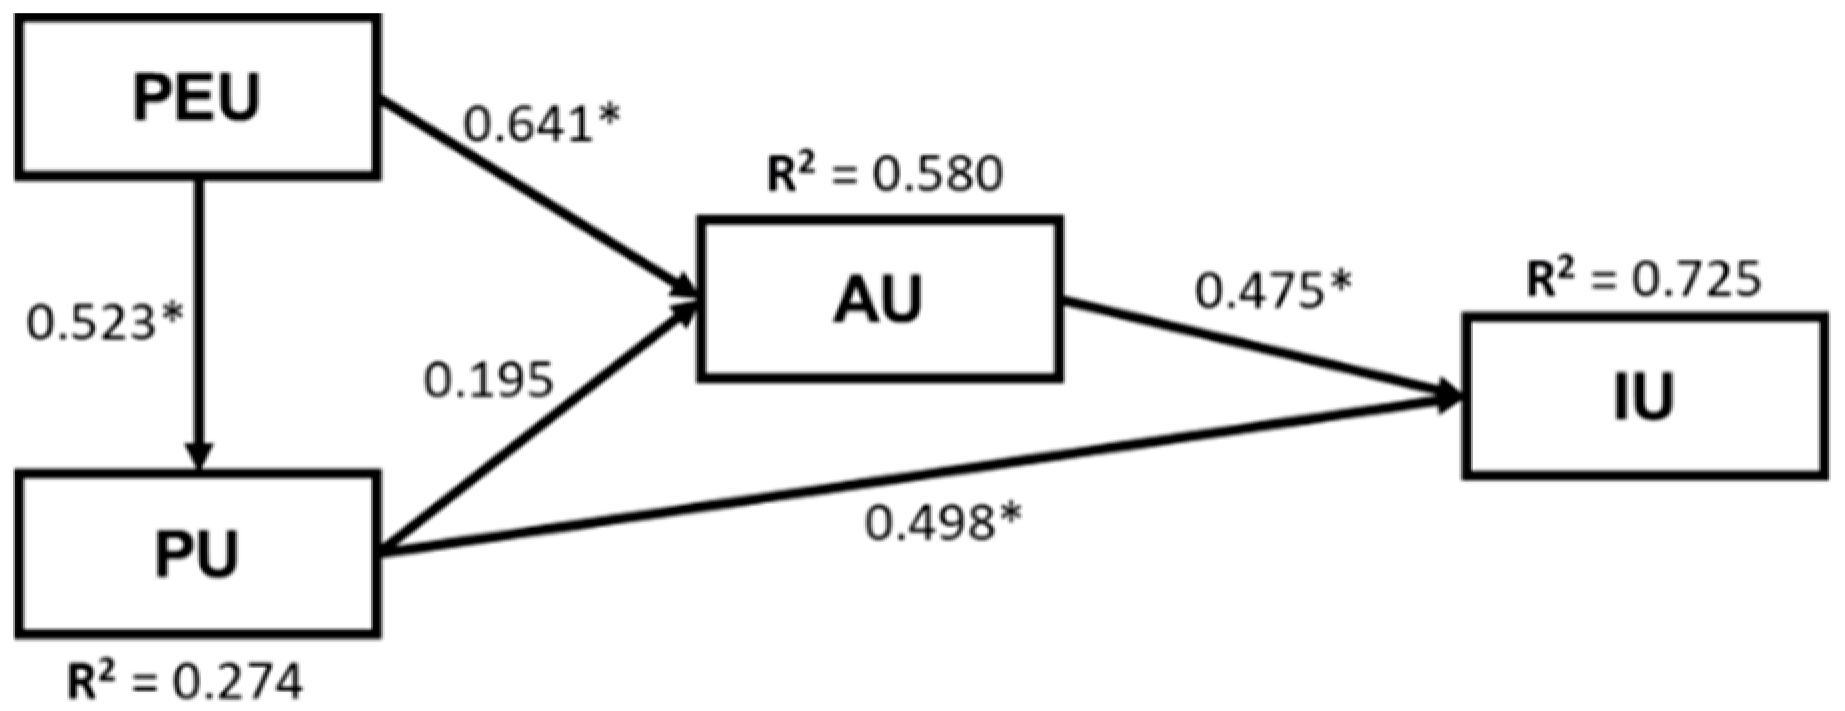
| H11 | PU | PEU | 0.523 ** | 0.0001 |
| H12 | AU | PEU | 0.743 ** | 0.0001 |
| H13 | PU | 0.531 ** | 0.0001 | |
| H14 | IU | AU | 0.740 ** | 0.0001 |
| H15 | PU | 0.750 ** | 0.0001 |
| Coefficients | ||||||||
|---|---|---|---|---|---|---|---|---|
| Model | B | Std. Error | Beta | t | Sig | R2 | Collinearity Statistics | |
| Tolerance | VIF | |||||||
| (Constant) | 7.870 | 2.807 | 2.804 | 0.007 | 0.274 | |||
| PEU | 0.557 | 0.128 | 0.523 | 4.344 | 0.000 * | 1.000 | 1.000 | |
| Coefficients | ||||||||
|---|---|---|---|---|---|---|---|---|
| Model | B | Std. Error | Beta | t | Sig | R2 | Collinearity Statistics | |
| Tolerance | VIF | |||||||
| (Constant) | 5.282 | 1.541 | 3.429 | 0.001 | 0.580 | |||
| PEU | 0.452 | 0.077 | 0.641 | 5.895 | 0.000 * | 0.726 | 1.377 | |
| PU | 0.130 | 0.072 | 0.195 | 1.795 | 0.079 | 0.726 | 1.377 | |
| Coefficients | ||||||||
|---|---|---|---|---|---|---|---|---|
| Model | B | Std. Error | Beta | t | Sig | R2 | Collinearity Statistics | |
| Tolerance | VIF | |||||||
| (Constant) | −3.418 | 1.879 | −1.819 | 0.075 | 0.725 | |||
| AU | 0.649 | 0.121 | 0.475 | 5.384 | 0.000 * | 0.718 | 1.392 | |
| PU | 0.451 | 0.080 | 0.498 | 5.640 | 0.000 * | 0.718 | 1.392 | |
Publisher’s Note: MDPI stays neutral with regard to jurisdictional claims in published maps and institutional affiliations. |
© 2022 by the author. Licensee MDPI, Basel, Switzerland. This article is an open access article distributed under the terms and conditions of the Creative Commons Attribution (CC BY) license (https://creativecommons.org/licenses/by/4.0/).
Share and Cite
Al-Abdullatif, A.M. Towards Digitalization in Early Childhood Education: Pre-Service Teachers’ Acceptance of Using Digital Storytelling, Comics, and Infographics in Saudi Arabia. Educ. Sci. 2022, 12, 702. https://doi.org/10.3390/educsci12100702
Al-Abdullatif AM. Towards Digitalization in Early Childhood Education: Pre-Service Teachers’ Acceptance of Using Digital Storytelling, Comics, and Infographics in Saudi Arabia. Education Sciences. 2022; 12(10):702. https://doi.org/10.3390/educsci12100702
Chicago/Turabian StyleAl-Abdullatif, Ahlam Mohammed. 2022. "Towards Digitalization in Early Childhood Education: Pre-Service Teachers’ Acceptance of Using Digital Storytelling, Comics, and Infographics in Saudi Arabia" Education Sciences 12, no. 10: 702. https://doi.org/10.3390/educsci12100702