Article

The Impact of Teacher Quality on Student Motivation, Achievement, and Persistence in Science and Mathematics

by
Adem Ekmekci
1,* and
Danya Marie Serrano
2
1
Rice University School Mathematics Project (RUSMP), Rice University, Houston, TX 77005, USA
2
Department of Psychology, University of Houston-Downtown, Houston, TX 77002, USA
*
Author to whom correspondence should be addressed.
Educ. Sci. 2022, 12(10), 649; https://doi.org/10.3390/educsci12100649
Submission received: 18 August 2022 / Revised: 12 September 2022 / Accepted: 22 September 2022 / Published: 26 September 2022

Abstract

:
Science, technology, engineering and mathematics (STEM) fields occupy a significant role in human prosperity and advancement. This study explores the factors affecting student STEM outcomes. Traditionally, the associations of students’ own motivational or cognitive inputs to their STEM career outcomes have been investigated before. Similarly, association of teacher quality to student achievement outcomes have been made before. This paper presents a novel approach by introducing teacher quality as the contextual factor within the social cognitive career theoretical (SCCT) model using a comprehensive and robust model for teacher quality including teachers’ motivation, qualifications, and self-reported practices. This study examines the extent to which high school students’ mathematics and science teachers’ beliefs, professional background, and instructional practices relate to students’ motivation, achievement, and future career plans in STEM using a nationally representative, large dataset: High School Longitudinal Study 2009. The results indicate that science and mathematics teachers’ professional background, motivational beliefs, and self-reported instructional practices have significant impact on students’ motivation, persistence, and achievement outcomes in science and mathematics. No direct impact of teacher factors on STEM career plans are found; however, students motivational and achievement outcomes (impacted by teacher factors) do have significant impact on students’ career plans in STEM.

1. Introduction

The significant role of science, technology, engineering, and mathematics (STEM) in human advancement and in maintaining a competitive spot in an increasingly global economy has been historically and widely recognized [1,2,3,4,5,6,7]. However, the last decade has seen a serious shortage within the STEM workforce: projections indicate the need for approximately one million more STEM professionals than the U.S. expects to produce by 2022 [5]. Another important finding comes from the U.S. Department of Commerce based on the data produced by the U.S. Census Bureau and the Bureau of Labor Statistics: STEM jobs are expected to grow by 8% from 2019 to 2029 while this figure is around 3.4% for non-STEM jobs [8]. One of the recommendations President’s Council of Advisors on Science and Technology (PCAST) made to help close the gap in supply–demand is to “encourage partnerships among stakeholders to diversify pathways to STEM careers” [5] (p. 38) and to increase the number of summer STEM learning programs for pre-college students. Moreover, in its latest report, PCAST strongly recommends bringing millions of Americans from non-technical backgrounds into STEM jobs by 2025 [6].
The significance of STEM fields and the critical need to increase those entering the STEM workforce has accelerated the push to attract more students into STEM fields, especially those who are from underrepresented populations in STEM [9,10,11]. An effective way to attract more students is to increase students’ interest and achievement in the STEM subjects [1,4,12]. A myriad of research studies has been conducted to understand the factors that predict students’ motivational, achievement, and behavioral outcomes in STEM subjects. Most of the research in this area, however, is based on postsecondary factors such as retention and persistence factors in college, e.g., [13,14,15,16]. Not to underestimate college level experiences as predictors of occupational choices given its imminence to life after college; however, pre-college experiences should not be overlooked. Some researchers argue that focusing on retention and persistence in STEM subjects in college is a low-cost and fast way to meet the demands to increase those entering the STEM workforce [13]. However, since previous research studies indicate that pre-college experiences and academic preparation are positively associated with pursuing STEM degrees in post-secondary education, it is plausible to argue that pre-college motivation and achievement in STEM have an influence on students’ future career choices.
Indeed, several research studies indicate that environmental experiences during early adolescence have a greater influence on students’ future education and career path than their experiences during late adolescence, e.g., [17,18,19,20]. For example, the impact K-12 teachers have on students’ academic outcomes is critical, e.g., [21,22,23,24,25,26]. Still, little research has focused on the impact that both math and science high school teachers have on their students’ motivational beliefs, achievement-related outcomes, and future career expectations in STEM, especially among underrepresented minoritized students (URMs) in STEM. In addition, studies investigating STEM choices of students are mostly limited by two factors: (a) cross-sectional designs, and (b) data collected from only one entity [27]. This study fills this void in research by exploring the impact of factors related to math and science teacher quality on student STEM outcomes and by using a nationally representative large-scale data set: the High School Longitudinal Study of 2009 (HSLS:09).
HSLS:09 is designed and executed by the National Center for Education Statistics (NCES). The NCES large-scale studies “address high-priority education data needs; provide consistent, reliable, complete, and accurate indicators of education status and trends; and report timely, useful, and high-quality data to education policymakers, practitioners, researchers, and the general public” [28] (p. iii). Specifically, HSLS:09 addresses many crucial issues pertinent to the transition from high school to postsecondary education and beyond [29,30] with a special emphasis on exploring the pathway leading students to persist in STEM courses and contemplate about careers in STEM fields, a topic of high priority due to its key role in economy, technology, and defense. Moreover, HSLS:09 is one of the very few studies that include teacher data connected to students’ achievement and motivation outcomes.

2. Theoretical Frameworks

This study is guided by two theoretical frameworks. The first one is Lent et al.’s [31] social cognitive career theory (SCCT) for students. The second one is Goe’s [22] teacher quality framework (TQF) and involves teacher level factors. The two frameworks are integrated to explore the degree to which factors central to each theory relate to students’ STEM outcomes including future career plans in STEM. We argue that a strong connection between SCCT and TQF appears when teachers are considered as contextual factors within the SCCT framework based on the findings of Hattie [32] and Hattie et al. [33]. This study is guided by this argument, which serves as the foundation for our conceptual framework. We will elaborate on this argument by expanding on the two frameworks below.

2.1. Social Cognitive Career Theory (SCCT)

SCCT builds on Bandura’s [34] social cognitive theory by suggesting that students’ career choices are influenced by their beliefs that develop through the intertwined interaction among three types of factors: personal factors, behavioral factors, and environmental or contextual factors [31,35,36]. Perhaps the most influential personal factors for career decisions relate to students’ motivational beliefs that include constructs such as self-efficacy (personal capability), intrinsic value (interest, enjoyment), and outcome expectations—likely consequences of particular actions [37]. These motivational constructs can also reconcile the influence of other factors on future career choice and decisions [36,38]. People’s behavior and actions can also be impacted by the extent to which they find certain academic disciplines valuable or useful (utility value [32]). Empirical research has documented the positive impact of motivation on students’ long-term engagement in STEM subjects. For example, students’ levels of STEM motivation (e.g., self-efficacy, outcome expectations) are positively associated with their persistence in STEM fields, e.g., [39,40].
SCCT also highlights several contextual factors including school and home environments that have an impact on career aspirations and choices [36,41]. While SCCT researchers propose that these contextual factors influence students’ learning experiences, this theory focuses on learning experiences that are sources of self-efficacy such as perceptions of past performance and vicarious learning experiences [42] and does not particularly focus on the role of teachers as a facet of students’ learning experiences within the theory. Previous research indicates that several contextual agents, including parents and teachers, influence students’ academic and career-related outcomes. However, teachers have been found to be the most significant contextual factor impacting student achievement [32,33]. Therefore, we argue that TQF complements SCCT by broadening its notion of learning experiences by including a more specific understanding of the teacher quality. More specifically, teachers’ characteristics, qualifications, and practices that inherently influence students’ learning experiences that has a weight in formation of their STEM choice. Therefore, teachers affect not only students’ psychological and cognitive outcomes, but they can arguably impact students’ future STEM choices.

2.2. Teacher Quality Framework (TQF)

It is important to note the two traditions of research on teacher quality and effectiveness (for a review see [43]): the product-function (e.g., [44]), and between-teachers differences controlling for student background characteristics (e.g., [45]). The TQF [22] captures these two traditions and provides the most comprehensive framework to date. TQF is based on a review and synthesis of the research relating to the impact of teachers on student achievement-related outcomes. Inputs, processes, and outcomes are the three strands that constitutes the TQF framework. These three strands are distinctive but interconnected. Inputs consists of teacher qualifications and characteristics. Used as proxies for teacher quality, teacher qualifications include factors related to teachers’ professional background [46,47,48,49]. More specifically, researchers often include post-secondary coursework or degrees, type of teacher preparation and/or certification, teaching experience, and professional development [20,23,48,50,51,52,53]. TQF also recognizes other teacher attributes (soft skills) as part of teacher quality. These attributes include subjective discernments and organizational critical thinking and organizational skills. Moreover, beliefs and attitudes including self-efficacy, epistemic beliefs, and other beliefs in teaching and learning are also part these teacher soft attributes [48,54]. The processes strand of the TQF basically encompasses factors related to teacher practices. In essence, this means what teachers enact in the classroom and relates to instructional practices and classroom management. For example, the emphasis placed on specific topics, questioning strategies, teacher interactions with students and with other colleagues outside of the classroom, school contextual interactions, and planning are all part of processes [22].
This study focuses on the first two strands of TQF: inputs (teacher characteristics and qualifications) and processes (teacher practices). The reason for excluding outcomes is that it emphasizes the attribution of teacher effectiveness to students’ achievement test scores mostly assessed by value-added models [55,56]. Value-added models are a product of political agendas and have been criticized by a wide range of audiences (i.e., researchers, practitioners, parents, policy makers, and school administrators [57,58,59,60,61].

3. A Brief Review of Current Literature

3.1. Student Factors and Student STEM Outcomes

There are fewer research studies examining pre-college students’ plans to join the STEM fields compared to those at the postsecondary level. The focus on college-level coursework, grades, and professors in understanding STEM majors and career choices does not take pre-college factors into consideration despite the crucial role these early-age factors may have on post-secondary STEM choices [15]. This is perhaps because of the proximity of college years to job life. However, Maltese and Tai [62] found that many students who pursued or finished a post-secondary STEM degree made that choice during high school years. Research on high school students’ STEM persistence has documented several student-level factors associated with the outcomes: (a) sex and race/ethnicity [63,64], (b) math and science achievement [24,39,65], (c) availability and accessibility of AP STEM courses [66,67], (d) extracurricular STEM activity participation [19,68], (e) interaction with successful peers [67,69], and (f) high levels of self-efficacy, value, and interest [37,39].
As this brief synthesis points, quite several studies did focus on elementary and secondary student’s STEM outcomes. Only a handful of these, however, investigated STEM expectancies of students after college (e.g., [70]). The most salient research on STEM persistence investigating the impact of pre-college factors focused on student factors such as motivation, attainment, and achievement in high school mathematics and science courses (e.g., [71]). The effects of these motivational and behavioral factors on students’ contemplation about pursuing STEM fields (planning to choose a STEM major in college or participate in the STEM workforce) have been investigated to a lesser extent (e.g., [35,70]).
This is particularly problematic because middle school and high school are crucial times for developing expectancies to succeed and get interested in STEM fields [20,62,72]. Therefore, while controlling for students’ demographic background (personal characteristics) and motivational beliefs in high school that may form their future STEM career choice, this study aims to determine whether teachers have a role in students’ STEM outcomes including their STEM career plans.

3.2. Teacher Factors and Student STEM Outcomes

No research identified to date has investigated teacher-related factors on students’ future career plans in STEM. This is also problematic given that teacher qualifications relate to student motivational and achievement outcomes [73] and that teachers can be considered as part of the contextual impact on student outcomes within the SCCT framework [32]. As matter of fact, teachers have been found to be the most impactful contextual (external) factor on student outcomes in a meta-analysis of more than 60,000 research papers [33]. This meta-analysis included international studies regarding the impact of hundreds of interventions on students internationally. The study revealed that teacher-related factors were the strongest predictors of student learning among environmental factors including peers, principals, other school factors, and home environment.
When looked at individual studies, a plethora of studies reported the impact of teacher factors on student achievement and motivation. More specifically, teachers’ educational background (e.g., in- or out-of-field teaching) and other teacher attributes have significant associations with student outcomes [47,74]. Certified teachers had a positive impact on student outcomes when compared to uncertified teachers [75] (cf. [55]). There is evidence for the strong associations of teachers’ specialized content knowledge for teaching and their educational beliefs about teaching (which are part of teacher qualifications) to their instructional planning, decision-making, and practices [76,77]. Coupling this with the evidence that instructional practices naturally have direct impact on student outcomes [49], it is evident that teacher qualifications directly relate to student outcome. Moreover, this connection may be amplified for underrepresented minoritized students (URMs) in STEM [78,79].
To sum up, factors believed to be associated with highly qualified teachers strongly relate to student outcomes (e.g., [80,81]), one of the main goals of this study was to investigate the extent to which specific teacher-related factors (often explored in a limited way) at the high school level contribute to students’ science and mathematics outcomes including their future choices for STEM careers. Moreover, these minimally explored teacher factors and their impact on students were usually explored disjointedly (e.g., only professional background factors but not in conjunction with teacher beliefs or practices). This study investigated different dimensions of teacher quality including several teacher-related factors collectively and concurrently unlike the previous research.

3.3. Limitations of the Extant Literature

This study fills the gap in previous research in many ways. First, HSLS:09 is a more recent (compared to the most longitudinal studies) and ongoing data set that has not yet been extensively explored, especially with regard to teacher factors. Second, given the vital role that the information collected by NCES in this large-scale database may have on our education system and policies, as explained above, this study provides new insights about the nexus of teacher quality and student STEM motivation, achievement, and choice. Third, while a myriad of studies has examined the relation between inputs (i.e., teacher qualifications and teacher characteristics) and processes (i.e., teacher practices) as introduced by Goe [22], the relation between teacher quality and student outcomes has been investigated to a lesser extent.
Lastly, the extant literature linking teacher factors to student outcomes has focused only on a small number of teacher-level predictors. For example, Darling-Hammond [21] has only investigated a few teacher attributes (i.e., subject matter knowledge, specialized content knowledge for teaching, experience, and certification) and the degree to which they relate to student achievement-related outcomes. Similarly, Rice [49] and Stewart et al. [80] considered only years of teaching experience, teacher preparation and certification routes, and coursework in the content area of teaching as predictors of student achievement.
Therefore, this study extends STEM education research by (a) looking at several dimensions of teacher factors (characteristics, qualifications, and practices) collectively and simultaneously, this study provides better insights into the teacher factor as it relates to high school students’ STEM outcomes and (b) integrating the TQF and SCCT framework to explore students’ STEM outcomes—not only achievement outcomes but all of achievement, motivation, and choice outcomes simultaneously. This TQF and SCCT integration may also serve as a model for future research.

4. Research Questions

Based on the theoretical frameworks (SCCT and TQF), the following research questions (RQ) are sought to be answered through this study:
  • To what extent do math and science teacher quality factors relate to high school students’ motivational beliefs (i.e., self-efficacy, utility, interest) for STEM?
  • To what extent do math and science teacher quality factors relate to high school students’ STEM achievement and persistence (i.e., advanced course-taking, mathematics test performance)?
  • To what extent do math and science teacher quality factors relate to high school students’ career plans in STEM while controlling for students’ motivational beliefs and achievement in STEM?

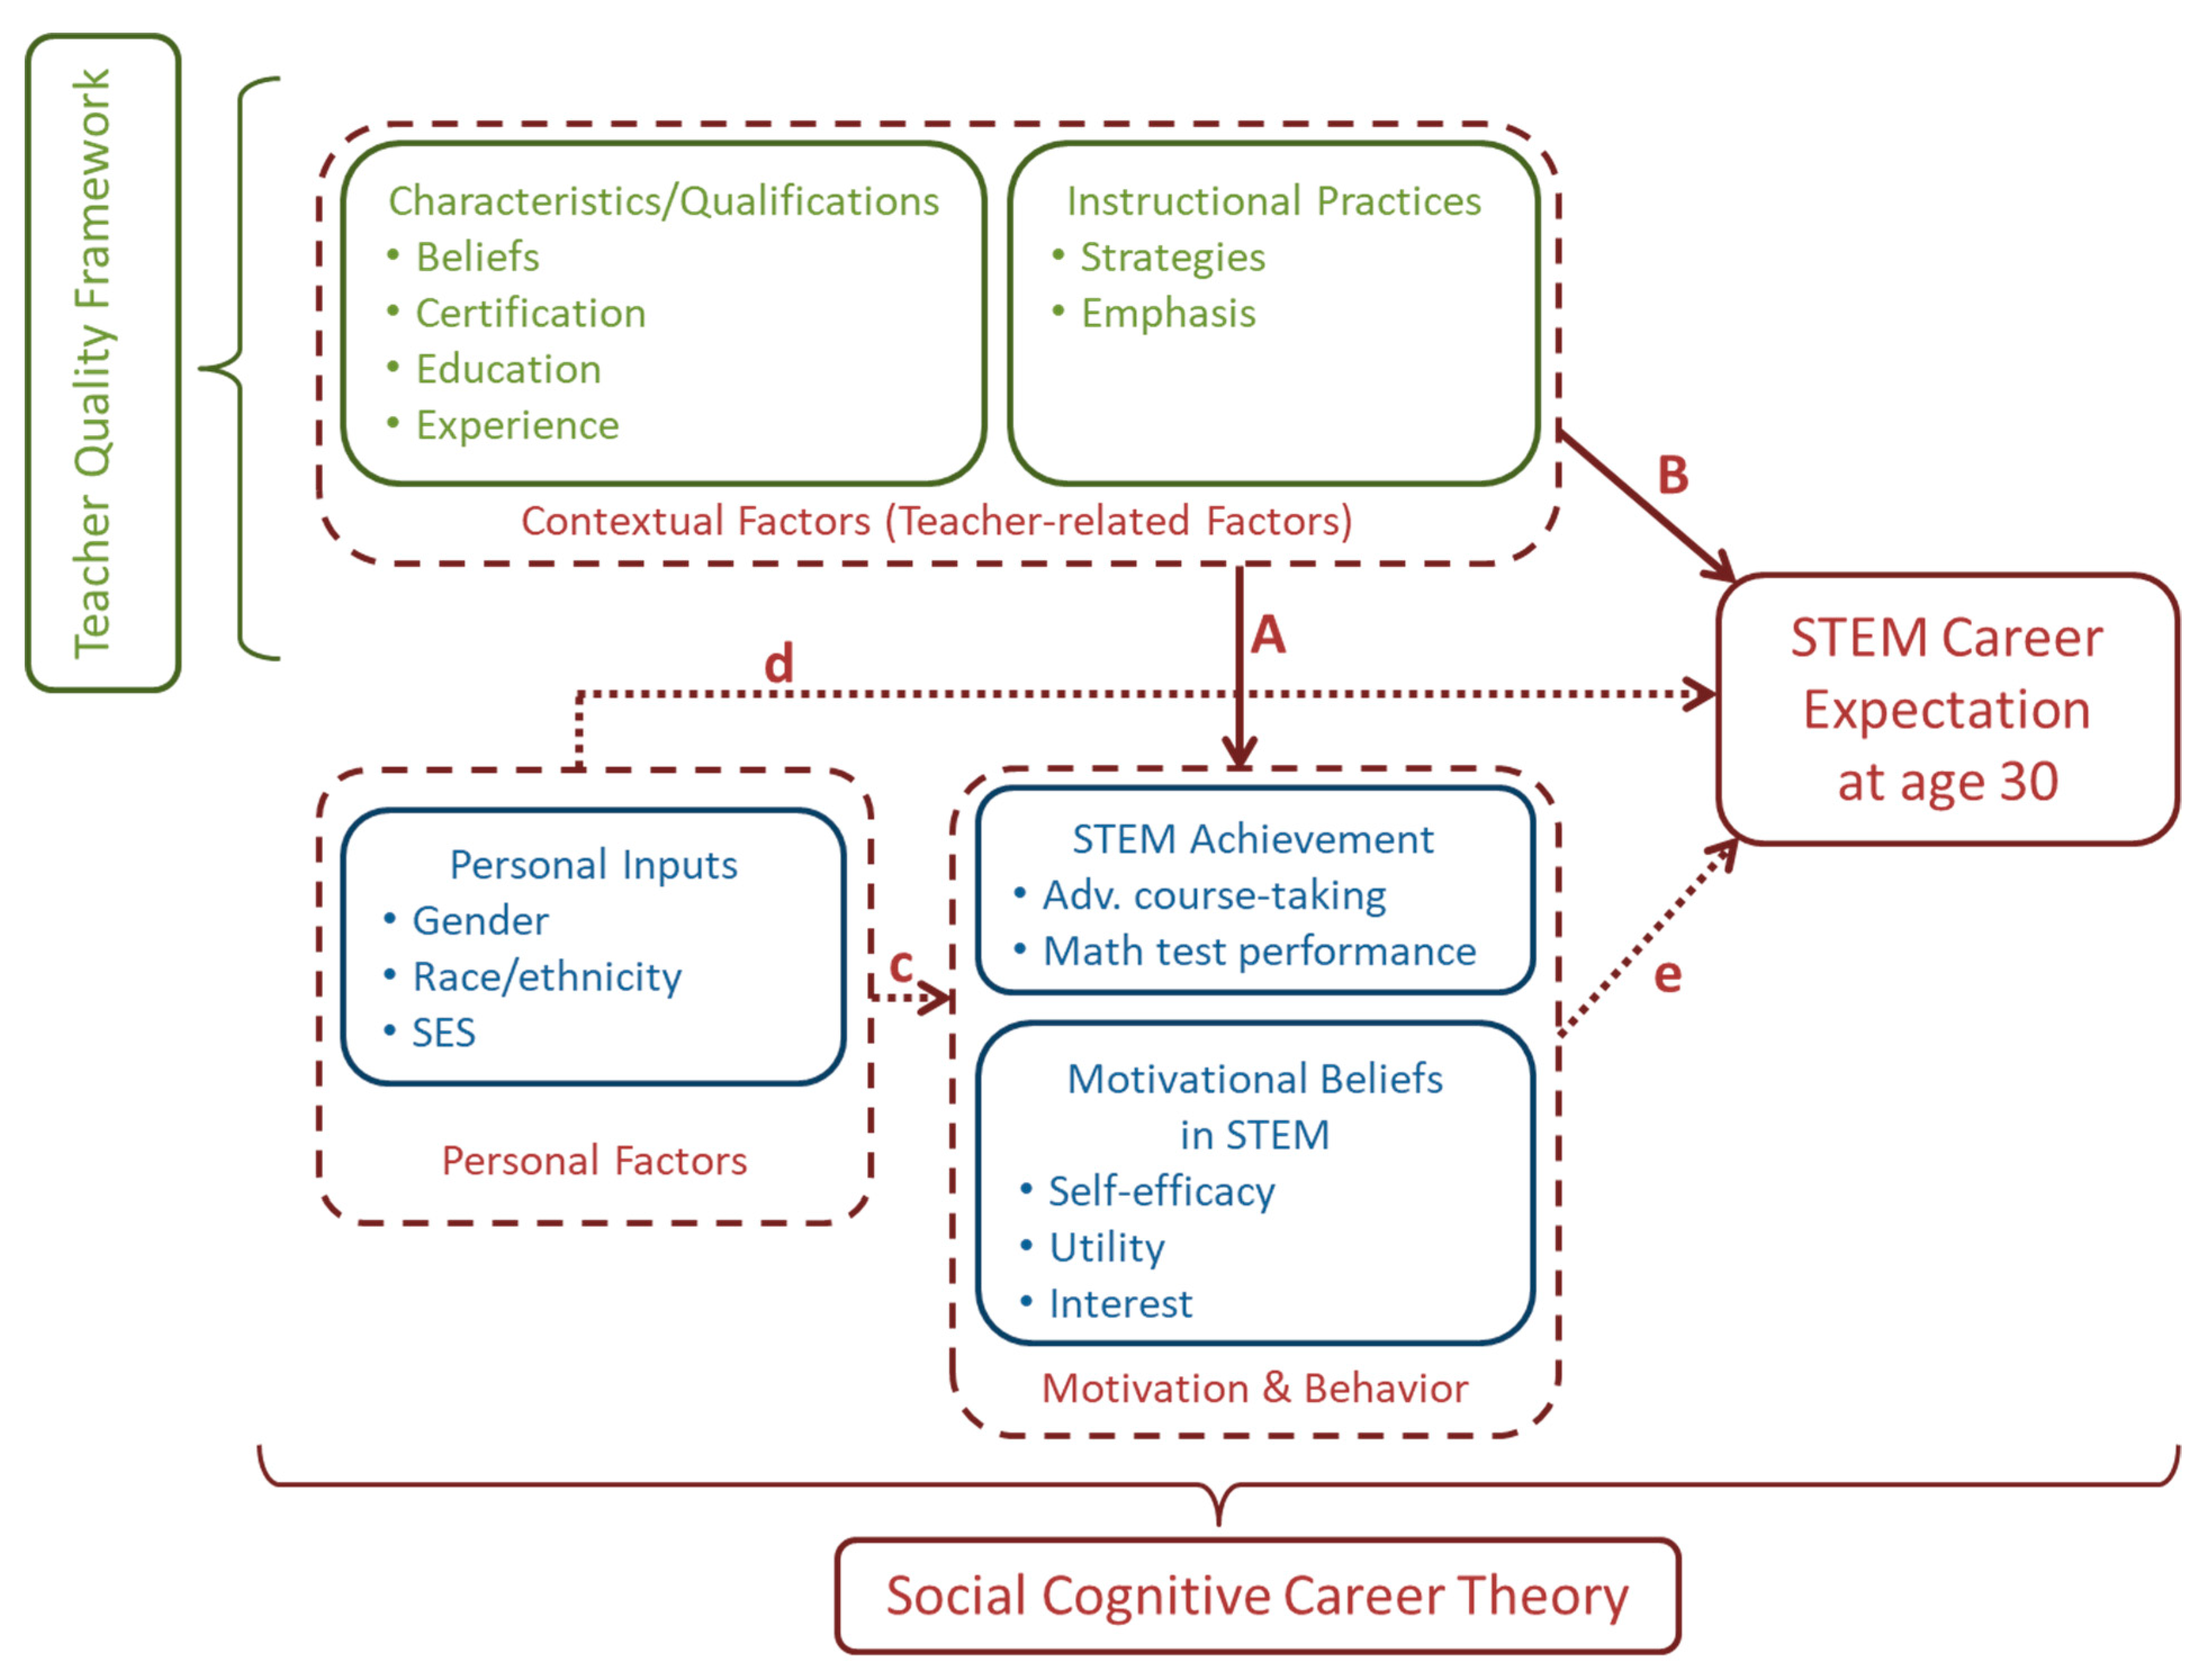
5. Conceptual Framework for the Study

Guided by the two well-grounded theories presented above and prior research on student motivation and achievement and teacher quality, we utilized a large-scale data set for this study to examine the relation between teacher quality and high school student persistence in STEM.
The framework in Figure 1 represents the conceptual model for this study. The components colored in dark red represent the dimensions of SCCT (i.e., contextual factors, personal factors, and motivation and behavior); dark green represents teacher factors (teacher characteristics, qualifications, and instructional practices) as contextual factors within SCCT, which essentially represent TQF; and dark blue represents specific student-level factors (personal inputs, STEM achievement, motivational beliefs about math and science). Solid arrows (A and B) correspond to the main relations in the research questions. There is only one solid arrow from Contextual Factors to Motivation & Behavior (A), but it corresponds to two research questions: RQ1 (achievement outcomes) and RQ2 (motivational outcomes). The solid arrow B corresponds to RQ3. The dashed arrows (c, d, and e) represent theoretically sound connections that are included as control variables for the main effects (which are represented by the solid arrows). The following path outlines the connection between the research questions and the conceptual framework: RQ1 → A and c; RQ2 → A and c; and RQ3 → B, d, and e.

6. Methodology

6.1. Data Set

HSLS:09 data set contains more than 23,000 ninth grade students as of 2009. This data set consists of demographic information and survey responses from nationally representative students in both public and private schools in the 50 states and D.C. In addition, data were collected from these students’ parents, teachers, counselors, and other school administrators. The goal of HSLS:09 is to explore high school students’ STEM career trajectories starting from ninth grade all the way to postsecondary education and beyond [29]. Beginning with a ninth-grade cohort in 2009, NCES has been collecting the HSLS:09 data for researchers to study how incoming ninth graders decide to enroll in crucial early math and science courses. These math and science courses are claimed to affect students’ future coursework necessary for STEM careers. Of particular interest is to develop a better understanding the extent of how several factors (e.g., school-related, teacher-related, parental, and academic and motivational student-level) relate to high school experiences in STEM and postsecondary plans [30]. There have been five cycles of data collection in HSLS:09 so far: (a) base year (BY; fall 2009); (b) first follow-up (F1; spring 2012), (c) 2013 update (U13; summer and fall 2013) and high school transcript data (HS; fall 2013–spring 2014), (d) second follow-up (F2; 2016); and (e) post-secondary education transcripts (SR; 2017–2018). The current study included the data from the first four cycles since the variables of interest (i.e., ninth grade teacher variables, student math and science achievement and motivation in high-school, and STEM career plans at the age of 30) only apply to those cycles.
The sample for this study included the entire sample of HSLS:09 students. We included student-level variables relating to students’ personal background, academic outcomes in math and science, attitudes towards STEM subjects, and career plans in STEM. Teacher-level variables in this study included math and science teachers’ qualifications and characteristics (e.g., certification, years of teaching, beliefs) and practices (i.e., emphasis in certain instructional practices).

6.2. Measures

6.2.1. Student Variables

Demographic information of students includes sex (binary), race/ethnicity (African American, Asian, Hispanic—all binary with White as the reference group), and socioeconomic status (SES) [29]. SES is a continuous variable and a composite of several indicators). This data is unique across all data collection cycles. Student motivational factors in math and science (self-efficacy, utility, and interest) are all continuous variables. These motivational factors calculated based on scales comprising several Likert-scale items related to each motivational area (see [29] for results of validity and reliability analysis for these subscales). Mathematics achievement is a continuous variable and represented by a standardized theta score for a test administered to all student participants. Student achievement and motivation data included in this study were retrieved from the F1 cycle (when students were in 11th grade in 2011). The other achievement-related student outcomes were advanced course-taking in science and mathematics. Advanced course-taking data is retrieved from U13 and HS cycles (collected in 2013 and 2014, respectively). Advanced course taking in science and math (two variables) were created using a binary code of 1 if a student took any IB, AP, or dual credit course(s) in the subject matter and 0 if none were taken. The last student variable is the STEM career variable: STEM career expectation at the age of 30 years old. STEM career expectation variable was last collected in the F2 cycle when regular track students were in their second year in college.

6.2.2. Teacher Variables

All teacher-related data were pulled from the BY cycle (ninth grade) and included students’ ninth grade math and science teachers’ professional background. The teacher data included high school teaching experience in the subject (years—continuous), teaching certification in math and science (binary—alternative vs. standard), teaching self-efficacy (continuous composite), and math and science degrees (binary—undergrad/graduate degree(s) in the teaching area vs. none). In addition, two teaching practice variables were obtained to include in the study. For mathematics, the first variable is math teachers’ emphasis on developing students’ conceptual understanding of mathematics (understand). The second math teaching practice variable is connect and relates to how much weight teachers put on developing students’ interest and utility value in math. Similarly for science, the first teaching practice variable is inquiry, which relates to practices focusing on inquiry skills in science classes. The second science teaching variable is connect as well and relates to practices that develop connections between science and the real-world (science connection). These two variables in each of the math and science domains emerged by conducting a factor analysis on several self-reported Likert-scale teacher practice items. These items asked teachers about how much emphasis they placed on specific instructional practices. For example, “math teacher’s emphasis on developing students’ problem-solving skills” and on “math concepts” (as opposed to on math algorithms) in their fall 2009 math course (math understand) and “science teacher’s emphasis on science process/inquiry skills” in their fall 2009 science course (science inquiry). The process for extracting these variables is explained in detail in the next section.

6.2.3. Dimension Reduction for Teaching Practices

The data set includes 14 variables related to mathematics teacher practices and 11 variables related to science teacher practices. These variables ask how much emphasis teachers put in certain instructional practices such as emphasis on connecting mathematical ideas and emphasis on evaluating arguments based on evidence. Teachers responded to these questions on a three-point Likert-scale (no/minimal emphasis; moderate emphasis; and heavy emphasis). Principal component analyses (PCA) were employed to create teacher practice variables with Varimax rotation. For mathematics teaching practices, four items did not load onto any factors significantly with no more than 0.15 factor loading for any one factor (see Table 1 for factor loadings). These items related to putting emphasis on algorithms/procedures, computational skills, speedy/accurate computations, and standardized test preparation. The six items that significantly loaded onto one factor were: (a) teaching math concepts, (b), developing problem solving skills, (c) reasoning mathematically, (d) connecting math ideas, (e) preparation for further math study, and (f) logical structure of mathematics. This first factor is named mathematical understanding (math understand) and captured the practices geared towards conceptual understanding in mathematics [82]. The second set of items that significantly loaded onto a different factor were about: (a) the history and nature of math, (b) increasing students’ interest in math, (c), the business/industry applications of math, and (d) effectively explaining math ideas. This second factor is named as teaching practices for mathematical connections (math connect) signifying the connections of school mathematics to the real-world [82,83]. Therefore, two factors emerged from the PCA of mathematics teaching practices: “math understand” and “math connect.”
For science teaching practices three items did not load onto any factor significantly having no more than a 0.15 factor loading value for any one factor (see Table 2 for factor loadings). These variables are related to teaching basic science facts, important science terms, and standardized test preparation. The four items that significantly load onto one factor are about: (a) science process/inquiry skills, (b) preparation for further science study, (c) evaluating arguments based on evidence, and (d) effectively communicating science ideas. This factor, entitled “science inquiry,” represent science teaching practices focusing on inquiry and communication skills [84,85]. The remaining four variables load onto the second factor were related to: (a) business/industry applications of science, (b) relationship between science, technology, and society, (c) history/nature of science, and (d) increasing students’ interest in science. This second factor is labeled as teaching practices for science connections (science connect) that means developing connections between science and the real-world [17,84]. Thus, two factors were created for science teaching practices and were labeled “science inquiry” and “science connect.”

6.3. Analytic Techniques

The goal of this study was to investigate the role that teacher factors (after controlling for student-level individual and behavioral factors) have on students’ STEM outcomes including their career plans in STEM. Conducting this investigation is a two-phase process. First, we wanted to understand how teacher-related factors related to students’ beliefs and behaviors related to STEM (i.e., their motivation and course enrollment; RQs 1–2) controlling for student characteristics. This first step (RQs 1–2) involved multiple regression analyses with several outcomes (logistic regression was used when the outcome variable was binary). Then, in the second phase, we examined the degree to which teacher-related factors were predictive of students’ STEM career plans beyond the students-level factors incorporated in the previous steps (RQ3). STEM career plans were operationalized as a binary variable indicating whether students plan to have an occupation in STEM at the age of 30. Therefore, the second phase (RQ3) included one binary outcome and required two logistic regression analyses: one for math predictors and the other for science predictors.
Multiple regression and logistic regression models are built to assess the effects of both teacher and student factors on persistence in mathematics and science as students progress through high school and beyond. For logistic regression outcomes, the odds ratios are reported in hopes to provide readers with a better understanding of the effect size for each independent variable’s impact on a binary outcome.
For regression results to present a meaningful interpretation, the complex sampling design of HSLS:09 needs to be understood and accounted for in statistical analyses by integration of weights. The use of weights and design effects is necessary in these data sets with complex designs to properly calculate standard error terms for each variable [28,30]. In essence, this integration in a study sample allows a researcher to generalize the findings resulting from statistical analyses to a wider range of the population. In HSLS:09 context this would mean the whole high school students in the U.S. Moreover, this integration is a crucial step in forming causal hypotheses and developing inferences. Use of the sample weights and design effect adjustments allows for a correction to be made in the standard errors, which then produces accurate significance calculations. Data was analyzed using STATA 12, which could produce proper estimates using sampling weights [86].
More specifically, analytical weights, to account for complex, two-stage sample design, and their corresponding balanced repeated replication (BRR) weights, for variance estimation, were incorporated in the analyses [28]. For example, to answer RQ1, student data from the F1 cycle and teacher data from the BY cycle were needed. In this case, W2W1STU longitudinal analytical weight is used as the stratified multi-stage sampling weight (svyet [pweight = W2W1STU) as well as its corresponding 200 BRR weights (brrweight (W2W1STU*)).

7. Results

Research Question 1:
To what extent do math and science teacher quality factors relate to high school students’ motivational beliefs (i.e., self-efficacy, utility, interest) for STEM?
To answer this research question, we conducted multiple regression analyses with six different continuous outcomes (three per each subject—math and science); teacher level factors as key predictors; and control variables (student demographics and previous measures [Y1] on the relevant outcome). The set of outcomes is: Y2 = {“Math self-efficacy”, “Math utility”, “Math interest”, “Science self-efficacy”, “Science utility”, “Science interest”} where “2” denotes the time point 2 (first follow up; vs. “1” denoting the time point 1 [BY]). These motivational beliefs are selected as outcomes in this part of analysis because we know from previous research that they are predictors of students’ STEM persistence in the context of SCCT (see [36]). The domain of each outcome variable aligns with the domain of the teacher predictor variables for each analysis model (e.g., math teacher factors predicting math related outcomes).
The regression analyses that were conducted are represented by the equation below. Student-level factors are colored in blue (terms whose coefficients are from β1 through β6); and teacher-level factors are colored in green (terms whose coefficients are from β8 through β12). Teacher degree implies whether a science teacher has a degree in science or a math teacher has a degree in mathematics. Teacher practice 1 and 2 correspond to understand and connection for math teachers and inquiry and connection for science teachers, respectively.
Y 2 i = β 0 + β 1 ( Y 1 ) i + β 2 ( M a l e ) i + β 3 ( B l a c k ) i + β 4 ( H i s p a n i c ) i + β 5 ( A s i a n ) i + β 6 ( S E S ) i
+ β 7 ( T e a h c e r   s e l f e f f i c a c y ) i + β 8 ( T e a c h e r C e r t i f i c a t i o n ) i
+ β 9 ( T e a c h e r D e g r e e ) i + β 10 ( T e a h c e r E x p e r i e n c e ) i + β 11 ( T e a c h e r P r a c t i c e 1 ) i
+ β 12 ( T e a c h e r P r a c t i c e 2 ) i + ε i
Table 3 presents multiple linear regression analyses results for the motivational variables pertaining to math and science.
In all the linear regression analyses, we controlled for personal student demographic variables as accessed during their ninth grade in high school, which included students’ sex, racial/ethnic identity, and socioeconomic status. The teacher characteristics entered in the models included their qualifications and instructional practices. All six hierarchical linear regression analyses (three for math and three for science) produced statistically significant results. For the regression model for students’ 10th grade math self-efficacy as the outcome (F(11, 8522) = 33.46, R2 = 0.04), their ninth-grade math teachers’ self-efficacy (β = 0.03, p < 0.01) and emphasis on conceptual understanding (math understand; β = 0.04, p < 0.01) emerged as significant predictors. For the regression model with students’ 10th grade utility value for math as the outcome, F(11, 8592) = 11.02, R2 = 0.01, the degree to which their ninth-grade mathematics teachers emphasized increasing students’ interest in math and connecting math real-life applications (connection; β = 0.03, p < 0.05), was a significant predictor. Finally, for the model with students’ 10th grade math interest as the outcome, F(11, 7352) = 19.87, R2 = 0.03, the teacher understand variable again emerged as a significant predictor (β = 0.03, p < 0.05). In sum, students who were taught by teachers that focused on connecting mathematics ideas and put more emphasis on developing problem-solving skills, mathematical reasoning, and conceptual understanding of mathematics, had higher levels of mathematics motivational beliefs at the end of 10th grade than those taught by teachers who did not focus on these areas.
For the multiple linear regression analyses pertaining to science, we again controlled for student demographic variables. Again, the science teacher characteristics entered in the model pertained to their qualifications pertaining to teaching science, and instructional practices which included science inquiry teaching practices (inquiry) and the extent to which science teachers developing connections between science and the real-world (connect). For the model where students’ science 10th grade self-efficacy regressed on student demographics and science teacher characteristics F(11, 7797) = 18.08, R2 = 0.02, science inquiry teaching practice was a significant predictor of students’ science self-efficacy (β = 0.03, p < 0.05). For the model where students’ science 10th grade utility value regressed on student demographics and science teacher characteristics F(11, 7906) = 17.60, R2 = 0.02, the connect variable emerged as a significant predictor of students’ science utility value (β = 0.03, p < 0.05). Finally, for the model where students’ science interest regressed on student demographics and science teacher characteristics F(11, 6232) = 5.91, R2 = 0.01, the only predictor that emerged was whether teachers had obtained a science degree (β = 0.03, p < 0.05).
Research Question 2:
To what extent do math and science teacher quality factors relate to high school students’ STEM achievement and persistence (i.e., advanced course-taking, mathematics test performance)?
The set of outcomes for RQ2 is: Y2 = {“Advances course-taking in math”, “Advanced course-taking in science”, “Mathematics performance in standardized test”}. There are no “Y1s” for these outcomes because they were only measured in the third data collection cycle (U13 and HS) at time point 2. The regression model for mathematics achievement is similar the model equation given in RQ1. Binary logistic regressions were used to predict the first two binary outcomes (1= students took any advanced level courses [AP/IB/dual credit] in math and science; 0 if not). The following equation represents the logistic regression model for advanced course-taking.
L o g i t ( Pr ( Y 2 i = 1 ) ) = δ i = β 0 + β 2 ( M a l e ) i + β 3 ( B l a c k ) i + β 4 ( H i s p a n i c ) i + β 5 ( A s i a n ) i
+ β 6 ( S E S ) i + β 7 ( T e a c h e r   s e l f   e f f i c a c y ) i
+ β 8 ( T e a c h e r C e r t i f i c a t i o n ) i + β 9 ( T e a c h e r D e g r e e ) i
+ β 10 ( T e a h c e r E x p e r i e n c e ) i + β 11 ( T e a c h e r P r a c t i c e 1 ) i
+ β 12 ( T e a c h e r P r a c t i c e 2 ) i + ε i
where Pr ( Y 2 i = 1 ) = e δ i 1 + e δ i .
As part of the second research question, a multiple linear regression analysis was conducted to predict students’ mathematics achievement in the 11th grade after controlling for student demographics (see Table 4). Again, the teacher characteristics entered in the models included their qualifications and instructional practices. This multiple linear regression model was statistically significant F(11, 8845) = 276.08, R2 = 0.26. Teacher qualifications such as whether math teachers had a math teacher certification (β = 0.03, p < 0.01) and their years of experience teaching math (β = 0.06, p < 0.001) were all statistically significant predictors of students’ math achievement. Moreover, the degree to which math teachers focused a deeper conceptual understanding of mathematics in their instruction emerged as the strongest significant predictor of math achievement (β = 0.14, p < 0.001). The connection variable, however, had a significant but negative association with students’ math achievement (β = −0.03, p < 0.01). This negative association was unexpected. Perhaps, there was a disconnect between the HSLS’ mathematics test and their relation to real-life contexts. Unfortunately, NCES keeps the items confidential for use in future; therefore, analysis of the test items to see if our explanation holds are not possible.
Two logistic regression analyses were conducted to predict advanced course-taking behavior (binary outcome): one in mathematics and one in science (see Table 5). The odds ratios are presented in results table to have a clear understanding of the effect size for regressing advanced course-taking on relevant factors. For an easier interpretation, the odds ratio values presented in the last column of Table 5 can be subtracted from 1 and multiplied by 100 to reach the odds percentages. The odds percentage results would then refer to the increment in the odds of advanced course-taking behavior resulted from every one-unit increase in a particular predictor on.
The results indicated that the degree to which math teachers emphasized a conceptual understanding of mathematics (math understand) was the strongest predictor of advanced math course-taking. More specifically, greater levels of emphasis in math understanding by ninth grade teachers increased the odds of their students to take advanced math courses in high school by 51%, when holding all other variables constant. Math teachers’ experience also increased the odds of their students to take advanced math courses in high school, though this effect was small (only 2%). Specifically, when holding all other variables constant, every one-unit increase (i.e., one year of teaching) in mathematics teaching experience was associated with 2% greater odds of their students taking advanced math courses in high school.
In terms of advanced science-course taking in high school whether students had a science teacher in ninth grade who had earned a science degree increased their odds of taking advanced science courses in high school by 15%. Science teaching experience also had a significant effect on students’ advanced science-course taking, albeit a small effect (only by 1%).
Research Question 3:
To what extent do math and science teacher quality factors relate to high school students’ career plans in STEM controlling for students’ motivational beliefs and achievement in STEM?
To answer the third research question, we conducted binary logistic regression analyses predicting students’ STEM career plans at age 30. Students reported these career plans after high school graduation. The outcome for RQ3 is students STEM career expectation at age 30—originally a categorical variable with two-digit ONET codes. We converted this variable to a binary outcome: 1 = Yes (STEM career); and 0 = No (non-STEM career) based on National Science Foundation’s categorization of science and engineering fields [4]. The logistics regression model for RQ3 is as follows:
L o g i t ( Pr ( STEM i = 1 ) ) = δ i = β 0 + β 1 ( M a l e ) i + β 2 ( B l a c k ) i + β 3 ( H i s p a n i c ) i + β 4 ( A s i a n ) i + β 5 ( S E S ) i + β 6 ( S e l f   e f f i c a c y ) i + β 7 ( I n t e r e s t ) i + β 8 ( T e s t a c h i e v e m e n t ) i + β 9 ( A d v   c o u r s e ) i + β 10 ( T e a c h e r   s e l f   e f f i c a c y ) i + β 11 ( T e a c h e r C e r t i f i c a t i o n ) i + β 12 ( T e a c h e r D e g r e e ) i + β 13 ( T e a h c e r E x p e r i e n c e ) i + β 14 ( T e a c h e r P r a c t i c e 1 ) i + β 15 ( T e a c h e r P r a c t i c e 2 ) i + ε i
where Pr ( STEM i = 1 ) = e δ i 1 + e δ i .
This logistics regression model is representative of two different models with the same outcome variable (i.e., STEM career expectations): model-1 (math predictors) and model-2 (science predictors). There was only one test-achievement predictor and that was of mathematics; therefore, it was only included in model-1 with mathematics predictors. In other words, the model-2 with science predictors did not include a test-achievement predictor.
In the first model (math predictors), we entered student demographic variables, but in this model, we entered students’ self-efficacy for math, interest in math, math achievement, and advanced math-course taking (see Table 6). In terms of teacher variables, we entered students’ ninth grade math teachers’ self-efficacy for teaching, teachers’ qualifications, and teachers’ instructional approaches. Results indicated that none of the ninth-grade math teacher variables significantly predicted students’ STEM career plans. However, everyone one-unit increase in students’ math achievement scores increased their odds of reporting planning to pursue a STEM career by 2%. Students’ math self-efficacy and interest in math were also associated with increased odds of planning to pursue a STEM career. Every one-unit increase in math self-efficacy increased students’ odds of planning to pursue a STEM career by 13% and every one-unit increase in math interest increased students’ odds of planning to pursue a STEM career by 21%.
Again, in the second model (science predictors), we entered the same student demographic variables as in previous models, students’ self-efficacy for science, interest in science, and advanced science-course taking were also entered. In terms of teacher variables, we entered students’ ninth grade science teachers’ self-efficacy for teaching, teachers’ qualifications, and teachers’ instructional approaches. Results indicated that none of the ninth-grade science teacher variables significantly predicted students’ STEM career plans. However, whether students took advanced courses in science increased their odds of reporting planning to pursue a STEM career by 59%. Students’ science self-efficacy and interest in science were also associated with increased odds of planning to pursue a STEM career. Every one-unit increase in science self-efficacy increased students’ odds of planning to pursue a STEM career by 16% and every one-unit increase in science interest increased students’ odds of planning to pursue a STEM career by 23%.

8. Discussion

National calls and reports highlight the importance of STEM due to its critical role in securing a competitive spot in an increasingly global economy (e.g., [1,4]). Given this critical role of STEM, educators, policymakers, and scientists have stressed the need to broaden participation in STEM and increase students’ motivation and achievement in the STEM fields, especially among those students underrepresented in these fields [9,89]. To address this need, the current study sought to understand teacher factors that predict student motivation and learning in science and mathematics. Framed within SCCT theoretical model, this study explored the degree to which the characteristics, qualifications, and instructional practices of ninth grade mathematics teachers can predict students’ mathematics motivation and learning outcomes as they neared graduation and their future STEM career expectations (controlling for student motivation and learning outcomes).
Overall, our findings support prior SCCT-informed research suggesting that teachers are important socializing agents that promote positive beliefs towards STEM fields (see [36]). Specifically, our findings are consistent with prior individual classroom studies indicating that teachers’ self-efficacy for teaching mathematics and the extent to which they emphasize conceptual understanding of mathematics are positively associated with students’ self-efficacy for mathematics and achievement [90]. Furthermore, current findings are consistent with teacher education research that demonstrates the importance of teachers having a teaching certification in mathematics on promoting greater students’ mathematics achievement [49]. Our findings contribute to this line of research by showing that teacher qualifications have a positive association with both students’ achievement and motivation in mathematics and science over time. The findings are significant given National Council of Teachers of Mathematics’ [82] math practice standards, math teacher practice standards, and push towards a conceptual understanding for all students. For example, students who received instruction from teachers that emphasized developing mathematics reasoning and problem-solving skills, and understanding mathematical concepts in ninth grade, performed better on a math achievement test in the 11th grade compared to students who received instruction from teachers who did not place emphasis in these areas in ninth grade. This finding provides further support for student-centered teaching approaches (informed by constructivist philosophy) that are foundational to reform-based teaching within the mathematics education community [82].
Understanding the extent teacher factors contribute to students’ motivation in STEM is a crucial step for identifying policies that can address and improve mathematics and science teacher qualifications. Results of this study have implications for developing timely policies for teacher education and professional development. These implications include but are not limited to producing, retaining, and promoting highly qualified teachers. For example, since having a degree in science is an significant factor (for student enrollment in advanced science courses) found in this study, teacher preparation programs should consider rigorous subject matter training or degree plans where preservice teachers can concurrently complete a teacher certification. For in-service teachers, this would mean providing support structures for them to further develop professionally and reach desired qualifications (e.g., professional development programs to improve their pedagogical content knowledge and incentivizing them to take graduate credits in STEM subjects). In addition, professional development and teacher preparation programs should promote instructional practices that focus on meaningfulness of mathematics and science content (e.g., real-life connections) and students’ conceptual understanding rather than procedural learning of the content because our findings indicate these teaching practices (i.e., math understand, math connection, science inquiry, and science connection) are positively associated with higher levels of students’ motivational beliefs in mathematics and science.
Lastly, although controlling variables’ impact in answering research questions (dashed arrows in conceptual framework) was not among the main investigation elements in this study, we believe that it is noteworthy to point out some findings regarding them. This study shows that mathematics achievement, mathematics self-efficacy, mathematics interest, science self-efficacy, science interest, and science advanced course enrollment were strong predictors of students’ STEM career plans, which is consistent with previous research [24,39,66,91]. Moreover, sex and racial/ethnic gaps for almost several outcomes included in the study support previous research (e.g., [39,87]). Finally, while not the focus of the current research, we found that students’ SES was the strongest predictor of students’ mathematics achievement, which is consistent with prior research [92]. These findings may inform policies that would help increase and broaden participation in STEM by addressing these strong predictors in developing STEM programs for students such as providing more support for students from minoritized backgrounds to increase their achievement and advance course enrollments in math and science.

8.1. Limitations

We recognize several limitations of this study. The first limitation relates to the measurement of teacher practices which is a self-reported measure and was not triangulated with other means such as observations. Moreover, a limited number of variables in the HSLS:09 relate to teacher practices. Second, HSLS:09 collected teacher data through the base year teacher instrument, which was collected in fall of 2009 while student outcomes come from the first follow-up data collection (spring of 2012, when students were in 11th grade). Thus, any math and science teacher-changes in 10th and 11th grades cannot be accounted for. For example, after ninth grade, some students may have been taught by different math and science teachers who affected students’ STEM outcomes in different ways than the original ninth grade teacher. However, it is still safe to assume that every student has been taught for at least one year by their math and science teachers who participated in the study. Finally, although no causal inferences can be made from this study because of the non-random study design of HSLS:09 [93,94,95], some causal hypotheses can still be made based on the results and prior research after having reduced the selection bias to the extent possible by inclusion of analytic weights [69,94] (see [96]). Our hope, however, is this study’s findings serve as sound hypotheses related to teacher effects that can be utilized and tested by more robust research designs such as random experiments (which are not possible in NCES’s large-scale studies) or propensity score matching (PSM) [97] to approximate a random experiment design using HSLS:09 with a treatment condition based on teacher factors. This provides opportunities to expand on our research and to develop causal inferences as a continuation of this study.

8.2. Conclusions

Despite these limitations, this study provides further support for the hypothesized associations within the Social Cognitive Career model. Our findings indicate that students’ motivational beliefs in science and math predict their intentions to pursue STEM careers. Moreover, including teacher factors in our model, provides further evidence of the role that learning experiences have on students’ self-efficacy and interests. These results should be interpreted cautiously in the light limitations stated above. To reiterate, this study serves as a steppingstone for future studies by providing strong hypotheses based on robust results rather than causal inferences.
This study also provides further evidence that strong mathematics preparation in high school plays a critical role in retaining students in STEM fields (see [14]) and provides a more fine-grained understanding of the type of science and mathematics instruction that is associated with greater academic performance in these subjects. Unfortunately, mathematics teachers encounter numerous barriers to implementing student-centered teaching approaches (informed by constructivist philosophy we assessed [73]. Thus, future research should explore how to help teachers overcome these barriers given the mounting evidence of the importance of reformed-based mathematics teaching (e.g., [82,98,99]).
Future studies may consider inclusion of additional contextual factors besides teachers. Such models will have potential to expand more on the SCCT framework and to provide a more comprehensive approach to understanding student STEM career plans. Researchers may consider additional factors such as extracurricular STEM activities or parental factors. This study is the first step in integrating teachers into the SCCT framework. Future studies should expand on this approach and consider other contextual variables.
Finally, the field of STEM education research needs well-designed large-scale studies connecting teacher qualifications and student outcomes. It is important to note that student outcomes should include both cognitive and psychological outcomes unlike most teacher quality studies (small- or-medium-scale ones) that focus on students’ performance in standardized tests. Existing large-scale and longitudinal studies are limited in number and in their design. To date, there are only three large-scale studies that allow include teacher data and data on students’ math and/or science persistence that goes beyond secondary education: Education Longitudinal Study of 2002 (does not include science; and math outcomes are limited); National Assessment of Educational Progress (does not include post-secondary outcomes; and only includes cognitive outcomes); and HSLS:09 (includes both math and science and both cognitive and psychological outcomes). None of these studies, however, allow for hierarchical linear modeling that may provide more robust analytical approaches to study the relation between teacher quality and student STEM persistence. For example, HSLS:09 does not assign teacher identification numbers to track them, thus the nested structure of the data (students being nested in teachers) cannot be observed, which makes more robust model such as hierarchical linear modeling (to compare between and within teacher variance) impossible. We conclude by urging the national education research stakeholders to design a new longitudinal study (or revise existing ones) to include direct and hierarchical linkage between teachers and students to study student’s STEM persistence. Only then, it is possible to expand research on the nexus of teacher quality and student persistence in STEM.

Author Contributions

Conceptualization, A.E. and D.M.S.; methodology, A.E. and D.M.S.; software, D.M.S.; validation, A.E.; formal analysis, A.E. and D.M.S.; investigation, A.E. and D.M.S.; resources, A.E.; data curation, A.E.; writing—original draft preparation, A.E. and D.M.S.; writing—review and editing, A.E. and D.M.S.; visualization, A.E.; supervision, A.E.; project administration, A.E.; funding acquisition, A.E. All authors have read and agreed to the published version of the manuscript.

Funding

This research was funded by the Spencer Foundation (grant number 201800021).

Institutional Review Board Statement

The study was conducted in accordance with the Declaration of Helsinki, and approved by the Institutional Review Board Rice University (IRB-FY2016-694; 1 June 2016).

Informed Consent Statement

Not applicable (secondary data analysis).

Data Availability Statement

Publicly available datasets were analyzed in this study. This data can be found here: https://nces.ed.gov/surveys/hsls09/hsls09_data.asp, accessed on 17 August 2022.

Acknowledgments

We are grateful for Mahtob Aqazade’s insightful feedback on this paper.

Conflicts of Interest

The authors declare no conflict of interest.

References

  1. National Research Council. Monitoring Progress toward Successful K-12 STEM Education: A Nation Advancing? The National Academies Press: Washington, DC, USA, 2013. [Google Scholar] [CrossRef]
  2. National Science Board, National Science Foundation. Science and Engineering Indicators 2016 (NSB–2016–1). 2016. Available online: https://www.nsf.gov/statistics/indicators/ (accessed on 12 September 2022).
  3. National Science Board, National Science Foundation. Science and Engineering Indicators 2018 (NSB-2018-1). 2018. Available online: https://www.nsf.gov/statistics/indicators/ (accessed on 12 September 2022).
  4. National Science Board, National Science Foundation. Science and Engineering Indicators 2020: The State of U.S. Science and Engineering (NSB-2020-1). 2020. Available online: https://ncses.nsf.gov/pubs/nsb20201 (accessed on 12 September 2022).
  5. President’s Council of Advisors on Science and Technology. Engage to Excel: Producing One Million Additional College Graduates with Degrees in Science, Technology, Engineering, and Mathematics. 2012. Available online: https://obamawhitehouse.archives.gov/administration/eop/ostp/pcast/docsreports (accessed on 12 September 2022).
  6. President’s Council of Advisors on Science and Technology. Recommendations for Strengthening American Leadership in Industries of the Future. 2020. Available online: https://science.osti.gov/About/PCAST (accessed on 12 September 2022).
  7. Xue, Y.; Larson, R.C. STEM Crisis or STEM Surplus? Yes and Yes (U.S. Bureau of Labor Statistics). Monthly Labor Review, May 2015. Available online: https://www.bls.gov/opub/mlr/2015/article/stem-crisis-or-stem-surplus-yes-and-yes.htm (accessed on 12 September 2022).
  8. U.S. Bureau of Labor Statistics. Employment Projections Program. 1 September 2020. Available online: https://www.bls.gov/emp/tables/stem-employment.htm (accessed on 12 September 2022).
  9. Alfred, M.V.; Ray, S.M.; Johnson, M.A. Advancing women of color in STEM: An imperative for US global competitiveness. Adv. Dev. Hum. Resour. 2019, 21, 114–132. [Google Scholar] [CrossRef]
  10. Augustine, N.R. Rising above the Gathering Storm: Energizing and Employing America for a Brighter Economic Future; The National Academies Press: Washington, DC, USA, 2007. [Google Scholar]
  11. Noonan, R. STEM Jobs: 2017 Update (ESA Issue Brief # 02-17); Office of the Chief Economist, U.S. Department of Commerce: Washington, DC, USA, 2017. Available online: https://www.commerce.gov/sites/default/files/migrated/reports/stem-jobs-2017-update.pdf (accessed on 12 September 2022).
  12. National Academy of Sciences. Expanding Underrepresented Minority Participation: America’s Science and Technology Talent at the Crossroads; The National Academies Press: Washington, DC, USA, 2011; Available online: http://hdl.voced.edu.au/10707/173219 (accessed on 12 September 2022).
  13. Chen, X. STEM Attrition: College Students’ Paths into and out of STEM Fields: Statistical Analysis Report (NCES 2014-001); National Center for Education Statistics: Washington, DC, USA, 2013. Available online: https://files.eric.ed.gov/fulltext/ED544470.pdf (accessed on 12 September 2022).
  14. Paschal, J.; Taggart, A. An examination of the role of first-year college-level mathematics in STEM field major persistence at a Hispanic-Serving Institution. J. Hisp. High. Educ. 2021, 20, 297–312. [Google Scholar] [CrossRef]
  15. Sass, T.R. Understanding the STEM Pipeline (CALDER #125); American Institutes for Research: Washington, DC, USA, 2015; Available online: http://hdl.voced.edu.au/10707/364347 (accessed on 12 September 2022).
  16. Winterer, E.R.; Froyd, J.E.; Borrego, M.; Martin, J.P.; Foster, M. Factors influencing the academic success of Latinx students matriculating at 2-year and transferring to 4-year US institutions—Implications for STEM majors: A systematic review of the literature. Int. J. STEM Educ. 2020, 7, 34. [Google Scholar] [CrossRef]
  17. Dilek, H.; Tasdemir, A.; Konca, A.S.; Baltaci, S. Preschool children’s science motivation and process skills during inquiry-based STEM activities. J. Educ. Sci. Environ. Health 2020, 6, 92–104. [Google Scholar] [CrossRef]
  18. Eccles, J.S.; Midgley, C.; Wigfield, A.; Buchanan, C.M.; Reuman, D.; Flanagan, C.; Mac Iver, D. Development during adolescence: The impact of stage-environment fit on young adolescents’ experiences in schools and in families. Am. Psychol. 1993, 48, 90–101. [Google Scholar] [CrossRef] [PubMed]
  19. Graham, M.J.; Frederick, J.; Byars-Winston, A.; Hunter, A.; Handelsman, J. Increasing persistence of college students in STEM. Science 2013, 341, 1455–1456. [Google Scholar] [CrossRef]
  20. Wang, X. Why students choose STEM majors: Motivation, high school learning, and postsecondary context of support. Am. Educ. Res. J. 2013, 50, 1081–1121. [Google Scholar] [CrossRef]
  21. Darling-Hammond, L. Teacher quality and student achievement. Educ. Policy Anal. Arch. 2000, 8, 1–44. [Google Scholar] [CrossRef]
  22. Goe, L. The Link between Teacher Quality and Student Outcomes: A Research Synthesis; National Comprehensive Center for Teacher Quality: Washington, DC, USA, 2007. Available online: http://eric.ed.gov/?id=ED521219 (accessed on 12 September 2022).
  23. Goe, L.; Stickler, L.M. Teacher Quality and Student Achievement: Making the Most of Recent Research (TQ Research & Policy Brief); National Comprehensive Center for Teacher Quality: Washington, DC, USA, 2008. Available online: http://eric.ed.gov/?id=ED520769 (accessed on 12 September 2022).
  24. Hansen, M. Characteristics of schools successful in STEM: Evidence from two states’ longitudinal data. J. Educ. Res. 2014, 107, 374–391. [Google Scholar] [CrossRef]
  25. Muller, C.; Katz, S.R.; Dance, L.J. Investing in teaching and learning dynamics of the teacher-student relationship from each actor’s perspective. Urban Educ. 1999, 34, 292–337. [Google Scholar] [CrossRef]
  26. Schleicher, A. (Ed.) Preparing Teachers and Developing School Leaders for the 21st Century: Lessons from around the World; OECD Publishing: Mexico City, Mexico, 2012. [Google Scholar] [CrossRef]
  27. Ackerman, P.L.; Kanfer, R.; Calderwood, C. High school Advanced Placement and student performance in college: STEM majors, non-STEM majors, and gender differences. Teach. Coll. Rec. 2013, 115, 1–43. [Google Scholar] [CrossRef]
  28. Ingels, S.J.; Pratt, D.J.; Herget, D.R.; Dever, J.A.; Fritch, L.B.; Ottem, R.; Rogers, J.E.; Wilson, D. The High School Longitudinal Study of 2009 (HSLS: 09): 2013 Update and High School Transcript (NCES 2015-036); National Center for Education Statistics: Washington, DC, USA, 2015. Available online: https://nces.ed.gov/pubsearch/pubsinfo.asp?pubid=2015036 (accessed on 12 September 2022).
  29. Ingels, S.J.; Dalton, B.; Holder Jr, T.E.; Lauff, E.; Burns, L.J. The High School Longitudinal Study of 2009 (HSLS: 09): A First Look at Fall 2009 Ninth-Graders; NCES 2011–327; National Center for Education Statistics: Washington, DC, USA, 2011. Available online: https://nces.ed.gov/pubsearch/pubsinfo.asp?pubid=2011327 (accessed on 12 September 2022).
  30. Ingels, S.J.; Pratt, D.J.; Herget, D.R.; Dever, J.A.; Fritch, L.B.; Ottem, R.; Rogers, J.E.; Kitmitto, S.; Leinwand, S. The High School Longitudinal Study of 2009 (HSLS: 09): Base Year to First Follow-Up Data File Documentation (NCES 2014-361); National Center for Education Statistics: Washington, DC, USA, 2013. Available online: https://nces.ed.gov/pubsearch/pubsinfo.asp?pubid=2014361 (accessed on 12 September 2022).
  31. Lent, R.W.; Brown, S.D.; Hackett, G. Toward a unifying social cognitive theory of career and academic interest, choice, and performance. J. Vocat. Behav. 1994, 45, 79–122. [Google Scholar] [CrossRef]
  32. Hattie, J. Teachers Make a Difference, What Is the Research Evidence? Australian Council for Educational Research: Washington, DC, USA, 2003; Available online: http://research.acer.edu.au/research_conference_2003/4/ (accessed on 12 September 2022).
  33. Hattie, J.; Masters, D.; Birch, K. Visible Learning into Action: International Case Studies of Impact; Routledge: London, UK, 2016. [Google Scholar]
  34. Bandura, A. Social Foundations of Thought and Action: A Social Cognitive Theory; Prentice-Hall, Inc.: Hoboken, NJ, USA, 1986. [Google Scholar]
  35. Ekmekci, A.; Sahin, A.; Waxman, H. Factors affecting students’ STEM choice and persistence: A synthesis of research and findings from the second year of a longitudinal high school STEM tracking study. In STEM Education 2.0: Myths and Truths: What Has Years of K-12 STEM Education Research Taught Us? Sahin, A., Mohr-Schroeder, M., Eds.; Brill: Leiden, The Netherlands, 2019; pp. 279–304. [Google Scholar]
  36. Yu, S.L.; Corkin, D.M.; Martin, J.P. STEM motivation and persistence among underrepresented minority students: A social cognitive perspective. In Race and Ethnicity in the Study of Motivation in Education; DeCuir-Gunby, J.T., Schutz, P.A., Eds.; Taylor & Francis: Abingdon, UK, 2016; pp. 67–81. [Google Scholar] [CrossRef]
  37. Eccles, J.S.; Wigfield, A. Motivational beliefs, values, and goals. Annu. Rev. Psychol. 2002, 53, 109–132. [Google Scholar] [CrossRef] [PubMed]
  38. Lent, R.W.; Brown, S.D. On conceptualizing and assessing social cognitive constructs in career research: A measurement guide. J. Career Assess. 2006, 14, 12–35. [Google Scholar] [CrossRef]
  39. Andersen, L.; Ward, T.J. Expectancy-value models for the STEM persistence plans of ninth-grade, high-ability Students: A comparison between Black, Hispanic, and White students. Sci. Educ. 2014, 98, 216–242. [Google Scholar] [CrossRef]
  40. Lee, S.W.; Min, S.; Mamerow, G.P. Pygmalion in the classroom and the home: Expectation’s role in the pipeline to STEMM. Teach. Coll. Rec. 2015, 117, 1–36. [Google Scholar] [CrossRef]
  41. Lent, R.W.; Brown, S.D. Social cognitive approach to career development: An overview. Career Dev. Q. 1996, 44, 310–321. [Google Scholar] [CrossRef]
  42. Navarro, R.L.; Flores, L.Y.; Worthington, R.L. Mexican American middle school students’ goal intentions in mathematics and science: A test of Social Cognitive Career Theory. J. Couns. Psychol. 2007, 54, 320–335. [Google Scholar] [CrossRef]
  43. Nye, B.; Konstantopoulos, S.; Hedges, L.V. How large are teacher effects? Educ. Eval. Policy Anal. 2004, 26, 237–257. [Google Scholar] [CrossRef]
  44. Hanushek, E.A. The economics of schooling: Production and efficiency in public schools. J. Econ. Lit. 1986, 24, 1141–1177. [Google Scholar]
  45. Rowan, B.R.; Correnti, R.; Miller, R.J. What large-scale survey research tells us about teacher effects on student achievement: Insights from the Prospects study of elementary schools. Teach. Coll. Rec. 2002, 104, 1525–1567. [Google Scholar] [CrossRef]
  46. Barnett, W.S. Better Teachers, Better Preschools: Student Achievement Linked to Teacher Qualifications; Rutgers National Institute for Early Education Research: Philadelphia, PA, USA, 2003. Available online: http://files.eric.ed.gov/fulltext/ED480818.pdf (accessed on 12 September 2022).
  47. Hill, J.G.; Dalton, B. Student math achievement and out-of-field teaching. Educ. Res. 2013, 42, 403–405. [Google Scholar] [CrossRef]
  48. National Council on Teacher Quality. Increasing the Odds: How Good Policies Can Yield Better Teachers. 2004. Available online: https://www.nctq.org/publications/home (accessed on 12 September 2022).
  49. Rice, J.K. Teacher Quality: Understanding the Effectiveness of Teacher Attributes; Economic Policy Institute: Washington, DC, USA, 2003. [Google Scholar]
  50. Goe, L.; Biggers, K.; Croft, A. Linking Teacher Evaluation to Professional Development: Focusing on Improving Teaching and Learning (Research Policy Brief); National Comprehensive Center for Teacher Quality: 2012. Available online: http://eric.ed.gov/?id=ED532775 (accessed on 12 September 2022).
  51. Ingersoll, R. A Comparative Study of Teacher Preparation and Qualifications in Six Nations; (CPRE RB-47); Consortium for Policy Research in Education: Philadelphia, PA, USA, 2007. [Google Scholar] [CrossRef]
  52. Rice, J.K. The Impact of Teacher Experience: Examining the Evidence and Policy Implications (Brief No. 11). National Center for Analysis of Longitudinal Data in Education Research. 2010. Available online: https://eric.ed.gov/?id=ED511988 (accessed on 12 September 2022).
  53. Zuzovsky, R. Teachers’ qualifications and their impact on student achievement: Findings from TIMSS 2003 data for Israel. IERI Monogr. Series. Issues Methodol. Large-Scale Assess. 2009, 2, 37–62. [Google Scholar]
  54. Blanton, L.P.; Sindelar, P.T.; Correa, V.I. Models and measures of beginning teacher quality. J. Spec. Educ. 2006, 40, 115–127. [Google Scholar] [CrossRef]
  55. Hanushek, E.A.; Kain, J.F.; O’Brien, D.M.; Rivkin, S.G. The Market for Teacher Quality; (No. w11154); National Bureau of Economic Research: Cambridge, MA, USA, 2006. [Google Scholar] [CrossRef]
  56. Sanders, W.L.; Horn, S.P. The Tennessee value-added assessment system (TVAAS): Mixed-model methodology in educational assessment. J. Pers. Eval. Educ. 1994, 8, 299–311. [Google Scholar] [CrossRef]
  57. American Educational Research Association. AERA statement on use of value-added models (VAM) for the evaluation of educators and educator preparation programs. Educ. Res. 2015, 44, 448–452. [Google Scholar] [CrossRef]
  58. Darling-Hammond, L. Research on teaching and teacher education and its influences on policy and practice. Educ. Res. 2016, 45, 83–91. [Google Scholar] [CrossRef] [Green Version]
  59. Hill, H.C.; Kapitula, L.; Umland, K. A validity argument approach to evaluating teacher value-added scores. Am. Educ. Res. J. 2011, 48, 794–831. [Google Scholar] [CrossRef]
  60. Klees, S.J. VAMs Are Never “Accurate, Reliable, and Valid”. Educ. Res. 2016, 45, 267. [Google Scholar] [CrossRef]
  61. Kupermintz, H. Teacher effects and teacher effectiveness: A validity investigation of the Tennessee Value Added Assessment System. Educ. Eval. Policy Anal. 2003, 25, 287–298. [Google Scholar] [CrossRef]
  62. Maltese, A.V.; Tai, R.H. Pipeline persistence: Examining the association of educational experiences with earned degrees in STEM among US students. Sci. Educ. 2011, 95, 877–907. [Google Scholar] [CrossRef]
  63. Howard, K.A.; Carlstrom, A.H.; Katz, A.D.; Chew, A.Y.; Ray, G.C.; Laine, L.; Caulum, D. Career aspirations of youth: Untangling race/ethnicity, SES, and gender. J. Vocat. Behav. 2011, 79, 98–109. [Google Scholar] [CrossRef]
  64. Riegle-Crumb, C.; Peng, M. Examining high school students’ gendered beliefs about math: Predictors and implications for choice of stem college majors. Sociol. Educ. 2021, 94, 227–248. [Google Scholar] [CrossRef]
  65. Jiang, S.; Simpkins, S.D.; Eccles, J.S. Individuals’ math and science motivation and their subsequent STEM choices and achievement in high school and college: A longitudinal study of gender and college generation status differences. Dev. Psychol. 2020, 56, 2137–2151. [Google Scholar] [CrossRef] [PubMed]
  66. Ehrenberg, R.G. Analyzing the factors that influence persistence rates in STEM field, majors: Introduction to the symposium. Econ. Educ. Rev. 2010, 29, 888–891. [Google Scholar] [CrossRef]
  67. Museus, S.D.; Palmer, R.T.; Davis, R.J.; Maramba, D.C. Racial and ethnic minority students’ success in STEM education. ASHE High. Educ. Rep. 2011, 36, 1–140. [Google Scholar] [CrossRef]
  68. Gottfried, M.A.; Williams, D. STEM club participation and STEM schooling outcomes. Educ. Policy Anal. Arch. 2013, 21, 1–27. [Google Scholar] [CrossRef] [Green Version]
  69. Riegle-Crumb, C.; Farkas, G.; Muller, C. The role of gender and friendship in advanced course taking. Sociol. Educ. 2006, 79, 206–228. [Google Scholar] [CrossRef]
  70. Gottlieb, J.J. STEM career aspirations in Black, Hispanic, and White ninth-grade students. J. Res. Sci. Teach. 2018, 55, 1365–1392. [Google Scholar] [CrossRef]
  71. Green, A.; Sanderson, D. The roots of STEM achievement: An analysis of persistence and attainment in STEM majors. Am. Econ. 2018, 63, 79–93. [Google Scholar] [CrossRef]
  72. Tai, R.H.; Liu, C.Q.; Maltese, A.V.; Fan, X. Planning early for careers in science. Science 2006, 312, 1143–1144. [Google Scholar] [CrossRef] [PubMed]
  73. Serrano Corkin, D.M.; Ekmekci, A.; Coleman, S. Navigating the challenges of student-centered mathematics teaching in an urban context. Urban Rev. 2019, 51, 370–403. [Google Scholar] [CrossRef]
  74. Wayne, A.J.; Youngs, P. Teacher characteristics and student achievement gains: A review. Rev. Educ. Res. 2019, 73, 89–122. [Google Scholar] [CrossRef]
  75. Lubienski, S.T.; Lubienski, C.; Crane, C.C. Achievement differences and school type: The role of school climate, teacher certification, and instruction. Am. J. Educ. 2008, 115, 97–138. [Google Scholar] [CrossRef]
  76. Hill, H.C.; Umland, K.; Litke, E.; Kapitula, L.R. Teacher quality and quality teaching: Examining the relationship of a teacher assessment to practice. Am. J. Educ. 2012, 118, 489–519. [Google Scholar] [CrossRef]
  77. Philipp, R.A. Mathematics teachers’ beliefs and affect. In Second Handbook of Research on Mathematics Teaching and Learning: A Project of the National Council of Teachers of Mathematics; Lester, F.K., Ed.; IAP: Reston, VA, USA, 2007. [Google Scholar]
  78. Aaronson, D.; Barrow, L.; Sander, W. Teachers and student achievement in the Chicago public high schools. J. Labor Econ. 2007, 25, 95–135. [Google Scholar] [CrossRef]
  79. Heck, R.H. Examining the relationship between teacher quality as an organizational property of schools and students’ achievement and growth rates. Educ. Adm. Q. 2007, 43, 399–432. [Google Scholar] [CrossRef]
  80. Stewart, J.; Rhoads, C.; Serdiouk, M.; Van Dine, D.; Cherasaro, T.; Klute, M. Associations between the Qualifications of Middle School Algebra-I Teachers and Student Math Achievement; (REL 2020-005); Regional Educational Laboratory Central: Washington, DC, USA, 2019. [Google Scholar]
  81. Yu, R.; Singh, K. Teacher support, instructional practices, student motivation, and mathematics achievement in high school. J. Educ. Res. 2018, 111, 81–94. [Google Scholar] [CrossRef]
  82. National Council of Teachers of Mathematics. Principles to Actions: Ensuring Mathematical Success for All; National Council of Teachers of Mathematics: Reston, VA, USA, 2014. [Google Scholar]
  83. Vekiri, I. Information science instruction and changes in girls’ and boy’s expectancy and value beliefs: In search of gender-equitable pedagogical practices. Comput. Educ. 2013, 64, 104–115. [Google Scholar] [CrossRef]
  84. Morrell, P.D.; Park Rogers, M.A.; Pyle, E.J.; Roehrig, G.; Veal, W.R. Preparing teachers of science for 2020 and beyond: Highlighting changes to the NSTA/ASTE Standards for Science Teacher Preparation. J. Sci. Teach. Educ. 2020, 31, 1–7. [Google Scholar] [CrossRef]
  85. NGSS Lead States. Next Generation Science Standards: For States, by States; The National Academies Press: Washington, DC, USA, 2013. [Google Scholar]
  86. Meyers, L.S.; Gamst, G.; Guarino, A.J. Applied Multivariate Research: Design and Interpretation, 3rd ed.; Sage: Newcastle upon Tyne, UK, 2017. [Google Scholar]
  87. Ekmekci, A.; Corkin, D. The influence of science teachers on high school students’ science motivation: An analysis using a nationally representative large-scale data set. In Proceedings of Society for Information Technology & Teacher Education International Conference (ISBN 978-1-939797-37-7); Graziano, K., Ed.; Association for the Advancement of Computing in Education: Las Vegas, NV, USA, 2019; pp. 2267–2272. [Google Scholar]
  88. Corkin, D.; Ekmekci, A. The impact of mathematics teachers on student learning and motivation. In Proceedings of the 46th Annual Meeting of the Research Council on Mathematics Learning; Redmond-Sanogo, A., Cribbs, J., Eds.; Research Council on Mathematics Learning: Charlotte, NC, USA, 2019; pp. 34–41. [Google Scholar]
  89. Riegle-Crumb, C.; King, B.; Irizarry, Y. Does STEM stand out? Examining racial/ethnic gaps in persistence across postsecondary fields. Educ. Res. 2019, 48, 133–144. [Google Scholar] [CrossRef]
  90. Stipek, D.J.; Givvin, K.B.; Salmon, J.M.; MacGyvers, V.L. Teachers’ beliefs and practices related to mathematics instruction. Teach. Teach. Educ. 2001, 17, 213–226. [Google Scholar] [CrossRef]
  91. Crisp, G.; Nora, A.; Taggart, A. Student characteristics, pre-college, college, and environmental factors as predictors of majoring in and earning a STEM degree: An analysis of students attending a Hispanic serving institution. Am. Educ. Res. J. 2009, 46, 924–942. [Google Scholar] [CrossRef]
  92. Sirin, S.R. Socioeconomic status and academic achievement: A meta-analytic review of research. Rev. Educ. Res. 2005, 75, 417–453. [Google Scholar] [CrossRef]
  93. Holland, P.W. Statistics and causal inference. J. Am. Stat. Assoc. 1986, 81, 945–960. [Google Scholar] [CrossRef]
  94. Schneider, B.; Carnoy, M.; Kilpatrick, J.; Schmidt, W.H.; Shavelson, R.J. Estimating Causal Effects Using Experimental and Observational Designs; American Educational Research Association: Washington, DC, USA, 2007. [Google Scholar]
  95. Stuart, E.A. Estimating causal effects using school-level data sets. Educ. Res. 2007, 36, 187–198. [Google Scholar] [CrossRef]
  96. Schmidt, W.H.; McKnight, C.C.; Houang, R.T.; Wang, H.; Wiley, D.E.; Cogan, L.S.; Wolfe, R.G. Why Schools Matter: A Cross-National Comparison of Curriculum and Learning; Jossey-Bass: San Francisco, CA, USA, 2001. [Google Scholar]
  97. Rosenbaum, P.R.; Rubin, D.B. The central role of the propensity score in observational studies for causal effects. Biometrika 1983, 70, 41–55. [Google Scholar] [CrossRef]
  98. Lesh, R.; Doerr, H. (Eds.) Beyond Constructivism: A Models Modeling Perspective on Mathematics Teaching, Learning, and Problems Solving; Lawrence Erlbaum Associates: Mahwah, NJ, USA, 2003. [Google Scholar]
  99. O’Shea, J.; Leavy, A.M. Teaching mathematical problem-solving from an emergent constructivist perspective: The experiences of Irish primary teachers. J. Math. Teach. Educ. 2013, 16, 293–318. [Google Scholar] [CrossRef]
Figure 1. Conceptual Framework for the Nexus of Teacher Quality and Students’ STEM Outcomes.
Education 12 00649 g001
Table 1. Factor Loadings for Mathematics Teaching Practice Variables.
ItemsFactor Loading
Math UnderstandMath Connect
M1concepts0.74−0.01
M1problem0.560.13
M1reason0.570.10
M1ideas0.690.21
M1prepare0.630.08
M1logic0.580.04
M1interest−0.070.71
M1history0.030.82
M1explain0.250.67
M1business0.090.69
M1algorithm0.14-0.01
M1compskills−0.020.07
M1compute0.030.13
M1test−0.070.12
Table 2. Factor Loadings for Science Teaching Practice Variables.
ItemsFactor Loading
Science InquiryScience Connect
N1skills0.590.03
N1prepare0.58−0.06
N1evidence0.630.11
N1ideas0.690.07
N1interest0.120.71
N1business−0.080.83
N1society0.090.58
N1history0.030.64
N1concepts0.130.09
N1terms0.10−0.06
N1test0.080.01
Table 3. Summary of Multiple Linear Regression Analyses Predicting Motivational Beliefs about Math and Science.
Mathematics bScience c
VariableSelf-EfficacyUtilityInterestSelf-EfficacyUtilityInterest
ββββββ
Male0.10 ***0.04 ***0.010.09 ***-0.02 *0.02
Black0.07 ***0.07 ***0.04 *0.03 *0.04 **0.01
Asian0.06 ***0.08 ***0.11 ***−0.000.11 ***0.05 ***
Hispanic0.05 ***0.05 ***0.08 ***−0.03 *−0.01−0.03
SES0.14 ***0.03 *0.10 ***0.10 ***0.07 ***0.05 ***
Teacher self-efficacy a0.03 **−0.010.020.010.00−0.00
Teacher certification a0.01−0.010.01−0.01−0.02 *−0.01
Teacher degree a0.00−0.01−0.010.010.020.03 *
Teacher experience a0.010.010.020.000.010.01
Understand (math)0.04 **0.000.03 *---
Connection (math)0.010.03 *0.02---
Inquiry (science)---0.03 *0.020.01
Connection (science)---−0.010.03 *0.01
R-square0.04 ***0.01 ***0.03 ***0.020.02 ***0.01
n853486047363780979186244
Notes. β indicates standardized regression coefficient. * p < 0.05. ** p < 0.01. *** p < 0.001. a Corresponds to math teacher for math outcomes, science teacher for science outcomes. b A brief paper with preliminary results of a similar analysis was presented elsewhere before [87] c A brief paper with preliminary results of a similar analysis was presented elsewhere before [88].
Table 4. Multiple Linear Regression Analyses Predicting Mathematics Achievement.
VariableAchievement a
β
Male0.00
Black−0.09 ***
Asian0.14 ***
Hispanic−0.02 *
SES0.39 ***
Math teacher self-efficacy0.01
Math teacher certification0.03 **
Math teacher degree in math0.02
Math teacher experience0.06 ***
Understand (math)0.14 ***
Connection (math)−0.03 **
R-square0.25 ***
Notes. β indicates standardized regression coefficient. n = 8857. * p < 0.05. ** p < 0.01. *** p < 0.001.a A brief paper with preliminary results of a similar analysis was presented elsewhere before [87].
Table 5. Binary Logistic Regression on Advanced Math and Science Course-taking.
VariableAdvanced Math
Course-Taking b
Advanced Science
Course-Taking
Exp(β)Exp(β)
Male1.28 ***1.14 *
Black1.171.18
Asian1.58 ***2.22 ***
Hispanic0.960.95
SES0.971.25 ***
Teacher self-efficacy a0.991.02
Teacher certification a1.110.86
Teacher degree a1.001.15 *
Teacher experience a1.02 ***1.01 *
Understand (math)1.51 **-
Connection (math)1.03-
Inquiry (science)-1.08
Connection (science)-1.06
Pseudo R-square0.02 ***0.03 ***
Notes. Exp(β) indicates odds ratio. n = 4048 (math) and 3941 (science). * p < 0.05. ** p < 0.01. *** p < 0.001. a Corresponds to math teacher for math outcomes, science teacher for science outcomes. b A brief paper with preliminary results of a similar analysis was presented elsewhere before [87].
Table 6. Binary Logistic Regression on STEM Career Plans: Math and Science Predictors.
VariableSTEM Career Plans
Math Predictors
STEM Career Plans
Science Predictors
Exp (β)Exp (β)
Male0.67 ***0.60 ***
Black0.970.96
Asian1.54 ***1.55 ***
Hispanic1.201.07
SES1.091.16 **
Math self-efficacy1.13 *-
Math interest1.21 ***-
Math achievement1.02 ***-
Math advanced course-taking1.08-
Science self-efficacy-1.16 **
Science interest-1.23 ***
Science advanced course-taking-1.59 ***
Teacher self-efficacy a0.930.93
Teacher certification a1.000.88
Teacher degree a1.050.88
Teacher experience a1.011.01
Understand (math)0.78-
Connection (math)1.13-
Inquiry (science)-1.10
Connection (science)-1.13
Pseudo R-square0.05 ***0.05 ***
Notes. Exp(β) indicates odds ratio. n = 2815 (math predictors) and 2614 (science predictors). * p < 0.05. ** p < 0.01. *** p < 0.001. a Corresponds to math teacher for math predictors, science teacher for science predictors.
Publisher’s Note: MDPI stays neutral with regard to jurisdictional claims in published maps and institutional affiliations.

