Article

Understanding German FDI in Latin America and Asia: A Comparison of GLM Estimators

by
Mariam Camarero
1,†,
Laura Montolio
2,† and
Cecilio Tamarit
2,*,†
1
Department of Economics, University Jaume I and INTECO, Campus de Riu Sec, E-12080 Castellón, Spain
2
Department of Applied Economics II, University of València and INTECO, Av. dels Tarongers, s/n Eastern Department Building, E-46022 Valencia, Spain
*
Author to whom correspondence should be addressed.
These authors contributed equally to this work.
Economies 2020, 8(1), 19; https://doi.org/10.3390/economies8010019
Submission received: 29 January 2020 / Revised: 21 February 2020 / Accepted: 29 February 2020 / Published: 10 March 2020

Abstract

:
The growth of Foreign Direct Investment (FDI) in developing countries over the last decade has attracted an intense academic and policy-oriented interest for its determinants. Despite the gravity model being considered a useful tool to approximate bilateral FDI flows, the literature has seen a growing debate in relation to its econometric specification, so that which is the best estimator for the gravity equation is far from conclusive. This paper examines the determinants of German outward FDI in Latin America and Asia for the period 1996-2012 by evaluating the performance of alternative Generalized Linear Model (GLM) estimators. Our findings indicate that Negative Binomial Pseudo Maximum Likelihood (NBPML) is the estimator best matched to our data, followed by Gamma Pseudo Maximum Likelihood (GPML). Furthermore, German FDI in Latin America is found to be predominantly vertical in nature, whereas that in Asia is mainly market-seeking.

1. Introduction

The opening up of developing countries throughout the last few decades has led to increasing inward Foreign Direct Investment (FDI) flows to those countries. Especially emerging economies in areas such as Latin America and Asia began to receive substantial and growing FDI inflows during the second half of the 1990s. FDI flows to Latin America and the Caribbean accounted for 38 percent of total flows into all developing countries in 1997, whereas the Asian region accounted for 57 percent of flows into developing countries UNCTAD (1998). As explained in Camarero et al. (2016), this FDI boom has been fueled by different factors in these two regions. The attractiveness of Latin America for FDI is mainly explained by the process of macroeconomic stabilization, as well as the initiatives of trade liberalization, privatization of state-owned companies, and deregulation undertaken in this region. Regional integration policies (such as Mercado Común del Sur (MERCOSUR)) and the implementation of free trade agreements have also contributed to stimulate FDI in Latin America by enlarging and improving their access to markets. On the contrary, the growth of FDI in the Asian region has to be credited largely to the hurried unilateral liberalization efforts of the economies, China being the rising star. Asian governments have played an important guiding and coordinating role in strengthening and building up a highly competitive export industry through the setting up of export processing zones and generously granted export subsidies and export credits. Equally important have been the government incentives designed to remove the obstacles to private investment and to improve the investment climate. In summary, Asian high Gross Domestic Product (GDP) growth and enormous population, its export-oriented strategy, and successful integration into the international production networks have generated new opportunities for foreign investors. This has been certainly the case of Europe and, in particular, Germany, whose FDI flows to these regions have considerably increased in recent years. In this context, we hypothesize that German FDI determinants might be different across these developing country groups, given the different opening up and industrialization strategies followed by the integrant countries. Germany has begun to place an increasing share of its FDI into these regions. Most notably, Asian countries account for 42.20% of total German outward FDI into all developing countries over the time period 1996–2012, while Latin American countries represent 34.67%.1 FDI to these emerging regions plays a key role in creating new job opportunities and enhancing growth. Accordingly, this gradually increase in FDI to these regions has been followed by a growing interest of local policymakers in designing policies to attract more investments to their soil. In this respect, the analysis of the factors underlying investor’s decisions in these regions has generated a growing academic and policy interest.
Recently, the gravity equation has become the “workhorse” tool to approximate bilateral FDI flows, given that it has proven to fit pretty well in trade applications, and the literature has provided a well-established theoretical foundation. Early theoretical studies include the contributions of Bergstrand and Egger (2007) and Head and Ries (2008) and, later on, Kleinert and Toubal (2010). The first two of these studies derived general equilibrium theories for FDI, whereas the latter showed that gravity equations can be used to discriminate between different theoretical approaches.
Despite these developments in the literature together with the use of panel data and other econometric improvements, there exists considerable uncertainty on its empirical application. Indeed, researchers have applied a variety of model specifications and estimation methods, resulting in a debate regarding the most appropriate estimator. Two main specific problems have been posited by the literature. The first one is related to the common practice of estimating the additive form (i.e., log-log form) of the gravity equation by taking logarithms of the original multiplicative form and estimating the resulting log-linearized model by Ordinary Least Squares (OLS). This practice has been proven to provide inconsistent estimates, as it can not deal with zero-valued bilateral FDI observations and heteroskedasticity in the data, as pointed out by Santos Silva and Tenreyro (2006; 2011).
The second problem described by the literature relates to the choice of the estimator that fully accounts for zero-valued bilateral FDI observations. FDI data commonly present a large proportion of zeros that cannot be neglected in order to provide consistent estimates. The seminal work Santos Silva and Tenreyro (2006) addressed these two concerns and recommended estimating the gravity equation in its multiplicative form through nonlinear estimators and, in particular, using the Poisson Pseudo Maximum Likelihood (PPML) estimator. Since then, the PPML estimator has become the golden rule in applied gravity empirical studies. Nonetheless, recent contributions have suggested the use of alternative estimators for gravity model estimation with inconclusive results (see Martin and Pham (2008); Martínez-Zarzoso (2013); Gómez-Herrera (2013), and Egger and Staub (2016), among others).
This paper seeks to contribute to the literature by providing a comprehensive understanding of the determinants of German outward FDI in a subset of Latin American and Asian countries. Table 1 reports the countries included in the study.2
To this end, we assess and compare the performance of alternative Generalized Linear Model (GLM) estimators—the Poisson Pseudo Maximum Likelihood (PPML), Gamma Pseudo Maximum Likelihood (GPML), Negative Binomial Pseudo Maximum Likelihood (NBPML), and Gaussian GLM—using a three-dimensional (i,j,t) FDI dataset covering the period 1996–2012. Overall, the results of the empirical study indicated that the NBPML estimator appeared to perform the best for our particular application, followed by GPML.
The analysis conducted gives two major contributions to the literature. First, we add to the literature on FDI determinants in developing countries by disentangling different FDI motivations of Germany, one of the major investors worldwide, in two developing country-groups: Latin American and Asian countries. Despite Germany being one of the largest investors, the study of its determinants has been rather neglected in the literature. Second, to the best of our knowledge, this is one of the first attempts of addressing uncertainty in the econometric specification of the FDI gravity model, given most of the studies focus on trade flows.
The remainder of the paper is organized as follows. Section 2 provides a brief review of the related literature on the econometric problems in gravity model estimation. Section 3 presents the alternative estimators considered and data used in our analysis. Our estimation results are presented in Section 4. Finally, Section 5 concludes.

2. Literature Review

2.1. Literature Review on Gravity Model Estimation

Most of the literature focused on the determinants of FDI has relied on the gravity model, which describes the volume of international flows (such as FDI) between two countries as directly proportional to their economic sizes and inversely proportional to distance (in the sense of trade frictions or investment costs). Initially, the gravity model for FDI lacked a theoretical foundation, and it was frequently applied by resemblance to trade flows. It was not until recently that economists, notably Bergstrand and Egger (2007) and Head and Ries (2008), derived a general equilibrium theory for FDI bilateral flows.
Currently, while the theoretical foundation of the FDI gravity model is well-established, there exists considerable uncertainty on its empirical application. Even though the literature devoted to analyzing the determinants of FDI is vast, the results are inconclusive due to the variety of model specifications and estimation methods applied by researchers. In this section, we provide a brief survey of the most widely extended estimation methods alongside related empirical literature. See Wölwer et al. (2018) for a more comprehensive discussion.
The traditional practice in the literature has been to take logarithms of the original multiplicative form of the gravity model and estimate the resulting log-linearized model using the OLS estimator (Brainard (1997); Brenton and Di Mauro (1999); Buch et al. (2003)). Nevertheless, this approach has been proven to provide misleading estimates. This is because it fails to deal with heteroskedasticity and zero FDI observations, which are frequent in FDI data. The work in Santos Silva and Tenreyro (2006) pointed out that, in the presence of heteroskedastic data, the expected values of the log-linearized error term will depend on the regressors, thus leading to inefficient estimates. Accordingly, they recommend the estimation of the gravity model in its original multiplicative functional form by means of nonlinear estimators. More precisely, they propose the use of the PPML estimator as it is argued to yield consistent estimates under heteroskedasticity and accounts for zero-valued FDI observations. Heteroskedasticity in the data and how to deal with zero values in the dependent variable are the two most common specific problems often encountered in FDI gravity model estimation (see Jehan (2014) for an overview).
Over the last few decades, both new developments in the literature and the availability of panel data led researchers to the use of panel econometric techniques. The application of panel econometric methods to gravity estimation allows accounting for the unobserved heterogeneity in FDI data. Besides, the multilateral resistance in gravity models is properly captured by the introduction of country-specific dummies. Specifically, the fixed effects and random effects estimators have been the two most common panel econometric methods applied by the literature. The underlying assumption of the fixed effects estimators is that the individual unobserved heterogeneity is correlated with the regressors. On the contrary, the random effects assumes no correlation between the unobserved individual characteristics and the regressors. Both estimators provide consistent parameters under the assumption of no correlation; yet, if this assumption does not hold, the random effects model is no longer consistent. However, there might be serious drawbacks of such estimators, given the number of fixed effects included (see Baltagi et al. (2014) for a thorough discussion). First, the estimation might imply computational difficulties. Second, the inclusion of dyadic fixed effects prevents the estimation of the coefficients of time-invariant regressors (such as distance, common language, or common borders, among others) due to perfect collinearity. Third, these estimators do not tackle the problem of zero FDI observations. More specifically, the work in Matyas (2017) provided a broad survey of the empirical issues in gravity model estimation when using panel data. In particular, these econometric problems relate to the estimation of log-linear versus exponential-family models, the dependence of data in the time (dynamics) or cross-sectional dimension (spatial), as well as the treatment of an excessive mass of zeroes.
In relation to the problem of zero FDI observations, some studies have proposed to add a small constant to the dependent variable before transforming the model by taking logarithms. However, this approach is not theoretically founded, and the results are strongly dependent on the magnitude of the constant Head and Mayer (2014). Another solution proposed by the literature is the use of the Tobit model. The Tobit estimator replaces zero observations by a constant, thus solving the problem of excessive zeros in the dependent variable. Nonetheless, the assumptions of the model are considered too restrictive to the extent that they imply that the same variables would determine the decision to invest and the amount of investment Gómez-Herrera (2013).3 Accordingly, the Heckman two-step estimator, which assumes independence among the selection and outcome equations, has been proven to provide a better fit. The work in Gómez-Herrera (2013) compared the performance of the most frequently applied estimation methods for the gravity model of trade. The author concluded that the Heckman sample selection model was the best performing estimator under the problems of heteroskedasticity and excess zeros in the dependent variable.
Following up on the argument in Santos Silva and Tenreyro (2006), the literature turned towards the use of multiplicative functional form estimators, which include Generalized Linear Models (GLMs), as well as two part models. More specifically, the PPML has been the most widely used estimator for gravity model estimation. Nevertheless, in recent years, a literature has emerged trying to address the question of whether the PPML is actually the best performing nonlinear estimator or alternative GLMs should be considered. The work in Martin and Pham (2008) claimed that the PPML estimator is not robust to the joint problems of heteroskedasticity and zero observations in the dependent variable. Therefore, the authors recommended estimating gravity models using the ET-Tobit estimator. The work in Burger et al. (2009) stressed that the PPML estimator could provide inconsistent estimates under overdispersion, in case the mean was wrongly specified. Hence, they proposed the use of NBPML to account for overdispersion. However, under the presence of excessive zeros in the dependent variable, they recommended the Zero-Inflated Negative Binomial (ZINBPML) and Zero-Inflated Poisson model (ZIPPML). In another study comparing the performance of alternative GLMs estimators, the work in Egger and Staub (2016) provided also support for the NBPML.
In case of an unknown form of heteroskedasticity, the work in Martínez-Zarzoso (2013) recommended the Feasible Generalized Least Squares (FGLS) estimator; whereas she showed that GPML performed better in the absence of zeros in the dependent variable. In response to these studies, the work in Santos Silva and Tenreyro (2011) provided further evidence for the PPML estimator and showed its consistency even in the presence of overdispersion or a large share of zero-values in the dependent variable. The work in Head and Mayer (2014) also showed that PPML was robust under overdispersion, as well as GPML; yet, they highlighted that GPML outperformed PPML for certain empirical applications.
Overall, the literature has seen a growing debate about the most appropriate estimator for the gravity model. In this respect, alternative estimators should be compared in order to identify the proper estimation of the model.

2.2. Related Literature

The literature on FDI to developing economies can be classified into three strands. The first strand focuses on the link between FDI and economic growth. Most empirical studies seem to suggest a positive impact of FDI on economic growth. Nevertheless, the work in Zhang (2001) pointed out that this effect depends on country-specific characteristics, such as the degree of trade regime, the quality of education, the existence of a favorable environment to export-oriented FDI, and macroeconomic stability. Using cointegration techniques, his findings showed that FDI was more prone to promoting economic growth in East Asia than in Latin America. Similarly, the work in Herzer et al. (2008) re-examined the FDI-led growth hypothesis for 28 developing countries using cointegration techniques. Yet, their results showed that there was no clear association for the FDI-enhancing growth effect, given they did not find a positive long-term effect for any of the countries examined. In a similar vein, the work in Huang et al. (2010), using panel data of 12 middle-income countries in East Asia and Latin America, showed that economic growth and trade openness were associated with poverty reduction; yet, both outward and inward FDI negatively affected the mean income of the poorest quintile of the population, and this effect seemed to be stronger for Latin American countries. Similarly, the work in Camarero et al. (2016), using a panel co-integration approach for the period 1980-2008, showed a positive association between trade and GDP in Asia and Latin America. Yet, the magnitude of the effect was lower in the case of Latin America.
The second strand of literature has been interested in the importance of the opening up of developing economies to trade for attracting FDI flows. The large majority of empirical studies seem to suggest that developing markets that are more open are more likely to attract FDI inflows. For instance, the work in Liargovas and Skandalis (2012), using a cross-country panel data model from several developing regions (Latin America, Asia, Africa, CIS (Commonwealth of Independent States), and Eastern Europe) found that trade openness positively impacted FDI inflows. Recent studies have emphasized the association between a country’s degree of GVCparticipation and FDI attraction. See Hauge (2020) for Asian economies.
The third strand of studies, comprising relatively more recent work, focuses on the factors explaining the location of FDI in developing countries. Several studies have examined the impact of the implementation of international investment treaties and regional trade agreements on FDI inflows, such as Büthe and Milner (2008); Dixon and Haslam (2015), or Cherif and Dreger (2018), among others. The work in Antonakakis and Tondl (2015) applied Bayesian statistical techniques to identify the determinants of FDI originating from major OECD investors, including Germany, over the period 1995-2008 in 129 recipient developing countries. Their findings showed that large markets, macroeconomic stability, and institutional factors were key variables for explaining German FDI in Latin American countries, while for Asian countries, established trade relations, openness, high labor productivity, big market size, as well as low telecommunications infrastructure were key for FDI attraction. Similarly, the work in Camarero et al. (2019b), using a different Markov chain Monte Carlo (MCMC) method for the Bayesian analysis, concluded that even though the size of the market was key for FDI in both Latin American and Asian countries, also vertical FDI prevailed in Asian countries, whereas the quality of institutions was key for German investment in Latin America.

3. Methodology and Data

For our estimations, we adopted the econometric specification for the FDI gravity model of Kleinert and Toubal (2010):
A S i j = s i ( τ D i j η 1 ) ( 1 σ ) ( 1 ) m j
where A S i j are aggregate sales of foreign affiliates from firm i in j; s i and m j denote home and host country’s market capacity, respectively; and τ D i j η 1 stands for geographical distance between i and j, where τ represents the unit distance costs and η 1 > 0 .
As discussed in Section 2, the estimation of the log-linearized form of this model has proven to be problematic. Accordingly, we relied on alternative GLM estimators with a logarithmic link function in our empirical analysis. GLMs estimate the gravity models in their multiplicative form as:
y i = e x p ( x i β i ) ϵ i
where E ( ϵ i | x ) = 1 , y i is the dependent variable, x i are the explanatory variables, and β are the parameters to be estimated.
Some empirical applications of GLMs estimators for gravity models can be found in Egger and Staub (2016) or Martínez-Zarzoso (2013). GLMs were considered for two reasons: First of all, GLMs estimate the gravity model in its original multiplicative functional form, which allowed us to avoid the econometric problems encountered when estimating the log-linear form of the model. Secondly, the functional form of these estimators allowed naturally dealing with zero FDI observations as the dependent variable was included in levels. More specifically, we considered the most frequently used GLM estimator, the Poisson Pseudo Maximum Likelihood (PPML) estimator, alongside alternative estimators recommended by recent contributions to outperform PPML in specific applications: the Gamma Pseudo Maximum Likelihood (GPML) and the Negative Binomial Pseudo Maximum Likelihood (NBPML) estimators. For the sake of comparison, the Gaussian GLM was also included. The key attributes of these estimators were the assumption on the conditional mean-variance relationship and thereby the weighting scheme of the observations. PPML assumes that the variance is proportional to the mean, thus equally weighting all observations. GPML assumes that the variance is a function of higher powers of the mean, and thereby, it down-weights observations with larger means. The same applies to the NBPML estimator, although this one assumes that the variance is a specific quadratic function of the mean. Gaussian GLM, in turn, assumes that the variance equals one, thus assigning more weight to noisier observations (i.e., with a larger variance). We refer the reader to Camarero et al. (2019a) for a detailed description of the alternative estimators together with their advantages and disadvantages.
In particular, the FDI gravity equation to be estimated is as follows:
F D I i j t = e ( β 1 k X i k t + β 2 Z i j t + λ j + γ t ) + ϵ i j t t = 1 , . . . , T , k = 1 , , K
where F D I i j t denotes outward FDI stock from country i to country j in any period t. Matrix X i k t denotes all k FDI long-run macroeconomic determinants specific to the destination country. Specifically, for Latin American countries, the explanatory variables included are: HOST population, HOST education level, HOST trade openness, HOST telephones, HOST internet users, HOST political rights, HOST voice and accountability and HOST political stability; whereas for Asian countries, the variables considered are: HOST GDP per capita, Exchange rate, HOST Internet users, HOST civil liberties, and HOST voice and accountability; while Z i j t contains bilateral determinants such as Similarity of HOST and PARENT real GDP, Squared GDP difference, and Interaction of GDP differences with skill differences for the Latin American countries’ estimation; or Sum of HOST and PARENT real GDP for the Asian countries’ estimation. Additionally, we included host country fixed effects λ j and time fixed effects γ t . Lastly, ϵ i j t is an error term such that ϵ i j t N ( 0 , σ 2 ) .
We used the dataset applied in Camarero et al. (2019b) for the selection of the main determinants of German outward FDI stock using a Bayesian Model Averaging (BMA) approach, which included data for 59 destination countries (38 developed and 21 developing ones) and covered the period 1996–2012.4 For our purpose, we restricted the sample to Latin American and Asian countries. Their FDI data were obtained from the UNCTAD’s Bilateral FDI Statistics.5
The explanatory variables that we included were those selected (see Camarero et al. (2019b)) as robust FDI determinants in the BMA analysis for these country-groups. A list of the considered variables and sources is provided in Table A1, whereas Table A2 reports the descriptive statistics for each country-group.
Using the aforementioned variables, we estimated the FDI gravity model by means of four alternative GLMs estimators and applied a backward elimination (BE) procedure in order to identify those variables that were statistically significant.6 Our model selection approach was based on several goodness-of-fit statistics and graphical techniques that allowed us to select the best performing estimator for our dataset. Once the most appropriate GLM estimator was identified, we examined the determinants of German outward FDI in Latin American and Asian countries.7

4. Results

The empirical results are presented in two subsections. First, in Section 4.1, we evaluate and compare the performance of the alternative GLMs estimators. Second, in Section 4.2, we discuss the economic implication of the estimation results for the best performing estimator for each of the host country-groups separately.

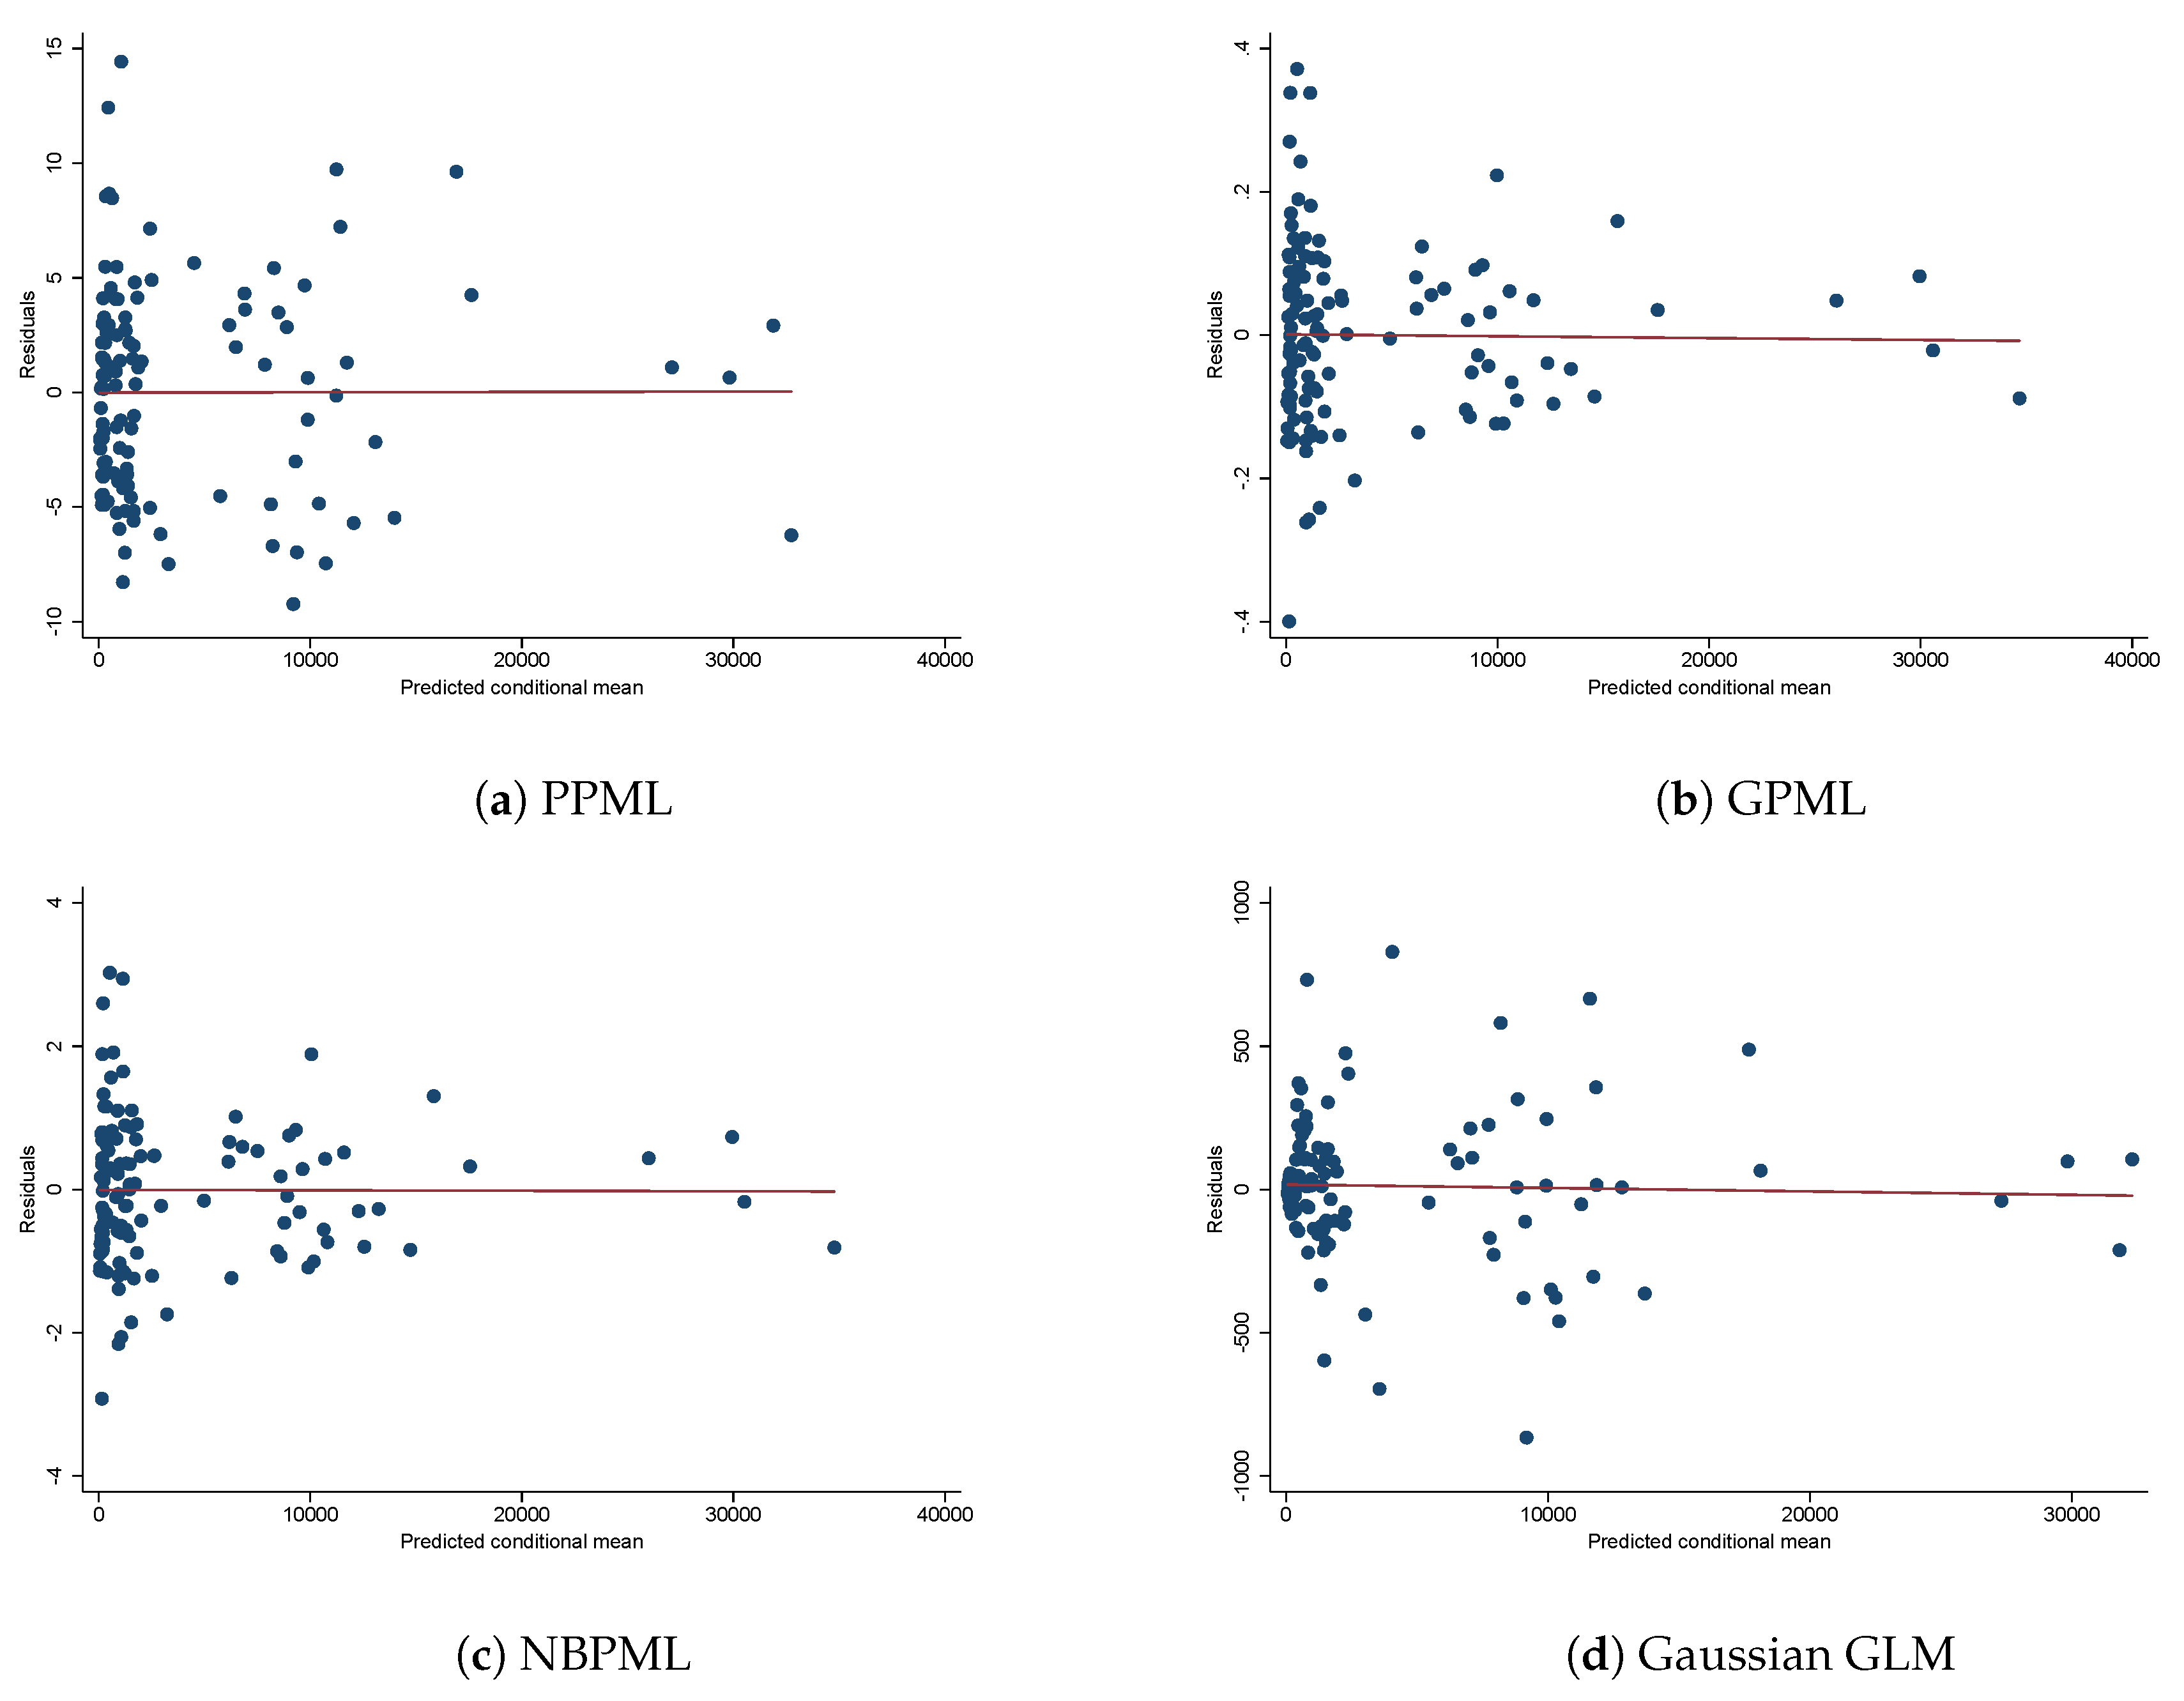
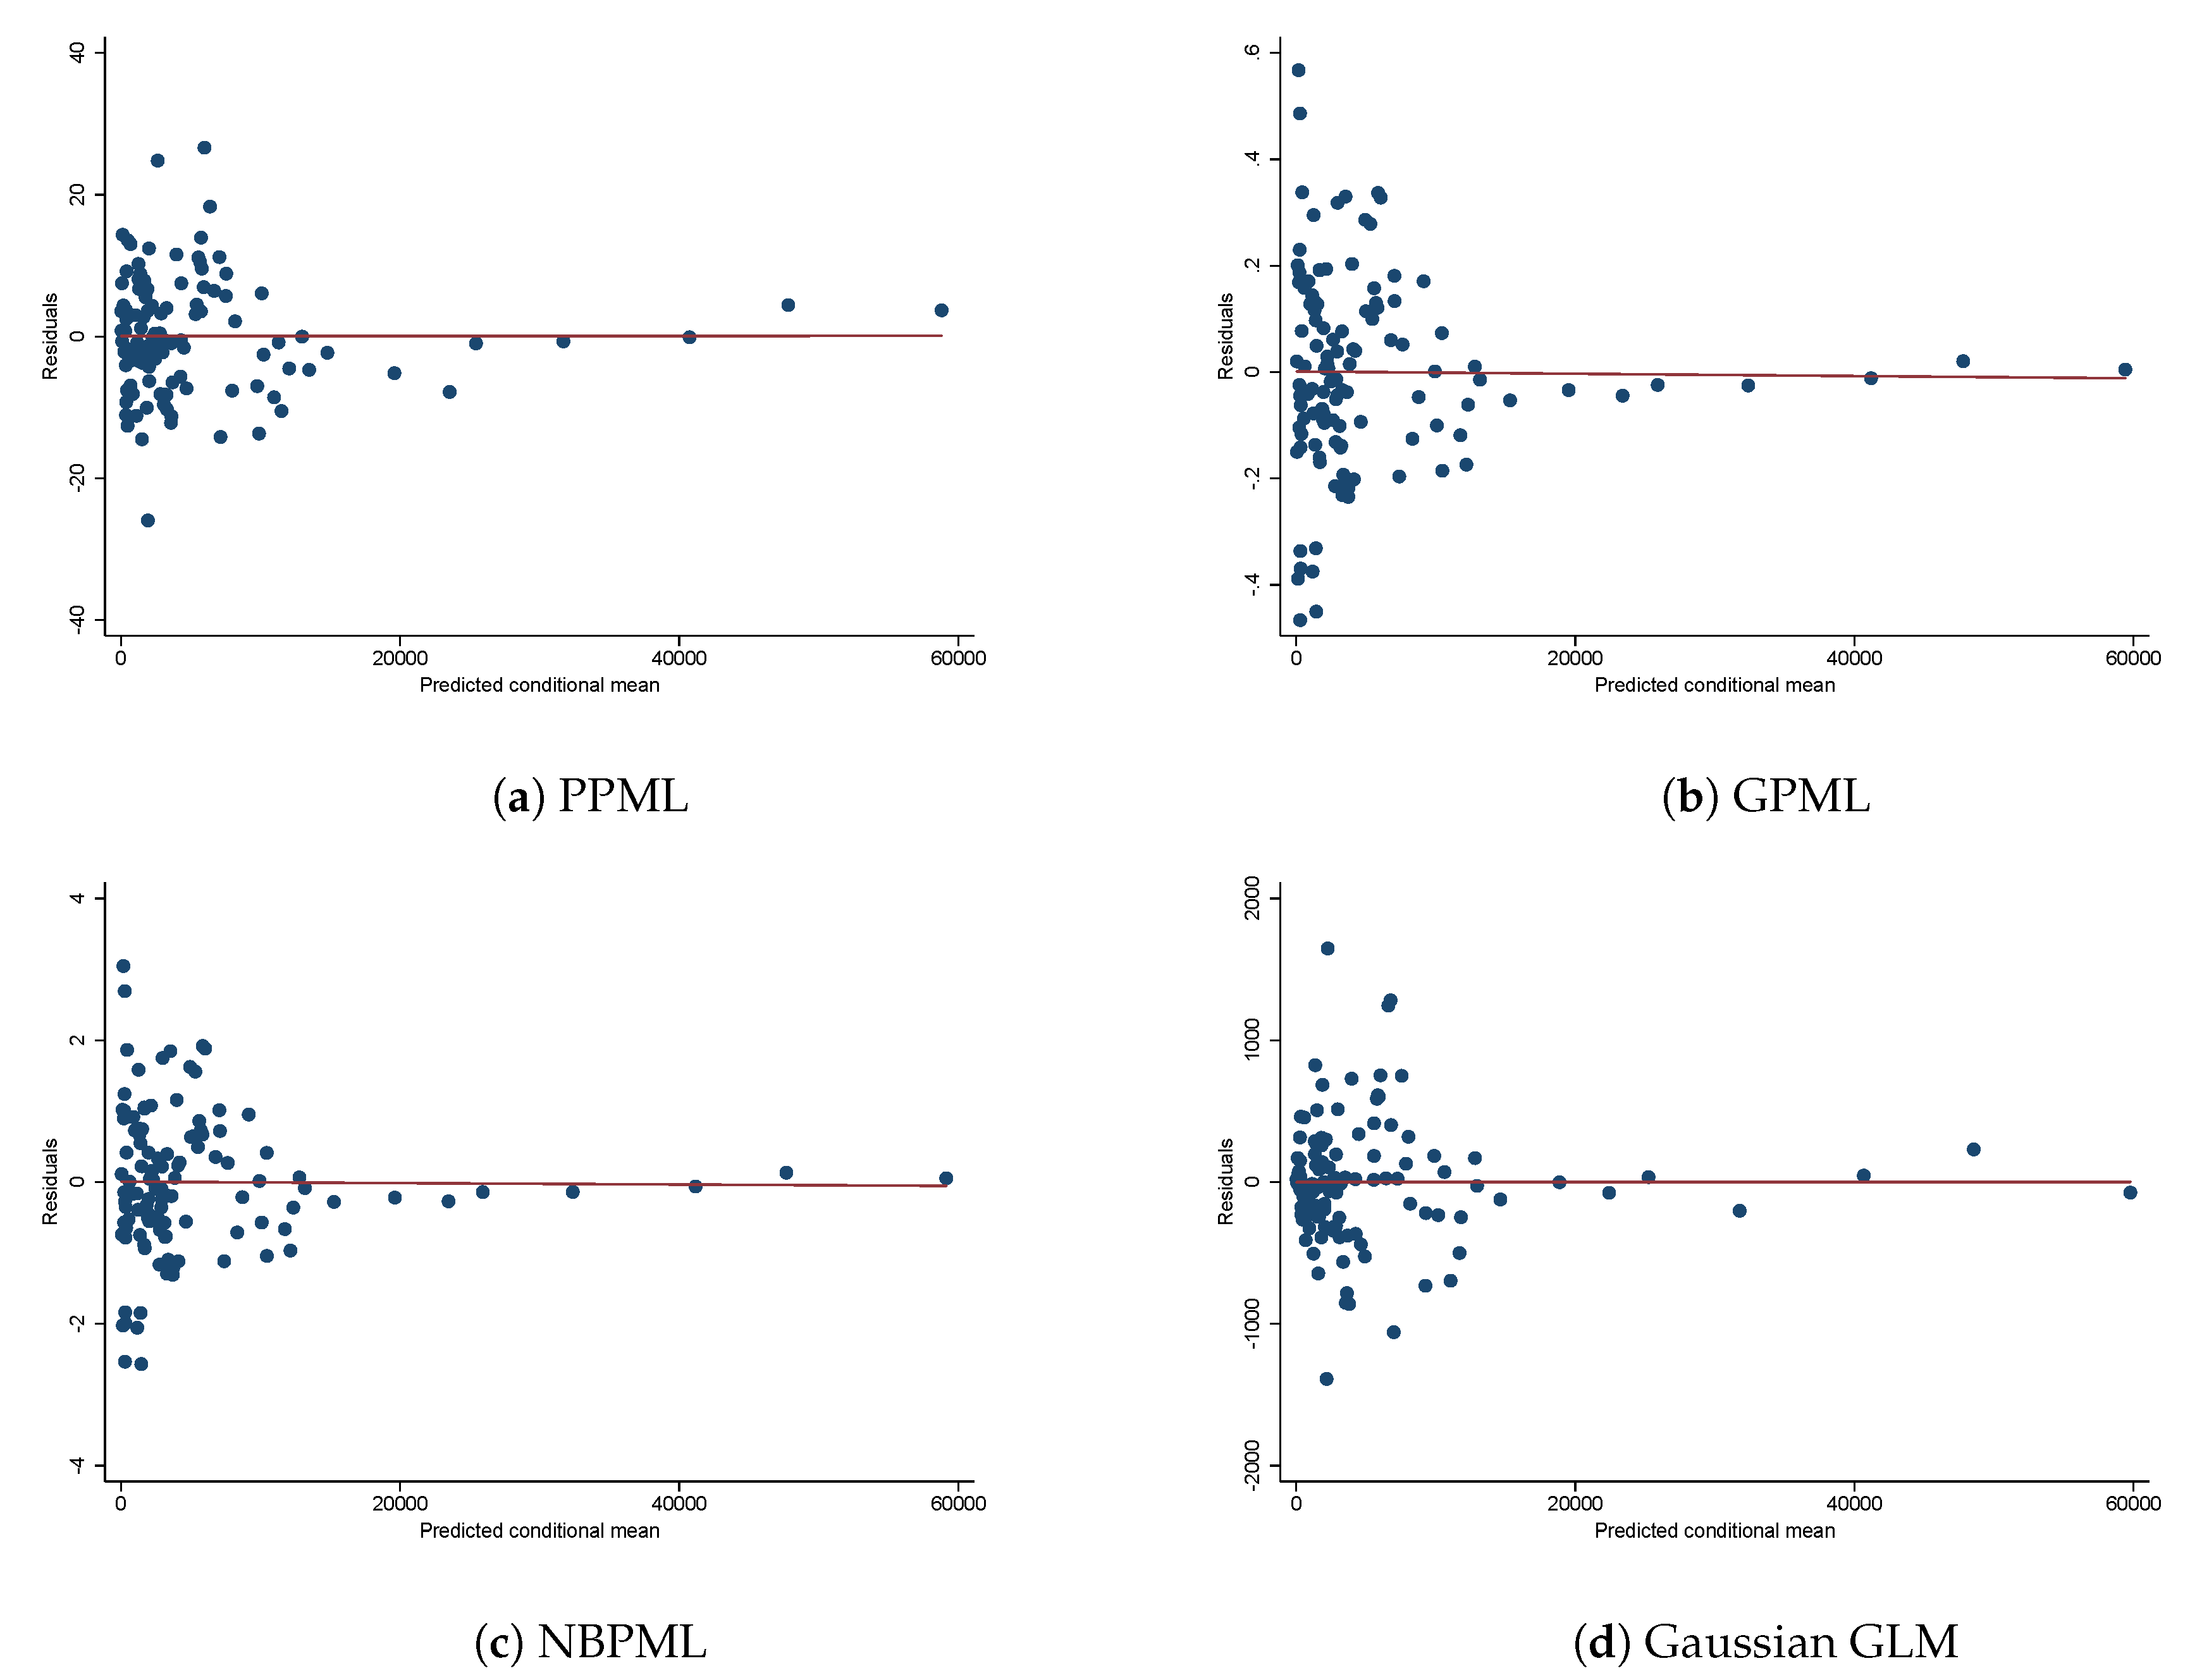
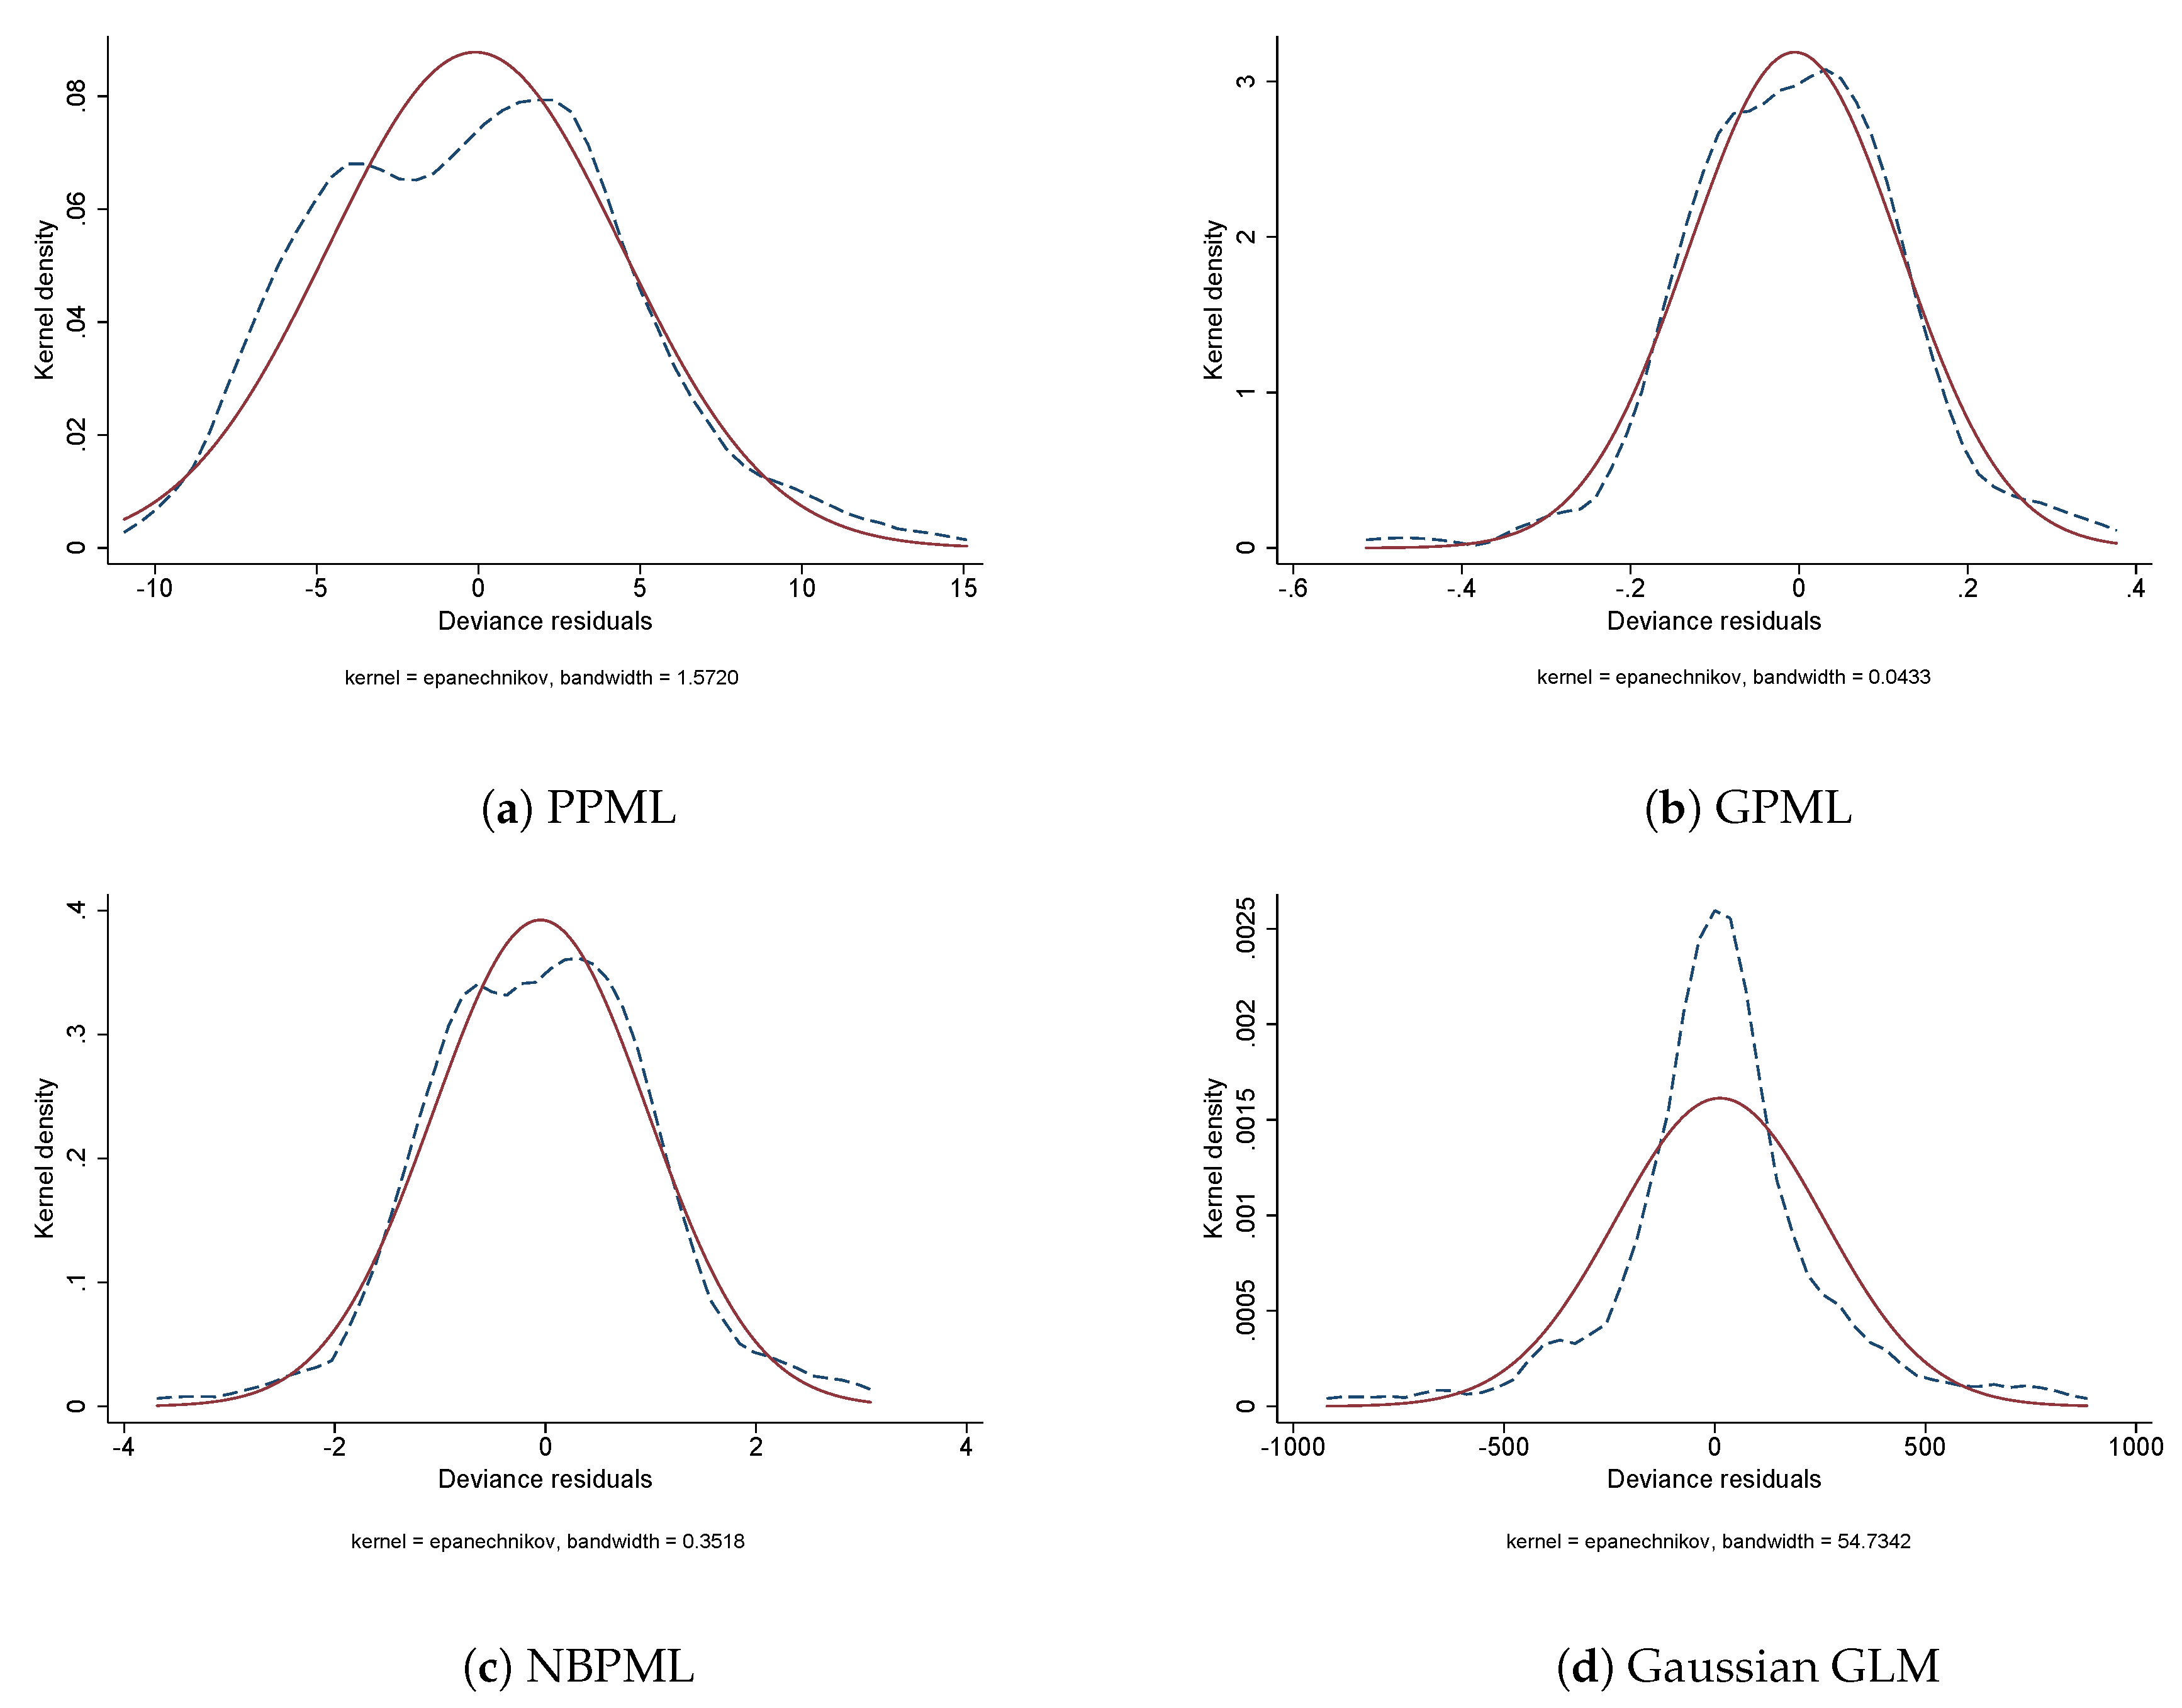
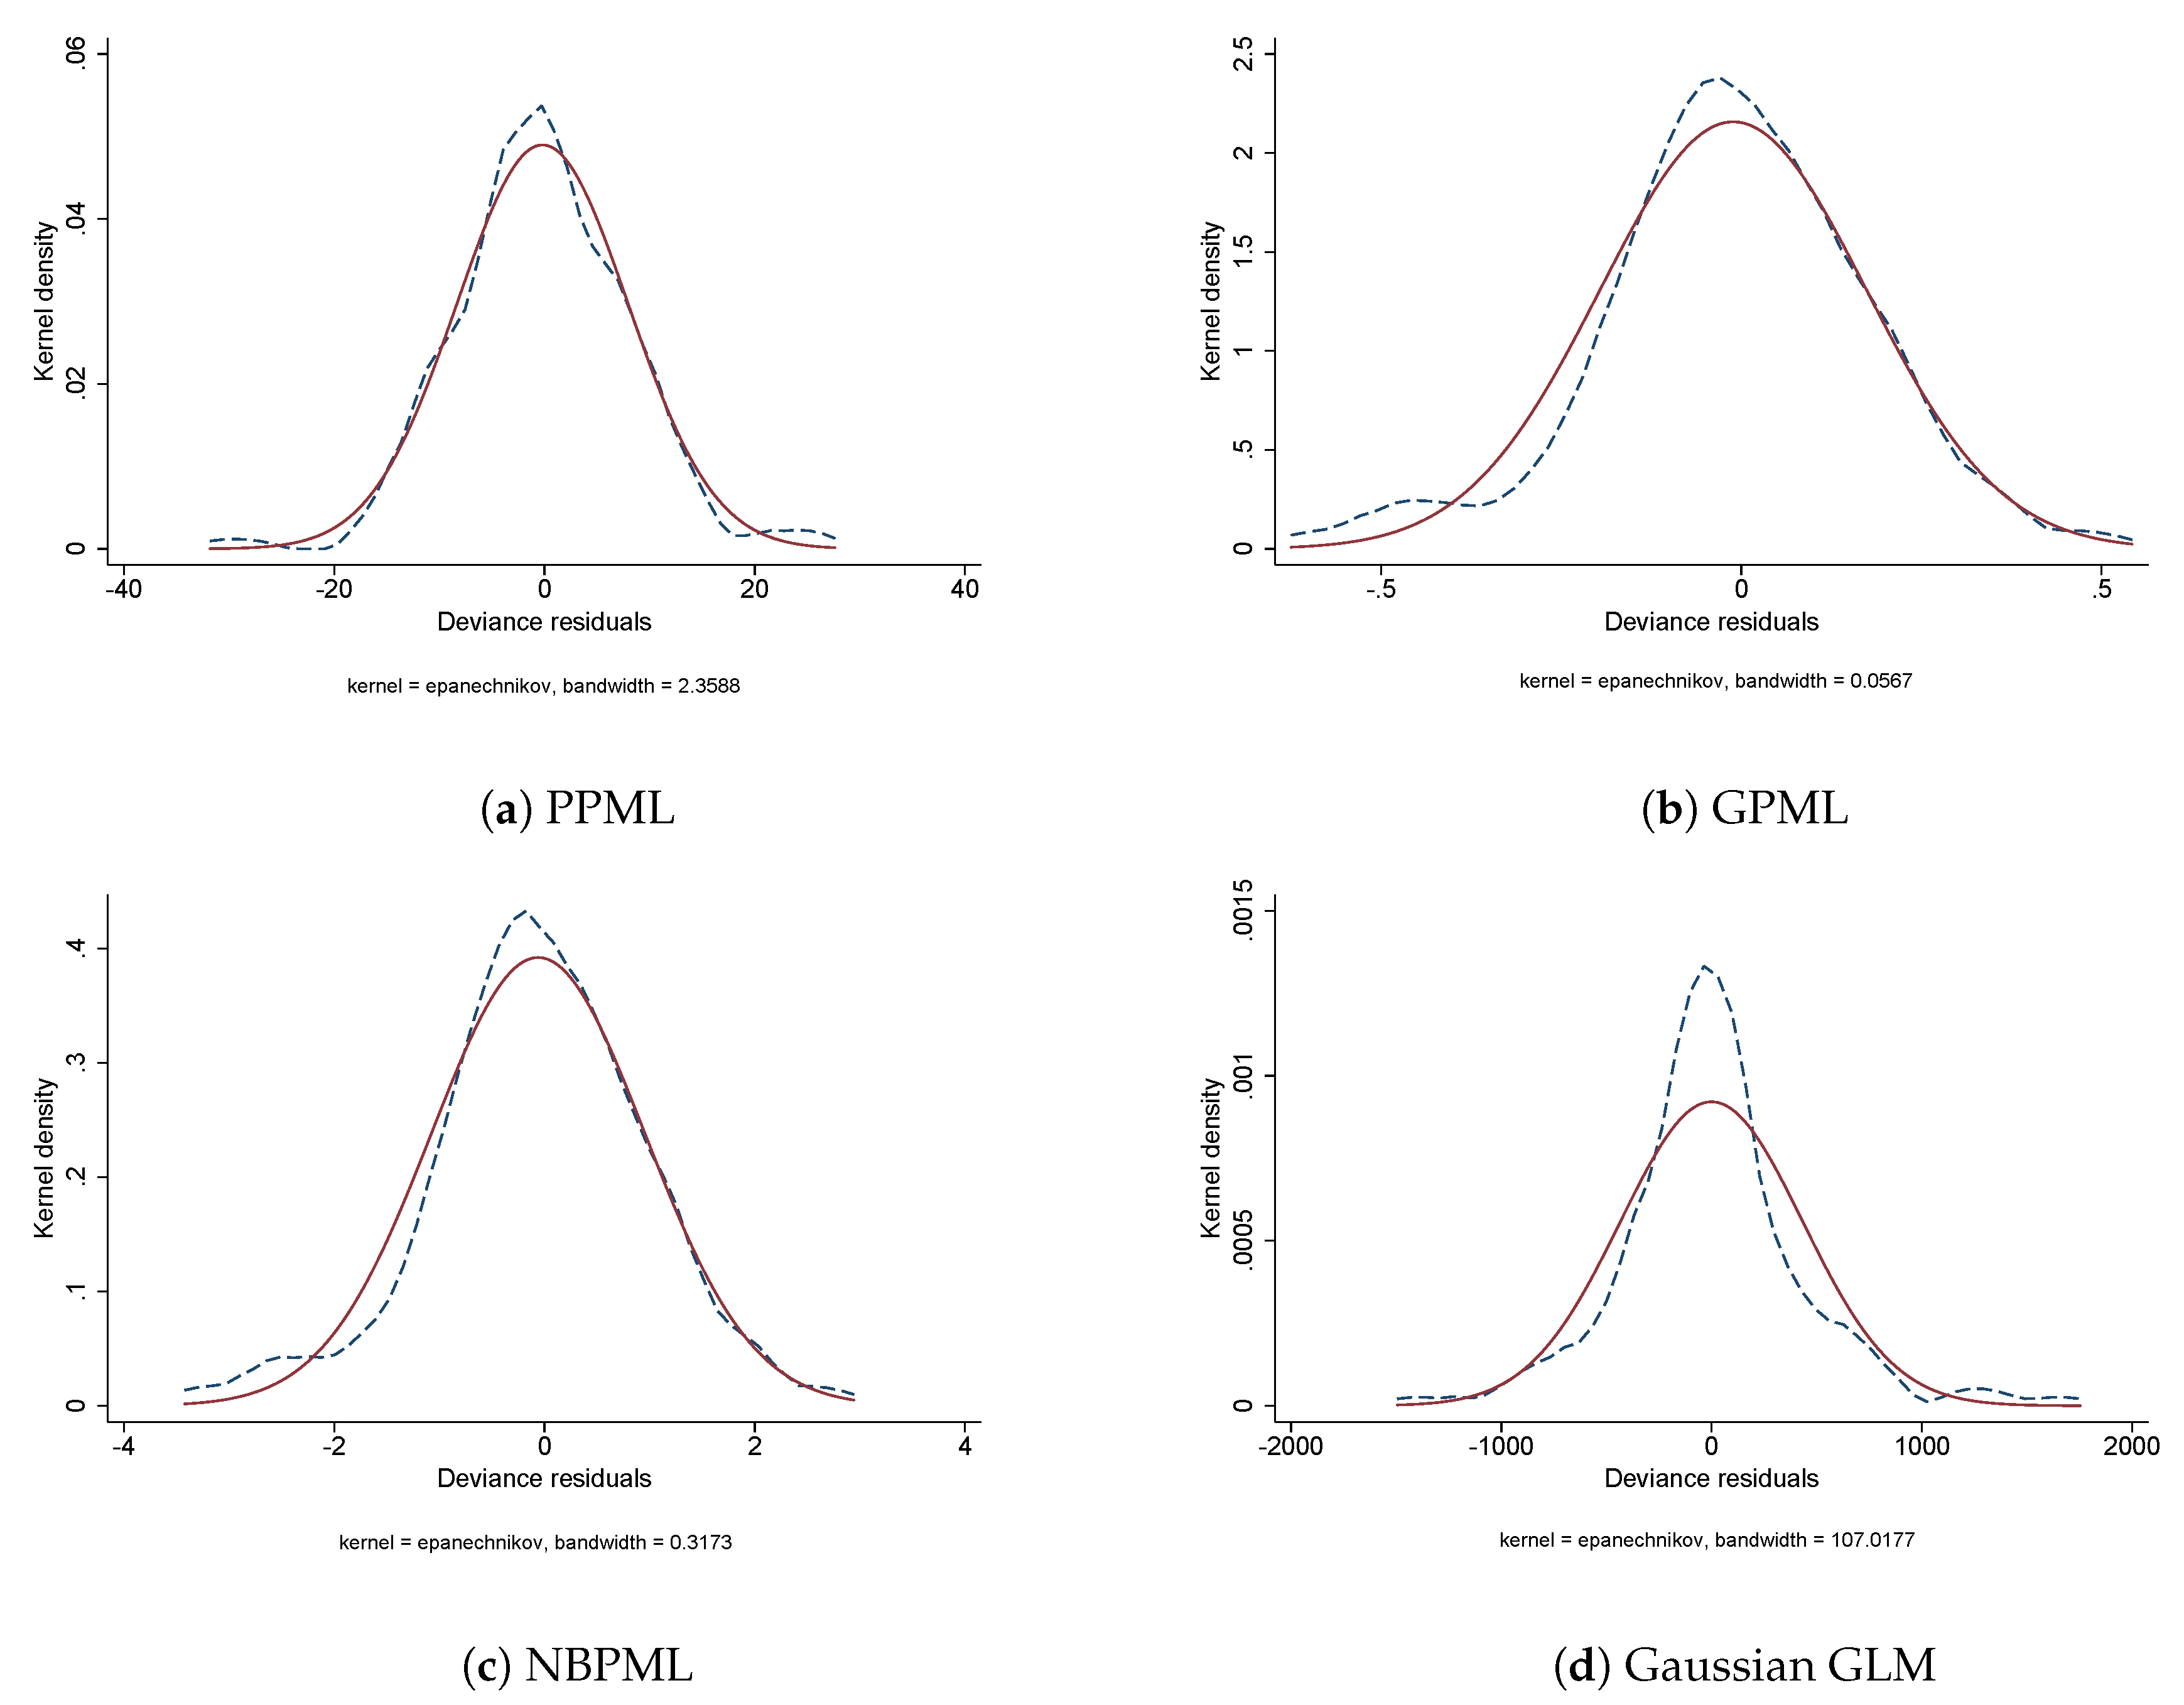
4.1. A Comparison of GLM Estimators

To evaluate the performance of the estimators, we relied on different measures of the goodness-of-fit and graphical techniques. First, the adequacy of the model was assessed using the Ramsey (1969) Regression Equation Specification Error Test (RESET). More precisely, the RESET test was designed to identify if there were any neglected nonlinearities in the model. Rejection of the null hypothesis of a correctly specified model would imply there was a functional form misspecification. The Akaike Information Criterion (AIC) and the Bayesian Information Criterion (BIC) were also used to compare the quality of the estimators. The smaller the AIC or BIC values, the better the fit. Similarly, we computed the deviance and dispersion of the estimators; the smaller the better. Furthermore, we considered three goodness-of-fit functions. These were the bias, the mean squared error (MSE), and the absolute error loss. A key attribute of the latter was that over- and under-estimations were not canceled out as argued by Martínez-Zarzoso (2013).
The results of the mentioned goodness-of-fit statistics are provided at the bottom of Table 2 and Table 3 for Latin American and Asian countries, respectively. Our findings indicated that the PPML was the only estimator that passed the RESET test at the 5% significance level for the sample of Latin American countries; whereas for the Asian countries’ sample, all the estimators considered passed the test. Whereas the NBPML presented the lowest AIC among the country-groups, the GPML had, in both samples, the lowest BIC, deviance, and dispersion. All the estimators presented similar magnitudes in their bias, variance, and error loss. However, the Gaussian GLM had the lowest bias for Latin America and the PPML estimator for the Asian group. For both country-groups, the GPML estimator had the lowest variance followed by NBPML. Likewise, the GPML exhibited the least error loss for Latin American countries; whereas for Asian countries, the NBPML presented the least error loss.
Finally, the scatterplots of the Pearson and deviance residuals are provided in order to examine the specification of the variance function. The Pearson residuals, depicted in Figure 1 and Figure 2, should show mean-independence for a proper specification of the variance function, that is we should expect a horizontal line. Accordingly, the plots revealed that the NBPML and GPML estimators appeared to perform better than PPML and Gaussian GLM for both country-groups. The deviance residuals, in turn, should be approximately normally distributed for a correct model specification. These are illustrated in Figure 3 and Figure 4.8 The deviance residuals’ plots clearly indicated that for the Latin American sample, NBPML performed the best, followed by GPML. In the case of the Asian countries, the evidence for NBPML was less clear as it seemed that PPML was also approximately normally distributed. Table 4 shows the best performing estimator according to the goodness-of-fit statistics and graphical techniques for each country-group. Overall, the goodness-of-fit statistics and the visual inspection of the residuals indicated that NBPML and GPML performed better than PPML and Gaussian GLM. Nevertheless, we finally considered NBPML to be the best performing estimator for our data, given that the Pearson and deviance residuals are the most widely extended measures for evaluating GLMs (see McCullagh and Nelder (1989)).

4.2. German FDI in Developing Countries

In what follows, we discuss the results of the best performing estimator, NBPML. The estimated coefficients are provided in Table 2 and Table 3. Note that GPML yielded the same results with similar estimated coefficients and signs. Interestingly, the same applied for PPML and Gaussian GLM estimators. Note also that by considering GLMs with a logarithmic link function, the coefficients could be interpreted as semi-elasticities Cameron and Trivedi (2009). The findings revealed different sets of key factors for FDI attraction across country-groups, thus involving a mixture of FDI motivations as highlighted by Faeth (2009). A thorough discussion of German FDI motivations in each country-group is provided in the next subsections. Section 4.2.1 reports the results for Latin American countries, whereas those of Asian countries are reported in Section 4.2.2.

4.2.1. German FDI in Latin American Countries

Looking at the coefficients for the NBPML specification in Table 2, we found that all the variables postulated by the BMA analysis in Camarero et al. (2019b) remained robust FDI determinants. The coefficient on the similarity index (Similarity of HOST and PARENT real GDP) was positive, highly significant, and close to one, in line with the findings of Baltagi et al. (2007) for U.S. outward FDI. This result suggested that German MNEssought for market access in Latin American countries, thus pointing to Horizontal FDI activity (HFDI).
The variable capturing squared GDP difference (Squared GDP difference) was found to be negative and highly significant; the coefficient was roughly 2 . As signaled by Carr et al. (2001) and Blonigen et al. (2003), this evidence was consistent with the knowledge-capital and HFDI models, which postulates that FDI is usually larger among similar countries. In terms of the magnitude, our estimate was larger than the estimate of Martínez-San Román et al. (2016) for FDI flows within the European Union.
Host country population (HOST population) was negatively related to inward FDI, as previously stated in the literature (see Brenton and Di Mauro (1999) or Gutiérrez-Portilla et al. (2019), among others). This was consistent with the gravity model and supported the notion that an increase in population reduced a country’s GDP per capita and, thereby, FDI.
The availability of land area (ln_h_area) was also found to positively impact inward FDI as predicted by the gravity model. This finding certainly reflected the interest of German investors in the relatively abundant land area of Latin American countries (such as Brazil and Uruguay), which was motivated by the high global prices for agricultural and non-agricultural commodities, especially sugar and soybeans, as well as new business opportunities Deininger et al. (2011).
Our finding concerning the interaction of skill differences with GDP differences (Interaction of GDP differences with skill differences) was consistent with the results drawn by Markusen and Maskus (2001) and Blonigen et al. (2003). We found a positive and highly significant impact on inward FDI, with an estimated coefficient close to 0.5 .9
Contrary to our expectations, the coefficient on education level (HOST education level) was negative and highly significant. One potential explanation for this finding was that the variable might be acting as a proxy for wages. In this case, the negative effect was consistent with vertical FDI. This finding would thus provide evidence of the notion that German MNEs located specific phases of the production process in Latin American countries seeking to minimize production costs.
Somewhat surprising, the variable accounting for trade openness (HOST trade openness) was found to negatively impact inward FDI. A possible explanation for this finding was that the gradual increase in the degree of openness of Latin American economies to trade encouraged MNEs to serve these markets through exports rather than engaging in HFDI.
While fixed telephone subscriptions (HOST telephones) were found to discourage FDI by 0.711%, Internet users (HOST Internet users) encouraged FDI by 0.374%. These findings were in accordance with the increase of mobile cellular subscriptions to the detriment of the fixed ones in recent times and, in particular, the reduction in the costs of doing business derived by the access to the worldwide network.
Our findings also provided evidence that institutional factors were important determinants of German FDI in these economies. The coefficient associated with the political rights index (HOST political rights) was positive and statistically significant. This supported the idea that lower levels of democratic rights may be seen as an attractive factor for investors in developing countries. Furthermore, the democratic notion of “pluralism”, captured by the voice and accountability index (HOST voice and accountability), exerted a negative impact on inward FDI. This was consistent with previous literature that suggested that more democratic pluralism in a host country tended to weaken market powers of MNEs, decreasing inward FDI (see Li and Resnick (2003); Li and Reuveny (2003)). Finally, the political stability index (HOST political stability) exerted a statistically significant positive impact on inward FDI. This reflected the importance of a stable host government for investments.

4.2.2. German FDI in Asian Countries

When looking at the NBPML estimated coefficients in Table 3, we found a significant effect of six variables out of the eight singled out by the BMA analysis in Camarero et al. (2019b). Concretely, GDP per capita (HOST GDP per capita) and exchange rate (Exchange rate) were dropped out by the BE procedure.
The variable accounting for market size (Sum of HOST and PARENT real GDP) was found to be positive and highly significant. The estimated coefficient indicated that, ceteris paribus, a 1% increase in market size increased inward FDI stock, on average, by approximately 1.8%. The magnitude of the coefficient was very similar to the estimate of Martínez-San Román et al. (2016), who found an impact of around 1.5% for FDI within the EU. This result was also consistent with the idea that German MNEs invest largely in Asian countries, such as China or India, to access their large-sized markets.
A better educated workforce (HOST education level) was found to positively impact inward FDI. Although the magnitude of the estimated coefficient was somewhat larger than the estimates of previous empirical studies (see, for instance, Basile et al. (2008)), this result was in line with the notion that a highly educated workforce should foster productivity, and thereby the profitability of MNEs activities.
Compared to the estimation results for Latin American countries, we found a similar relevance (in terms of significance) of the number of Internet users (HOST Internet users) for Asian countries. However, the estimated impact ( 0.080 % ) was smaller in the latter.
Our results also showed that institutions were important factors in FDI decisions. We found a positive and statistically significant impact of the civil liberties index (HOST civil liberties). This was consistent with Adam and Filippaios (2007) who argued that a certain level of civil liberties repression attracted more FDI only when FDI was undertaken in order to minimize costs. More specifically, the authors predicted a non-linear effect, so that a low level of repression was attractive for MNEs, while a high degree of repression may deter FDI. This might be the case of German FDI in China. Finally, the voice and accountability index (HOST Voice and Accountability) turned out to be highly significant as well. In a recent contribution, the work in Berden et al. (2012) distinguished between the intensive and extensive margins of FDI and showed that pluralism (as measured by the Voice and accountability index) had a negative effect on FDI inflows at the intensive margin, but positive at the extensive one.

5. Conclusions

The liberalization efforts undertaken by developing and emerging countries over the last few decades, both multilaterally and unilaterally, have attracted an increasing amount of inward FDI. These flows have gone predominantly to Latin America and Asia, and among the source countries, Germany has had a predominant role. To the extent that FDI promotes job creation and economic growth, policymakers and academics have become increasingly interested in understanding the factors underlying investors’ decisions.
In particular, the gravity model approach has been successfully and frequently applied in several empirical studies analyzing the drivers of FDI. Nonetheless, there is a lack of consensus on the most efficient estimation methods that differ across studies. PPML has been considered the gold standard for gravity model estimation, but recent contributions in the literature have recommended the use of alternative GLM estimators.
This study presented further empirical evidence on this debate and contributed to some previously rather neglected aspects. On the one hand, it provided a comprehensive understanding of the factors determining German outward FDI to a subset of Latin American and Asian countries. On the other hand, it conducted an accurate evaluation of the performance of alternative GLM estimators for the FDI gravity model estimation. More precisely, the PPML, GPML, NBPM,L and Gaussian GLM. For our particular dataset, the empirical analysis revealed that NBPML was the best performing estimator for both geographical areas, followed by GPML.
In this respect, once the appropriate estimator was chosen, our findings brought further evidence on the determinants of German outward FDI to emerging market economies. Overall, determinants associated with both horizontal and vertical FDI motivations coexisted, in line with the capital knowledge model. Moreover, the quality of institutions and education played a major role in the two areas. However, the dominant internationalization strategy differed among these regions. In Asia, the state played a key role in the industrialization strategy, promoting an upgrading process that tended to substitute horizontally foreign investment, while in Latin America, the firms were the main actors through vertical integration value chains. Our results showed that, whereas German MNEs accessing Latin American markets were found to be predominantly seeking lower production costs by undertaking vertical FDI, in Asia, German FDI was found to be mainly market-seeking.

Author Contributions

The authors contributed equally to this work. All authors have read and agreed to the published version of the manuscript.

Funding

The authors acknowledge the public funding from the EU (ERDF, ESF) and the AEI-Spanish Ministry of Economy and Competitiveness (BES-2015-072395 and ECO2014-58991-C3-2-R and ECO2017-83255-C3-3-P projects), as well as the Valencian regional government (Generalitat Valenciana-PROMETEO 2018/102 project). Cecilio Tamarit and Mariam Camarero also acknowledge the funding from European Commission project 611032-EPP-1-2019-1-ES-EPPJMO-CoE. The European Commission support did not constitute an endorsement of the contents, which reflect the views only of the authors, and the Commission cannot be held responsible for any use that may be made of the information contained therein. All remaining errors are ours.

Acknowledgments

The authors are grateful to Astrit Sulstarova for providing us with the extended version of FDI stock from the UNCTAD’s Bilateral FDI Statistics database.

Conflicts of Interest

The authors declare no conflict of interest.

Appendix A

Table A1. Data description and source.
Variable NameDescriptionSource
FDI stockLog of bilateral outward FDI stock in millions (constant 2010 US$)UNCTADBilateral FDI database
GDP and Population Measures
Sum of HOST and PARENT real GDPLog of sum of HOST and PARENT real GDPWorld Development Indicators, World Bank
Similarity of HOST and PARENT real GDPLog of share of HOST real GDP in the sum of HOST and PARENT GDP * Share of PARENT real GDP in the sum of HOST and PARENT GDPWorld Development Indicators, World Bank
Squared GDP differenceLog of squared real GDP difference between HOST and PARENT countryWorld Development Indicators, World Bank
HOST populationLog of HOST population, total in mnGravity database from CEPII
HOST GDP per capitaLog of HOST GDP per capita in trillions (constant 2010 US$)World Development Indicators, World Bank
Distance and other geography measures
Time zone differencesNo. of hours difference between PARENT and HOSTGravity database from CEPII
HOST landlocked1 if HOST is landlockedGeoDistdatabase from CEPII
Factor endowments/productivity
HOST land areaLog of land area (km 2 ) in HOST countryGravity database from CEPII
Interaction of GDP differences with skill differencesLog(sq_gdp_diff * sq_skill_diff)ILOSTAT, World Development Indicators
HOST education levelLog of average years of schooling in the population aged 25 years and older, HOST countryPWT 9.0
Exchange Rate/Monetary policy
Exchange rateLog of real exchange rate in host country, national currency/USDPWT9.0
Trade openness
HOST trade opennessTrade (% of GDP)World Development Indicators, World Bank
Infrastructure
HOST Internet usersLog of Internet users (per 100 people) in HOST countryWorld Development Indicators, World Bank
HOST telephonesLog of fixed telephone subscriptions (per 100 people) in HOST countryWorld Development Indicators, World Bank
Institutions
HOST political rightsPolitical rights index for HOST country (Ranges from 1 to 7 with the highest score indicating the lowest level of freedom)Freedom House
HOST civil libertiesCivil liberties index for HOST country (Ranges from 1 to 7 with highest score indicating the lowest level of freedom)Freedom House
HOST voice and accountabilityVoice and accountability, in percentile rank (Ranges from 0 (lowest) to 100 (highest))World Governance Indicators (WGI), World Bank
HOST Political StabilityPolitical stability and absence of violence/terrorism, in percentile rank (Ranges from 0 (lowest) to 100 (highest))World Governance Indicators (WGI), World Bank
Table A2. Descriptive statistics.
VariableMeanStd. dev.Min.Max.
Latin American
FDI stock4032.016473.84246.3545732,412.2
Similarity of HOST and PARENT real GDP−2.195561.072832−4.109496−0.7367529
Squared GDP difference1.9344150.55492580.37830112.514491
HOST population3.3561851.2557941.1779125.291575
Interaction of GDP differences with skill differences−1.1636270.6811084−2.6187290.0771762
HOST education level2.0256530.1538961.6153272.342417
HOST trade openness0.47643790.14498920.15635560.8078977
HOST telephones2.8299990.34497111.9356763.409637
HOST Internet users2.1626131.577725−2.4515354.008242
HOST political rights2.4453781.07117515
HOST voice and accountability56.1586117.8178620.6572889.42308
HOST political stability37.2170723.95051.00502584.65608
Asian
FDI stock5361.6788878.99854.291759,695.39
Sum of HOST and PARENT real GDP1.3977190.26215941.0728262.376484
HOST GDP per capita−19.292710.9122447−21.1438−17.58241
HOST education level2.0511560.30461831.3064782.543428
Exchange rate4.4952452.5407790.92264759.248593
HOST Internet users1.6850452.103335−4.3365424.43165
HOST civil liberties3.9579831.3173871.3173877
HOST voice and accountability39.8029821.485344.69483672.11539
Notes: All the variables are expressed in logs with the exception of institutional variables. The number of observations is N = 119 . This is based on n = 7 unique country-pairs observed over T = 17 periods (1996–2012).

References

  1. Adam, Antonis, and Fragkiskos Filippaios. 2007. Foreign direct investment and civil liberties: A new perspective. European Journal of Political Economy 23: 1038–52. [Google Scholar] [CrossRef]
  2. Antonakakis, Nikolaos, and Gabriele Tondl. 2015. Robust determinants of OECD FDI in developing countries: Insights from bayesian model averaging. Cogent Economics and Finance 3: 1–25. [Google Scholar] [CrossRef] [Green Version]
  3. Baltagi, Badi H., Peter Egger, and Michael Pfaffermayr. 2007. Estimating models of complex FDI: Are there third-country effects? Journal of Econometrics 140: 260–81. [Google Scholar] [CrossRef] [Green Version]
  4. Baltagi, Badi H., Peter Egger, and Michael Pfaffermayr. 2014. Panel Data Gravity Models of International Trade. In The Oxford Handbook of Panel Data. Oxford: Oxford University Press, chp. 20, pp. 608–42. [Google Scholar] [CrossRef] [Green Version]
  5. Basile, Roberto, Davide Castellani, and Antonello Zanfei. 2008. Location choices of multinational firms in Europe: The role of EU cohesion policy. Journal of International Economics 74: 328–40. [Google Scholar] [CrossRef]
  6. Berden, Koen, Jeffrey H. Bergstrand, and Eva van Etten. 2012. Governance, Globalization, and Selection into Foreign Direct Investment. Available online: http://www3.nd.edu/~jbergstr/Working_Papers/Governance.pdf (accessed on 22 May 2013).
  7. Bergstrand, Jeffrey H., and Peter Egger. 2007. A knowledge-and-physical-capital model of international trade flows, foreign direct investment, and multinational enterprises. Journal of International Economics 73: 278–308. [Google Scholar] [CrossRef]
  8. Blonigen, Bruce A., Ronald B. Davies, and Keith Head. 2003. Estimating the Knowledge-Capital Model of the Multinational Enterprise: Comment. American Economic Review 93: 980–94. [Google Scholar] [CrossRef] [Green Version]
  9. Brainard, S. Lael. 1997. An Empirical Assessment of the Proximity-Concentration Trade-off Between Multinational Sales and Trade. American Economic Review 87: 520–44. [Google Scholar]
  10. Brenton, Paul, and Francesca Di Mauro. 1999. Economic Integration and FDI: An Empirical Analysis of Foreign Investment in the EU and in Central and Eastern Europe. Empirica 26: 95–121. [Google Scholar] [CrossRef]
  11. Buch, Claudia, Jörn Kleinert, and Farid Toubal. 2003. Determinants of German FDI: New Evidence from Micro-Data. Discussion Paper 09/03. Frankfurt am Main: Economic Research Centre of the Deutsche Bundesbank. [Google Scholar] [CrossRef] [Green Version]
  12. Burger, Martijn, Frank Van Oort, and Gert-Jan Linders. 2009. On the specification of the gravity model of trade: Zeros, excess zeros and zero-inflated estimation. Spatial Economic Analysis 4: 167–90. [Google Scholar] [CrossRef] [Green Version]
  13. Büthe, Tim, and Helen V. Milner. 2008. The politics of foreign direct investment into developing countries: Increasing FDI through international trade agreements? American Journal of Political Science 52: 741–62. [Google Scholar] [CrossRef]
  14. Camarero, Mariam, Inmaculada Martínez-Zarzoso, Felicitas Nowak-Lehmann D, and Cecilio Tamarit. 2016. Trade Openness and Income: A Tale of Two Regions. World Economy 39: 386–408. [Google Scholar] [CrossRef] [Green Version]
  15. Camarero, Mariam, Laura Montolio, and Cecilio Tamarit. 2019a. Alternative Estimators for the FDI Gravity Model: An Application to German Outward FDI. Working Papers 1907. Valencia: Department of Applied Economics II, Universidad de Valencia. [Google Scholar]
  16. Camarero, Mariam, Laura Montolio, and Cecilio Tamarit. 2019b. What drives German foreign direct investment? New evidence using Bayesian statistical techniques. Economic Modelling 83: 326–45. [Google Scholar] [CrossRef]
  17. Cameron, Colin A., and Pravin K. Trivedi. 2009. Microeconometrics Using Stata. College Station: Stata Press. [Google Scholar]
  18. Carr, David L., James R. Markusen, and Keith E. Maskus. 2001. Estimating the Knowledge-Capital Model of the Multinational Enterprise. American Economic Review 91: 693–708. [Google Scholar] [CrossRef] [Green Version]
  19. Cherif, Mondher, and Christian Dreger. 2018. Do regional trade agreements stimulate FDI? Evidence for the Agadir, MERCOSUR and AFTA regions. Review of Development Economics. [Google Scholar] [CrossRef]
  20. Deininger, Klaus, Derek Byerlee, Jonathan Lindsay, Andrew Norton, Harris Selod, and Mercedes Stickler. 2011. Rising Global Interest in Farmland: Can It Yield Sustainable and Equitable Benefits? Washington: The World Bank. [Google Scholar] [CrossRef] [Green Version]
  21. Dixon, Jay, and Paul Alexander Haslam. 2015. Does the Quality of Investment Protection Affect FDI Flows to Developing Countries? Evidence from Latin America. World Economy, 1080–108. [Google Scholar] [CrossRef]
  22. Egger, Peter H., and Kevin E. Staub. 2016. GLM estimation of trade gravity models with fixed effects. Empirical Economics 50: 137–75. [Google Scholar] [CrossRef]
  23. Faeth, Isabel. 2009. Determinants of foreign direct investment—A tale of nine theoretical models. Journal of Economic Surveys 23: 165–96. [Google Scholar] [CrossRef]
  24. Gómez-Herrera, Estrella. 2013. Comparing alternative methods to estimate gravity models of bilateral trade. Empirical Economics 44: 1087–111. [Google Scholar] [CrossRef] [Green Version]
  25. Gutiérrez-Portilla, Paula, Adolfo Maza, and José Villaverde. 2019. Has the crisis affected Spanish investment strategy abroad? A spatial panel data approach. World Economy 42: 1032–56. [Google Scholar] [CrossRef]
  26. Hauge, Jostein. 2020. Industrial policy in the era of global value chains: Towards a developmentalist perspective drawing on the industrialisation experiences of South Korea and Taiwan. The World Economy, 1–23. [Google Scholar] [CrossRef] [Green Version]
  27. Head, Keith, and Thierry Mayer. 2014. Gravity Equations: Workhorse, Toolkit, and Cookbook. In Handbook of International Economics. Amsterdam: Elsevier, Volume 4, pp. 131–95. [Google Scholar] [CrossRef]
  28. Head, Keith, and John Ries. 2008. FDI as an outcome of the market for corporate control: Theory and evidence. Journal of International Economics 74: 2–20. [Google Scholar] [CrossRef] [Green Version]
  29. Herzer, Dierk, Stephan Klasen, and Felicitas Nowak-Lehmann D. 2008. In search of FDI-led growth in developing countries: The way forward. Economic Modelling 25: 793–810. [Google Scholar] [CrossRef]
  30. Huang, Chao Hsi, Kai Fang Teng, and Pan Long Tsai. 2010. Inward and outward foreign direct investment and poverty: East Asia vs. Latin America. Review of World Economics 146: 763–79. [Google Scholar] [CrossRef]
  31. Qamar, Shahzadeh. 2014. A Review of the Economic Applications of the Gravity Model on FDI. International Journal of Applied Research 3: 30–45. [Google Scholar]
  32. Kleinert, Jörn, and Farid Toubal. 2010. Gravity for FDI. Review of International Economics 18: 1–13. [Google Scholar] [CrossRef]
  33. Li, Quan, and Adam Resnick. 2003. Reversal of fortunes: Democratic institutions and foreign direct investment inflows to developing countries. International Organization 57: 175–211. [Google Scholar] [CrossRef] [Green Version]
  34. Li, Quan, and Rafael Reuveny. 2003. Economic globalization and democracy: An empirical analysis. British Journal of Political Science 33: 29–54. [Google Scholar] [CrossRef] [Green Version]
  35. Liargovas, Panagiotis G., and Konstantinos S. Skandalis. 2012. Foreign Direct Investment and Trade Openness: The Case of Developing Economies. Social Indicators Research 106: 323–31. [Google Scholar] [CrossRef]
  36. Markusen, James R., and Keith E. Maskus. 2001. Reconciling Theory and Evidence. In Topics in Empirical International Economics: A Festschrift in Honor of Robert E. Lipsey. Chicago: University of Chicago Press, pp. 71–98. [Google Scholar]
  37. Martin, Will, and Cong S. Pham. 2008. Estimating the Gravity Equation When Zero Trade Flows are Frequent. MPRA Paper 9453. Munich: University Library of Munich. [Google Scholar]
  38. Martínez-San Román, Valeriano, Marta Bengoa, and Blanca Sánchez-Robles. 2016. Foreign direct investment, trade integration and the home bias: evidence from the European Union. Empirical Economics 50: 197–229. [Google Scholar] [CrossRef]
  39. Martínez-Zarzoso, Inmaculada. 2013. The log of gravity revisited. Applied Economics 45: 311–27. [Google Scholar] [CrossRef] [Green Version]
  40. Matyas, Laszlo. 2017. The Econometrics of Multi-Dimensional Panels. Berlin: Springer. [Google Scholar] [CrossRef]
  41. McCullagh, P., and J.A. Nelder. 1989. Generalized Linear Models, 2nd ed. London: Chapman and Hall. [Google Scholar]
  42. Ramsey, J.B. 1969. Testing for Specification Errors in Classical Linear Least-Squares Regression Analysis. Journal of the Royal Statistical Society. Series B (Methodological) 31: 350–71. [Google Scholar] [CrossRef]
  43. Santos Silva, J.M.C., and Silvana Tenreyro. 2006. The log of gravity. The Review of Economics and Statistics 88: 641–58. [Google Scholar] [CrossRef] [Green Version]
  44. Santos Silva, J.M.C., and Silvana Tenreyro. 2011. Further simulation evidence on the performance of the Poisson pseudo-maximum likelihood estimator. Economics Letters 112: 220–22. [Google Scholar] [CrossRef] [Green Version]
  45. UNCTAD. 1998. World Investment Report 1998: Trends and Determinants. Geneva: United Nations Publication. [Google Scholar] [CrossRef]
  46. Wölwer, Anna-Lena, Martin Breßlein, and Jan Pablo Burgard. 2018. Gravity Models in R. Austrian Journal of Statistics 47: 16–35. [Google Scholar] [CrossRef] [Green Version]
  47. Zhang, Kevin H. 2001. Does Foreign Direct Investment Promote Economic Growth? Evidence from East Asia and Latin America. Contemporary Economic Policy 19: 175–85. [Google Scholar] [CrossRef]
1
Own elaboration based on the UNCTAD’s Bilateral FDI Statistics database.
2
Notice that the choice of countries was somewhat restricted by the availability of data concerning the large set of potential explanatory variables included in the dataset of Camarero et al. (2019a), the one used in the present study. Furthermore, Argentina is not included in the Latin American countries’ group because German FDI shrank sharply in the year 2000 due to the economic depression that hit the country.
3
The Tobit estimator assumes dependence among the selection and outcome equations.
4
The dataset from Camarero et al. (2019) covered bilateral FDI stock between Germany and 59 destination countries from 1996 to 2012. Notice that the dataset was strongly balanced, given the interest of the researchers in addressing the variable selection problem faced in the modelization of FDI. The FDI dataset included 61 explanatory variables and had 1.105 total observations. Due to missing data for some of the explanatory variables, they had to cope with a somewhat limited number of observations. For the purpose of our study, we focused only on a subset of this dataset considering 14 developing destination countries (seven Latin American and seven Asian). Thereby, the total number of observations for each of our subsamples was 119. Despite the potential limitation of the number of observations, we considered that our analysis offered room for policy implications.
5
UNCTAD FDI statistics incorporate international guidelines in the compilation of FDI data (the IMF’s Balance of Payments and International Investment Position Manual (BPM6) and the fourth edition of OECD’s Benchmark Definition of Foreign Direct Investment (BD4)) to guarantee their quality, yet it might still be somewhat distortive due to differences in corporate accounting practices and valuation methods across countries.
6
Results remained stable when applying a stepwise backward selection procedure.
7
An important limitation of these estimations was that by including host country fixed effects, the researcher could no longer estimate those variables with low or no time variability (such as distance, population, or land area, among others), as they were perfectly collinear with the fixed effects (see Baltagi et al. (2014)). Accordingly, we also performed a robustness check by replicating the estimations without host country fixed effects.The findings confirmed that NBPML and GPML were the best performing estimators. Both estimators yielded the same results with similar estimated coefficients and signs. As opposed to the results in Section 4.2.1 and Section 4.2.2, host population, land area, and time zone difference appeared to be significant and with the expected sign for Latin American countries; whereas for Asian countries, landlocked was found to be significant and exerted the expected sign. Results are available upon request.
8
For readability, we depict the kernel density of deviance residuals (illustrated by the black dashed curve) together with a normal density plot based on the same variance along the lines of Egger and Staub (2016).
9
Note, however, that Carr et al. (2001) predicted a negative impact of the interaction of skill differences with GDP differences on FDI. Nonetheless, the work in Blonigen et al. (2003) conferred this negative prediction to a misspecification of the skill differences variable used by Carr et al. (2001). Once corrected, the authors confirmed a positive association between the interaction of skill differences with GDP differences and FDI.
Figure 1. GLMs estimators for Latin American countries: predictions and Pearson residuals.
Economies 08 00019 g001
Figure 2. GLMs estimators for Asian countries: predictions and Pearson residuals.
Economies 08 00019 g002
Figure 3. GLMs estimators for Latin American countries: density of deviance residuals.
Economies 08 00019 g003
Figure 4. GLM estimators for Asian countries: density of deviance residuals.
Economies 08 00019 g004
Table 1. Countries included in the study disaggregated by country-groups.
Destination Countries
Developing
Latin American
BrazilColombiaMexicoVenezuela
ChileEcuadorUruguay
Asian
ChinaIndonesiaKorea, Republic ofThailand
IndiaKazakhstanMalaysia
Table 2. Determinants of Foreign Direct Investment (FDI) in Latin American countries, 1996–2012.
GLMs
PPMLGPMLNBPMLGaussian GLM
Similarity of HOST and PARENT real GDP1.017 **0.970 ***0.915 ***2.241 ***
(0.42)(0.37)(0.34)(0.60)
Squared GDP difference−2.277 ***−2.076 ***−2.010 ***−2.501 ***
(0.17)(0.30)(0.28)(0.15)
HOST population −5.424 ***−5.310 ***
(1.00)(1.06)
Interaction of GDP differences with skill differences0.445 ***0.488 ***0.485 ***0.346 ***
(0.10)(0.05)(0.04)(0.13)
HOST education level−2.868 ***−2.607 ***−2.406 ***−3.662 ***
(0.42)(0.83)(0.77)(0.37)
HOST trade openness−2.413 ***−2.394 ***−2.402 ***−2.220 ***
(0.26)(0.24)(0.26)(0.21)
HOST telephones−0.677 ***−0.713 ***−0.711 ***−0.462 ***
(0.16)(0.06)(0.07)(0.13)
HOST Internet users0.237 ***0.390 ***0.374 ***0.321 ***
(0.07)(0.08)(0.08)(0.05)
HOST political rights0.159 ***0.132 ***0.127 ***0.246 ***
(0.03)(0.02)(0.02)(0.03)
HOST voice and accountability−0.015 ***−0.030 ***−0.029 ***
(0.00)(0.00)(0.00)
HOST political stability0.007 ***0.007 ***0.007 ***0.004 ***
(0.00)(0.00)(0.00)(0.00)
Host country FE ( j ) Y e s Y e s Y e s Y e s
Year FE Y e s Y e s Y e s Y e s
Observations119119119119
R E S E T test p-values0.61250.00400.01520.0000
A I C 29.5413816.3721113.0001613.954
B I C 1896.413−538.1903−417.83037,234,199
D e v i a n c e 2436.4540311.85062599122.21061447,234,738.776
D i s p e r s i o n 21.561540.01637721.0815164,024.24
B i a s 0.01851310.00777570.010164−0.0065372
M S E 0.02747350.01582410.016050.0415093
E r r o r L o s s 0.1229620.09772540.09968330.1420331
Notes: Country pair clustered standard errors are in parentheses. *, **, and *** denote significance at the 10%, 5%, and 1% significance levels, respectively.
Table 3. Determinants of FDI in Asian countries, 1996–2012.
GLMs
PPMLGPMLNBPMLGaussian GLM
Sum of HOST and PARENT real GDP 1.763 ***1.757 ***
(0.08)(0.08)
HOST GDP per capita1.758 *** 1.928 ***
(0.17) (0.14)
HOST education level4.360 ***2.820 ***2.848 ***6.618 ***
(0.50)(0.69)(0.67)(0.78)
Exchange rate −0.502 ***
(0.10)
HOST Internet users 0.079 ***0.080 ***
(0.03)(0.03)
HOST civil liberties 0.280 **0.277 **
(0.11)(0.12)
HOST voice and accountability0.017 ***0.027 ***0.027 ***0.022 ***
(0.00)(0.01)(0.01)(0.01)
Host country FE ( j ) Y e s Y e s Y e s Y e s
Year FE Y e s Y e s Y e s Y e s
Observations119119119119
R E S E T test p v a l u e s 0.18190.93950.94220.9166
A I C 75.496817.5936814.9979215.07193
B I C 7293.547−535.9904−417.57592.21 × 10 7
D e v i a n c e 7833.5875784.050531479122.465028322,127,650.53
D i s p e r s i o n 69.323780.03584541.083761195,819.9
B i a s 0.01194490.01701870.01702360.0123652
M S E 0.05860870.03554480.03558550.0804531
E r r o r L o s s 0.15911560.14108720.14052140.1735322
Notes: Country pair clustered standard errors are in parentheses. *, **, and *** denote significance at the 10%, 5%, and 1% significance levels, respectively.
Table 4. Goodness of fit. RESET, Regression Equation Specification Error Test; PPML, Poisson Pseudo Maximum Likelihood; NBPML, Negative Binomial Pseudo Maximum Likelihood; GPML, Gamma Pseudo Maximum Likelihood.
Latin AmericanAsian
RESET test (5%)PPMLAll of them
AICNBPMLNBPML
BICGPMLGPML
DevianceGPMLGPML
DispersionGPMLGPML
BiasGaussian GLMPPML
MSEGPML/NBPMLGPML/NBPML
Error lossGPML/NBPMLNBPML/GPML
Pearson residualsNBPML/GPMLNBPML/GPML
Deviance residualsNBPML/GPMLPPML/NBPML
Source: authors’ elaboration.

