Article

Time-Varying Risk Aversion and the Profitability of Carry Trades: Evidence from the Cross-Quantilogram †

1
Department of Economics & Finance, Southern Illinois University Edwardsville, Edwardsville, IL 62026-1102, USA
2
Department of Economics, University of Pretoria, Pretoria 0002, South Africa
3
Research Institute of Energy Management and Planning (RIEMP), University of Tehran, Tehran 1417466191, Iran
4
Faculty of Business and Law, De Montfort University, Leicester LE1 9BH, UK
*
Author to whom correspondence should be addressed.
We would like to thank two anonymous referees for many helpful comments. However, any remaining errors are solely ours.
Economies 2020, 8(1), 18; https://doi.org/10.3390/economies8010018
Submission received: 10 January 2020 / Revised: 23 February 2020 / Accepted: 27 February 2020 / Published: 5 March 2020
(This article belongs to the Special Issue Asset Pricing, Investment, and Trading Strategies)

Abstract

:
This paper examines the predictive power of time-varying risk aversion over payoffs to the carry trade strategy via the cross-quantilogram methodology. Our analysis yields significant evidence of directional predictability from risk aversion to daily carry trade returns tracked by the Deutsche Bank G10 Currency Future Harvest Total Return Index. The predictive power of risk aversion is found to be stronger during periods of moderate to high risk aversion and largely concentrated on extreme fluctuations in carry trade returns. While large crashes in carry trade returns are associated with significant rises in investors’ risk aversion, we also found that booms in carry trade returns can be predicted at high quantiles of risk aversion. The results highlight the predictive role of extreme investor sentiment in currency markets and regime specific patterns in carry trade returns that can be captured via quantile-based predictive models.
JEL Codes:
C22; F31

1. Introduction

Carry trade strategies aim to exploit deviations from the uncovered interest parity by investing in currencies that yield high interest rates and funding these positions by borrowing low-yielding currencies. Christiansen et al. (2011) note that the popularity of carry trades largely stems from the fact that the average carry trade strategy outperforms individual currency returns, while it offers lower return volatility compared to individual currencies. Despite their impressive risk-adjusted returns, these highly popular, speculative strategies are often exposed to severe crashes (e.g., Burnside et al. 2007; Brunnermeier et al. 2009), due to their high exposure to crash risks driven by funding constraints (Brunnermeier et al. 2009) or illiquidity risks (Plantin and Shin 2011).
In a recent study, Dietrich (2018) shows that the perception of future risk, proxied by implied currency volatility, captures predictive information over payoffs to carry trades with increases in the implied currency volatility predicting lower carry trade returns, and at the same time decreases in implied currency volatility causing higher carry trade returns. This finding indeed supports earlier evidence that carry trades generally perform well during calm markets (Plantin and Shin 2011), while carry trade crashes tend to occur when risk appetite decreases and funding conditions tighten (Brunnermeier et al. 2009). Against this background, we extend these discussions in a novel direction by examining the predictability of payoffs to carry trades by means of the recently developed time-varying risk aversion index of Bekaert et al. (2017), which has been shown to contain significant predictive information over gold market volatility (Demirer et al. 2019), an asset that is often considered a traditional hedge against market crashes. Constructed based on a set of observable financial variables, including the realized and risk-neutral equity return variance and realized corporate bond return variance, among others, the risk aversion index presents a proxy for the time variation in the price of risk, independent from the time variation in market uncertainty. To that end, the use of this recently proposed index in this context allows enlarging our understanding of the role of changes in risk preferences over the profitability of speculative trading strategies in the currency market.
As a second novelty, we utilized the cross-quantilogram methodology of Han et al. (2016) to explore the directional predictability patterns at various quantiles that represent bull, bear, and normal market states. Linton and Whang (2007) introduced the quantilogram to measure predictability in different parts of the distribution of a stationary time series based on the correlogram of “quantile hits” and applied the quantilogram to test the hypothesis that a given time series has no directional predictability. Since the method is based on quantile hits, it does not require moment conditions like the ordinary correlogram and statistics like the variance ratio that are derived from it, and so it works well for heavy tailed series, which characterizes many financial time series, including returns to carry trading strategies (e.g., Burnside et al. 2007 and Brunnermeier et al. 2009). Moreover, this methodology allows researchers to consider very long lags in comparison with regression type methods. However, the approach by Linton and Whang (2007) is univariate and hence cannot be used to analyze the role played by a predictor. Given this, Han et al. (2016) extended the quantilogram to a cross-quantilogram, utilizing conditional quantiles rather than unconditional quantiles, thus allowing to measure directional dependence between two time-series (which in our case happens to be the directional predictability of carry trade returns due to risk-aversion) after parsimoniously controlling for the information at the time of prediction.
A unique feature of the cross-quantilogram methodology is its quantile-based focus, which allows us to capture predictability patterns at different quantiles that represent various market states, including extreme and normal market states. This feature of the cross-quantilogram fits perfectly in our context, considering that extreme speculator sentiment in currency markets is more correlated with future market movements than moderate sentiment (Wang 2004) and the evidence in Christiansen et al. (2011) that carry trade returns display regime-specific patterns, performing poorly during bear markets or high volatility states driven by sudden reversions during such periods (Burnside et al. 2008; Baillie and Chang 2011). Furthermore, as noted by Chung and Hong (2007), directional predictability instead of the predictability of the conditional mean has multiple advantages: First, the direction of changes provides important insights to market practitioners, since technical trading rules widely used by foreign exchange dealers are heavily based on predictions of direction of changes. Second, from the perspective of a statistician, it is relatively easier to predict the direction of changes than that of the predictions of the conditional mean, as directional predictability depends on all conditional moments. Finally, from an economist’s point of view, the directional predictability of currency returns is more relevant as it is better able to capture a utility-based measure of predictability performance (such as economic profits). In addition, market timing (a form of active asset allocation management) is essentially the prediction of turning points in currency markets. To the best of our knowledge, this is the first attempt to study directional predictability of returns to the carry trade strategy emanating from risk aversion via the cross-quantilogram methodology.
Utilizing daily data for the Deutsche Bank G10 Currency Future Harvest Total Return Index to track the performance of a typical carry trade strategy, we show that risk aversion captures predictive information over payoffs to the currency carry trade strategy. While directional predictability is observed primarily at medium to high levels of risk aversion, we show that risk aversion can be useful in predicting the occurrence of both the crashes and booms in carry trades. Overall, the findings can provide a useful guideline for stress testing in carry trade strategies as they can help to explain the implications of extreme sentiment changes on the subsequent performance of these strategies. The remainder of the paper is organized as follows: Section 2 describes the methodology of cross-quantilograms, while Section 3 presents the data and results and Section 4 concludes the paper.

2. Methodology: The Cross-Quantilogram

In this section, we briefly describe the cross-quantilogram methodology developed by Han et al. (2016). Let { ( y t , x t ) : t } be strictly stationary time series with y t = ( y 1 t , y 2 t ) T 2 and x t = ( x 1 t , x 2 t ) d 1 × d 2 , where x i t = [ x i t ( 1 ) , , x i t ( d i ) ] T d i with d i   for i = 1 ,   2 . Ϝ y i | x i ( . | x i t ) is used to denote the conditional distribution function of the series y i t given x i t   with density function   f y i | x i ( . | x i t ) , and the corresponding conditional quantile function is defined as   q i , t ( τ i ) = i n f { υ : Ϝ y i | x i ( υ | x i t ) τ i } for τ i ( 0 ,   1 ) , i = 1 ,   2 . Let T   be the range of quantiles we are interested in for evaluating the directional predictability, with T   assumed to be a Cartesian product of two closed intervals in ( 0 ,   1 ) , i.e.,   T T 1 × T 2 , where   T i = [ τ _ i , τ ¯ i ] for some 0 < τ _ i < τ ¯ i < 1 .
Han et al. (2016) considered a measure of serial dependence between two events   { y 1 t q 1 , t ( τ 1 ) } and { y 2 , t k q 2 , t k ( τ 2 ) } for an arbitrary pair of   τ = ( τ 1 , τ 2 ) T T and for an integer k , where the event { 1 [ y i t q i , t ( . ) ] } , ( i = 1 ,   2 ) is described as the quantile-hit or quantile-exceedance process. The cross-quantilogram is then defined as the cross-correlation of the quantile-hit process as
ρ τ ( k ) = E [ ψ τ 1 ( y 1 t q 1 , t ( τ 1 ) ) ψ τ 2 ( y 2 , t k q 2 , t k ( τ 2 ) ) ] E [ ψ τ 1 2 ( y 1 t q 1 , t ( τ 1 ) ) ] E [ ψ τ 2 2 ( y 2 , t k q 2 , t k ( τ 2 ) ) ]
for   k = 0 ,   ± 1 ,   ± 2 ,   , where   ψ a ( u ) 1 [ u < 0 ] a .
To construct the sample analogue of the cross-quantilogram based on observations   { ( y t , x t ) } t = 1 T , Han et al. (2016) first estimated conditional quantile functions using the linear quantile regression model of Koenker and Bassett (1978). Let   q i , t ( τ i ) = x i t T β i ( τ i ) with a d i × 1 vector of unknown parameters   β i ( τ i ) for i = 1 ,   2 . To estimate the parameters   β ( τ ) [ β 1 ( τ 1 ) T , β 2 ( τ 2 ) T ] T , Han et al. (2016) solved
β ^ i ( τ i ) = a r g   min β i d i t = 1 T ϱ τ i ( y i t x i t T β i ) ,
where   ϱ a ( u ) u ( a 1 [ u < 0 ] ) . Let   β ^ τ [ β ^ 1 ( τ 1 ) T , β ^ 2 ( τ 2 ) T ] T and q ^ i , t ( τ i ) = x i t T β ^ i ( τ i ) for i = 1 ,   2 .   This yields the sample cross-quantilogram formulated as
ρ ^ τ ( k ) = t = k + 1 T ψ τ 1 ( y 1 t q ^ 1 , t ( τ 1 ) ) ψ τ 2 ( y 2 , t k q ^ 2 , t k ( τ 2 ) ) t = k + 1 T ψ τ 1 2 ( y 1 t q ^ 1 , t ( τ 1 ) ) t = k + 1 T ψ τ 2 2 ( y 2 , t k q ^ 2 , t k ( τ 2 ) ) ,
for k = 0 ,   ± 1 ,   ± 2 , . Given a set of conditional quantiles, the cross-quantilogram considers dependence in terms of the direction of deviation from conditional quantiles and hence measures the directional predictability from one series to another. Note that, by construction: ρ ^ τ ( k ) [ 1 ,   1 ] , with ρ ^ τ ( k ) = 0   corresponding to the case of no directional predictability.
The testing procedure involves the null hypothesis H 0   :   ρ τ ( 1 ) = = ρ τ ( p ) = 0 against the alternative that ρ τ ( k ) 0 for some k { 1 , , p } , assuming that τ T and p are given. In essence, this is a test for the directional predictability of events up to p lags { y 2 , t k q 2 , t k ( τ 2 )   : k = 1 , , p }   for { y 1 t q 1 , t ( τ 1 ) } , evaluated using the Box–Ljung statistic formulated as
Q τ ( p ) T ( T + 2 ) k = 1 p ρ ^ τ 2 ( k ) / ( T k ) .

3. Data and Empirical Findings

3.1. Data

The two variables of interest in our empirical analysis are the log-returns in percentage (first-difference of the natural logarithm times 100) for the Deutsche Bank G10 Currency Future Harvest Total Return Index (G10CHI) and the time-varying risk aversion index at daily frequency.1 Focusing on G10 currencies (US Dollar, euro, Japanese yen, British pound, Swiss franc, Australian dollar, New Zealand dollar, Canadian dollar, Norwegian Krone, and Swedish krona), the G10CHI index tracks the performance of a typical carry trade strategy that invests in a basket of high-yielding currencies funded by short positions in a basket of low-yielding currencies, rebalanced every 3 months. Clearly speculative in nature, the investment strategy attempts to capitalize on the expectation that high-yielding currencies will on average outperform currencies with relatively lower interest rates. The index value is quoted in excess return terms representing the return from an unfunded investment.
In the case of time-varying risk aversion, we utilize the risk aversion index of Bekaert et al. (2017).2 These authors developed a new measure of time-varying risk aversion based on a dynamic asset pricing model of two main risky asset classes, i.e., equity and corporate bonds, which incorporates a stochastic risk aversion term in addition to macroeconomic factors that drive cash flows. In this pricing framework, they assume a utility function in the hyperbolic absolute risk aversion (HARA) class and show that the price of risk is linked to the coefficient of relative risk aversion as well as the volatility of consumption growth. This framework, thus, allows risk aversion to enter the pricing kernel as a second factor that is not fully driven by fundamentals (proxied by consumption growth). The construction of the risk aversion series involves the use of observable financial information at high (daily) frequencies. Ultimately, this measure relies on a set of six financial instruments, namely, term spread, credit spread, a detrended dividend yield, realized and risk-neutral equity return variance, and realized corporate bond return variance. As discussed earlier, an important feature of this measure is that it distinguishes time variation in economic uncertainty (the amount of risk) from time variation in risk aversion (the price of risk) and thus provides an unbiased representation for changes in the risk preferences in the marketplace. The sample period covers 15 March 1993 to 30 December 2016, including 5944 observations. Note that while the start date is defined by the availability of the G10CHI index data,3 the end date is due to the availability of the risk aversion index data.

3.2. Empirical Findings

As can be seen in the summary statistics reported in Table 1, both the risk aversion and carry trade return series (G10CHI) have excess kurtosis, indicating the occurrence of extreme observations in both variables. While the risk aversion index is positively skewed, possibly as the sample period covers periods of high market uncertainty and crisis like the 2007/2008 global financial crisis, carry trade returns are found to experience negative skewness, indicating greater likelihood of losses during the sample period. Excess kurtosis, coupled with negative skewness observed for carry trade returns, is indeed consistent with Burnside et al. (2007) and Brunnermeier et al. (2009) that carry trades are often exposed to significant crashes. Overall, both the series are non-normal, which in turn motivates the use of a quantile-on-quantile based approach via the cross-quantilogram in our empirical analysis.4
Figure 1, Figure 2 and Figure 3 present the sample cross-quantilograms for the directional predictability from risk aversion to carry trade returns when risk aversion is in the low (α2 = 0.1), median (α2 = 0.5) and high (α2 = 0.9) quantiles, respectively. Similarly, the quantiles for the distribution of carry trade returns is denoted by α1, ranging between 0.05 and 0.95. In each figure, the red dashed lines represent the 95% bootstrapped confidence intervals for no directional predictability with 1000 bootstrapped replicates. The corresponding Box–Ljung (portmanteau) statistics (in Equation (3)) to test the null of nonpredictability are reported in Figure A1, Figure A2 and Figure A3 in Appendix A.
Based on the size of the statistics, we generally observe stronger predictability patterns in Figure 2 and Figure 3 as the level of risk aversion rises, suggesting that the predictive power of risk aversion over carry trade returns is generally more prevalent during periods of moderate to high risk aversion. In Figure 1, where risk aversion is in the lowest quantile, we observe generally insignificant cross-quantilogram estimates for the median quantile 0.50, suggesting that low risk aversion is not helpful in predicting whether carry trade return is located below or above its median.5 On the other hand, at moderate to high levels of risk aversion in Figure 2 and Figure 3, we observe that risk aversion can help to predict extreme low/high fluctuations in carry trade returns. For example, in Figure 3, when risk aversion is in the high quantile (α2 = 0.90), we see negative and highly significant cross-quantilogram estimates at low quantiles of carry trade returns (α1 = 0.05 and 0.10). This implies that when risk aversion is very high (higher than its 90% quantile), it is more likely to observe large carry trade crashes the next day. This is in line with Menkhoff et al. (2012) that carry trades tend to perform poorly during periods of increasing risk aversion and with Brunnermeier et al. (2009) that carry trade crashes tend to occur when risk appetite decreases and funding conditions tighten.6 The corresponding Box–Ljung statistics for the null of non-predictability, reported in Figure A2 and Figure A3 in the Appendix A, further confirm significant predictability patterns for all lags in the low quantile of carry trade returns, although the evidence is mixed at low risk aversion in Figure A1. Overall, the evidence so far indicates robust predictability patterns due to risk aversion that can be used to predict subsequent crashes in carry trade strategies.
Although risk aversion is found to negatively affect carry trade returns at quantiles below the median of the latter, we see that the effect turns positive at high quantiles of carry trade returns. Once again in Figure 2 and Figure 3, we observe positive and highly significant cross-quantilogram estimates at high quantiles of carry trade returns (α1 = 0.90 and 0.95). This means that high level of risk aversion can also predict large gains in carry trade strategies. Although it sounds counterintuitive at first, a plausible explanation is offered by Daviou and Paraschiv (2014), who examined investor behavior during periods of extreme fluctuations in market risk measured by the Chicago Board Options Exchange (CBOE) volatility index (VIX). Noting that practitioners use high values of the VIX as a signal of undervaluation in financial markets as relatively more risk-averse investors rush to unload their risky holdings during periods of high uncertainty, Daviou and Paraschiv (2014) argued that investors in fact do not necessarily lose confidence during extreme increases in risk. Instead, they argued, investors build confidence over sharp, subsequent declines in risk. To that end, the finding that extreme high level of risk aversion predicts large carry trade payoffs, implied by the positive cross-quantilogram estimates, can be due to under valuation of high yield currencies or over valuation of low yield currencies in the face of extremely high uncertainty (or risk aversion), as more risk-averse investors cover their short positions in low-yielding currencies by buying them back by selling off their positions in high-yielding currencies. This undervaluation of high yield currencies or overvaluation of low yield currencies, in turn, leads to large gains in subsequent periods for investors who operate on the expectation of sharp declines in risk. To that end, the findings add support to Egbers and Swinkels (2015) in that measures of investor sentiment (or market risk) could be used as timing indicators to exit and enter the currency carry trade within a conditional trading strategy to improve the profitability of carry trades.7

4. Conclusions

This study examined the predictive power of time-varying risk aversion over the payoffs to the currency carry trade strategy that exploits mispricing patterns in low- and high-yielding currencies. Utilizing the cross-quantilogram methodology by Han et al. (2016) and the risk aversion index recently developed by Bekaert et al. (2017), we presented significant evidence of directional predictability from risk aversion to carry trade returns. While the predictive power of risk aversion was found to be stronger at moderate to high levels of risk aversion, we found that risk aversion possesses significant predictive ability over extreme fluctuations in carry trade returns, with directional predictability patterns observed both for crashes and booms in carry trades. The results overall highlight the role of extreme sentiment in predicting currency market fluctuations and suggest that quantile-based approaches such as the cross-quantilogram can be utilized to stress test speculative trading strategies by uncovering the implications of extreme fluctuations in market risk or risk appetite over subsequent returns.

Author Contributions

All the authors contributed equally to the paper in terms of the research question, estimations and write-up of the paper. All authors have read and agreed to the published version of the manuscript.

Funding

This research received no external funding.

Conflicts of Interest

The authors declare no conflict of interest.

Appendix A

Figure A1. Box–Ljung test statistic for low risk aversion quantile (α2 = 0.10). Note: The black line is the portmanteau test statistic and the red dashed line is the 95% bootstrap confidence intervals for 1000 bootstrap iterations.
Economies 08 00018 g0a1
Figure A2. Box–Ljung test statistic for median risk aversion quantile (α2 = 0.50). Note: The black line is the portmanteau test statistic and the red dashed line is the 95% bootstrap confidence intervals for 1000 bootstrap iterations.
Economies 08 00018 g0a2
Figure A3. Box–Ljung test statistic for high risk aversion quantile (α2 = 0.90). Note: The black line is the portmanteau test statistic and the red dashed line is the 95% bootstrap confidence intervals for 1000 bootstrap iterations.
Economies 08 00018 g0a3

References

  1. Ang, Andrew, and Joseph Chen. 2002. Asymmetric Correlations of Equity Portfolios. Journal of Financial Economics 63: 443–94. [Google Scholar] [CrossRef]
  2. Baillie, Richard T., and Sanders S. Chang. 2011. Carry trades, momentum trading and the forward premium anomaly. Journal of Financial Markets 14: 441–64. [Google Scholar] [CrossRef]
  3. Bekaert, Geert, Eric C. Engstrom, and Nancy R. Xu. 2017. The Time Variation in Risk Appetite and Uncertainty. Columbia Business School Research Paper No. 17–108. New York: Columbia Business School, Columbia University, Available online: https://www8.gsb.columbia.edu/cbs-directory/node/30648/preview (accessed on 27 February 2020).
  4. Breitung, Jörg, and Bertrand Candelon. 2006. Testing for short- and long-run causality: A frequency-domain approach. Journal of Econometrics 132: 363–78. [Google Scholar] [CrossRef]
  5. Brunnermeier, Markus K., Stefan Nagel, and Lasse H. Pedersen. 2009. Carry Trades and Currency Crashes. In NBER Macroeconomics Annual 2008. Edited by Daron Acemoglu, Kenneth Rogoff and Michael Woodford. Chicago: University of Chicago Press, vol. 23, pp. 313–47. [Google Scholar]
  6. Burnside, Craig, Martin Eichenbaum, and Sergio Rebelo. 2007. The Returns to Currency Speculation in Emerging Markets. American Economic Review Papers and Proceedings 97: 333–38. [Google Scholar] [CrossRef]
  7. Burnside, Craig, Martin Eichenbaum, and Sergio Rebelo. 2008. Carry trade: The gains of diversification. Journal of the European Economic Association 6: 581–88. [Google Scholar] [CrossRef]
  8. Christiansen, Charlotte, Angelo Ranaldo, and Paul Söderlind. 2011. The Time-Varying Systematic Risk of Carry Trade Strategies. Journal of Financial and Quantitative Analysis 46: 1107–25. [Google Scholar] [CrossRef] [Green Version]
  9. Chung, Jaehun, and Yongmiao Hong. 2007. Model-free evaluation of directional predictability in foreign exchange markets. Journal of Applied Econometrics 22: 855–89. [Google Scholar] [CrossRef]
  10. Daviou, Agustin, and Florentina Paraschiv. 2014. Investor behavior under changing market volatility. The Journal of Investing 23: 96–113. [Google Scholar] [CrossRef]
  11. Demirer, Riza, Konstantinos Gkillas, Rangan Gupta, and Christian Pierdzioch. 2019. Time-varying risk aversion and realized gold volatility. North American Journal of Economics and Finance 50: 101048. [Google Scholar] [CrossRef] [Green Version]
  12. Dietrich, Felix. 2018. The Effect of Risk Changes on Carry Trade Returns and Speculative Behavior. Working paper (July 29, 2018). St. Gallen: University of St. Gallen. [Google Scholar]
  13. Diks, Cees, and Valentyn Panchenko. 2006. A new statistic and practical guidelines for nonparametric Granger causality testing. Journal of Economic Dynamics & Control 30: 1647–69. [Google Scholar]
  14. Egbers, Tom, and Laurens Swinkels. 2015. Can implied volatility predict returns on the currency carry trade? Journal of Banking & Finance 59: 14–26. [Google Scholar]
  15. Han, Heejoon, Oliver Linton, Tatsushi Oka, and Yoon-Jae Whang. 2016. The cross-quantilogram: Measuring quantile dependence and testing directional predictability between time series. Journal of Econometrics 193: 251–70. [Google Scholar] [CrossRef] [Green Version]
  16. Hassani, Hossein, Anatoly Zhigljavsky, Kerry Patterson, and A. Soofi. 2010. A comprehensive causality test based on the singular spectrum analysis. In Causality in Science. Edited by Phyllis McKay Illari, Federica Russo and Jon Williamson. Oxford Scholarship Online. Oxford: Oxford University Press, chp. 18. pp. 379–406. [Google Scholar] [CrossRef]
  17. Jeong, Kiho, Wolfgang K. Härdle, and Song Song. 2012. A consistent nonparametric test for causality in quantile. Econometric Theory 28: 861–87. [Google Scholar] [CrossRef] [Green Version]
  18. Koenker, Roger, and Gilbert Bassett. 1978. Regression quantiles. Econometrica 46: 33–50. [Google Scholar] [CrossRef]
  19. Linton, Oliver, and Yoon-Jae Whang. 2007. The quantilogram: With an application to evaluating directional predictability. Journal of Econometrics 141: 250–82. [Google Scholar] [CrossRef]
  20. Menkhoff, Lukas, Lucio Sarno, Maik Schmeling, and Andreas Schrimpf. 2012. Carry trades and global foreign exchange volatility. Journal of Finance 67: 681–718. [Google Scholar] [CrossRef] [Green Version]
  21. Péguin-Feissolle, Anne, Birgit Strikholm, and Timo Teräsvirta. 2013. Testing the Granger noncausality hypothesis in stationary models of unknown functional form. Communications in Statistics: Simulation and Computation 42: 1063–87. [Google Scholar] [CrossRef] [Green Version]
  22. Plantin, Guillaume, and Hyun Song Shin. 2011. Carry Trades, Monetary Policy and Speculative Dynamics. Centre for Economic Policy Research (CEPR) Discussion Papers No. DP8224. Washington: SSRN, Available online: https://ssrn.com/abstract=1758433 (accessed on 27 February 2020).
  23. Sugihara, George, Robert May, Hao Ye, Chih-hao Hsieh, Ethan Deyle, Michael Fogarty, and Stephan Munch. 2012. Detecting causality in complex ecosystems. Science 338: 496–500. [Google Scholar] [CrossRef] [PubMed]
  24. Wang, Changyun. 2004. Futures trading activity and predictable foreign exchange market movements. Journal of Banking & Finance 28: 1023–41. [Google Scholar]
1
The risk aversion index is stationary by design, while the log-return of the G10CHI ensures its stationarity, as per the requirement of using mean-reverting series for the cross-quantilogram estimation. Complete details of standard unit root tests conducted on the two variables are available upon request.
2
The data can be downloaded from: https://www.nancyxu.net/risk-aversion-index.
3
4
As part of preliminary analysis, we conducted a wide variety of linear and nonlinear (nonparametric) conditional mean-based test of causality. In particular, the standard linear Granger causality test produced a test-statistic of 14.80, with a p-value of 0.00; the nonlinear tests of Diks and Panchenko (2006) had a test statistic of 2.14, with a p-value of 0.02; and the various nonlinear tests of Péguin-Feissolle et al. (2013) based on unknown functional forms, i.e., General Taylor-based, Semi-Additive Taylor-based, P-General Taylor-based, and Artificial Neural Network (ANN)-based had test statistics of 20.02, 10.24, 20.02, and 20.41, respectively, with all having p-values of 0.00. Naturally, all these tests rejected the null of no-Granger causality from risk aversion to carry trade returns. Further, the nonparametric Singular Spectrum Analysis (SSA)-based test of Hassani et al. (2010) yielded a value of 0.46 (i.e., <1), again suggesting predictive content of risk aversion for carry trade returns. Moreover, the nonparametric Convergent Cross Mapping (CCM) test of Sugihara et al. (2012) showed that carry trade returns has greater cross map skills to risk aversion than it is the other way round, thus confirming that risk aversion does indeed cause carry trade returns. Complete details of these tests are available upon request from the authors. Finally, the frequency-domain Granger causality test of Breitung and Candelon (2006) showed that risk aversion has predictive content for carry trade returns at a cycle length of less than 4 days, then at a cycle length of beyond 5 days, i.e., basically at short-, medium-, and long-horizons. While these conditional mean-based tests are helpful, they are silent about the causal relationship contingent on the state of these two variables, as well as of the sign of the impact, unlike our more powerful cross-quantilogram approach.
5
The lack (weak evidence) of predictability around the median of the carry trade returns was also confirmed based on the quantiles (of the carry trade returns)-based causality test of Jeong et al. (2012). Complete details of these results are available upon request from the authors.
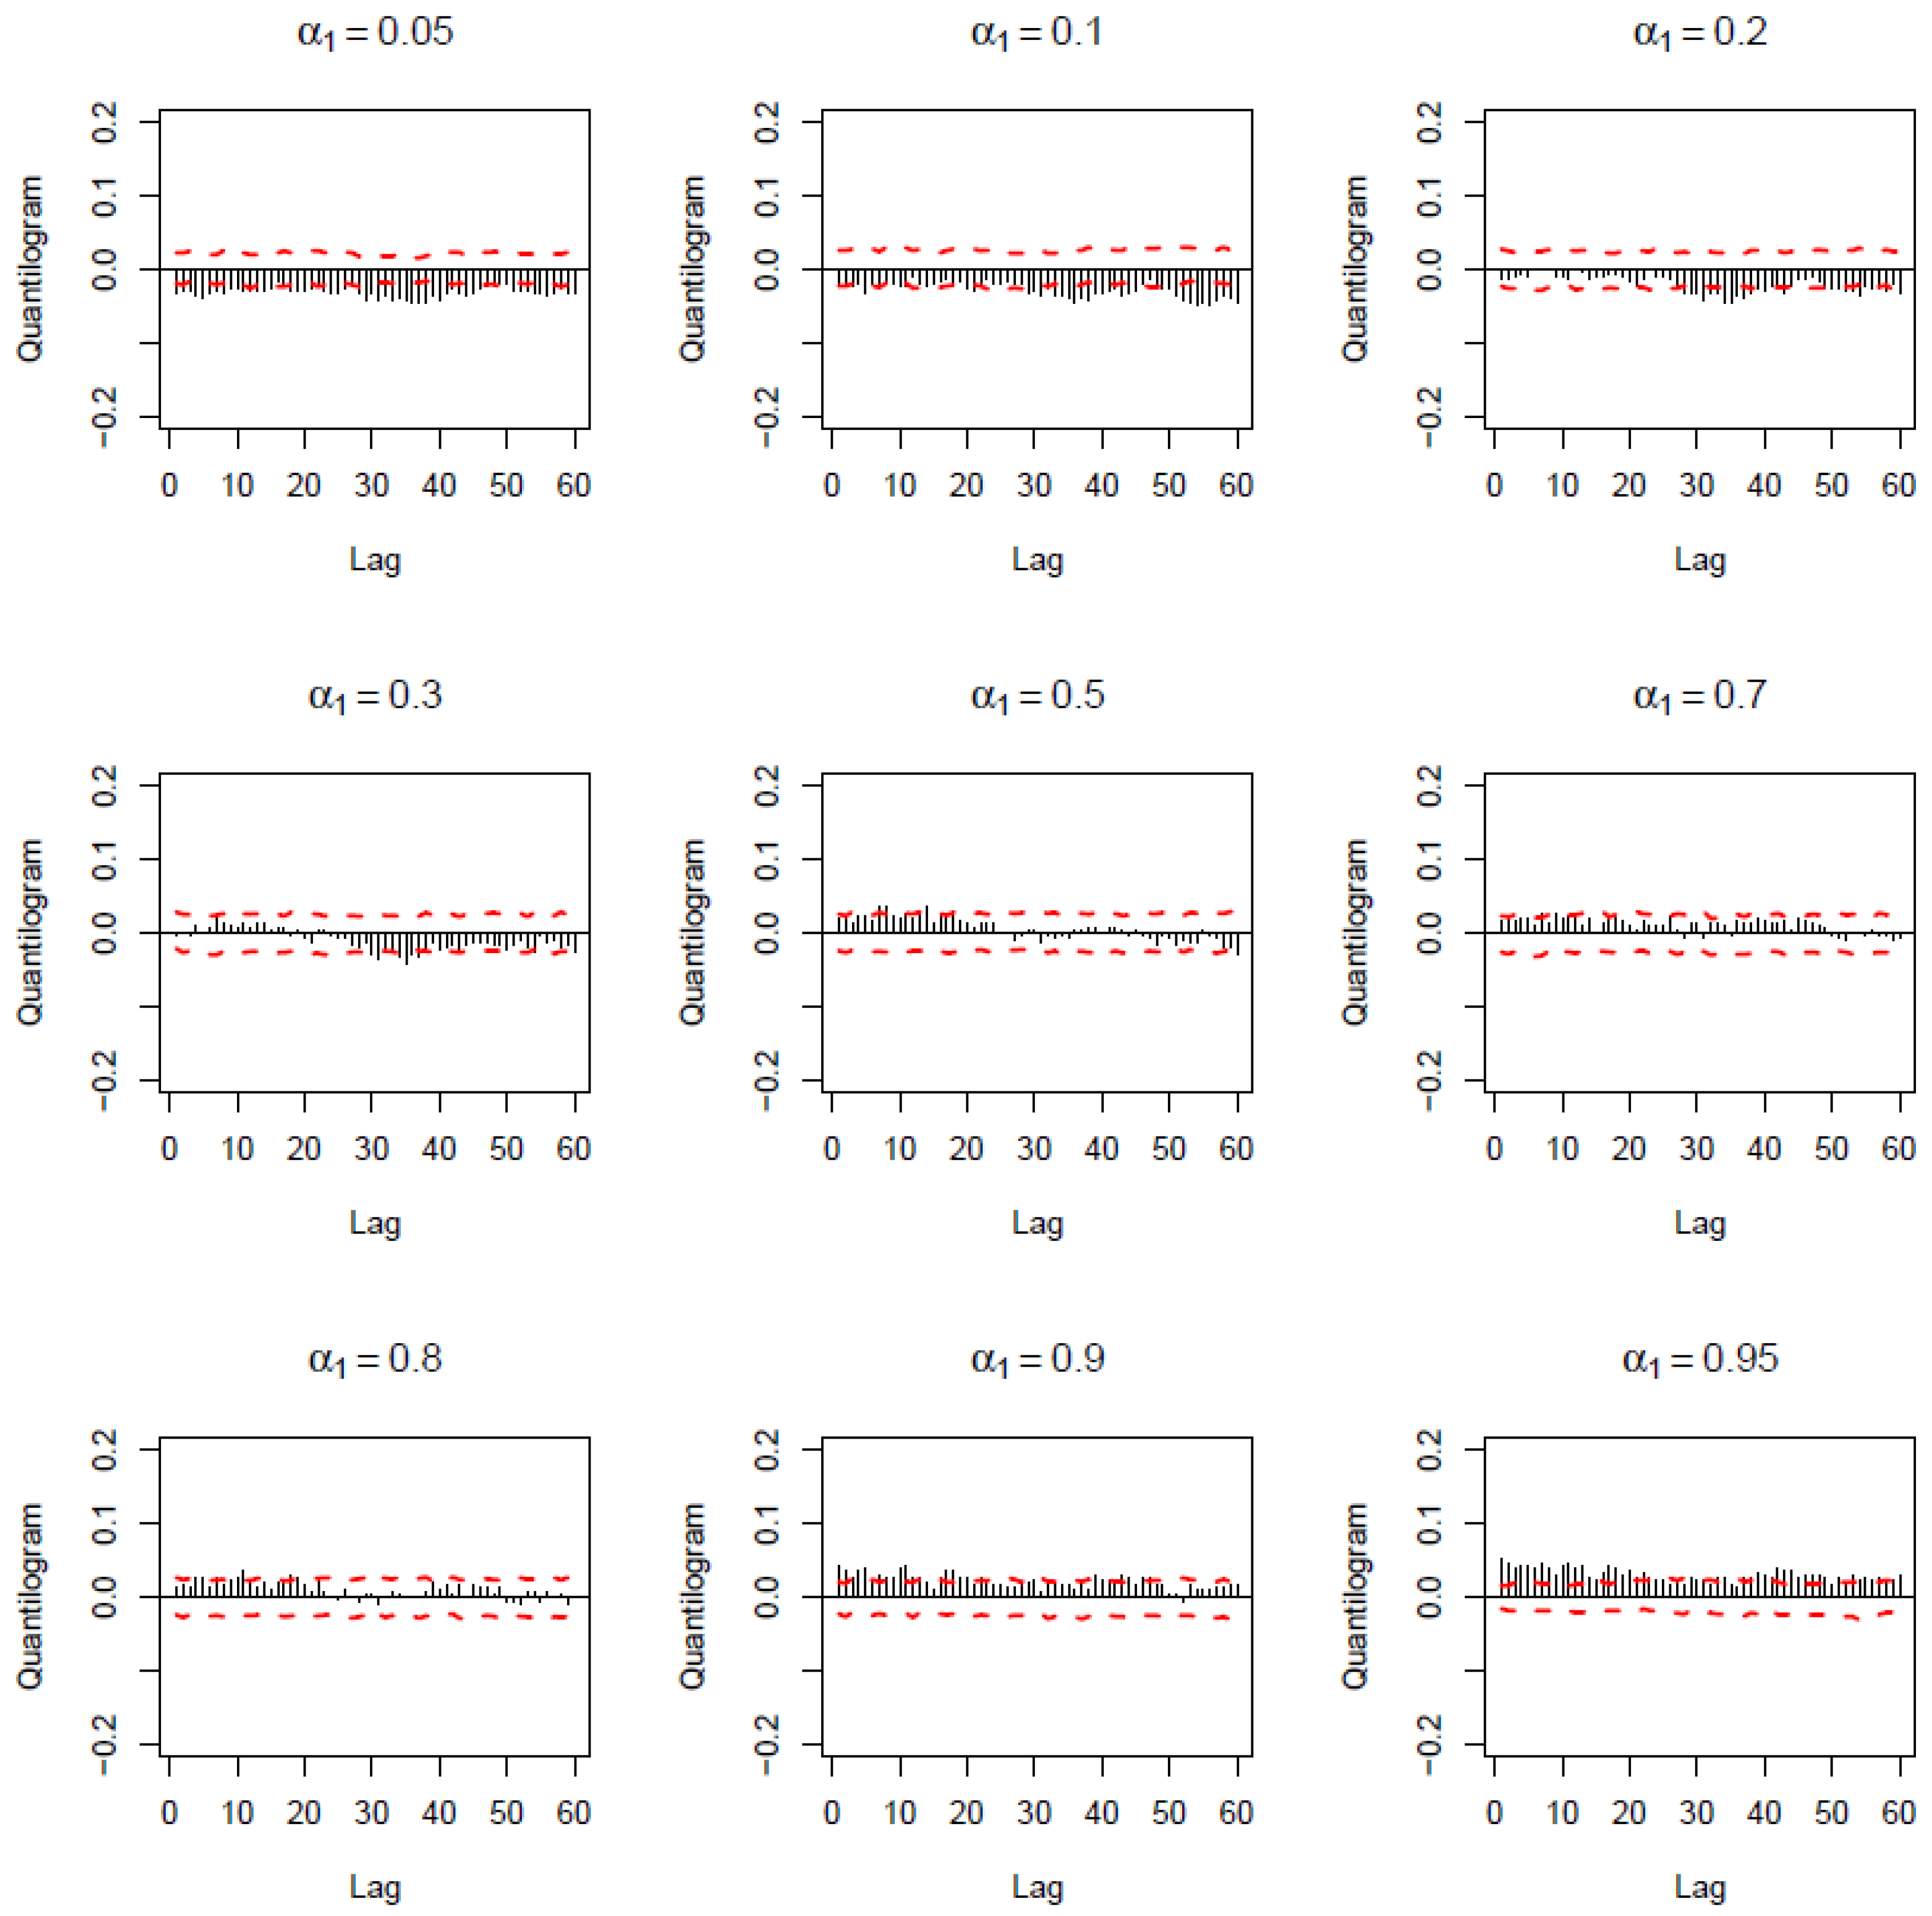
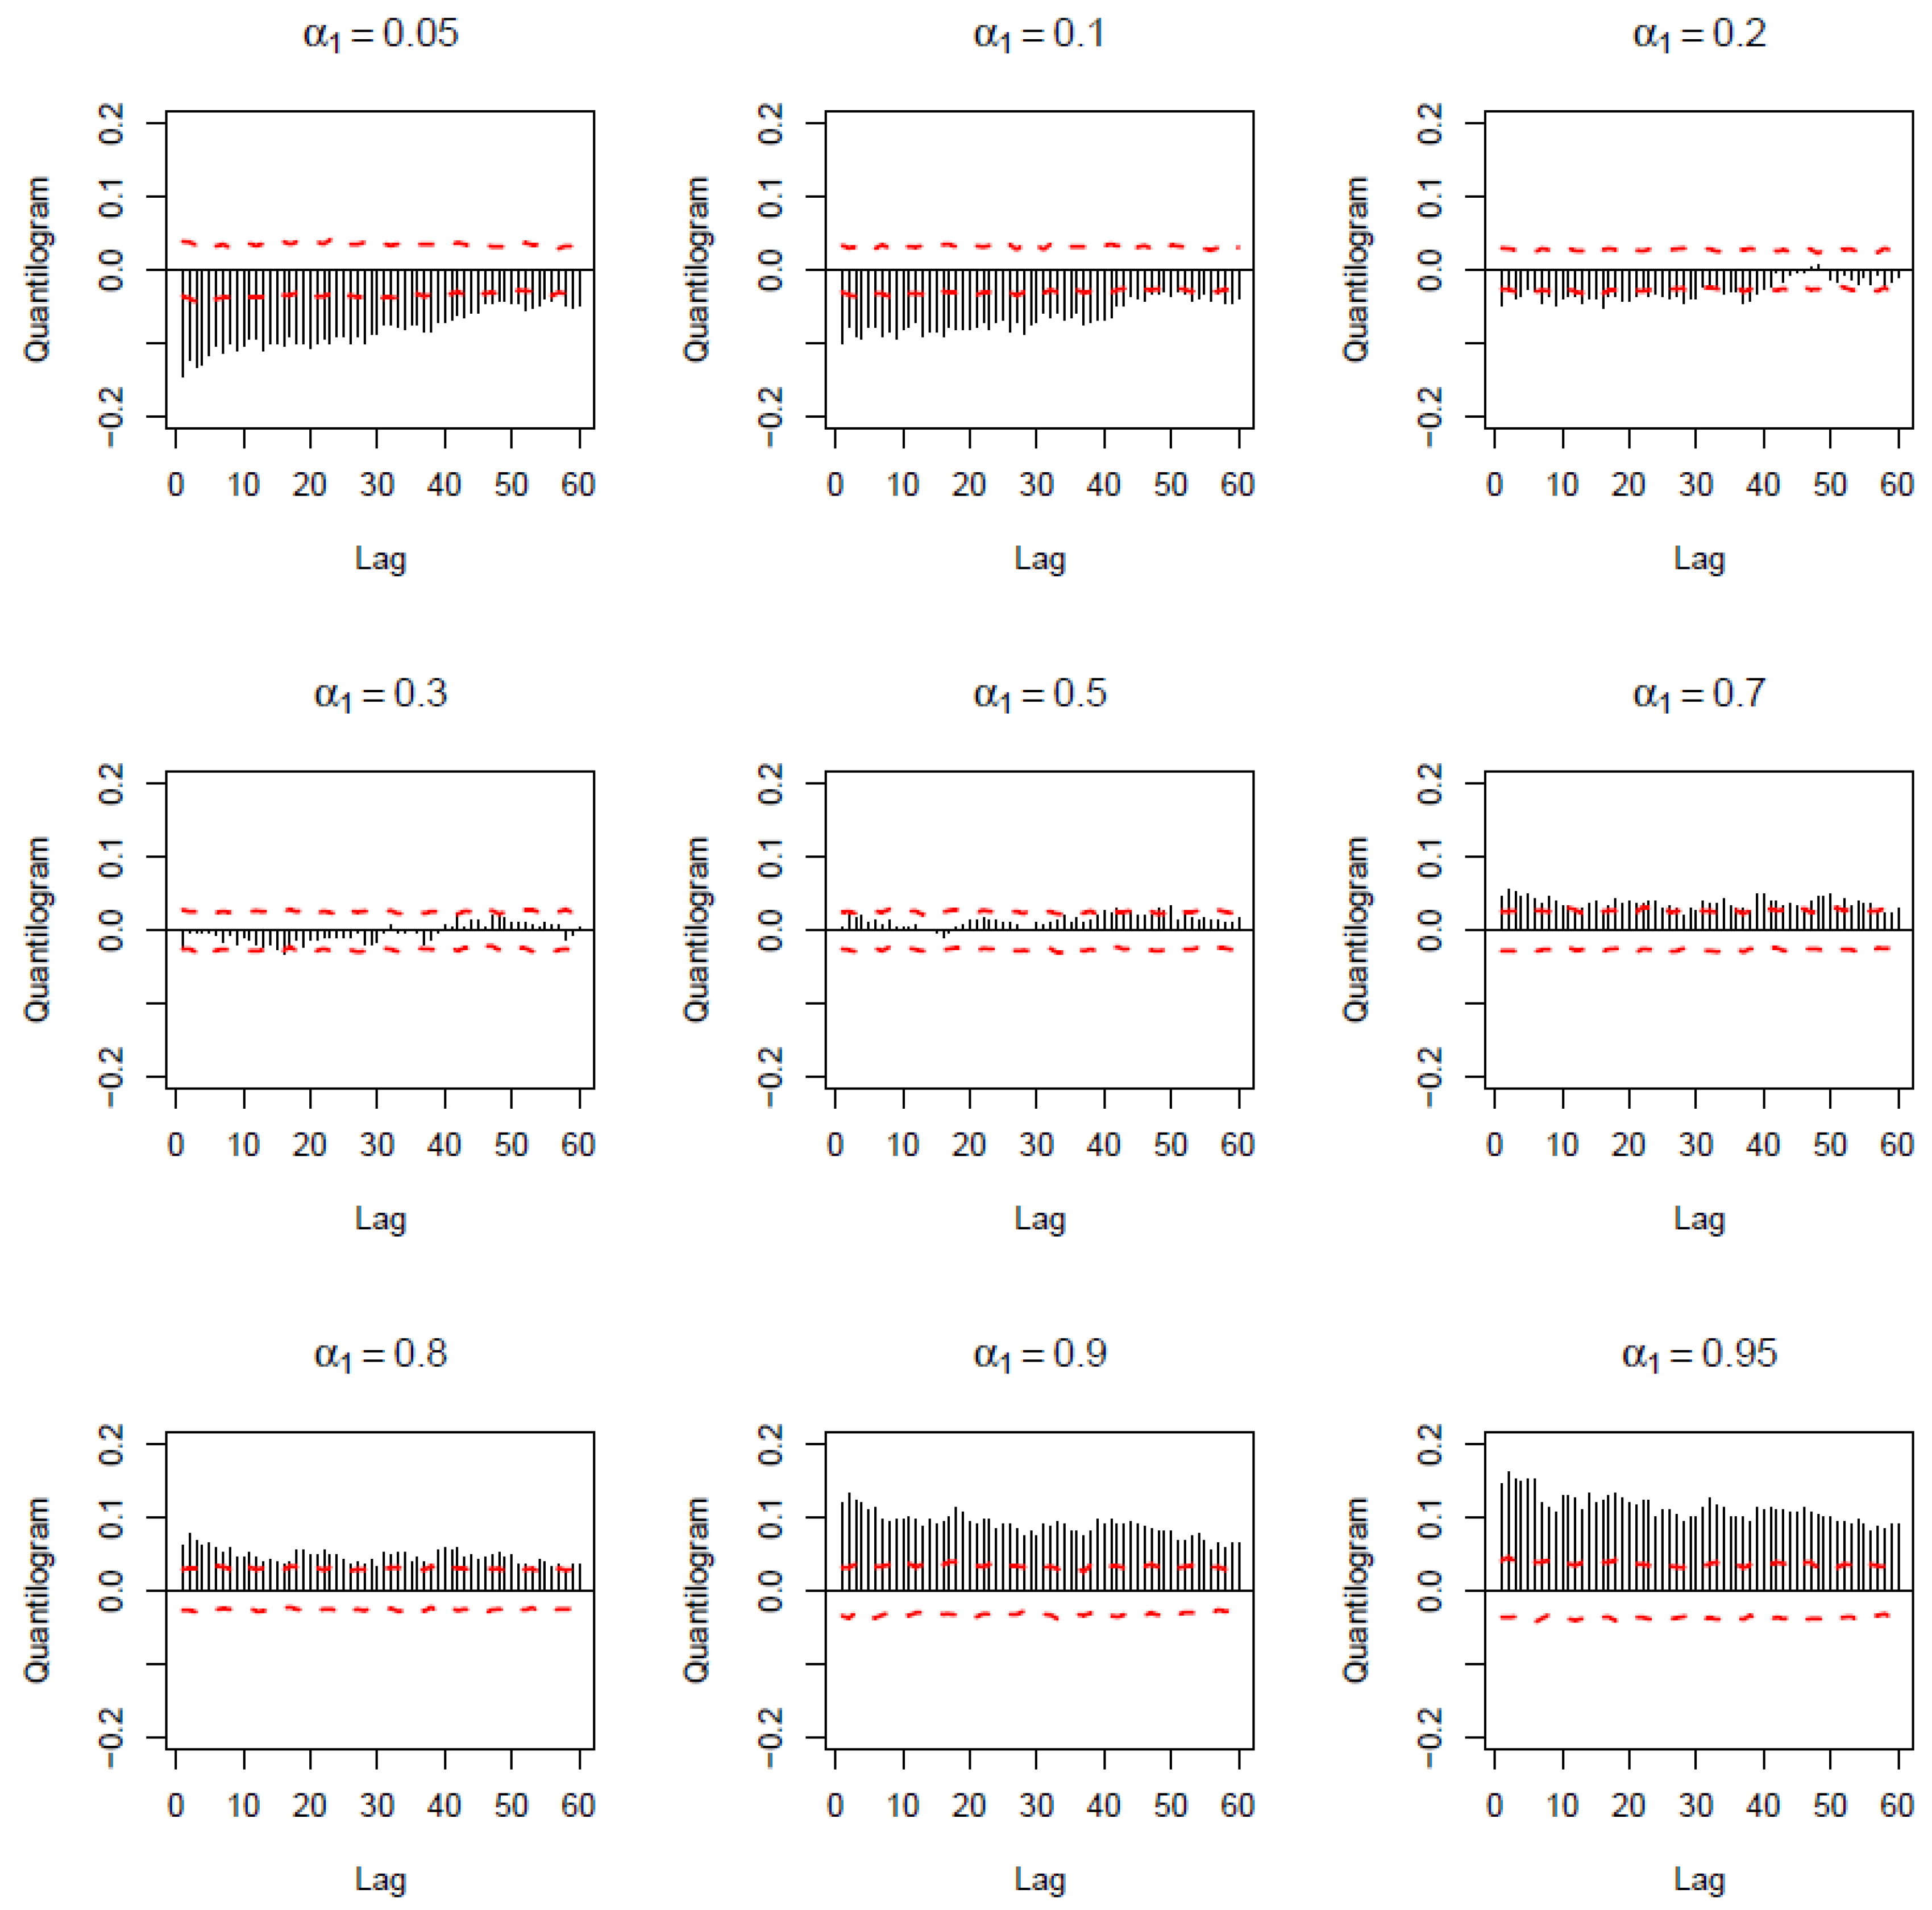
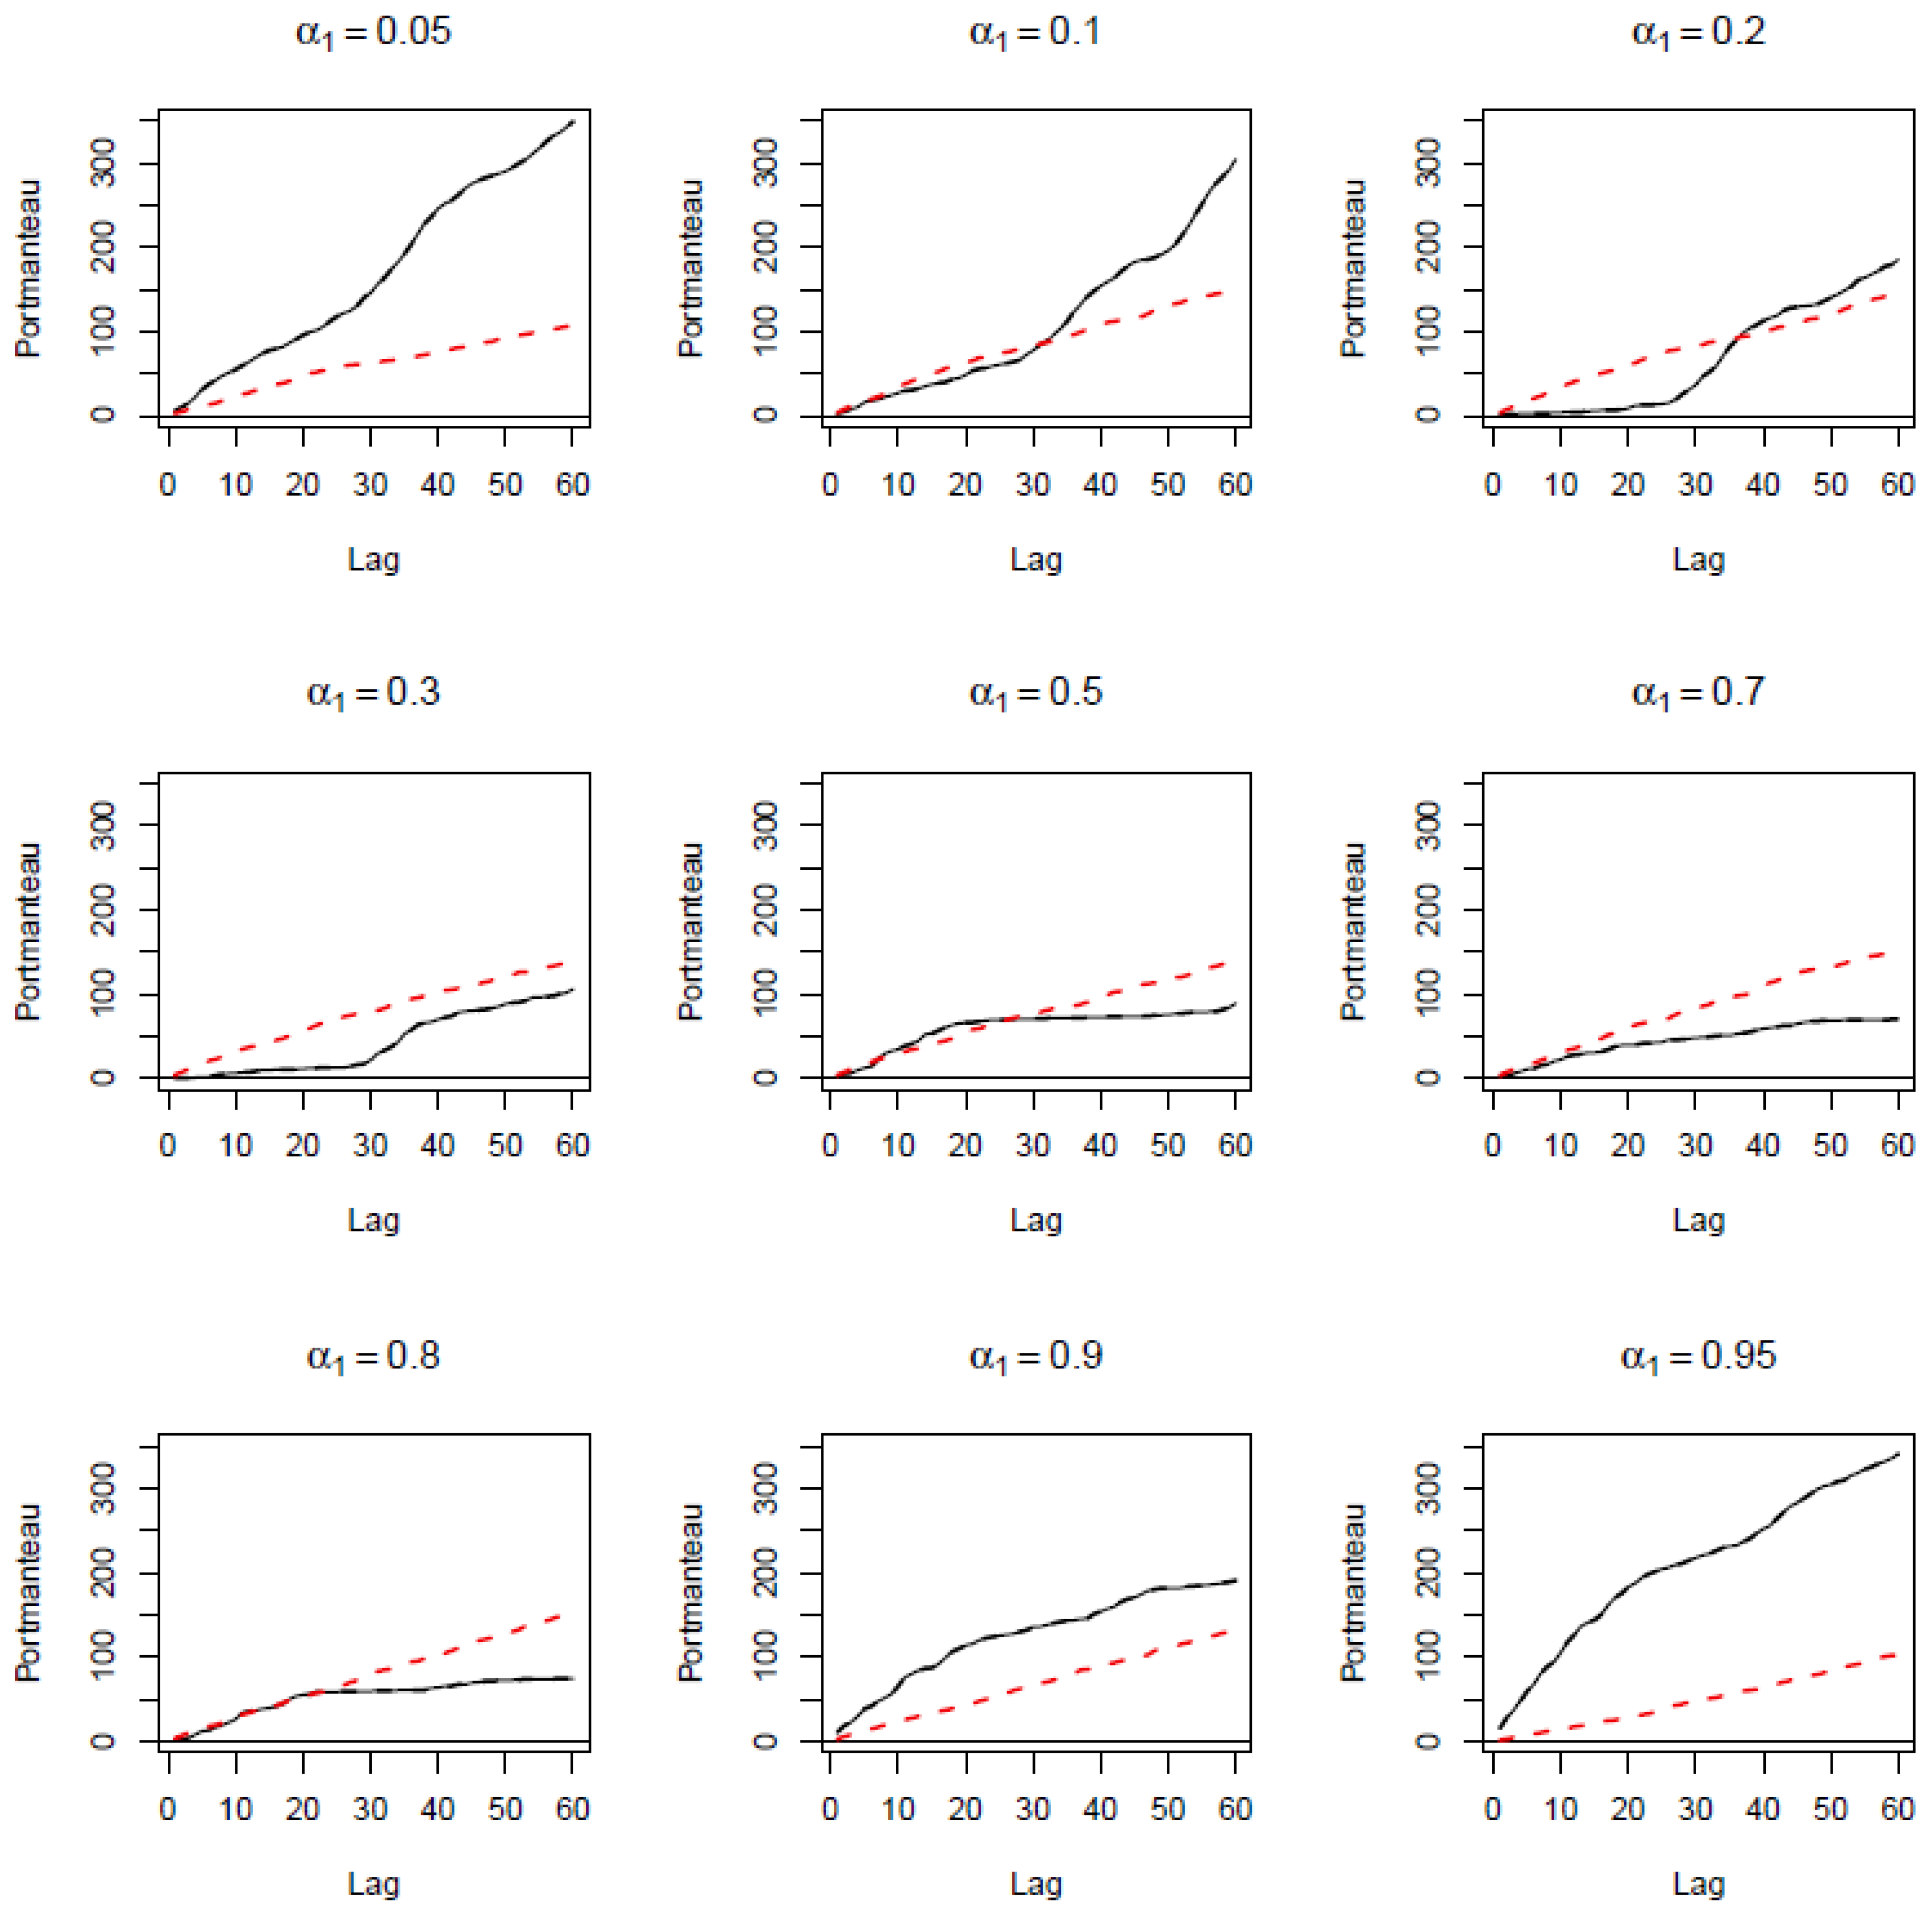
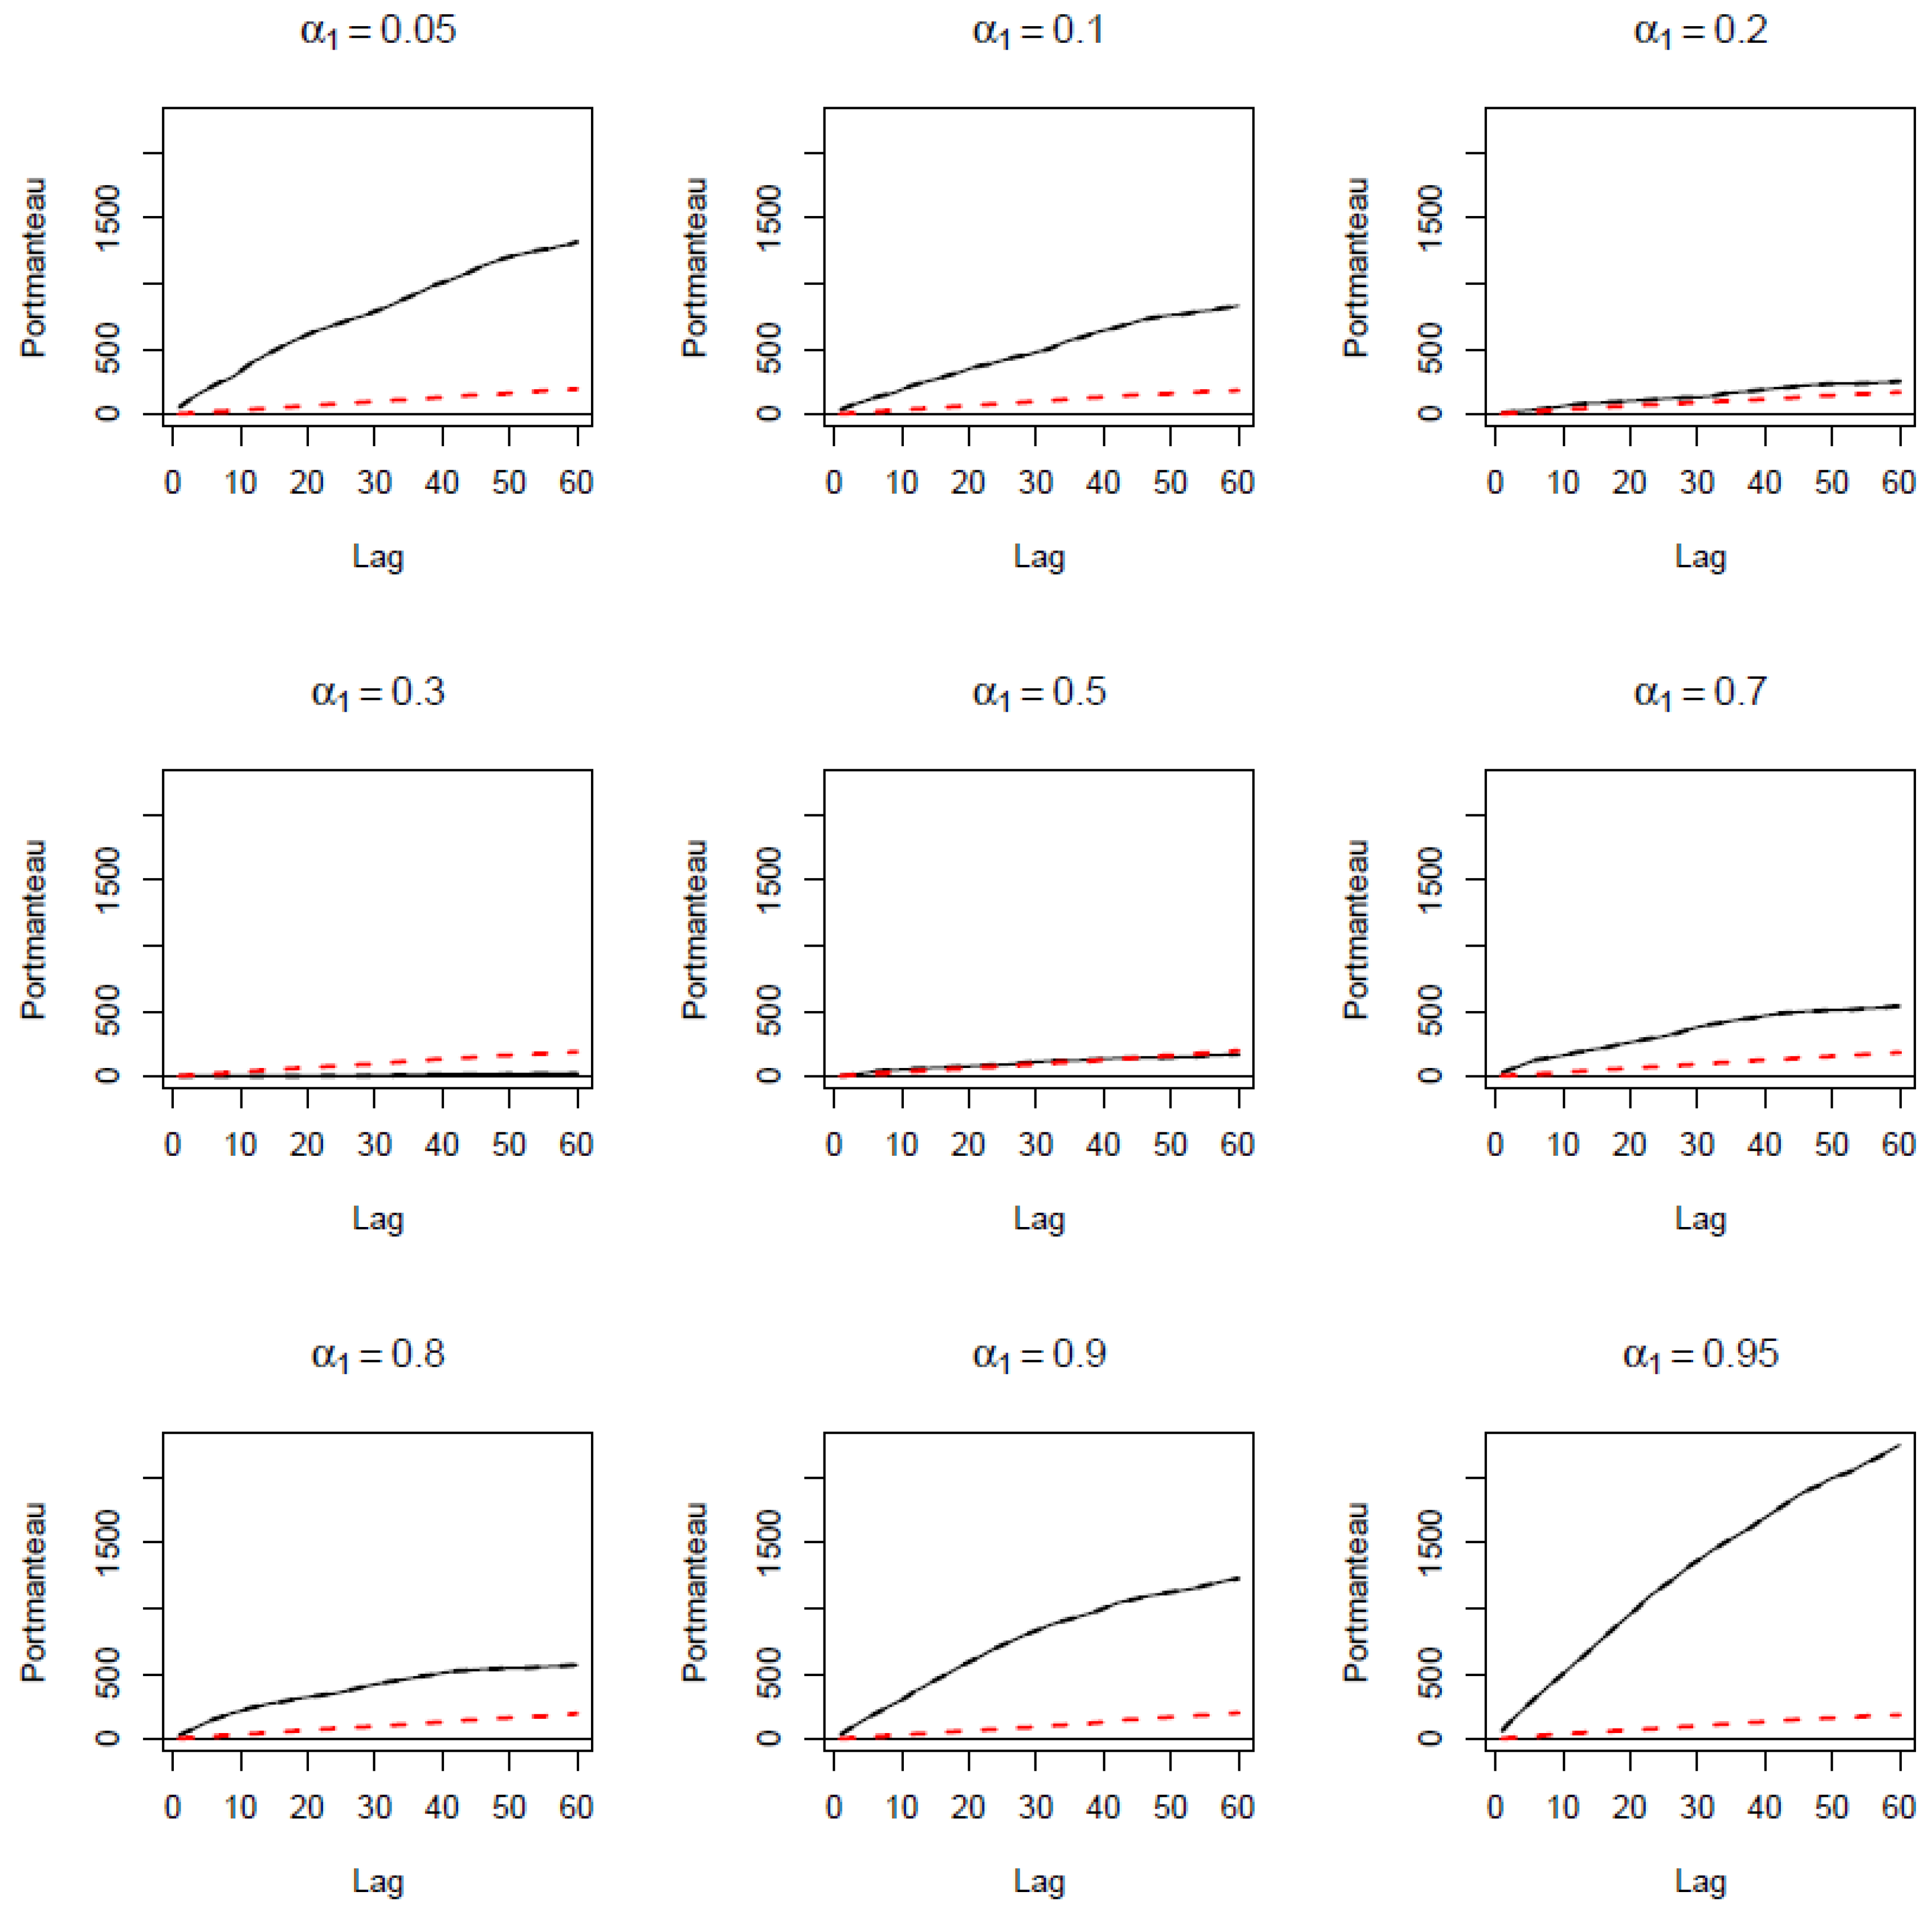
6
This pattern of negative relationship at lower quantiles and positive signs at higher quantiles relative to the median was also confirmed by the exceedance correlations of Ang and Chen (2002), complete details of which are available upon request from the authors.
7
Robustness checks based on the G10 Currency Future Harvest, G10 Currency Harvest and Global Currency Harvest indexes in US dollars and Euro (derived from the same data source reported in Footnote 2) yield qualitatively similar results. Moreover, as suggested by an anonymous referee, we conducted our analysis for the G10CHI returns for subsamples covering from the start to 2007, and from 2007 to the end. Not surprisingly, we found that while the pattern of directional predictability remains the same, the effects are way stronger in the second subsample—a result that makes perfect sense, as the latter period corresponds to heightened risk aversion in the wake of the global financial crisis. Understandably, our full-sample results are driven by the post-crisis period. Complete details of these results are available upon request from the authors.
Figure 1. Sample cross-quantilograms for low risk aversion quantile (α2 = 0.10). Note: The figures display the sample cross-quantilogram for the directional predictability from risk aversion to carry trade returns when risk aversion is in the low quantile (α2 = 0.1). α1 refers to the quantiles for the distribution of carry trade returns. Red dashed lines represent the 95% bootstrapped confidence intervals for no directional predictability with 1000 bootstrapped replicates.
Economies 08 00018 g001
Figure 2. Sample cross-quantilograms for median risk aversion quantile (α2 = 0.50). Note: The figures display the sample cross-quantilogram for the directional predictability from risk aversion to carry trade returns when risk aversion is in the median quantile (α2 = 0.5). α1 refers to the quantiles for the distribution of carry trade returns. Red dashed lines represent the 95% bootstrapped confidence intervals for no directional predictability with 1000 bootstrapped replicates.
Economies 08 00018 g002
Figure 3. Sample cross-quantilograms for high risk aversion quantile (α2 = 0.90). Note: The figures display the sample cross-quantilogram for the directional predictability from risk aversion to carry trade returns when risk aversion is in the high quantile (α2 = 0.9). α1 refers to the quantiles for the distribution of carry trade returns. Red dashed lines represent the 95% bootstrapped confidence intervals for no directional predictability with 1000 bootstrapped replicates.
Economies 08 00018 g003
Table 1. Summary statistics of carry trade return series and risk aversion index.
StatisticsG10CHI Return (%)Risk Aversion Index
Mean0.02742.7018
Median0.05572.5312
Maximum6.071727.1459
Minimum−8.01402.2310
Std. Dev.0.63370.8310
Skewness−1.032213.7736
Kurtosis17.7566305.1085
Jarque-Bera54,986.740022,792,372.0000
p-value0.00000.0000
Observations5944
Note: G10CHI is Deutsche Bank G10 Currency Future Harvest Total Return Index. Std. Dev: stands for standard deviation; p-value corresponds to the Jarque–Bera test with the null of normality.

