
Monetary Policy and Foreign Direct Investment—Empirical Evidence

Institute of Graduate Studies, Thu Dau Mot University, Thu Dau Mot City 75000, Vietnam
Economies 2023, 11(9), 234; https://doi.org/10.3390/economies11090234
Submission received: 4 August 2023
/
Revised: 5 September 2023
/
Accepted: 11 September 2023
/
Published: 13 September 2023
(This article belongs to the Special Issue Foreign Direct Investment and Investment Policy)
Abstract
:The purpose of this study is to evaluate the impact of monetary policy on attracting foreign direct investment. We used data for typical countries in Southeast Asia for the period 1997 to 2020, using regression of least squares (OLS), fixed effects (FEM) and random effects (REM), as well as cross-sectional dependence test based on panel-corrected standard errors (PCSE) and Driscoll-Kraay standard errors to evaluate differences in monetary policies of Southeast Asian countries over time. The results confirm that expansionary monetary policy has a negative influence on attracting foreign direct investment, while contractionary monetary policy has the effect of promoting the flow of international capital into Southeast Asian countries. The study also confirmed the positive impact of trade liberalization and the quality of human resources on the ability to attract foreign direct investment. However, no effect on foreign direct investment was found for urbanization rate, population size, or number of tourists.
1. Introduction
Investment capital is an important source of financial resources for businesses and economic sectors in society to invest, consume and develop the economy. Foreign direct investment can be considered as an important supplementary source of resources to make up for shortfalls in domestic capital and savings. Developing and emerging countries need investment capital for infrastructure investment, production, business, and economic development when the domestic savings rate is low, so seeking foreign savings is a first choice. In addition attracting international capital flows allows a country to obtain more capital for economic development (Kellard et al. 2022).
The Tobin Q theory states that the goal of business activities is to maximize the value of the business and thereby help shareholders, investors and possibly suppliers or customers receive high benefits (McDonald 2005). Businesses always require optimal profits in order to help shareholders and investors receive benefits such as increased dividends, share prices, and other benefits. In addition, businesses seek to diversify markets, including foreign markets, especially for expanding their market size. According to institutional theory, countries with favorable business environments often have advantages in attracting international investment flows. Indeed, a country with good institutional qualities can reduce transaction costs for foreign businesses and investors, enabling them to easily access the domestic market to seek profits (Suddaby 2013).
FDI also brings many other economic benefits to the host country (Le et al. 2022). Firstly, FDI capital is often accompanied by high technology content, innovation, high productivity, and higher management ability, so this capital source brings many benefits to economic growth. Secondly, foreign direct investment often stimulates interaction and technology transfer between FDI enterprises and domestic enterprises, thereby helping the domestic enterprises to improve productivity and efficiency. Thirdly, foreign direct investment often increases the ability to supply domestic needs as well as the ability to export, thereby increasing the trade of the country with the rest of the world.
In order to increase the efficiency of attracting foreign direct investment, the role of the financial market is indispensable, especially the role of the monetary policy of the country’s central bank (Karahan and Bayır 2022). When the central bank implements expansionary monetary policy, interest rates will decrease and businesses can access capital at lower interest rates, benefiting both domestic and foreign businesses. In this way, monetary policy can stimulate economic development. Conversely, monetary policy can be administered to adjust production to stabilize prices, which can help control inflation and economic growth (Karahan and Bayır 2022).
Research on the relationship of monetary policy and foreign direct investment has been discussed by many scholars. Karahan and Bayır (2022) argued that monetary policy has an effect on attracting foreign direct investment, that is, an expansionary or contractionary monetary policy has a negative or positive effect on FDI inflows. Albulescu and Ionescu (2018) also argued that monetary policy uncertainty has a negative effect on FDI inflows. Other research has suggested that the financial environment of the host country may have an influence on the decision of FDI enterprises to invest (Kellard et al. 2022).
The difference between domestic and foreign interest rates affects the decision to invest in the host country. Indeed, if domestic interest rates are higher than foreign interest rates, foreign investors increase their investment in the host country in search of profits. Conversely, when domestic interest rates are lower than foreign interest rates, foreign investors will reduce their investment in the host country. Moreover, domestic interest rates are mostly influenced by monetary policy; interest rates rise when the central bank implements expansionary monetary policy, eventually increasing investment in the domestic market. Conversely, interest rates fall when the central bank implements contractionary monetary policy, reducing investment in the domestic market.
Research on the relationship between monetary policy and foreign direct investment has not been conducted in Southeast Asia, noted as having some of the fastest and most dynamic economic development in Asia. Southeast Asia’s economy has maintained high growth, with many countries in the region, such as Singapore and Malaysia, having high development rates, while Vietnam, Thailand, Indonesia, and the Philippines as the group of emerging countries. Therefore, assessing the effect of monetary policy on FDI is the objective of this study. Our analysis is based on panel-corrected standard errors (PCSE) and Driscoll-Kraay standard errors. We also look at cultural, economic and social similarities of countries in the region.
2. Theoretical Background
Theoretical background about this relationship is supported by several theories that have been discussed. According to the Tobin Q theory, businesses in particular and countries in general always want to seek profits to increase the benefits from doing business. When the domestic market has become crowded, promoting foreign investment is the way to maximize business benefits and enhance business value and economic growth (McDonald 2005). Alternatively, portfolio balance theory emphasizes that businesses should diversify their investments to minimize risks and maximize benefits, so investing in foreign markets is a good strategy (Gupta 1970). In a volatile business environment or amid political instability and conflict, businesses can diversify their portfolios by choosing to invest in other countries, in different geographical areas, or in different types of businesses. The process of portfolio diversification helps businesses to balance benefits and minimize risks due to uncertainties.
According to institutional theory, international capital flows often favor countries with good institutional qualities (Suddaby 2013). According to Acemoglu and James (2012), a country with inclusive institutions has an advantage in doing business over a country with exclusionary institutions because the former allows business development, which can put the country on the path to prosperity. Therefore, countries should create favorable business environment by reducing social transaction costs, informal costs and corruption, attracting foreign investment flows.
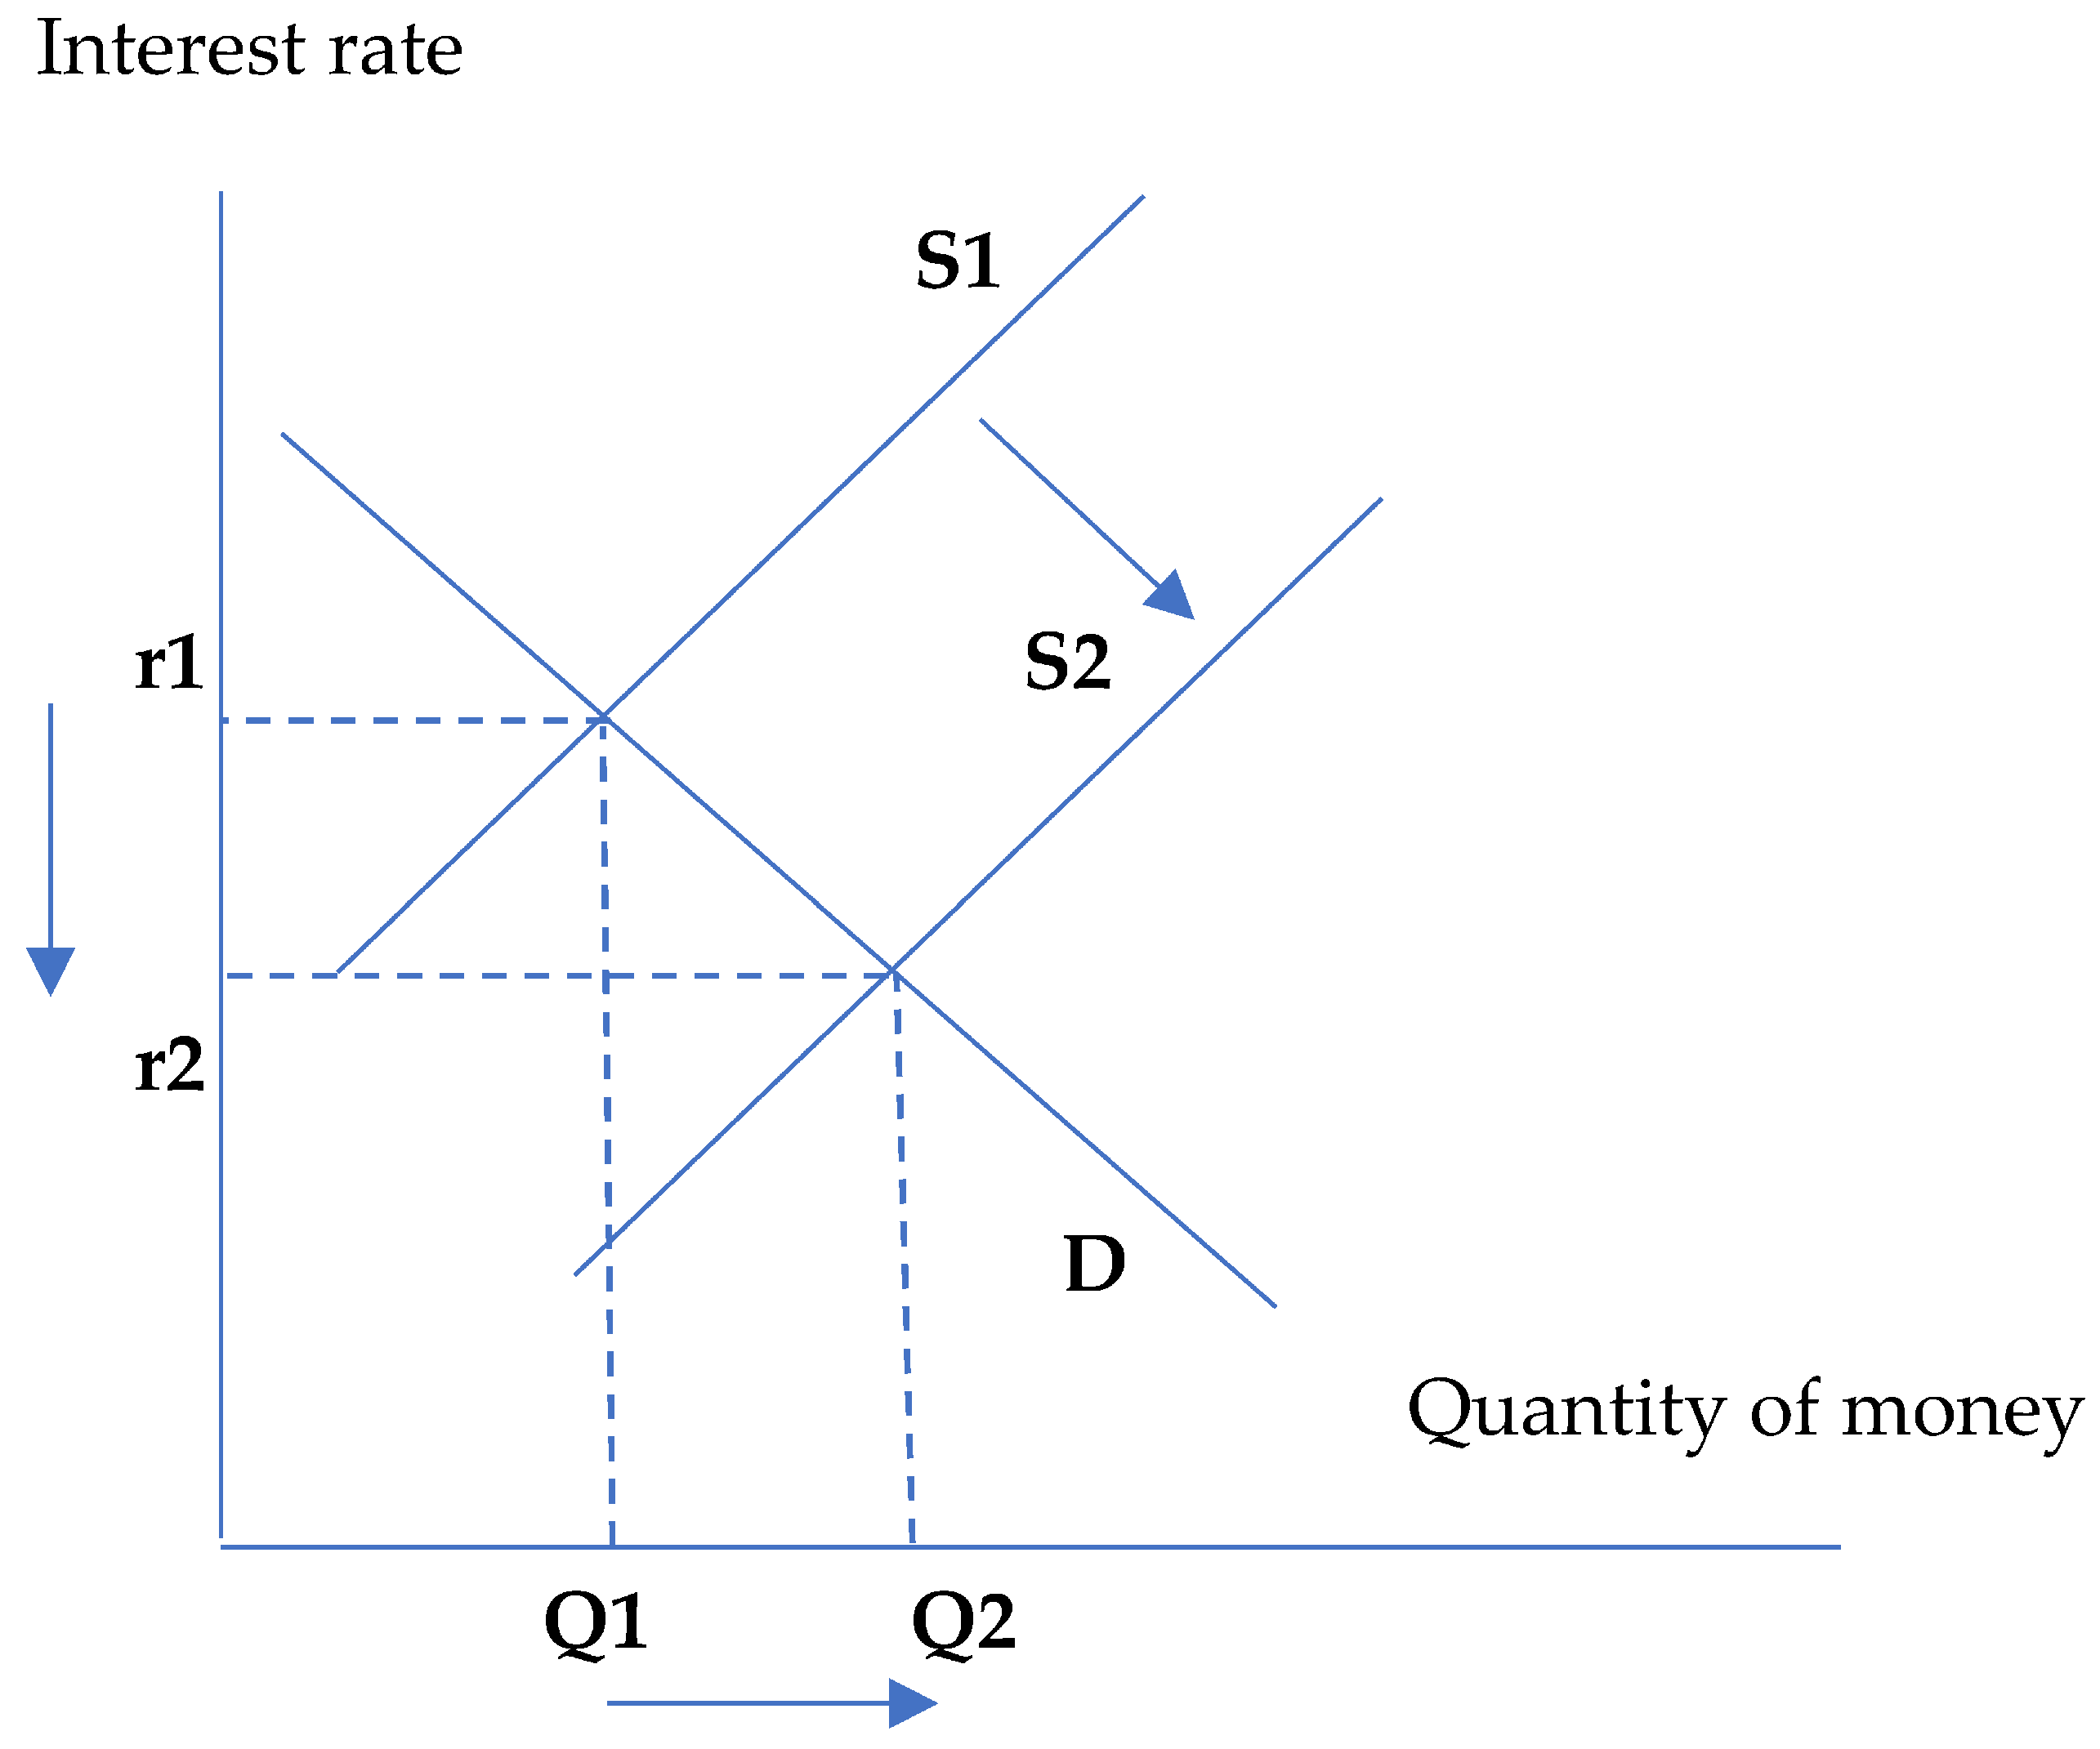
Monetary policy is usually implemented by the central bank, usually with either contractionary monetary policy or expansionary monetary policy. When the central bank maintains an expansionary monetary policy, meaning that market interest rates fall, international capital flows tend to pour into the host country. However, if the central bank maintains a contractionary monetary policy, it will lead to an increase in domestic interest rates; with a large difference between domestic and foreign interest rates, international capital flows will increase and promote domestic investment. In this way, monetary policy has an influence on decisions to expand or narrow international investment flows. Figure 1 shows that when the money supply increases, interest rates decrease, stimulating investment, and conversely, when the money supply decreases, interest rates increase and negatively affect investment. Expansionary or contractionary monetary policy can reduce or increase interest rates, meaning that there is a relationship between monetary policy and interest rates.
3. Literature Review
Financial markets are intended to represent the link between savings and investment, and as financial markets develop, economies enjoy a low cost of capital, resulting in increased investment, consumption, and economic performance. Transaction costs must be reduced to help lower interest rates for businesses. To do that, the financial market should make the best of its ability to mobilize, circulate and allocate capital and connect domestic savings and investment.
It is assumed that foreign direct investment has an effect on economic integration in a country. However, FDI often declines when the economy is in crisis or recession. In that context, credit markets are often inefficient. Monetary policy often expands and is suddenly adjusted. In times of economic depression, there should be effects of monetary policy on FDI inflows. A study by Albulescu and Ionescu (2018) in 16 EU countries, using cointegration analysis of heterogeneous panel data and the FMOLS and DOLS methods, suggested that financial conditions are the source of FDI flows; namely, uncertain monetary policy has a negative effect on FDI inflows. In addition, the business cycle has an impact on attracting international capital flows; a high growth rate is an important condition for a country to attract foreign capital flows for business development. Karahan and Bayır (2022) argued that contractionary monetary policy is likely to negatively affect the ability to attract FDI inflows in developing countries. Therefore, monetary policy has not succeeded in attracting international capital flows, especially when this policy was maintained during the recent COVID-19 period in many countries. Contractionary monetary policies were maintained due to concerns about recession effects from the stock market and rising interest rates. The countries needed more attractive policies to attract FDI inflows in order to compensate for the negative financial impact of contractionary monetary policy in the context of the shock of the pandemic, which affected many economies.
Given that capital flows often shift from places of surplus to places of shortage, especially in the case of West African countries, whose level of economic development is assessed to be low, monetary integration can help countries attract investment capital, including FDI inflows. This is considered an important supplementary source for domestic investment, creating jobs and boosting domestic demand and economic growth. Research by Cham (2016) suggested that FDI to African countries was associated with the positive effects of monetary integration; in particular, countries with large populations and favorable geographical locations had more advantages. Foreign direct investment capital can be associated with risks; Kellard et al. (2022) suggested that risks in the host country have an influence on the FDI capital. Weak financial discipline in the host country can scare off foreign investors. Therefore, attracting foreign capital flows not only depends on economic development, but also on the financial environment of the host country (Kellard et al. 2022).
Foreign direct investment provides financial resources for long-term economic growth. It is an important resource for spreading knowledge, technology, and competition in the economy. As a result, many countries have liberalized their foreign direct investment policies and reduced barriers to FDI inflows. Research by Reiter and Steensma (2010) also suggested that human capital is a factor that positively affects FDI; when corruption decreases, this effect becomes stronger. When a country maintains restrictions on foreign investors participating in economic activities, or discriminates between foreign and domestic investors, the role of human capital in FDI attraction becomes more obvious. Therefore, improving human capital is an important driver for the ability to attract FDI in both the short and long term. Improved human capital is consistent with the ability to interact with and learn and receive technology transfer from FDI firms. A similar study, by Noorbakhsh et al. (2001), argued that the developing and emerging countries only have an advantage in attracting FDI when these countries improve their skilled labor and the quality of human resources. Human capital is an important factor in successful FDI attraction; in a country possessing high human capital, the ability to attract FDI can be prolonged in the long run, increasing the contribution of international capital inflows. Further, Abbas et al. (2022) confirmed that high human capital is associated with higher-paid workers, which is the main factor determining the investment choice of FDI enterprises. FDI enterprises need to harmonize between paying for labor costs and labor productivity while ensuring corporate financial efficiency.
The process of attracting FDI inflows is often associated with trade policies. In general, a country is very unlikely to invite foreign investors to make investments in a closed economy. Therefore, trade liberalization, associated with the ability to attract international capital flows and investment attraction, can help businesses to exploit not only the domestic market but also the international market. Bao et al. (2022) argued that trade policy uncertainty significantly affects FDI flows in the global market. In the case of China, the country has major foreign trade with the US. As trade policy uncertainty subsides, FDI inflows into China increase and there is an increase in FDI in high-exporting industries. Therefore, trade liberalization brings many benefits to the host country. Moreover, FDI enterprises have the ability to dominate the international market and boost exports. Similarly, Singapore has a high level of commercialization and at the same time has achieved many successes in attracting FDI inflows. The same is true for Vietnam, Thailand and Indonesia (Zeeshan et al. 2022).
Based on the original study of Karahan and Bayır (2022) and the discussions above, the hypothesis of this study can be stated as follows:
H1.
Monetary policy significantly impacts all foreign investment in Southeast Asia.
4. Data and Methodology
In this study, we collected data from typical Southeast Asian countries, the so-called ASEAN 6 group. The ASEAN 6 group includes Vietnam, Singapore, Thailand, the Philippines, Malaysia, and Indonesia. This group accounts for most of the GDP of Southeast Asia. In this study, the authors collected data from the World Bank and the International Monetary Fund. Other data was collected from each country’s statistical bureau. The period analyzed was from 1997 to 2020. Data was processed for errors and then used for quantitative analysis. The study uses the variables summarized in Table 1.
The study adjusted the models of previous research by Karahan and Bayır (2022) and Abbas et al. (2022), adding new variables. The regression equation is as follows:
Model 1:
Model 2:
Model 3:
In this case, the collected data covered a period t of 23 years in a total of 6 countries, so it can be considered to be longitudinal data. The analysis of this paper is shown in Figure 2:
Theoretically, because this is panel data, the study should use regressions of least squares (OLS), fixed effects (FEM), and random effects (REM). To choose between OLS and FEM, the F-test was used. To select between FEM and REM, the Hausman test was chosen. Through these two tests, we determined the best regression model. We then evaluated heteroskedasticity or autocorrelation, and when glitches of these types occurred, feasible generalized least square (FGLS) regression was employed.
Because the selected countries are located in Southeast Asia, the economic and political activities of the countries are closely linked with each other. However, each country has different characteristics, which change over time due to cultural factors and geographical location. These features are not observed in the model, and the regression may not fully reflect these unobserved characteristics, causing bias in the estimated model. Therefore, this study uses fixed-effects year (FE year) regression to assess the time invariance and the unique characteristics of each country. The advantages of FE year regression are that it is possible to evaluate changes in different factors while the time factor does not change (thus, it can be said that the time factor is fixed). In total, the research results are drawn from combinations of the discussed regression methods. This is also the basis for performing robustness checks, which help us assess the reliability of the results of this study.
The countries in Southeast Asia have a close relationship as members of the Association of Southeast Asian Nations (ASEAN). Their relationships are based on respect for each other’s political institutions. Therefore, there are close relationships between countries, and there are also mutual impacts on each other. For example, Singapore implemented policies on trade and investment liberalization, becoming a financial center of the region; these policies have influenced the development strategies of other countries in the region. This reflects the degree of interdependence between countries, which is why we perform cross-sectional dependence tests; when this relationship exists, we use panel-corrected standard errors (PCSE) and Driscoll-Kraay standard errors to evaluate the robustness of the study. Hoechle (2007) explained that panel-corrected standard errors (PCSE) and Driscoll-Kraay standard errors are useful for showing cross-sectional dependence. Therefore, panel-corrected standard errors (PCSE) and Driscoll-Kraay standard errors are suitable for showing the effects of cross-sectional dependence, which cannot be shown using traditional regression methods such as OLS, FEM, and REM.
This test shows the null hypothesis of no cross-sectional dependence when N → and T is sufficiently large. In addition, the CD statistic has a mean at exactly zero for fixed values of T and N in a wide range of panel-data models.
5. Results
5.1. Descriptive Statistical Analysis
Table 2 presents the descriptive statistics for the variables used in the estimation model. FDI inflows reached an average value of 5.64% of GDP, remaining quite high throughout the period of 1997 to 2020. However, there was a huge difference in the ability to attract FDI between Singapore and the other selected countries. Regarding monetary policy, broad money was significantly expanded, with an average value of 93.76% of GDP.
5.2. Multicollinear Analysis
Table 3 shows the results of the correlation analysis, demonstrating that the independent variables had a low degree of correlation. However, the TRADE and POP and URBAN and POP variable pairs had a high degree of correlation, suggesting the possibility of multicollinearity for these two pairs of variables. Therefore, the study performed multicollinearity analysis through the variance inflation factor and found that the two variables URBAN and POP need to be regressed separately to ensure the absence of multicollinearity. Table 4 shows that multicollinearity is likely to occur when the regression equation includes the two variables URBAN and TRADE simultaneously, so we performed separate regressions to avoid this phenomenon.
5.3. Results
In the regression results in Table 5, the F test confirmed that the FEM estimate is more applicable than the OLS. According to the Hausman test, the FEM method was confirmed to be better than the REM. Therefore, FEM estimation can give the best results. However, the estimated results have heteroskedasticity and no autocorrelation, so we needed to perform estimation using FGLS.
As discussed above, because different countries have different characteristics, politics affect ASEAN countries differently from year to year, which is the reason for the FE year regression. At the same time, the FE year estimate is also a re-match for the FGLS regression. Table 6 shows that the variable MONETARY had a negative impact on FDI and was statistically significant. The variables HUMAN and TRADE had a positive effect on FDI and were statistically significant. Other variables, such as URBAN, POP and TOURIST, were not statistically significant; therefore, it can be said that urbanization rate, population size and number of tourists had no impact on foreign direct investment attraction.
Southeast Asia has formed the ASEAN economic community (AEC), which interconnects countries via economic activities, trade, investment, and labor mobility. Southeast Asian countries are also discussing the formation of a common currency in the region. It can be said that economic and social activities are tightening cooperation relationships between countries in the region. Thus, it is evident that economic, social, investment and trade activities can form interdependent relationships. To clarify this relationship, we performed a dependency relationship test using Driscoll-Kraay standard error regression analysis to be able to more clearly assess the impact. Hoechle (2007) explained that panel-corrected standard errors (PCSE) should be used for a robustness check for Driscoll-Kraay standard errors. The results are shown below.
Table 7 shows that interdependence relationships may exist between countries in terms of monetary policy. Namely, when a country implements its monetary policy, it can affect neighboring countries. Major economies in the region, such as Singapore and Indonesia, can have an influence on smaller economies such as those of the Philippines or Vietnam. This dependence can also exist in variables such as human capital, population size and tourism development. Thailand is known as a country with the ability to attract tourists. Thailand’s tourism policy often affects countries with fewer tourist attractions, such as Indonesia and the Philippines.
The results in Table 8 show that monetary policy can also have a negative impact on foreign direct investment. The level of trade has a positive and statistically significant effect on FDI, as does the level of tourism development. The regression results in this study support the regression results in cases when the dependence between countries is not taken into account. As shown in Table 6 above, the influence of monetary policy, trade openness, and tourism development on FDI is relatively certain and significant.
6. Results
6.1. Monetary Policy
The regression results show that monetary policy has a negative impact on FDI attraction in typical Southeast Asian countries. More specifically, when a central bank implements a contractionary monetary policy, it has positive effects on the attraction of international capital flows. This is because the central bank’s contractionary monetary policy can increase domestic interest rates, and thus there is a difference in domestic and foreign interest rates. It is evident that international investors constantly seek business opportunities in host countries, including FDI enterprises that are likely to be prepared to seek investment opportunities. The research results also suggest that when the central bank implements an expansionary monetary policy, the inflow of international capital into the country will decrease, because implementing an expansionary monetary policy can lead to a decrease in domestic interest rates, decreasing the difference between domestic and foreign interest rates. Therefore, the incentive to invest in the host country is reduced. It can be said that the results of this study are consistent with the theoretical framework discussed above. However, Kellard et al. (2022) argued that countries should maintain financial discipline in order to encourage domestic and foreign enterprises to expand their business and investments. Further, Fry (1982), Thornton (1991), and Yülek (2017) also indicated that even when there is a difference in domestic and international interest rates, it is not always possible for international capital flows to come to the host country if the host country has an unfavorable business environment and financial repression. According to institutional theory, countries with low institutional quality often have low levels of market compliance and therefore low financial compliance, negatively affecting their ability to attract foreign investors into the country. A favorable business environment is important for attracting capital, leading to the socioeconomic development of the host country. In addition, institutional theory also holds that good institutions can reduce transaction costs, helping investment projects become more efficient and expanding investment. Domestic and, especially, foreign enterprises are always slow to diversify investment locations to spread risks. Therefore, appropriate monetary policy implementation is very important for promoting FDI inflows. Indeed, FDI significantly affects the economy of most countries. Capital inflows are always prioritized or restricted based on the difference between domestic and international interest rates. At the same time, monetary policy can help countries respond to currency wars or external shocks, and thus has an effect on the ability to attract international capital flows, including FDI.
6.2. Other Factors
The study also confirms that improving the quality of human resources is a basis for attracting foreign direct investment inflows. This is consistent with the research of Reiter and Steensma (2010), who suggested that human capital is associated with the process of spreading and acquiring technology and knowledge and improving competition in an economy. As human capital increases, the process of technology transfer can increase. These benefits help FDI enterprises to expand investment by taking advantage of skilled labor and high labor productivity. Abbas et al. (2022) also agreed that skilled workers can receive a higher level of income, enabling workers to regenerate labor faster and maintain productivity in order to ensure a contribution to business performance.
Our results also indicate that trade liberalization is consistent with attracting foreign direct investment. Indeed, attracting FDI inflows is often linked to the trade policies of the host country. International investors make investments abroad to exploit foreign markets or to take advantage of cheaper labor to produce goods for export. Foreign trade in a country is heavily influenced by trade policies. Countries with trade liberalization policies often have an advantage in attracting investment over other countries. Bao et al. (2022) argued that trade policy uncertainty has a negative effect on FDI flows. Therefore, it is necessary for countries to maintain a stable trade policy to help FDI enterprises feel secure in doing business and expanding investment. The study also confirms the importance of international integration through international trade policy. Many Southeast Asian countries have a high level of international trade and are quite deeply integrated into the world economy. Specifically, Singapore, Malaysia and Vietnam have high trade openness, which is the driving force for these countries’ ability to attract international capital flows.
7. Conclusions
Financial markets play an important role in the movement and allocation of capital in an economy., The role of the central bank is clearly important in implementing monetary policy to make the capital allocation process more efficient. In this case study of typical Southeast Asian countries for the period 1997 to 2020, we used the regression of least squares (OLS), fixed effects (FEM) and random effects (REM), and performed analysis of defects in the regression model. In addition, we used feasible generalized least squares regression (FGLS) which is appropriate when defects are present in a model. We evaluated differences in the monetary policies of the countries over time. Our results confirm that expansionary monetary policy has a negative effect on attracting foreign direct investment, while contractionary monetary policy has had the effect of promoting this capital inflow in Southeast Asian countries. The study also confirms the positive impact of trade liberalization and the quality of human resources on the ability to attract foreign direct investment. On the other hand, there was no effect of urbanization rate, population size, or the number of tourists on foreign direct investment. The research results show that the influence of tourism had the strongest impact, while the influence of trade and monetary policy on the ability to attract FDI inflows was relatively similar. Through the study, it can be seen that monetary policy is one of the tools affecting FDI inflows, but other factors also have some influence on the ability to absorb international capital flows.
Based on the study, we can make some recommendations for Southeast Asian countries in attracting foreign direct investment. First, countries in the region need to be flexible in managing monetary policy implementation and steadfast in policy implementation in order to help FDI enterprises feel confident about government policies and expand their investment in the host countries. Second, countries need to improve the level of trade by maintaining trade liberalization, as well as continuing to simplify tariff procedures. Third, countries must continue to invest in infrastructure, especially tourism infrastructure, as well as to simplify visa operations in order to encourage international tourists to visit the countries.
The study has some limitations that are suggestive for future research. Firstly, this study only evaluates the influence of monetary policy on FDI attraction. However, there are many other factors that may affect FDI, such as economic growth, energy consumption, regional geography or other factors. Secondly, the study stops at assessing the relationship of monetary policy and FDI in Southeast Asia, and was not carried out in other regions. Therefore, future studies should be carried out in other regions in order to diversify the research results. Thirdly, the study has not assessed the impact of the COVID-19 pandemic and other shocks such as oil prices or financial and monetary fluctuations on the ability to attract FDI.
Funding
This research received no external funding.
Informed Consent Statement
Not applicable.
Data Availability Statement
The data that support the findings of this study are available from the corresponding author, upon reasonable request.
Conflicts of Interest
The authors declare no conflict of interest.
References
- Abbas, Ali, Imad Moosa, and Vikash Ramiah. 2022. The contribution of human capital to foreign direct investment inflows in developing countries. Journal of Intellectual Capital 23: 9–26. [Google Scholar] [CrossRef]
- Acemoglu, Daron, and A. Robinson James. 2012. Why Nations Fail: The Origins of Power, Prosperity and Poverty, 1st ed. New York: Crown, p. 529. [Google Scholar]
- Albulescu, Claudiu Tiberiu, and Adrian Marius Ionescu. 2018. The long-run impact of monetary policy uncertainty and banking stability on inward FDI in EU countries. Research in International Business and Finance 45: 72–81. [Google Scholar] [CrossRef]
- Bao, Xiaohua, Jianpeng Deng, Haoyu Sun, and Jin Sun. 2022. Trade policy uncertainty and foreign direct investment: Evidence from China’s WTO accession. Journal of International Money and Finance 125: 102642. [Google Scholar] [CrossRef]
- Cham, Tamsir. 2016. Does monetary integration lead to an increase in FDI flows? An empirical investigation from the West African Monetary Zone (WAMZ). Borsa Istanbul Review 16: 9–20. [Google Scholar] [CrossRef]
- Fry, Maxwell J. 1982. Models of financially repressed developing economies. World Development 10: 731–50. [Google Scholar] [CrossRef]
- Gupta, Suraj B. 1970. The Portfolio Balance Theory of the Expected Rate of Change of Prices. The Review of Economic Studies 37: 187–203. [Google Scholar] [CrossRef]
- Hoechle, Daniel. 2007. Robust Standard Errors for Panel Regressions with Cross-Sectional Dependence. Available online: https://journals.sagepub.com/doi/pdf/10.1177/1536867X0700700301 (accessed on 12 February 2022).
- Karahan, Özcan, and Musa Bayır. 2022. The effects of monetary policies on foreign direct investment inflows in emerging economies: Some policy implications for post-COVID-19. Future Business Journal 8: 39. [Google Scholar] [CrossRef]
- Kellard, Neil M., Alexandros Kontonikas, Michael J. Lamla, Stefano Maiani, and Geoffrey Wood. 2022. Risk, financial stability and FDI. Journal of International Money and Finance 120: 102232. [Google Scholar] [CrossRef]
- Le, Thi Thuy Hang, Van Chien Nguyen, and Thi Hang Nga Phan. 2022. Foreign Direct Investment, Environmental Pollution and Economic Growth—An Insight from Non-Linear ARDL Co-Integration Approach. Sustainability 14: 8146. [Google Scholar] [CrossRef]
- McDonald, John F. 2005. The Q Theory of Investment, the Capital Asset Pricing Model and Real Estate Valuation: A Synthesis. Journal of Real Estate Literature 13: 269–86. [Google Scholar] [CrossRef]
- Noorbakhsh, Farhad, Alberto Paloni, and Ali Youssef. 2001. Human Capital and FDI Inflows to Developing Countries: New Empirical Evidence. World Development 29: 1593–610. [Google Scholar] [CrossRef]
- Pesaran, M. Hashem. 2004. General Diagnostic Tests for Cross Section Dependence in Panels. CESifo Working Paper Series No. 1229; IZA Discussion Paper No. 1240. Available online: https://docs.iza.org/dp1240.pdf (accessed on 12 June 2023).
- Reiter, S. L., and H. Kevin Steensma. 2010. Human Development and Foreign Direct Investment in Developing Countries: The Influence of FDI Policy and Corruption. World Development 38: 1678–91. [Google Scholar] [CrossRef]
- Suddaby, Roy. 2013. Encyclopedia of Management Theory. Edited by Eric H. Kessler. Newbury Park: SAGE Publications, Ltd., vols. 1–2. [Google Scholar] [CrossRef]
- Thornton, John. 1991. The financial repression paradigm: A survey of empirical research. Savings and Development 15: 5–18. [Google Scholar]
- Yülek, Murat A. 2017. Why governments may opt for financial repression policies: Selective credits and endogenous growth. Economic Research-Ekonomska Istraživanja 30: 1390–405. [Google Scholar] [CrossRef]
- Zeeshan, Muhammad, Jiabin Han, Alam Rehman, Irfan Ullah, Fakhr E. Alam Afridi, and Zeeshan Fareed. 2022. Comparative Analysis of Trade Liberalization, CO2 Emissions, Energy Consumption and Economic Growth in Southeast Asian and Latin American Regions: A Structural Equation Modeling Approach. Frontiers in Environmental Science 10: 79. [Google Scholar] [CrossRef]
Figure 1.
Monetary policy.

Figure 2.
Selection of methodology.


Table 1.
Variables used in the model.
| Variable | Description | Measurement | Source |
|---|---|---|---|
| Dependent variable | |||
| FDI | Net foreign direct investment | % GDP | World Bank, International Monetary Fund |
| Explanatory variable | |||
| MONETARY | Broad money | % GDP | World Bank, International Monetary Fund |
| Control variable | |||
| HUMAN | Human capital | Index | PWT |
| TRADE | Trade openness, as measured by exports and imports relative to GDP | % GDP | World Bank, International Monetary Fund |
| URBAN | Urbanization rate | % population | General Statistics Offices of countries |
| POP | Population size, measured as ln of the total population | People | General Statistics Offices of countries |
| TOURIST | Number of tourists | People | General Statistics Offices of countries |
Source: Authors’ compilation.
Table 2.
Descriptive statistics.
| Variable | Mean | Std. Dev | Min | Max |
|---|---|---|---|---|
| FDI | 5.640749 | 6.882589 | −2.75744 | 32.16984 |
| MONETARY | 93.76607 | 36.94388 | 22.50731 | 164.8682 |
| HUMAN | 2236.889 | 160.0672 | 1923.396 | 2574.278 |
| TRADE | 154.765 | 103.6755 | 33.19059 | 437.3267 |
| URBAN | 55.69188 | 23.54743 | 22.965 | 100 |
| POP | 8.58 × 10⁷ | 7.57 × 10⁷ | 3,796,038 | 2.74 × 10⁸ |
| TOURIST | 1.10 × 10⁷ | 8433338 | 1,520,000 | 3.99 × 10⁷ |
Source: Authors’ analysis.
Table 3.
Correlation matrix.
| Variable | FDI | MONETARY | HUMAN | TRADE | URBAN | POP | TOURIST |
|---|---|---|---|---|---|---|---|
| FDI | 10,000 | ||||||
| MONETARY | 0.3646 | 10,000 | |||||
| HUMAN | 0.6312 | 0.5110 | 10,000 | ||||
| TRADE | 0.8358 | 0.6042 | 0.7459 | 10,000 | |||
| URBAN | 0.7036 | 0.4022 | 0.4383 | 0.7886 | 10,000 | ||
| POP | −0.7874 | −0.6051 | −0.7764 | −0.9351 | −0.8444 | 10,000 | |
| TOURIST | 0.1778 | 0.6986 | 0.1555 | 0.2826 | 0.4237 | −0.2978 | 10,000 |
Source: Authors’ analysis.
Table 4.
Variance Inflation Factor (VIF).
| Variable | VIF | 1/VIF | VIF | 1/VIF | VIF | 1/VIF |
|---|---|---|---|---|---|---|
| MONETARY | 6.99 | 0.143032 | 4.46 | 0.224049 | 3.20 | 0.312695 |
| HUMAN | 2.96 | 0.337718 | 2.61 | 0.382605 | 2.71 | 0.368904 |
| TRADE | 8.66 | 0.115459 | 8.59 | 0.116462 | 8.23 | 0.121480 |
| URBAN | 10.22 | 0.097881 | 4.80 | 0.208425 | ||
| POP | 14.74 | 0.067844 | 9.13 | 0.109504 | ||
| TOURIST | 4.46 | 0.223989 | 3.40 | 0.294437 | 2.21 | 0.452852 |
| Mean VIF | 8.01 | 4.77 | 5.10 | |||
Source: Authors’ analysis.
Table 5.
Regression results according to OLS, FEM, REM.
| Variable | Regression Results | |||||
|---|---|---|---|---|---|---|
| OLS (Model 2) | FEM (Model 2) | REM (Model 2) | OLS (Model 3) | FEM (Model 3) | REM (Model 3) | |
| MONETARY | −0.0651 *** (0.000) | −0.0016 (0.937) | −0.0651 *** (0.000) | −0.0635 *** (0.000) | −0.0298 (0.186) | −0.0635 *** (0.000) |
| HUMAN | 0.0029 (0.357) | −0.0016 (0.684) | 0.0029 (0.355) | 0.0036 (0.240) | −0.0022 (0.583) | 0.0036 (0.238) |
| TRADE | 0.0586 *** (0.000) | 0.0109 (0.406) | 0.0586 *** (0.000) | 0.0616 *** (0.000) | −0.0028 (0.810) | 0.0616 *** (0.000) |
| URBAN | 0.0043 (0.879) | −0.3264 *** (0.002) | 0.0043 (0.879) | |||
| POP | −0.4338 (0.563) | 16.0341 *** (0.003) | −0.4338 (0.562) | |||
| TOURIST | 1.1756 ** (0.041) | −1.7875 (0.150) | 1.1756 ** (0.039) | 1.1383 (0.111) | 3.8856 *** (0.001) | 1.1383 (0.108) |
| _cons | −14.9160 (0.474) | −247.883 *** (0.003) | −14.9160 (0.473) | −24.5168 ** (0.040) | −29.8695 (0.109) | −24.5168 ** (0.038) |
| Adj R-squared | 0.7303 | 0.6009 | 0.7402 | 0.7297 | 0.5657 | 0.7396 |
| Wald Chi2/F | 75.21 | 2.77 | 376.04 | 74.97 | 3.08 | 374.84 |
| p-value | 0.0000 | 0.0206 | 0.0000 | 0.0000 | 0.0117 | 0.0000 |
| Number of Obs. | 138 | 138 | 138 | 138 | 138 | 138 |
| Number of Groups | 6 | 6 | 6 | 6 | ||
| F test | F(5, 127) = 14.63 Prob > F = 0.0000 | F(5, 127) = 15.16 Prob > F = 0.0000 | ||||
| Hausman test | Chi2 (5) = 93.28 Prob > Chi2 = 0.0000 | Chi2 (5) = 92.14 Prob > Chi2 = 0.0000 | ||||
| Heteroskedasticity test | Chi2 (6) = 471.76 Prob > Chi2 = 0.0000 | Chi2 (6) = 346.88 Prob > Chi2 = 0.0000 | ||||
| Autocorrelation test | F(1, 5) = 1.452 Prob > F = 0.2821 | F(1, 5) = 1.066 Prob > F = 0.3491 | ||||
Note: *** and ** indicate significance levels of 1% and 5%, respectively. Source: Calculated by the authors.
Table 6.
Regression results by FGLS and FE year.
| Variable | Regression Results | |||
|---|---|---|---|---|
| FGLS (Model 2) | FE Year (Model 2) | FGLS (Model 3) | FE Year (Model 3) | |
| MONETARY | −0.0651 *** (0.000) | −0.0631 *** (0.000) | −0.0635 *** (0.000) | −0.0612 *** (0.000) |
| HUMAN | 0.0029 (0.345) | 0.0088 *** (0.003) | 0.0036 (0.228) | 0.0097 *** (0.002) |
| TRADE | 0.0586 *** (0.000) | 0.0560 *** (0.000) | 0.0616 *** (0.000) | 0.0592 *** (0.000) |
| URBAN | 0.0043 (0.876) | 0.0057 (0.832) | ||
| POP | −0.4338 (0.553) | −0.4963 (0.479) | ||
| TOURIST | 1.1756 ** (0.035) | −0.6931 (0.266) | 1.1383 * (0.100) | −0.7221 (0.342) |
| _cons | −14.9160 (0.463) | 1.5950 *** (0.003) | −24.5168 ** (0.034) | −9.4537 (0.405) |
| Adj R-squared | 0.8233 | 0.8225 | ||
| Wald Chi2/F | 393.14 | 512.37 | 391.88 | 509.79 |
| p-value | 0.0000 | 0.0000 | 0.0000 | 0.0000 |
| Number of Obs. | 138 | 138 | 138 | 138 |
| Number of Groups | 6 | 6 | 6 | 6 |
Note: ***, **, and * indicate significance levels of 1%, 5%, and 10%, respectively. Source: Calculated by the authors.
Table 7.
Cross-sectional dependence test.
| Variable | CD-Test | p-Value |
|---|---|---|
| FDI | 0.40 | 0.691 |
| MONETARY | 2.85 *** | 0.004 |
| HUMAN | 16.14 *** | 0.000 |
| TRADE | 0.64 | 0.524 |
| POP | 18.76 *** | 0.000 |
| TOURIST | 17.02 *** | 0.000 |
Note: *** indicates significance levels of 1%. Source: Authors’ analysis.
Table 8.
Regression results using PCSE and Driscoll-Kraay.
| Variable | Regression Results | |||
|---|---|---|---|---|
| PCSE (Model 3) | Driscoll-Kraay (Model 2) | PCSE (Model 3) | Driscoll-Kraay (Model 2) | |
| MONETARY | −0.0635 *** (0.000) | −0.0651 *** (0.000) | −0.0635 *** (0.000) | −0.0651 *** (0.000) |
| HUMAN | 0.0036 (0.316) | 0.0029 (0.525) | 0.0036 (0.145) | 0.0029 (0.202) |
| TRADE | 0.0616 *** (0.000) | 0.0586 *** (0.000) | 0.0616 *** (0.000) | 0.0586 *** (0.000) |
| URBAN | 0.0043 (0.846) | 0.0043 (0.879) | ||
| POP | −0.4338 (0.470) | −0.4338 (0.552) | ||
| TOURIST | 1.1383 * (0.075) | 1.1756 ** (0.018) | 1.1383 ** (0.041) | 1.1756 *** (0.003) |
| _cons | −24.5168 ** (0.037) | −14.9160 (0.470) | −24.5168 *** (0.001) | −14.9160 (0.355) |
| Adj R-squared | 0.7396 | 0.7402 | 0.7396 | 0.7402 |
| Wald Chi2/F | 88.55 | 79.64 | 204.44 | 179.16 |
| p-value | 0.0000 | 0.0000 | 0.0000 | 0.0000 |
| Number of Obs. | 138 | 138 | 138 | 138 |
| Number of Groups | 6 | 6 | 6 | 6 |
Note: ***, **, and * indicate significance levels of 1%, 5%, and 10%, respectively. Source: Calculated by the authors.
Disclaimer/Publisher’s Note: The statements, opinions and data contained in all publications are solely those of the individual author(s) and contributor(s) and not of MDPI and/or the editor(s). MDPI and/or the editor(s) disclaim responsibility for any injury to people or property resulting from any ideas, methods, instructions or products referred to in the content. |
© 2023 by the author. Licensee MDPI, Basel, Switzerland. This article is an open access article distributed under the terms and conditions of the Creative Commons Attribution (CC BY) license (https://creativecommons.org/licenses/by/4.0/).
Share and Cite
MDPI and ACS Style
Nguyen, V.C. Monetary Policy and Foreign Direct Investment—Empirical Evidence. Economies 2023, 11, 234. https://doi.org/10.3390/economies11090234
AMA Style
Nguyen VC. Monetary Policy and Foreign Direct Investment—Empirical Evidence. Economies. 2023; 11(9):234. https://doi.org/10.3390/economies11090234
Chicago/Turabian StyleNguyen, Van Chien. 2023. "Monetary Policy and Foreign Direct Investment—Empirical Evidence" Economies 11, no. 9: 234. https://doi.org/10.3390/economies11090234
Note that from the first issue of 2016, this journal uses article numbers instead of page numbers. See further details here.