
The Association between Foreign Investment and Gross Domestic Product in Ten ASEAN Countries

Department of Business Administration, Atma Jaya Catholic University of Indonesia, Jakarta 12930, Indonesia
Economies 2023, 11(7), 188; https://doi.org/10.3390/economies11070188
Submission received: 25 April 2023
/
Revised: 27 June 2023
/
Accepted: 4 July 2023
/
Published: 12 July 2023
(This article belongs to the Special Issue Foreign Direct Investment and Investment Policy)
Abstract
:Although empirical studies of the link between foreign direct investment, foreign portfolio investment, and economic development have long influenced economic studies, the results have been inconclusive. Focusing on ten countries, this study contributes to our understanding of foreign investment as a determinant of regional economic performance. More specifically, this study seeks to analyze the short- and long-term relationship between foreign direct investment, foreign portfolio investment, and Gross Domestic Product (GDP) in ten ASEAN member states using data from the 2009–2020 period. For this examination, this study employs a cross-sectional dependency test, followed by panel unit root and panel cointegration testing. From the results of this test, Dumitrescu–Hurlin Panel Causality (DHPC) analysis is conducted. These results show that FDI and GDP have a positive bilateral association, i.e., FDI positively affects GDP and GDP positively affects FDI, as presumed by the theory. Testing also finds bilateral causality between FPI and GDP in the ten analyzed nations. This study contributes to the literature by testing the association between FDI/FPI and GDP using fully modified least squares (FMOLS) and dynamic least squares (DMOLS) panel testing. These results show that FPI and FDI have significantly influenced GDP in ten ASEAN member states. Foreign investment has thus been shown to be the most potent means of accelerating economic development in the studied nations, and thus the governments of these ASEAN member states should formulate policies that attract foreign investors and better direct their investments.
1. Introduction
Numerous efforts have been made to comprehensively analyze investment and its contribution to economic development (Deonanan and Conrad 2022; Hagan and Amoah 2020; An and Yeh 2021; Carbonell and Werner 2018). Studies of the link between investment and economic development have mostly relied on neoclassical theories, particularly the Harrod–Domar theory of economic growth and the endogenous model of economic growth (Horvatin 2019; Udeogu et al. 2021; Hunt 2012). Investments may be purely domestic or come from foreign sources (Hagan and Amoah 2020; Akiri and Ushie 2020). Indeed, due to the limited availability of domestic investors, many countries have relied on foreign investment to meet their needs (Ullah and Tahir 2022; Carbonell and Werner 2018; Guvercin and Gok 2021). The neoclassical paradigm emphasizes that FDI and FPI influence economic growth, serving as a measure of economic development through the accumulation of capital and transfer of technology (Horvatin 2019; Soylu 2019; Guvercin and Gok 2021). In the endogenous model, economic growth is held to be directly associated with investment—including foreign investment (Bambi et al. 2019).
Foreign investment falls into two broad categories: foreign direct investment (FDI) and foreign portfolio investment (FPI) (Ullah and Tahir 2022; Botta 2018; Tsaurai 2022). In many countries, foreign investment is used to collect the capital necessary for overcoming liquidity (Türkcan et al. 2008; Gunaydin and Tatoglu 2005; Agyapong and Bedjabeng 2020). Foreign investment is commonly used as a catalyst for economic development (Ullah and Tahir 2022; Donaubauer et al. 2022). FDI and FPI increase the stock of available capital and create employment opportunities, thereby accelerating the diffusion of technology amongst local companies (Anetor 2019; Guvercin and Gok 2021). Likewise, FDI and PFI are hoped to cultivate knowledge and increase productivity by promoting human resource development, stimulating research and development, and creating new employment opportunities. In many countries, including ASEAN, these combine to promote economic development (Srinivasan et al. 2011; Jana et al. 2019).
The Association of Southeast Asian Nations, or ASEAN, was established through the Bangkok Declaration on 8 August 1967. In economic matters, ASEAN seeks to promote mutually beneficial collaboration between member states: Brunei, Burma (Myanmar), Cambodia, Indonesia, Laos, Malaysia, Singapore, Thailand, Vietnam, and the Philippines. Collectively, the countries of ASEAN have a Gross Domestic Product (GDP) of 3.0 trillion USD; in 2021, ASEAN represented the world’s fifth largest economy, behind only the United States, China, Japan, and Germany (The ASEAN Secretariat 2021). Foreign investment plays an important role in the association’s economic prowess. Also contributing to ASEAN’s economic strength have been a series of agreements between member states, including the creation of the ASEAN Free Trade Area (AFTA) and implementation of the ASEAN Investment Area (AIA) in 1998, as well as the signing of the ASEAN Comprehensive Investment Agreement (ACIA) in 2012 (Syarifuddin 2020).
Foreign investment in ASEAN reached 182 billion USD in 2019, making it the largest market for foreign investment amongst developing nations. With the emergence of the COVID-19 pandemic, investment in the region slowed, with only 137 billion USD reported in 2020; nonetheless, investment remained strong, and ASEAN received 13.7 percent of global foreign investments for that year (up from 11.9 percent in 2019). ASEAN member states’ investments in other member states likewise increased, reaching 23 million USD—a 5 percent growth (The ASEAN Secretariat 2021; UNCTAD 2021).
Meanwhile, the flow of foreign portfolio investments (FPI) into ASEAN increased almost eighteenfold between 2001 (3.2 billion USD) and 2020 (82 billion USD) (Syarifuddin 2020). Short-term investments, such as foreign portfolios, are often strongly correlated with the dynamics of currency exchange, as they tend to be liquid and flexible. Globally, Singapore ranks seventeenth (of 151 countries), with an FPI value of 2187.87 million USD. The mean FPI for 2020 was 10,501.66 USD, with the United States ranking first (687,416.02 million USD) and the Netherlands ranking last (−96,800.74 million USD) (Syarifuddin 2020).
Most empirical studies into the link between FDI and FPI, including both cross-sectional and time-series analyses, have limited themselves to one country. The greatest limitation of this approach is its inability to explain heterogeneity, be it that stemming from time-series data (i.e., unobserved time heterogeneity) or cross-sectional data (Duxbury 2021; Baltagi 2021; Theloudis 2021). This study holds that panel data are better suited to handling unobserved time heterogeneity. Panel data likewise make it possible to verify how variables change over time (Hsiao 2007; Baltagi 2021).
The available literature indicates that existing analyses have failed to investigate the association between economic development, FDI, and FPI within the context of ASEAN’s ten member states. Sasana and Fathoni (2019) used multiple linear regression to investigate the link between FDI, FPI, and economic growth in ASEAN, but they took only six nations as their sample: Cambodia, Indonesia, Malaysia, Philippines, Thailand, and Vietnam. Another study, by Yaacob et al. (2021), considered the influence of asymmetric information on FDI and FPI in ASEAN plus three (ASEAN+3).
This study investigates the association between FDI, FPI, and GDP in ten ASEAN member states between 2009 and 2020. There have been few studies that look at the association between the variables listed above in the context of ASEAN member countries, and the results have been varied. Therefore, this study investigates FDI, FPI, and GDP utilizing a novel econometric approach, namely the panel data approach with the cross-sectional dependence test procedure, Dumitrescu–Hurlin panel causality analysis, and FMOLS and DMOLS. The first section of this article provides a general overview of FDI and FPI in the ten countries sampled. The next section explores the literature on the association between FDI, FPI, and GDP. It is followed by a section that explores the methodology and results of this current study. Finally, the results are discussed, and conclusions are drawn.
1.1. Overview of FDI, FPI, and GDP in Ten ASEAN Countries
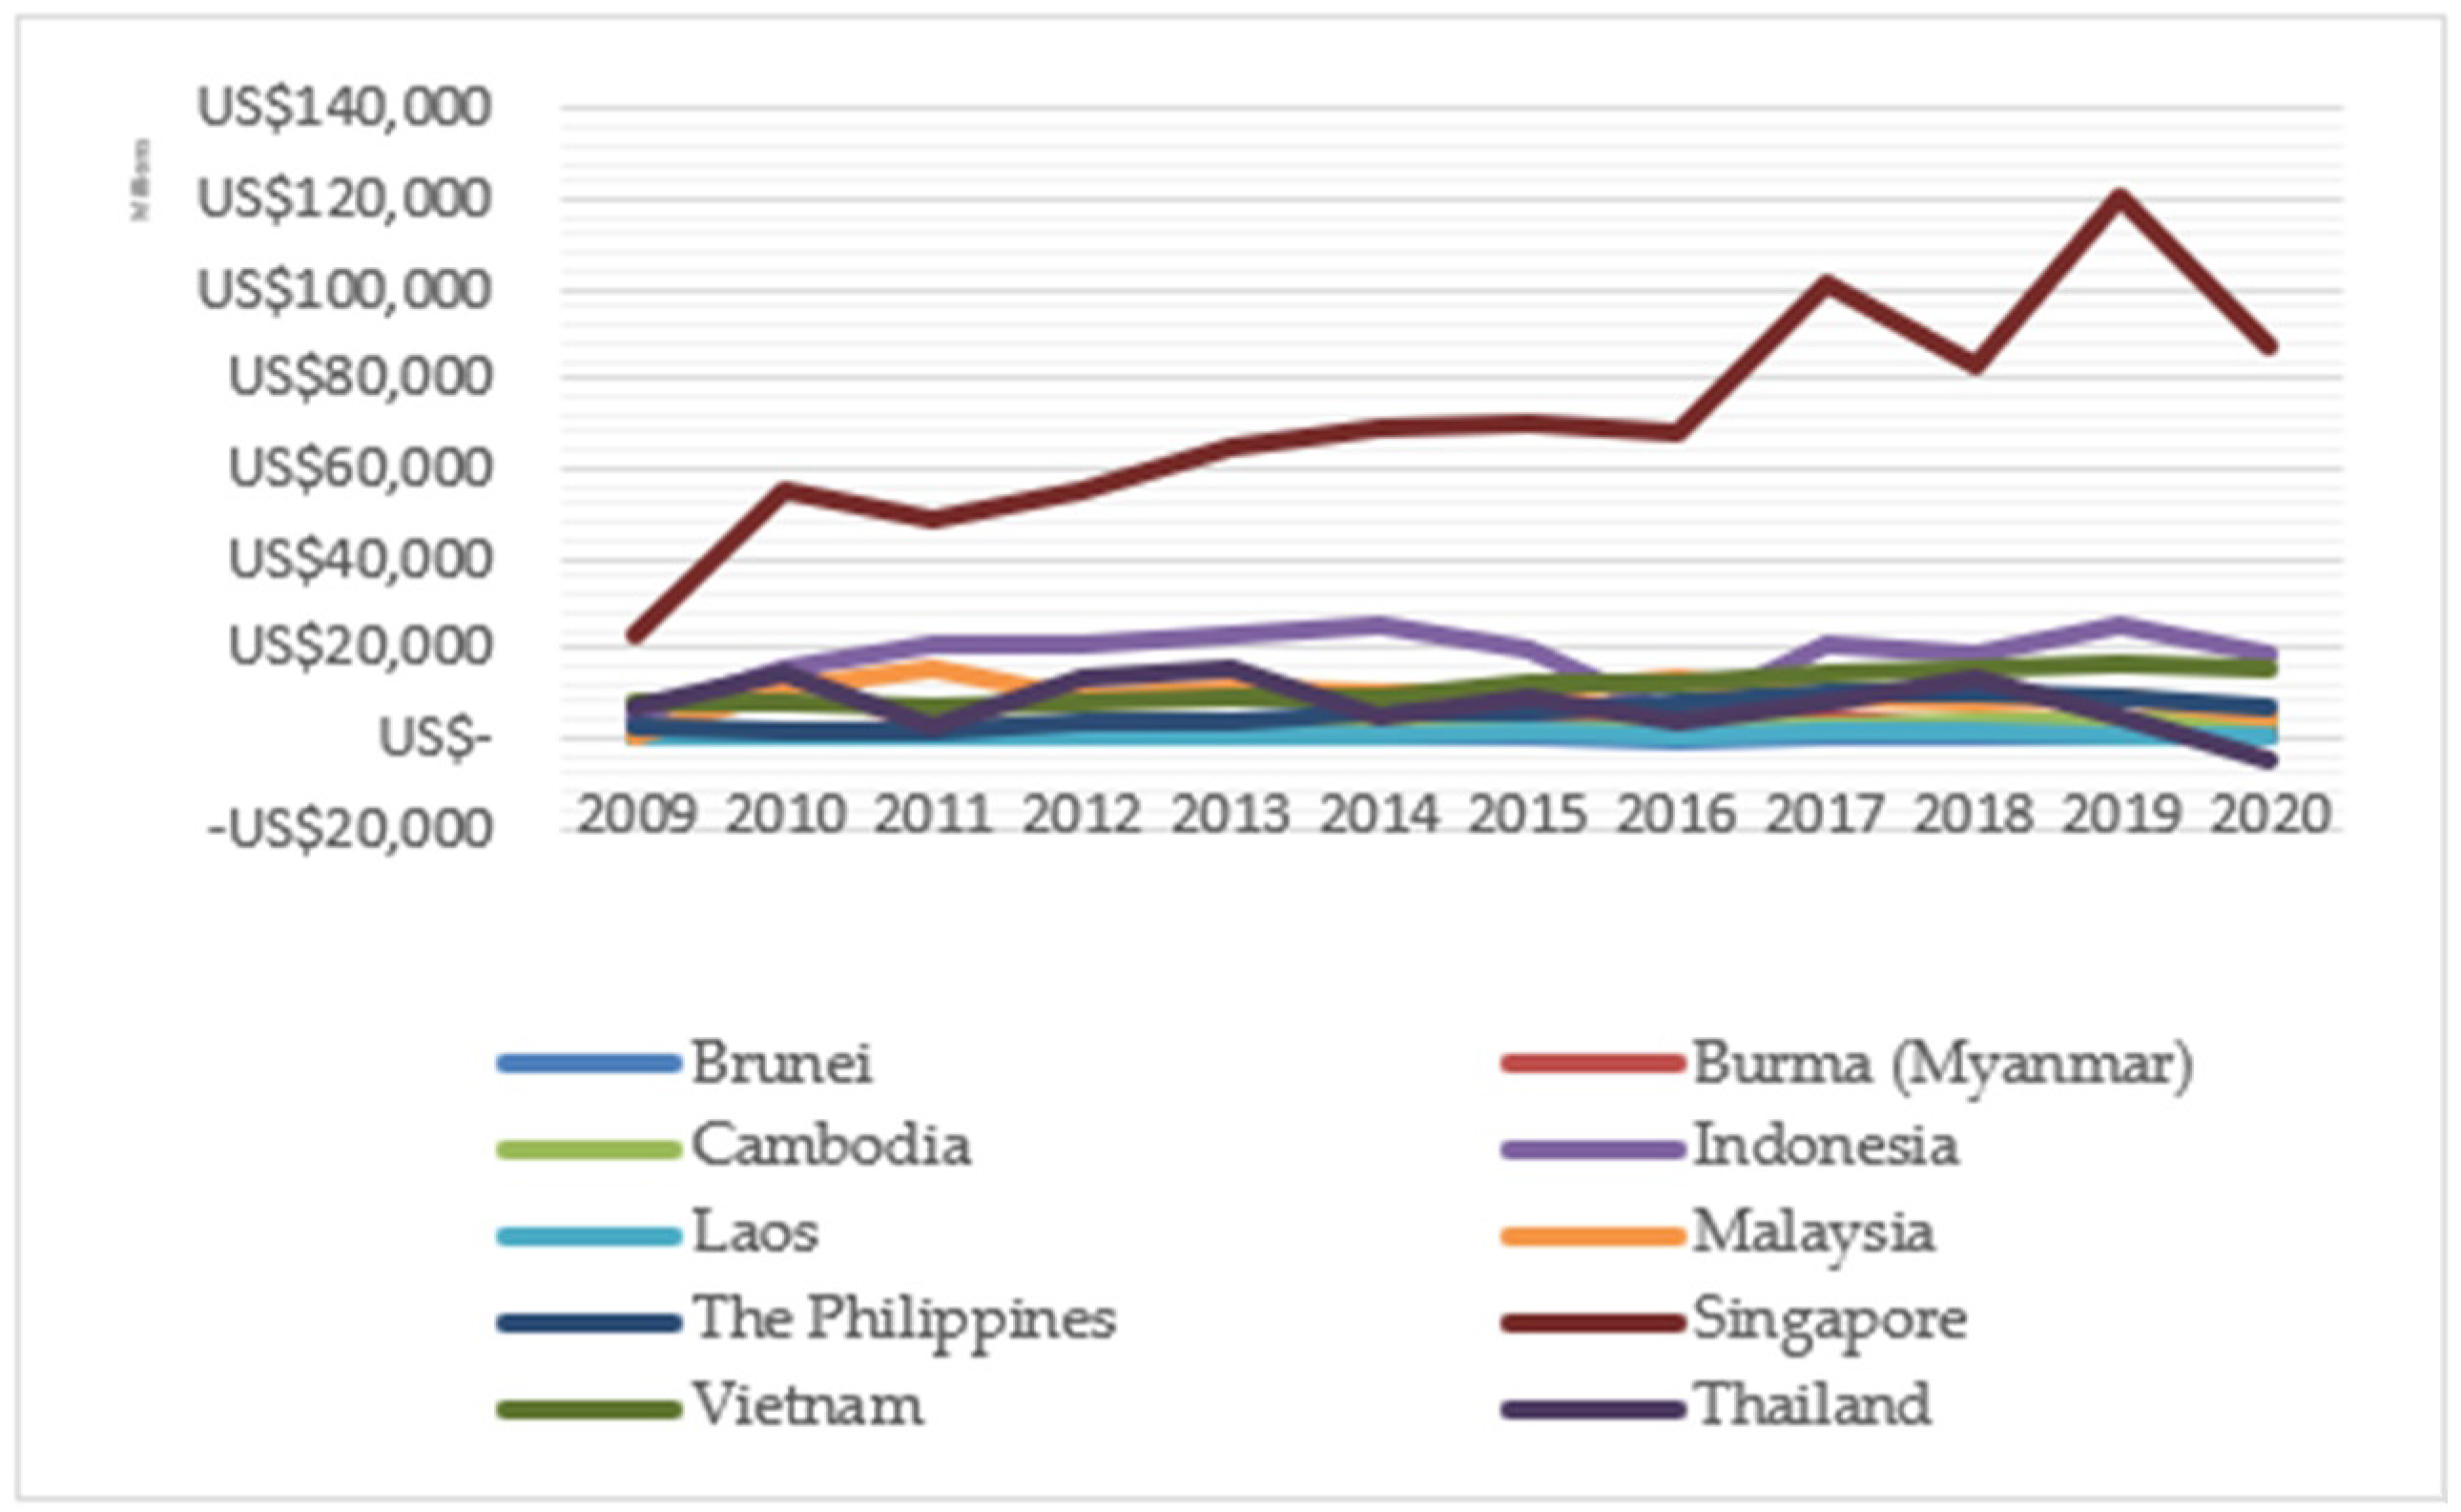
Figure 1 provides the FDI fluctuations in ASEAN’s ten member states between 2009 and 2020. In the past decade, Singapore—with an average FDI of 70.481 billion USD—has been the primary recipient of foreign investment. It is followed by Indonesia (18.182 billion USD), Laos (821.02 million USD), Malaysia (9.283 billion USD), the Philippines (5.601 billion USD), Vietnam (11.284 billion USD), Brunei (471.30 million USD), Myanmar (2.313 billion USD), Thailand (7.606 billion USD), and Cambodia (2.280 billion USD). Foreign investment in Singapore has been significant; indeed, in 2019, Singapore received 120.439 billion USD in foreign investment. Meanwhile, receiving an average of 471.30 million USD in foreign investment on average, Brunei received the least foreign investment of any ASEAN member state (The ASEAN Secretariat 2021; UNCTAD 2021).
Figure 1 depicts the continued growth of foreign investment in Singapore. There are several points of view on this, but most agree that Singapore offers a welcoming business environment, which draws overseas investors. Furthermore, the Singapore economy’s key feature is its great openness to international commerce and foreign capital flows, which began with economic openness reforms and the Singapore government’s abolition of several foreign exchange restrictions in 1978 (Chow 2008). Furthermore, the steady value of Singapore’s currency contributes to lowering investment costs. Therefore, investors favor Singapore to invest (Chow 2008); this is why foreign investment in Singapore is more considerable compared to other ASEAN countries.
Of ASEAN’s ten member states, Indonesia ranked second in terms of FDI, receiving an average of 18.182 billion USD per annum over the past ten years. In 2020, Singapore received the most FDI (87.445 billion USD). Second was Indonesia, which received 19.122 billion USD. Third was Vietnam, which received 15.800 billion USD. Fourth was the Philippines, which received 6.585 billion USD. Malaysia was fifth, with 4.313 billion USD in FDI, followed by Thailand (4.845 billion USD) and Cambodia (3.624 billion USD). Myanmar, Laos, and Brunei received the least amount of FDI, with 1.834 billion USD, 967.70 million USD, and 565.54 million USD in FDI, respectively (The ASEAN Secretariat 2021; UNCTAD 2021).
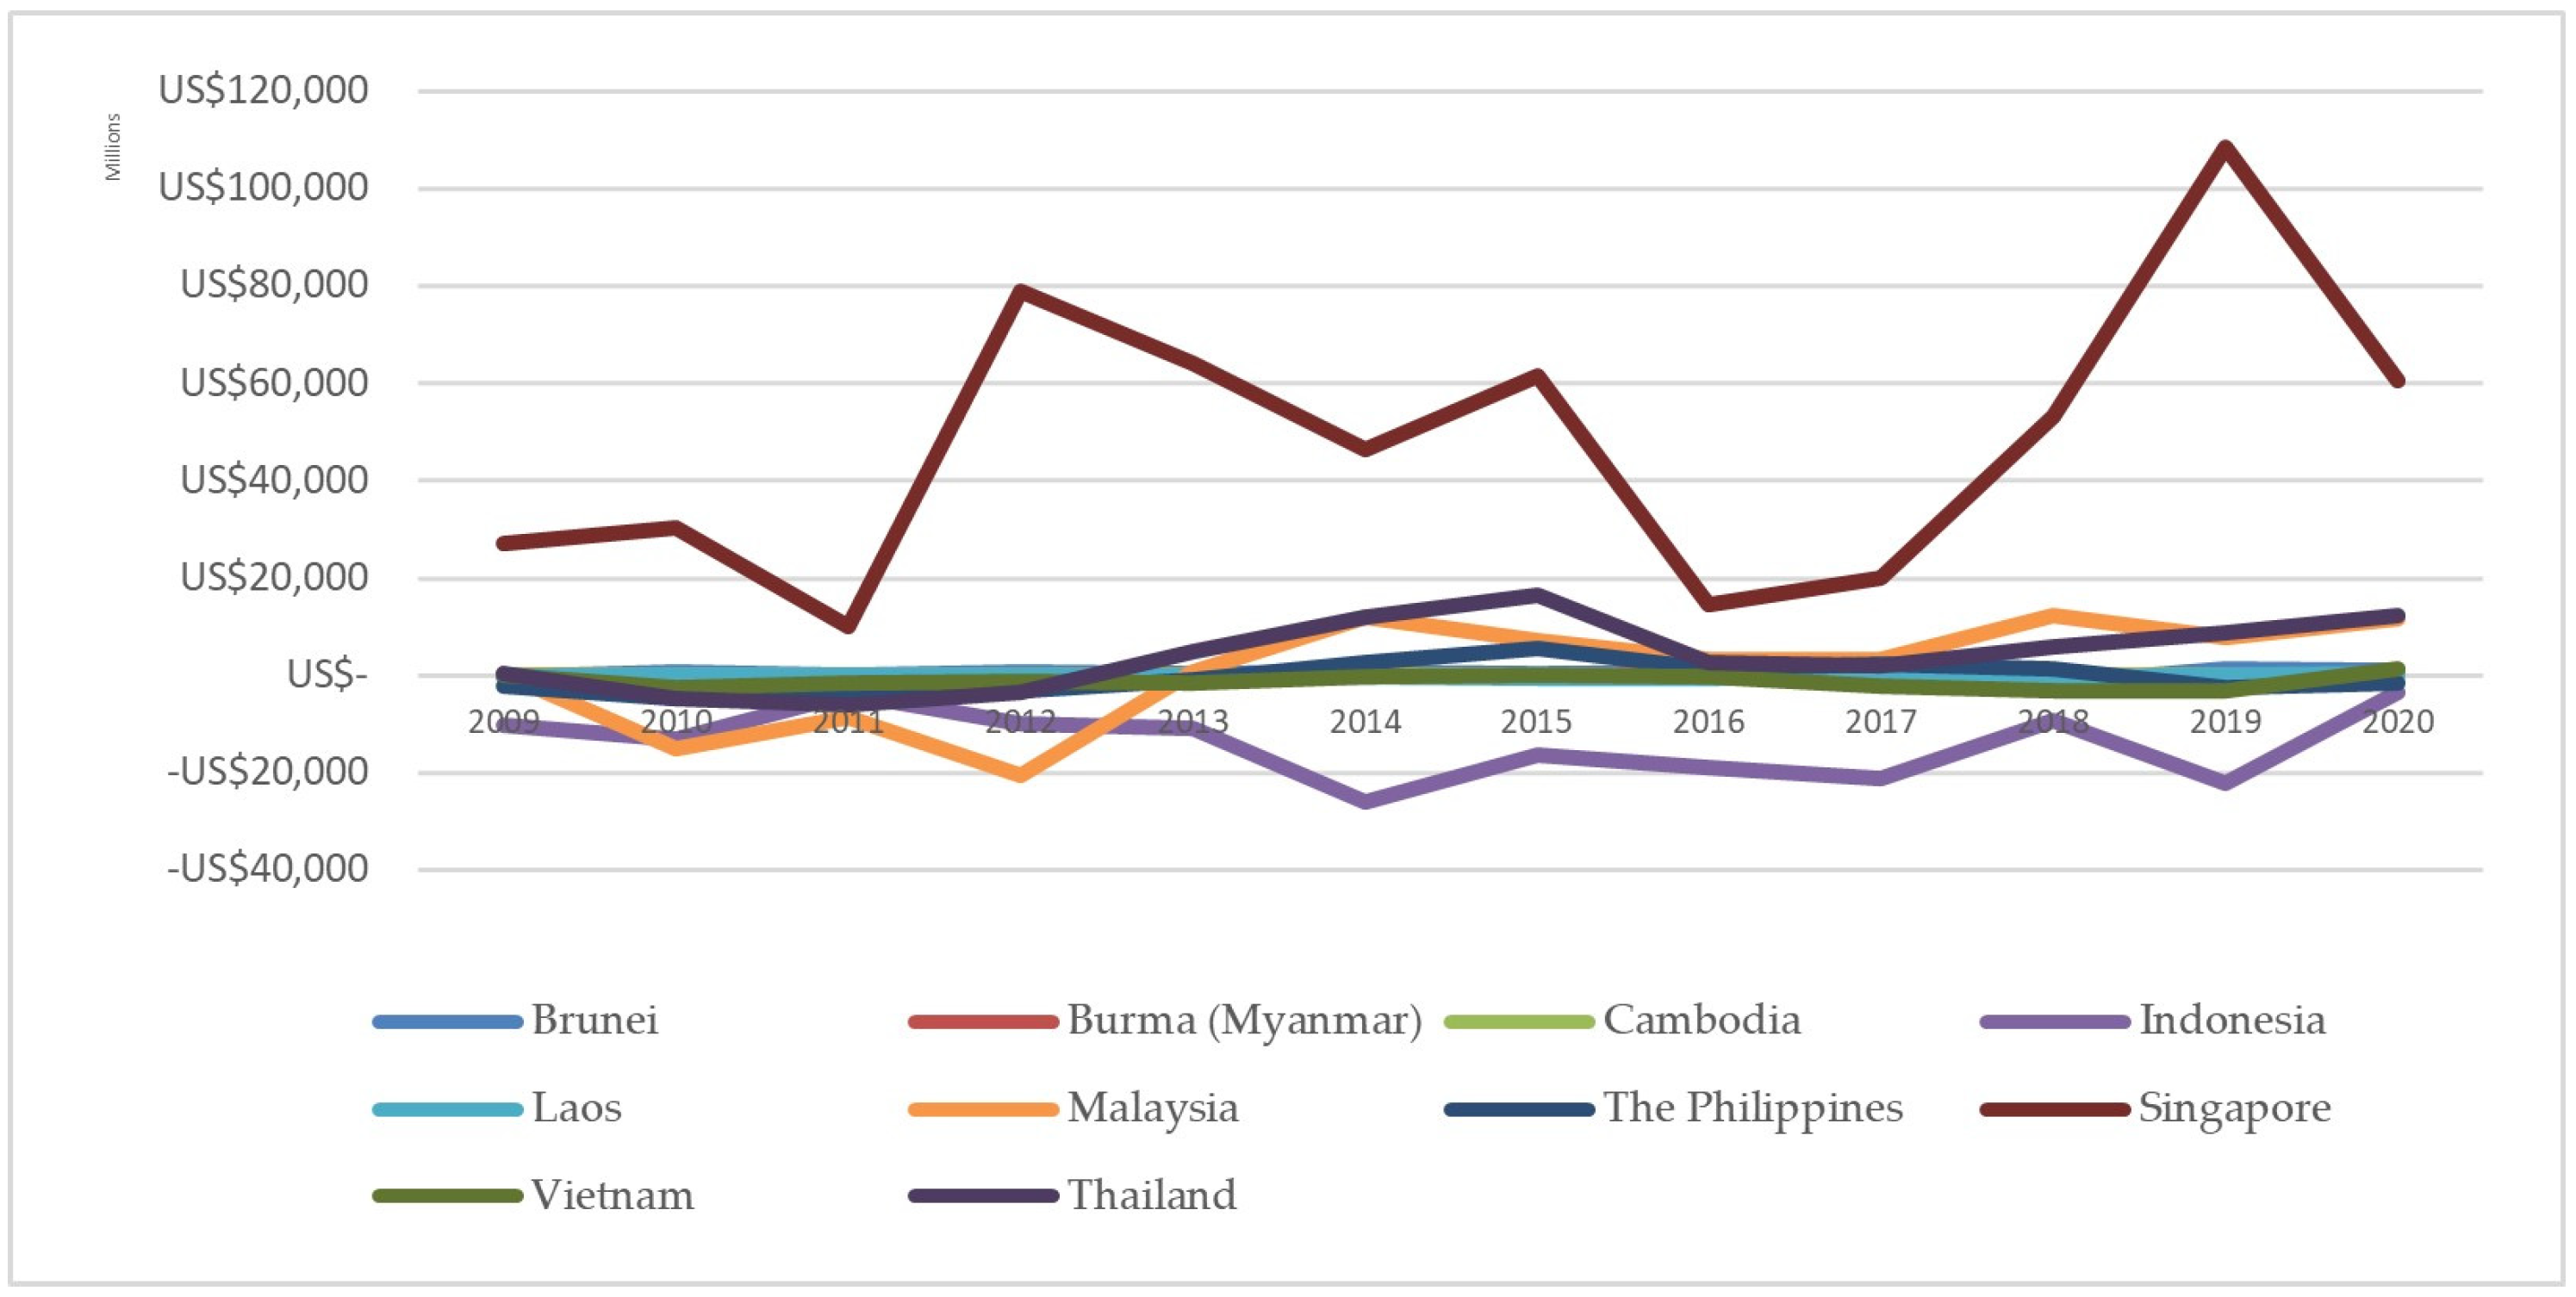
Figure 2 portrays the fluctuating value of FPI in ASEAN. Over the past ten years, Singapore has had the largest share of FPI. For comparison, Indonesia had −13.758 billion USD; Laos had −200.79 million USD; Malaysia had 1.198 billion USD; the Philippines had −450.48 million USD; Vietnam had −1.129 billion USD; Brunei had −394.77 billion USD; Myanmar had −11.80 million USD; Thailand had 4.253 billion USD; and Cambodia had 24.90 million USD. The average, thus, was 47.945 billion USD. All ASEAN member states, aside from Singapore, have experienced negative portfolio investments. This highlights the significance of investment in Singapore, which enjoys a stable economy; indeed, in 2019, Singapore received a portfolio investment of 108.669 billion USD. On average, the FPI in Indonesia has been lower than Brunei, Laos, Malaysia, Vietnam, Singapore, Myanmar, Thailand, Cambodia, and the Philippines, with an average of −13.758 billion USD over the past decade (The ASEAN Secretariat 2021; UNCTAD 2021). Between 2009 and 2020, portfolio investment in Indonesia was always negative; in 2014, this reached 26.066 billion USD.
Returning to 2020, the highest portfolio investment was enjoyed by Singapore (60.492 billion USD). This was followed by Thailand, with an FPI of 12.147 billion USD. Third was Malaysia, with an FPI of 11.701 billion USD, followed by Brunei, with an FPI of 1.160 billion USD. Vietnam was fifth, with an FPI of 1256 billion USD. Sixth was Laos, with 256.51 billion USD. Cambodia had the last positive FPI, with 95.95 million USD. Myanmar, the Philippines, and Indonesia ranked eighth, ninth, and tenth, with FPI of 10.96 million USD, −1.679 billion USD, and −3.368 billion USD, respectively (The ASEAN Secretariat 2021; UNCTAD 2021), see Figure 2 below.
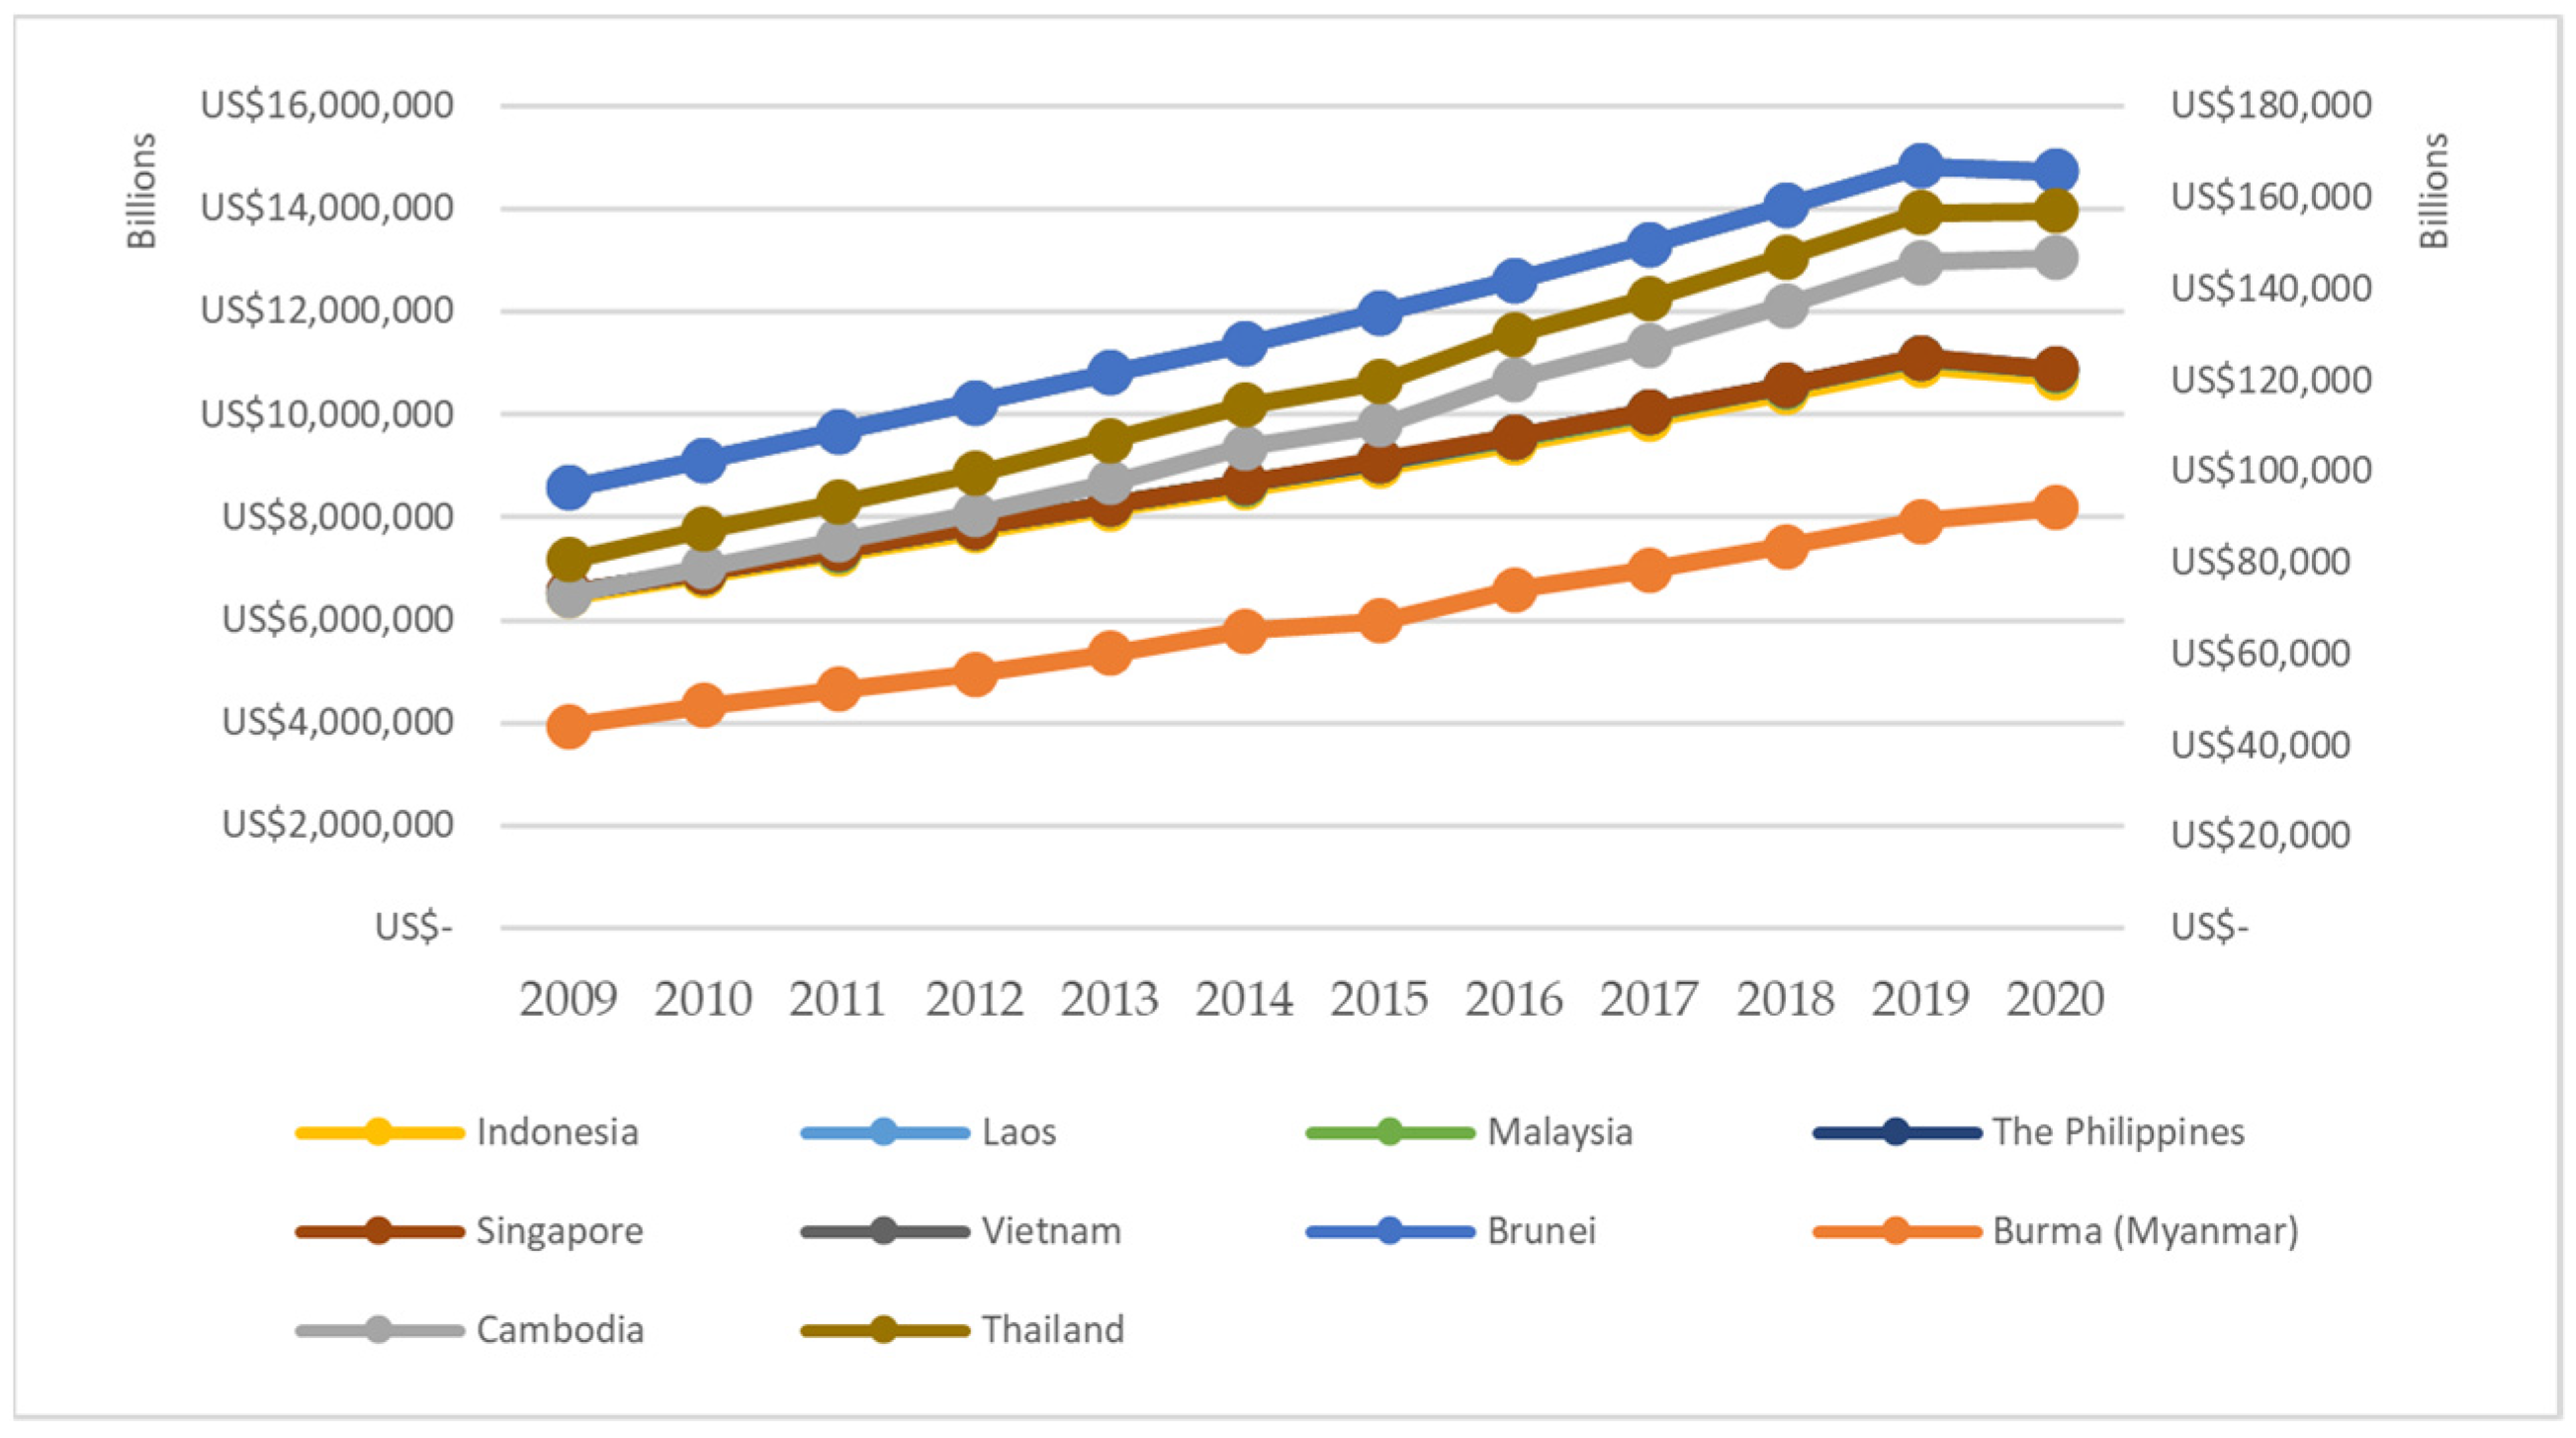
All ten ASEAN member states experienced economic growth between 2009 and 2020, as indicated by their rising GDPs. Of these, Indonesia reported the highest average GDP, while Brunei reported the lowest. The GDP for Brunei was 18.799 billion USD; 67.539 trillion USD for Myanmar; 42.217 trillion USD for Cambodia; 98.907 trillion USD for Laos; 1.144 trillion USD for Malaysia; 14.699 trillion USD for the Philippines, 408.889 billion USD for Singapore, 2866.839 trillion USD for Vietnam; and 9.415 trillion USD for Thailand as presented in Figure 3.
Focusing on 2020, Indonesia reported the highest GDP (10,722 trillion USD). Second was Singapore (3847 trillion USD), followed by Laos (131,103 trillion USD). Fourth was Myanmar, with a GDP of 91,976 trillion USD, and fifth was Cambodia, with a GDP of 54,797 trillion USD. The Philippines ranked sixth, with a GDP of 17.527 trillion USD, followed by Thailand (10.265 trillion USD). The lowest GDPs were reported by Malaysia, Vietnam, and Brunei (1.343 trillion USD, 453.821 billion USD, and 19.315 billion USD, respectively).
1.2. The Link between Foreign Direct Investment and Gross Domestic Product
FDI refers to the investments made by particular companies and enterprises in other countries (Kaur et al. 2013; OECD 2022; Akiri and Ushie 2020; Ramasamy and Yeung 2022). FDI generally refers to the long-term investment of capital, which is central to the integration of the international economy as it ensures stable economic ties (Türkcan et al. 2008; OECD 2022; Donaubauer et al. 2022). FDI makes it possible for companies to transfer assets between nations while also directly controlling business activities such as production, manufacturing, and distribution (Donaubauer et al. 2022). According to the neoclassical model, FDI promotes GDP by increasing the short-term efficiency of the economy (Albulescu 2015; Yusuf et al. 2020; Menyari 2020; Okwu et al. 2020; Akadiri et al. 2019; Agyapong and Bedjabeng 2020; Yusuf et al. 2020; Mencinger 2003; Metwally 2004).
Many studies have investigated the link between FDI and GDP, be it in one or multiple countries. Albulescu (2015) investigated the influence of FDI and FPI for long-term GDP expansion using data from thirteen countries in Central and Eastern Europe (CEE), including Bulgaria, Croatia, Cyprus, the Czech Republic, and Estonia. Using data from 2005 to 2012, this study employed panel data analysis and a generalized method of moments to correct for endogeneity. As control variables, it used inflation rate, CPI inflation, unemployment rate, currency in circulation, primary energy consumption, and education levels. It found that direct and portfolio investment influenced long-term GDP growth. As with Sengupta and Puri (2020), Albulescu (2015) emphasized the need to incentivize foreign investment (FDI and FPI).
Yusuf et al. (2020) investigated FDI’s contribution in West Africa by using the dynamic fixed effects technique/ARDL to analyze data from 1996 through 2016. This study found that, although there is no significant association over the short term, over the long term FDI significantly and positively affected economic growth in West Africa. Similarly taking examples from Africa, Akadiri et al. (2019) established that FDI has a positive and significant influence on economic growth over the long term. Using data from twenty-five African nations that covered a period of free trade (between 1980 and 2018), their study investigated the causal link between FDI and economic growth. This study employed panel data unit root tests, bootstrap cointegration, and the Granger causality approach for predictive analysis. They found long-term equilibrium and bilateral causality between FDI, international free trade, and economic growth (Sengupta and Puri 2020; Mowlaei 2018; Kaur et al. 2013).
Meanwhile, Agyapong and Bedjabeng (2020) and Mowlaei (2018) both investigated the influence of foreign debt and FDI on the economic development of Africa using data from 2002 through 2015. Using dynamic panel data and the Generalized Method of Moment (GMM) to correct for simultaneity bias and specific economic effects, they proved that a positive and significant link existed between FDI and the economic development of Africa. Foreign debt was likewise found to have a positive influence on the sample countries. Different results were obtained by Taiwo and Olayemi (2015), who investigated the causal relationship between FDI and economic growth using data from thirty sub-Saharan African nations (covering 1995 through 2011). Their study considered causal variation across units and conducted root-unit analysis, cointegration testing, and causality testing to ascertain the association between economic growth and FDI. Their panel analysis found no long-term association between FDI and economic growth. It did, however, identify a bilateral causal relationship between economic growth and FDI in the thirty sample countries.
Metwally (2004) examined the influence of FDI on economic growth in Egypt, Jordan, and Oman, using simultaneous equations to test the interactions between FDI, exports, and economic growth between 1981 and 2000. This study found that economic growth is directly and significantly influenced by FDI. Okwu et al. (2020) examined the influence of FDI and other macroeconomic variables on economic growth in thirty of the world’s leading economies over a twenty-year period (1998–2017). Using panel data analysis, they showed that, during the period under consideration, FDI had a positive and significant effect on economic growth in the studied countries. In other words, foreign investment was able to promote economic growth in the world’s thirty leading economies.
Mencinger (2003) obtained different results than other scholars by investigating FDI in transitional economies using a simple regression model and Granger causality testing. Taking eight countries—the Czech Republic, Estonia, Hungary, Latvia, Lithuania, Poland, Slovakia, and Slovenia—as its sample, this study finds a negative association between economic growth and FDI. Mencinger thus concludes that, in these transitional economies, FDI hindered growth and real convergence.
Using data from 1970 through 2012, Rehman (2016) found a negative association between FDI, human capital, and economic growth in Pakistan through VECM analysis. Analysis showed that FDI is heavily reliant on economic growth, but the corollary is not true. This study also evidenced that human capital has influenced economic growth in Pakistan. In Cambodia, another developing nation, Sothan (2017) used data from 1980 through 2014 to investigate the causal link between FDI and economic growth. Employing VECM-based Granger causality testing, in conjunction with unit root and Johansen cointegration testing to reduce bias, this study explained FDI has a negative yet statistically significant association with GDP. However, no short-term association was found; FDI was only found to have a unidirectional causal relationship with GDP over the long term. Consequently, although FDI added the physical capital needed for economic growth, this growth was insufficient to attract further investment.
A study by Carbonell and Werner (2018) investigated FDI’s effect on economic growth in Spain by considering several variables, including bank credit, commodity indices, exchange rates, education levels, and currency circulation, between 1984 and 2010. This study adopted the GETS econometric method, the Phillips–Perron (PP) test, and Kwiatkowski–Phillips–Schmidt–Shin (KPSS) test. Their analysis found that foreign demand, human capital, productive credit, and labor have a significant and positive effect on economic growth, while the EUR/USD exchange rate is negatively correlated with economic growth. This suggests a link between foreign and domestic investment; when FDI is funded by banks in the receiving nation, it ultimately crowds out domestic (host) investment.
Shevelova and Plaskon (2018) analyzed the absorptive capacity of the Ukrainian economy, including its ability to increase IFDI and stimulate economic growth, using data from twenty-five parts (covering 1996 through 2015). Absorptive capacity refers to the possibility that human resources can absorb innovations and benefit from research and development expenditures. In other words, it explains a nation’s potential capacity to absorb the knowledge and technologies that come with FDI, including innovative development, strategic learning, and economic knowledge. Shevelova and Plaskon used a GMM approach to analyze dynamic panel data, finding that the absorptive capacity of the Ukrainian economy was sufficient to absorb innovations and benefit from research and development expenditures, thereby attracting foreign investment. FDI did not significantly influence economic growth in Ukraine between 1996 and 2015; however, there were positive spillovers from the influx of foreign investment.
Dinh et al. (2019) investigated and provided quantitative evidence for the short- and long-term influence of FDI on economic growth using examples from thirty developing countries. Using data from 2000 through 2014, they used VECM and Fully Modified OLS (FMOLS) to show that FDI promoted economic growth over the long term, even though it did occasionally have short-term negative effects. Some macroeconomic factors, such as the amount of currency in circulation, positively affected economic growth over the short term, while others—such as the total credit available to the private sector—had a negative effect. Over the long term, economic growth was driven by the amount of currency in circulation, human capital, total domestic investment, and the domestic credit available to the private sector.
Ibhagui (2020) used standard panel data and threshold regression framework analysis to investigate the influence of FDI on economic growth in forty-five nations in Sub-Saharan Africa between 1985 and 2013. Six variables were taken as thresholds: inflation, initial income, population growth, financial market development, and human capital. This study found that FDI had an ambiguous and inconsistent effect on economic growth. At the same time, however, threshold analysis found that FDI accelerated economic growth when inflation and private-sector credit were under certain thresholds and human capital and population growth were over certain thresholds.
1.3. The Link between Foreign Portfolio Investment and Economic Growth
A study by Akiri and Ushie (2020) concluded that a bilateral relationship exists between FPI and economic growth in Nigeria. Using impulse response analysis, they found that FPI had a positive effect on economic innovation and growth through its temporal creation of liquidity within the domestic capital market. Using data from thirteen nations from Central and Eastern Europe between 2005 and 2012, Albulescu (2015) also found that FDI and FPI have a significant and positive influence on long-term economic growth. This study tested the influence of FDI and FPI on long-term economic growth in Central and Eastern Europe by using a GMM approach and panel data. Albulescu also employed several control variables, including inflation levels, CPI inflation, unemployment levels, currency in circulation, exchange rates, primary energy consumption, and education levels. As shown by Olofin et al. (2019), FPI promotes long-term economic growth by making broader investment funding available.
Governments must promote a macroeconomic environment that benefits foreign investors and ensure that FDI promotes sustainable economic growth (Botta 2018; Anetor 2020). This recommendation departs from the analysis conducted by Anetor (2020), which investigated the influence of foreign investment and financial development on Nigeria between 1986 and 2016. Using the impulse response function (IRF) and forecast error variance decomposition (FEVD) of the SVAR, this study found that the inflows of FDI and financial development had a positive and significant effect on economic growth in Nigeria. Meanwhile, portfolio investment, official development assistance, and remittances did not significantly affect economic growth in the country (Olofin et al. 2019).
Looking at Turkey, Gumus et al. (2013) found that FPI has a significant economic effect through the Stock Exchange Price Index and the exchange rate of the lira. This conclusion was drawn from an analysis of time series data involving FPI and macroeconomic factors between 2006 and 2012. Granger causality tests and impulse responses found that FPI influenced the Istanbul Stock Exchange Price Index. As they promoted efficiency in the domestic market, the exchange rate and industrial production index influenced FPI. Duasa and Kassim (2009) investigated the link between FPI and the performance of the Malaysian economy, as measured by proxy through the country’s real GDP between 1991 and 2006. This study found that economic growth stimulated volatility; the reverse was not true. In the period analyzed, economic performance was the main factor attracting FPI; as such, they emphasized the need for Malaysia to continue to practice sustainable growth to attract investors. Sawalha et al. (2016) tested the effect of foreign investment (FDI and FPI) on economic growth using a sample of twenty-one developed nations and nineteen developing nations between 1980 and 2012. Having developed a GMM approach for dynamic panel data, this study provided empirical evidence that FDI had a positive and significant effect on economic growth in the sample countries while FPI had a negative and significant effect.
Ndugbu et al. (2021) examined the link between FPI and economic growth in Nigeria between 1986 and 2017. Using ECM and a Granger causality approach, they took market capitalization, FPI, and market freedom as independent variables for understanding GDP as a proxy for economic growth. This research supported the findings of earlier studies, which indicated that market freedom and capitalization significantly promoted economic growth in Nigeria while FPI had a negative and insignificant effect. As such, they recommended that policymakers attempt to cultivate capital market activities to improve economic performance and stimulate growth.
A relatively recent study was conducted by Mlambo (2022) to analyze the effect of FPI on economic growth in Africa. This study used the GMM model to analyze quarterly data from the five African nations that ranked highest on the financial market index (South Africa, Botswana, Kenya, Mauritius, and Nigeria) between 1995 and 2014. This research found a weak association between FPI and economic growth, as well as a positive link between exchange rates and long-term growth. As exchange rates deteriorate, economic growth in Africa is stymied. Mlambo (2022) thus recommends that the central banks of Africa develop better strategies to improve the flow of capital, such as by establishing new financial institutions and strengthening existing ones.
A study by Acha and Essien (2018) investigated the influence of FPI on Nigeria’s economic growth between 2005 and 2014. GDP was used as a dependent variable, while FPI, market capitalization, and exchange rates were used as independent variables. OLS dual regression was used to show that FPI and market capitalization positively influenced real GDP, while the inverse is true for gross regional domestic product (GRDP). Also taking Nigeria as their example, Waliu and Elijah (2020) used a dynamic approach to understand the link between foreign investment and economic growth in Nigeria between 1980 and 2018. ADF was used to test the significance of FPI for the Nigerian economy. This study provided empirical evidence that foreign investment, domestic savings, government expenditures, and market capitalization determined the long-term trends in GDP. FPI played an important role in Nigeria, as it stimulated the accumulation of capital for production activities, promoted the adoption of new technologies, increased the balance of payments, created business opportunities, and increased tax revenues. FPI also accelerated economic growth, with its effects more evident over the long term than over the short term (Gunaydin and Tatoglu 2005).
Ezeanyeji and Maureen (2019) explored the effects of FPI on Nigeria’s economic growth between 1986 and 2017. Using ADF, Johansen cointegration, and ECM, they found that FPI had a positive and significant influence. As such, they recommended that governments develop policies that promoted the long-term development of capital markets and other aspects of the economy. Governments must create a conducive business environment by providing a stable electric grid, good roads, physical and spiritual security, and consistent policies that promote local domestic investment.
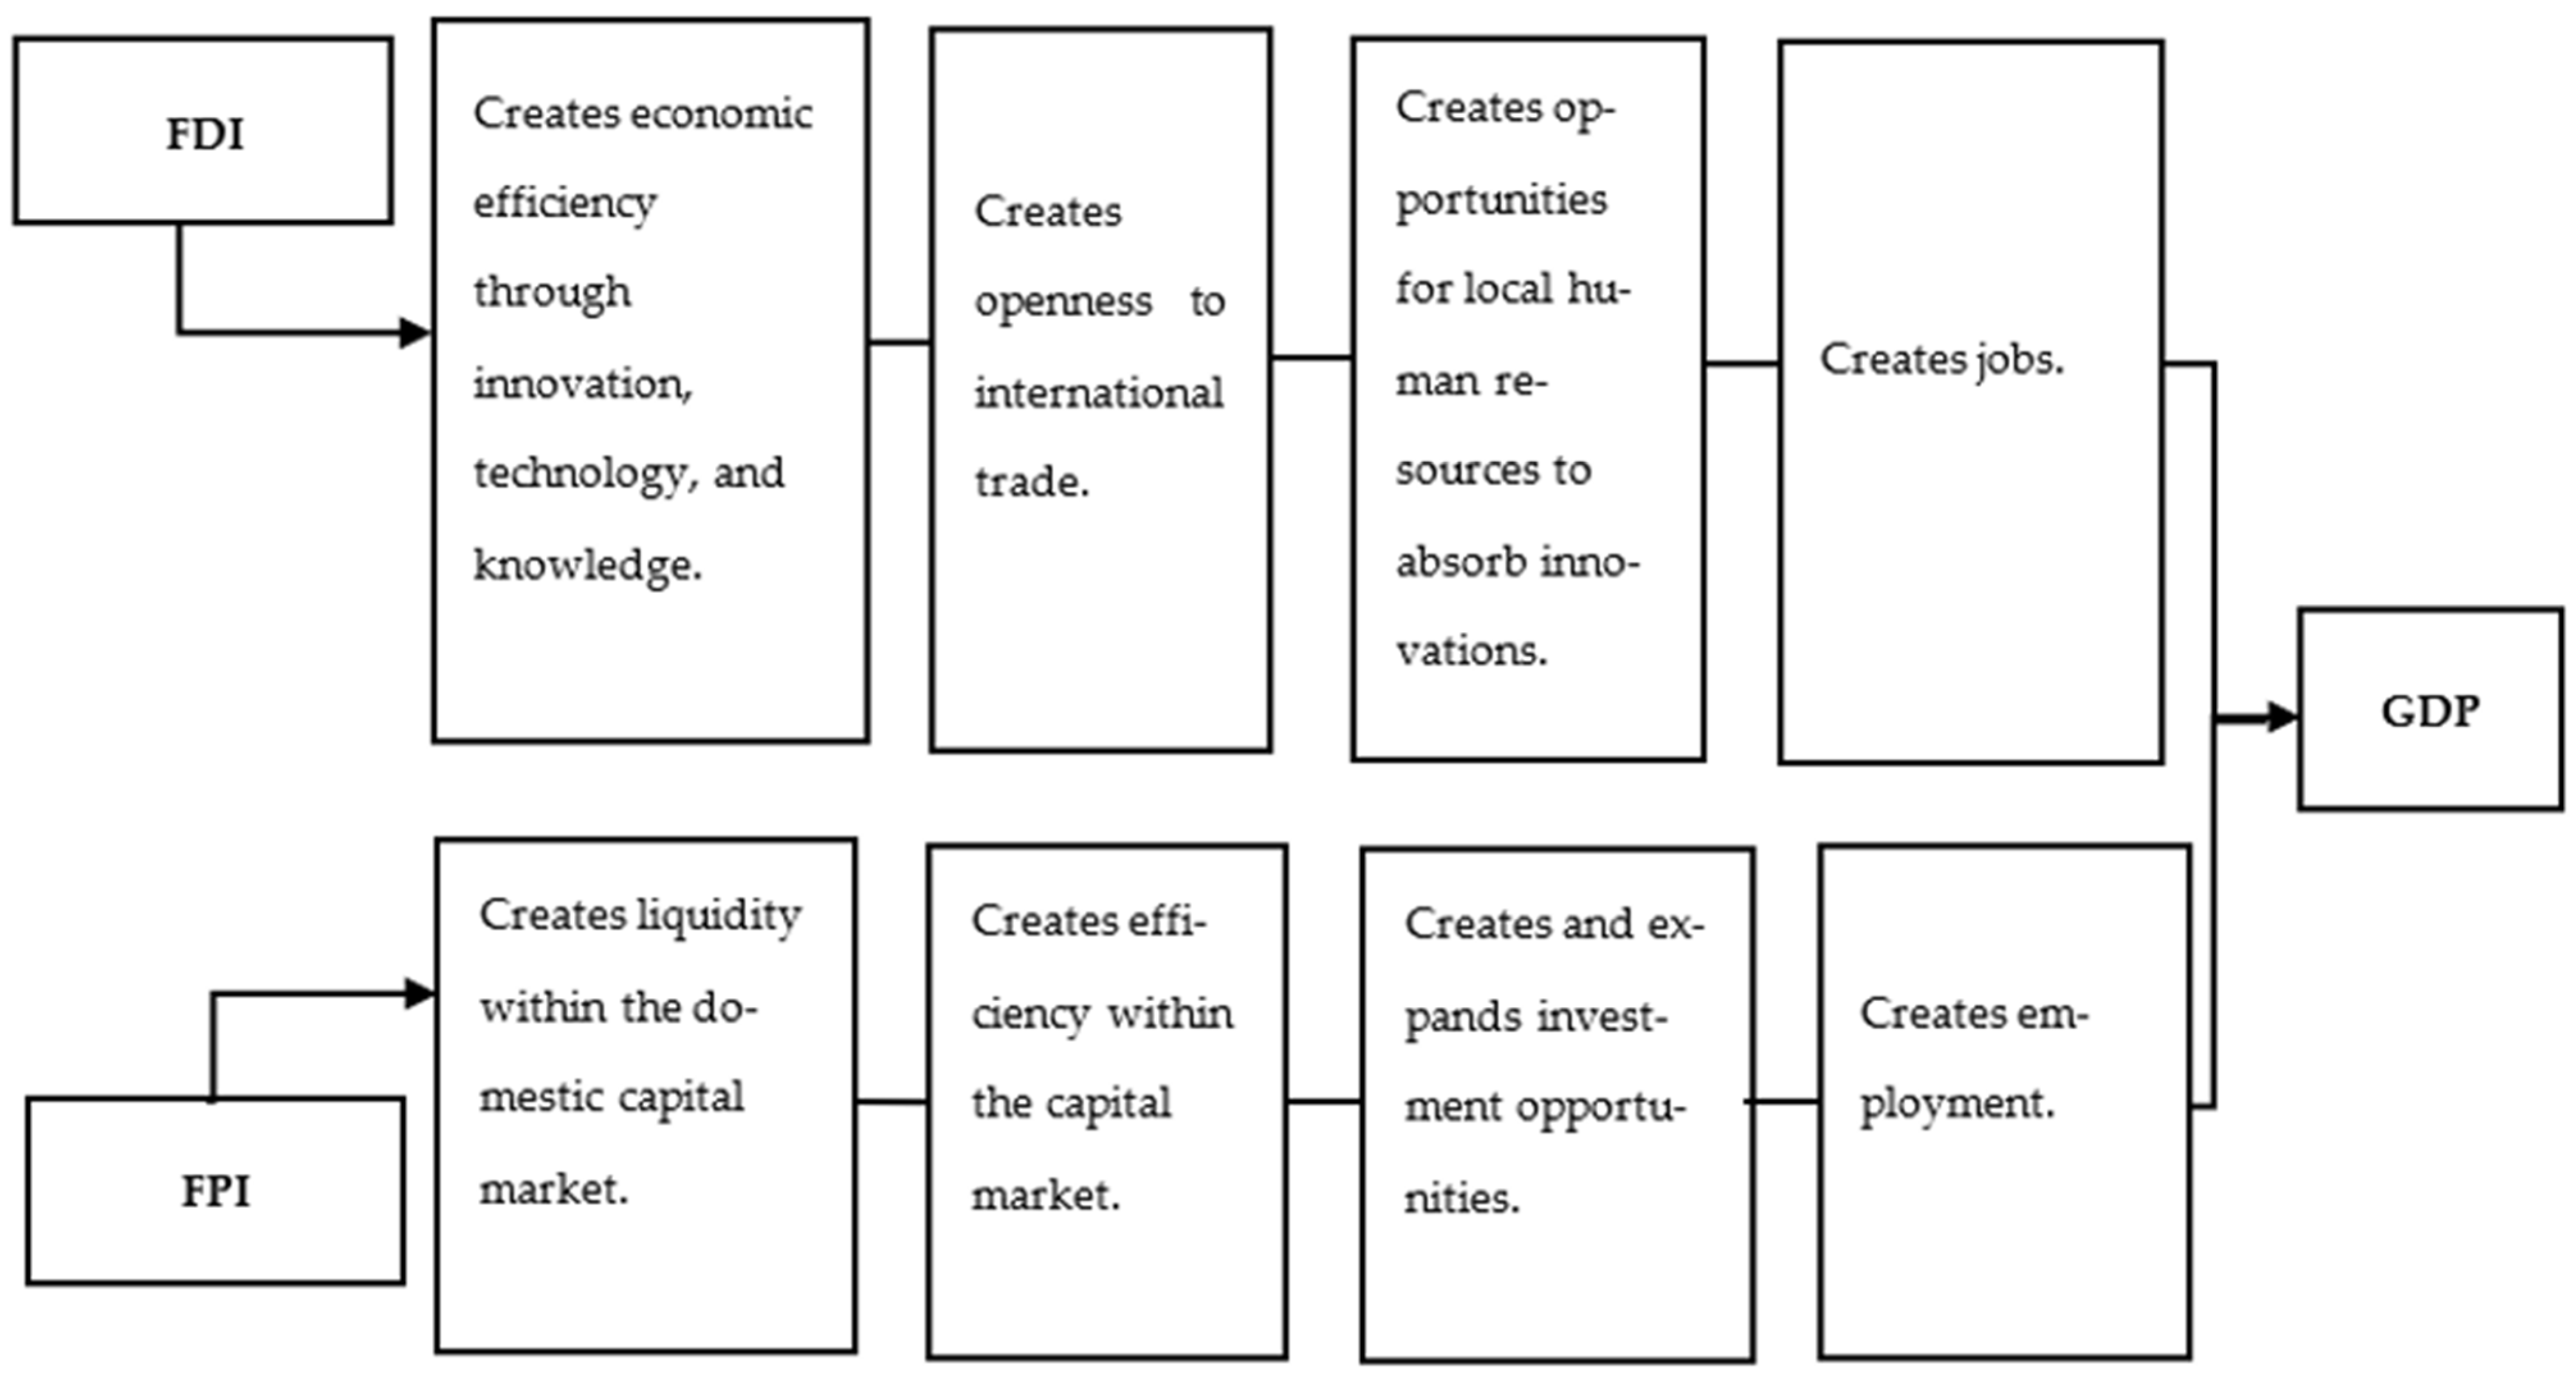
These empirical studies show a link between FDI/FPI and GDP. In many countries, FDI has been shown to improve the efficiency of the economy through innovation and technology transfer. Likewise, FDI opens national economies to the global economy, thereby creating jobs and promoting growth. Meanwhile, working through the financial sector, FPI contributes to the accumulation of economic value by creating liquidity in the domestic market, promoting efficiency, expanding access to funding, stimulating production, and creating jobs.
The numerous empirical studies above demonstrate that FDI and FPI contribute to a nation’s GDP. It has been observed in many nations that FDI increases an economy’s efficiency through innovation and technology transfer. Additionally, FDI makes an economy more exposed to the world market, generating domestic employment and fostering economic expansion. FPI, nevertheless, also gives an economy accumulated economic value. The financial sector shapes the function of FPI, which includes supplying liquidity on the domestic market, promoting market efficiency, increasing access to credit, growing the manufacturing sector, and creating jobs in a nation (See Figure 4).
Existing empirical studies have found positive and negative associations between FDI, FPI, and economic growth, both in developed and developing nations (Botta 2018; Taiwo and Olayemi 2015; Sothan 2017; Rehman 2016; Carbonell and Werner 2018; Shevelova and Plaskon 2018; Dinh et al. 2019; Ibhagui 2020). Table 1 summarizes research results regarding the causality association of FDI, FPI, and GDP representing various countries and continents. This table shows the results of studies to depict the geographical concentration of studies being reviewed. The research results in developed countries, including leading global economies, Spain, Central and Eastern European countries, and Turkey, show a causal relationship between FDI, FPI, and GDP. Similar results were also found in developing countries such as countries in Africa, Cambodia, Pakistan, and Malaysia. However, from the regression approach, it is generally found that FDI plays an essential role in the GDP of least-developed countries such as African countries (see Table 1).
Thus, the relationship between FDI, FPI, and GDP is examined in this study by assessing the following hypothesis:
H1.
FDI has a positive impact on GDP in ten ASEAN member states..
H2.
FPI has a positive impact on GDP in ten ASEAN member states.
2. Methodology
2.1. Data and Variables
This research relied on GDP, FDI, and FPI data from World Development Indicators, as published by the World Bank. Economic performance (as measured through GDP) is taken as a dependent variable, while foreign direct investment (FDI) and foreign portfolio investment (FPI) are taken as independent variables. GDP refers to real economic growth (USD Constant), while FDI and FPI refer to foreign investment (USD Constant). The influx of direct investment equity into the reporting economy is called foreign direct investment. The total equity capital, income reinvestment, and other capital are represented here. A type of cross-border investment known as direct investment occurs when citizens of one economy exercise significant control or influence over the administration of businesses located in another. A requirement for establishing a direct investment relationship is ownership of 10 percent or more of the voting common stock. Other than those recorded as direct investments, net inflows of equity securities are included in portfolio equity. These inflows include shares, deposit receipts (American or international), and foreign investors’ direct purchases of shares in local stock exchanges. The GDP value utilized in this study represents the actual value of GDP, hence the real GDP. The percentage of increases over time caused by inflation, as opposed to those caused by actual growth, can be calculated using real GDP (Table 2).
As its sample, this study took balanced panel data from the ten member states of ASEAN—Myanmar, Brunei, Cambodia, Indonesia, Laos, Malaysia, Singapore, Vietnam, and the Philippines—covering the period between 2009 and 2020. As such, the dataset included 120 observations (10 countries × 12 years). The variables used in this study are defined below.
2.2. Econometric Model
In this study, the causal link between GDP, FDI, and FPI was analyzed using the augmented version of the econometric model offered by Mankiw et al. (1992). It used the following regression model to examine the link between dependent and independent variables, following Apostolov (2016), Li and Liu (2005), and Latief et al. (2020):
with Yit referring to the real GDP of member state i in year t; Xit referring to the independent variable as varied across time and country, λi referring to the unobserved country-specific effect; µi referring to the unobserved time-specific effect, and εit referring to the error term. Equation (1) above may be written into the econometric model to estimate the influence of FDI and FPI on GDP in ASEAN nations:
Yit = α0 + βXit + λi + µi + εit
GDPit = α0 + α1FDIit + α2FPIit + λi + µi + εit
In this equation, GDP is Gross Domestic Product, FDI is Foreign Direct Investment, FPI is Foreign Portfolio Investment, α0 is the constant term, i is the ASEAN member state, t is the period between 2009 and 2020, and α1–α2 is the regression coefficient. Referring to Baltagi (2021) and Hsiao (2007), this study used panel data analysis, as it has been shown to contain the information necessary to handle the dynamics of the specific times and entities investigated. Testing was conducted using a unit root test and a panel causality test.
In panel data, independent variables may be affected by endogeneity, particularly over the short term (Carbonell and Werner 2018; Baltagi 2021). Another shortcoming of panel data is the potential for time-varying omitted variables (Mohammed 2022; Edmore and Odhiambo 2021). To overcome this issue, Arellano and Bond (1991) recommend using a dynamic panel data model that combines the estimation methodology and the GMM system; in this regard, the lagged endogenous variable is an independent variable (Nicholas et al. 2020; Triguero et al. 2020). The GMM model produces results consistent with the existence of different sources of endogeneity, also known as unobserved heterogeneity (Minviel and Sipiläinen 2021; Duxbury 2021; Nicholas et al. 2020). Referring to Arellano and Bond (1991), Equation (1) may be written using the first difference to eliminate the country-specific effect, as follows:
Yit − Yi, t − 1 = α0 + δ (Yi,t − Yi, t − 2) + β’(Xi,t + Xi,t − 1) + (λt + λt − 1) +(εit + εit − 1)
3. Results
3.1. Descriptive Statistics
Based on 120 observations, Table 3 provides descriptive statistics of the investigated variables. The mean for the GDP variable is 11,892.14; the mean for the FDI variable is 12,832.71; and the mean for the FPI variable is 3826.65. The skewness of the GDP variable is 2.401358 > 0, which indicates positive asymmetry. The skew for the FDI and FPI variables is also greater than 0, again indicating positive asymmetry. The kurtosis of the GDP variable is 7.544513 > 3, indicating a leptokurtic distribution. The kurtosis for the FDI variable is 11.30705 > 3, while the kurtosis is 14.82055 > 3 for the FPI variable (Westfall et al. 2014).
3.2. Cross-Sectional Dependence Test
Cross-sectional dependence test is an important diagnostic for panel data analysis (Menegaki 2021; De Hoyos and Sarafidis 2006; Lim et al. 2020). It is used to ascertain whether cross-sectional dependence exists within the panel data. Cross-sectional dependence indicates that units in the same cross-section are correlated due to some unobserved common factors (Baltagi and Pesaran 2007). In this study, cross-sectional dependence testing was conducted using the Lagrange Multiplier (LM) test developed by Breusch and Pagan (1980), the Cross-section Dependence (CD) test developed by Pesaran (2004), the Bias-Adjusted Cross-Sectional Dependence Lagrange Multiplier (CD LM) test offered by Pesaran et al. (2008) and Lim et al. (2020). As shown in Table 4, cross-section dependency exists in the panel model at a significance threshold of five percent (α = 5%).
3.3. Panel Unit Root Test
Testing identified cross-sectional dependency, and thus the stationarity of the panel data was examined. Testing involved the root analysis proposed by Levin et al. (2002), referred to hereafter as LLC, as well as ADF and a test designed by Fisher and Phillips–Perron (Fisher–PP). The null hypothesis was that the panel data had root units; the alternative hypothesis was that the panel data did not have root units.
The equation for unit root testing was:
Δyit = øiyi, t − 1 + z’itγi + eit
In this equation, yit is the variable being tested; z’itγi is the panel-specific means; and ø is the specific AR parameter for the panel. Root unit analysis found, as shown in Table 5, that all variables were stationary in levels.
3.4. Panel Cointegration Test
Based on the above results, the Pedroni cointegration test was used to examine the association between GDP, FDI, and FPI over the long term. This test used the following equation:
GDPit = αi + δit + β1FDIit + β2FPIit + εit
In this equation, i = 1, 2 …… N refers to the ten ASEAN member states in the panel data, while t = 1, 2 … T refers to the twelve years under consideration. The parameters αi and δi refer to the country and time effect, respectively. The residual εit is integrated into the null hypothesis of no cointegration.
Table 6 presents the results of Pedroni cointegration testing. Four of the seven statistics—Panel PP-Statistic, Panel ADF-Statistic, Group PP-Statistic, and Group ADF-Statistic—were significant at a level of 1%. As such, the null hypothesis is rejected and the alternative hypothesis is accepted, suggesting that a long-run relationship exists between GDP, FDI, and FPI. The cointegration between the variables under consideration suggested a long-term causal relationship between GDP, FDI, and FPI. The Dumitruescu–Hurlin causality test was subsequently used to analyze the causality between the variables under consideration.
3.5. Dumitrescu–Hurlin Panel Causality Analysis
Dumitrescu–Hurlin Panel Causality Analysis (DHPC) was used to ascertain whether a short-term causal relationship exists between GDP, FDI, and FPI in the panel data being investigated. This approach was chosen because it performs better for panel data than the frequently applied Granger analysis. Where Granger causality analysis is employed for panel data, its viability depends on the selected number of items (N) within a given time horizon (T) (Jangam 2021; Szarowská 2018; Dumitrescu and Hurlin 2012). Conversely, DHPC is better equipped to understand the interconnections between nations; it is also more robust to heterogeneity. DHPC uses the following equation (Dumitrescu and Hurlin 2012):
In this equation, K is the optimum interval lag, while Y and X are the two variables whose causal relationship is under consideration. It may thus be said that DHPC is used to detect whether X is a cause of Y.
The results of DHPC are displayed in Table 7. The results of the Dumitrescu–Hurlin panel causality test reveal that in the short term, there is a causal association between FDI and GDP, both a one-way and a two-way association. The null hypothesis, which states that FDI does not homogeneously cause GDP, is rejected with a p-value of 0.0069 < 0.0500, meaning that FDI causes GDP. There is homogeneous causality between FDI and GDP across ten ASEAN countries. Similarly, the null hypothesis that GDP does not homogeneously cause FDI was rejected, with a p-value of 0.0015 < 0.0500, implying both GDP and FDI cause each other across ten ASEAN countries. This finding implies that an increase in FDI and FPI can improve GDP over the short term. This finding provides strong evidence that FDI stimulates and contributes to economic growth in the ten member states of ASEAN. These findings are consistent with those made in other countries by empirical studies such as Okwu et al. (2020), who posited that causality runs from FDI to GDP to FDI in 30 leading global economies and Dinh et al. (2019) who discovered a bi-directional causality between FDI and GPI in GDP 30 developing countries.
The outcome of the causal relationship between FPI and GDP is different. Findings from the causality test establish a unidirectional causal relationship between FPI and GDI. For the null hypothesis where FPI does not homogeneously cause GDP, a p-value of 0.0263 < 0.0500 is obtained, and for the null hypothesis that GDP does not homogeneously cause FPI, a p-value of 0.9471 > 0.0500 is obtained. Thus, overall, the short-run causality test results imply that FPI causes GDP, but GDP does not cause FPI. In similarity, Mlambo (2022) provided strong evidence of causality between FPI and GDI in South Africa, Botswana, Kenya, and Sawalha et al. (2016) demonstrated that FPI caused GDP in 21 developed countries and 19 developing countries.
3.6. GMM Estimates: FMOLS and DMOLS
As long-term cointegration between variables was identified, the analysis continued with fully modified least squares (FMOLS) and dynamic least squares (DMOLS) estimates (Lim et al. 2020; Hafeez et al. 2018; Dauda et al. 2019). FMOLS and DMOLS were chosen for their ability to overcome such issues as endogeneity and serial correlation (Pedroni 2004). FMOLS and DMOLS are used to investigate long-term relationships where causality exists (Hafeez et al. 2018).
The FMOLS estimator may be written as follows:
In this formula, Yit is the endogeneity correlation term and Δεμ is the serial correlation correction term. DOLS involves the adaptation of metrics to handle errors in static regression. Corrections are rooted in the assumption that a link exists between the residual of static regression, the first difference between the lead and lag, and the contemporary value of regressors within the first difference (Maeso-Fernandez et al. 2004). DOLS estimation is conducted using the following equation:
In this equation, q2 is the maximum lead length, q1 is the maximum lag length, ΔXit+j removes the endogenous effect of Xit, and μit is the error term. An estimation of the long-term relationship between FDI, FPI, and GDP is reported in Table 8. It shows that, using both FMOLS and DMOLS, FDI and FPI are estimated to significantly affect GDP over the long term in ASEAN’s ten member-states. FDI and FPI are positive and negative parameters, respectively. As a result, the regression coefficient for the FDI variable is 150,998, suggesting that if FDI increases by 1 billion US dollars, GDP will increase by 150,998 billion US dollars, providing all other independent variables remain constant. If the FPI rises by 1 billion US dollars, GDP falls by 210,907.6 billion US dollars, assuming the other independent variables are constant. The value of the adjusted R2 is 0.2650 which reflects that 26.50 percent variations in the dependent variable are explained by the independent variables. A positive long-term relationship between FDI and GDP was also found in several empirical studies, including those of Yusuf et al. (2020), Albulescu (2015), Metwally (2004), Shevelova and Plaskon (2018), and Dinh et al. (2019).
Meanwhile, FPI is negatively associated with GDP. DMOLS calculations indicate that an increase in FDI of 1 billion US dollars leads to a rise in GDP of 211,724.9 billion US dollars, provided all other independent variables remain constant. In contrast, an increase in FPI of 1 billion US dollars reduces GDP by 240,005.2 billion US dollars, provided all other independent variables remain constant. The value of adjusted R2 is 0.8394, implying 83.94 percent variations in the dependent variable are explained by the independent variables. This confirms the findings of several previous studies, including those by Sawalha et al. (2016), Sengupta and Puri (2020), and Ndugbu et al. (2021).
4. Discussion
Understanding the association and direction of causality between FDI, FPI, and GDP is vital for formulating policies to encourage investment in a country. FDI and FPI have been discovered to influence the economic development of nations, including in Southeast Asia. However, the study of panel data from the ten member states of ASEAN has been limited. Likewise, although the topic has drawn significant interest, there needs to be more consensus in the literature regarding the nature of this relationship.
Thus, this study investigated the association of FDI, FPI, and GDP using panel data from the ten member states of ASEAN for the 2009–2022 period. First, cross-sectional dependence testing was conducted, finding the existence of cross-sectional dependency. Second, panel unit root tests were performed, finding that all variables under consideration were stationary in levels. Third, panel cointegration testing found that the variables were cointegrated, suggesting a link between GDP, FDI, and FPI over the long term. Analysis continued with Dumitruescu–Hurlin causality testing to identify causal ties between variables, as well as long-run econometric models and dynamic least squares models for examining how FDI and FPI impact GDP.
The empirical results of this study may be summarized as follows. First, over the short term, FDI and FPI promote GDP formation in the 10 ASEAN member states. Bilateral causality existed between FDI and GDP and between FPI and GDP. This finding suggests that, over the short term, both FDI and FPI stimulate GDP. This study’s findings corroborate the outcomes of Albulescu (2015), Akiri and Ushie (2020), and Ezeanyeji and Maureen (2019). Second, long-run panel estimation found that FDI and FPI significantly influence ASEAN’s GDP. However, their effect differs: FDI and GDP have a favorable relationship, while FPI negatively associates with GDP. Such findings are in line with the results of Yusuf et al. (2020); Albulescu (2015); Akadiri et al. (2019); Sothan (2017); Dinh et al. (2019), and Waliu and Elijah (2020).
The study’s findings are consistent with the idea that although both FDI and FPI have positive economic effects, host countries prefer FDI since it is less erratic (Bautista 2005). This explains why FDI has a beneficial effect on the growth of GDP in the ASEAN countries that are under investigation. Due to the potential size and liquidity of their assets, FDI investors are unable to swiftly liquidate their investments and assets and set off a country. In view of this, investors most often choose a long-term strategy while undertaking FDI, which results in a lengthy process from the initial planning phase through project completion.
On the other hand, FPI investors can more easily withdraw their investments and leave a country because their investments and financial assets are more liquid and widely traded (Hurley and Santos 2001). This lesson about the highly volatile FPI market was also experienced by ASEAN countries when the economic crisis and currency crisis occurred in Southeast Asia in July 1997, which started in Thailand and spread quickly to Malaysia, the Philippines, Indonesia, Korea, Taiwan, and Hong Kong. At that time, there was a large-scale inflow of foreign capital into the Southeast Asian financial system, which became vulnerable to panic and sudden reversals of market confidence (Chancharoenchai and Dibooglu 2006). The 1997 Asian crisis was marked by the collapse of the stock market in a very short time, followed by an unprecedented depreciation of five currencies in Asian countries—Thailand, Indonesia, Malaysia, the Philippines, and South Korea (Chancharoenchai and Dibooglu 2006). The high volatility of all ASEAN currencies also triggered a crisis in the financial sector of ASEAN countries during the 1997 crisis (Hurley and Santos 2001). Therefore, empirical findings in the research that show FPI is negatively related to a country’s GDP may be due to the high volume of FPI in ASEAN countries, so a high level of FPI can face high market volatility and currency fluctuations in the event of high economic uncertainty (Bautista 2005), including in ASEAN countries.
5. Conclusions
ASEAN will become one of the future centers of world economic growth. ASEAN’s GDP is the third largest in Asia’s most significant economic region and the fifth largest globally, with a GDP of almost 3.2 trillion USD in 2019 (The ASEAN Secretariat 2023). ASEAN is becoming a major FDI destination in developing countries—second only to China—and is expected to drive global economic recovery. The increase in investment flows into the ASEAN region was driven by several factors, including increasing investment from outside the region, manufacturing growth, strategically significant improvements in global supply chains, and growing investment in infrastructure, including the digital economy. In addition, ASEAN has made a robust economic recovery from COVID-19 due to significant economic growth and record levels of FDI inflows (The ASEAN Secretariat 2023). The high flow of investment to ASEAN reflects the attractiveness of the regional economy for global investors.
The study contributes to the existing literature by adopting panel data analysis from 10 ASEAN member countries. The study investigates the relationship and causality between FDI and FPI as determinants of GDP in the examined ASEAN countries. The findings indicate that in the short and long term, FDI benefits the economies of ASEAN member countries. As a result, FDI and GDP have both been proven to be causative in the ten ASEAN nations studied. The causal association between FDI and GPI is two-way in the short run.
Despite the fact that FPI has a causal relationship with GDP in countries, the influence of FPI on GDP in ASEAN countries is deterministic. This detrimental effect is suspected, among other things, due to the highly volatile nature of financial markets and the high amount of uncertainty regarding FDI implementation.
Findings from this study have important policy implications. The members of ASEAN must focus on policies that are friendly and attractive to FDI. These nations may, for example, use policy approaches to incentivize foreign investment and mitigate the deleterious effects of FPI. It is paramount that the ten members of ASEAN optimize the positive effects of foreign investment on their economies.
Funding
This research received no external funding.
Informed Consent Statement
Not applicable.
Data Availability Statement
Data available in a publicly accessible repository.
Acknowledgments
This work would not have been possible without the support of the Department of Business Administration, Atma Jaya Catholic University of Indonesia.
Conflicts of Interest
The author declares no conflict of interest.
References
- Acha, I. Ikechukwu, and Joseph M. Essien. 2018. The Economic Growth Imperative of Foreign Portfolio Investment for Nigeria. Noble International Journal of Economics and Financial Research 3: 71–77. Available online: http://napublisher.org/?ic=journals&id=2 (accessed on 14 May 2022).
- Agyapong, Daniel, and Kojo Asare Bedjabeng. 2020. External Debt Stock, Foreign Direct Investment and Financial Development: Evidence from African Economies. Journal of Asian Business and Economic Studies 27: 81–98. [Google Scholar] [CrossRef]
- Akadiri, Ada Chigozie, Hasan Gungor, Seyi Saint Akadiri, and Mojibola Bamidele-Sadiq. 2019. Is The Causal Relation between Foreign Direct Investment, Trade, and Economic Growth Complement or Substitute? The Case of African Countries. Journal of Public Affairs 20: e2023. [Google Scholar] [CrossRef]
- Akiri, Sunday Edesiri, and Hilary Eshidenang Ushie. 2020. Foreign Portfolio Investment and Economic Growth in Nigeria. Kuwait Chapter of the Arabian Journal of Business and Management Review 9: 18–26. [Google Scholar] [CrossRef]
- Albulescu, Claudiu Tiberiu. 2015. Do Foreign Direct and Portfolio Investments Affect Long-Term Economic Growth in Central and Eastern Europe? Procedia Economics and Finance 23: 507–12. [Google Scholar] [CrossRef] [Green Version]
- An, Thu-Ha Thi, and Kuo-Chun Yeh. 2021. Growth effect of foreign direct investment and financial development: New insights from a threshold approach. Journal of Economics and Development 23: 144–62. [Google Scholar] [CrossRef]
- Anetor, Friday Osemenshan. 2019. Foreign direct investment inflows and real sector: A vector autoregressive (VAR) approach for the Nigerian economy. The Journal of Developing Areas 53: 27–42. [Google Scholar] [CrossRef]
- Anetor, Friday Osemenshan. 2020. Foreign Capital Inflows, Financial Development and Growth in Nigeria: A Structural Var Approach. The Journal of Developing Areas 54: 69–86. [Google Scholar] [CrossRef]
- Apostolov, Mico. 2016. Effects of Foreign Direct Investments. Evidence from Southeast Europe. Cuadernos de Economia 39: 1–13. [Google Scholar] [CrossRef] [Green Version]
- Arellano, Manuel, and Stephen Bond. 1991. Some Tests of Specification for Panel Data: Monte Carlo Evidence and an Application to Emplyment Equations. Review of Economic Studies 58: 277–97. [Google Scholar] [CrossRef] [Green Version]
- Baltagi, B. 2021. Econometric Analysis of Panel Data: Springer Texts in Business and Economics, 6th ed. New York: Springer. [Google Scholar]
- Baltagi, Badi Hani, and Hashem Pesaran. 2007. Heterogeneity and cross section dependence in panel data models: Theory and applications introduction. Journal of Applied Econometrics 22: 229–32. [Google Scholar] [CrossRef]
- Bambi, Mauro, Cristina Di Girolami; Salvatore Federico, and Fausto Gozzi. 2017. Generically distributed investments on flexible projects and endogenous growth. Economic Theory 63: 521–58. [Google Scholar] [CrossRef] [Green Version]
- Bautista, Carlos C. 2005. How volatile are East Asian stocks during high volatility periods? Applied Economics Letters 12: 319–26. [Google Scholar] [CrossRef]
- Botta, Alberto. 2018. The Long-Run Effects of Portfolio Capital Inflow Booms in Developing Countries: Permanent Structural Hangovers After Short-Term Financial Euphoria. Santiago: United Nations Publication. [Google Scholar]
- Breusch, Trevor Stanley, and Adrian Rodney Pagan. 1980. The Lagrange Multiplier Test and its Applications to Model Specification in Econometrics. The Review of Economic Studies 47: 239–53. [Google Scholar] [CrossRef]
- Carbonell, Jorge Bermejo, and Richard A. Werner. 2018. Does Foreign Direct Investment Generate Economic Growth? A New Empirical Approach Applied to Spain. Economic Geography 94: 425–56. [Google Scholar] [CrossRef]
- Chancharoenchai, Kanokwan, and Sel Dibooglu. 2006. Volatility Spillovers and Contagion During the Asian Crisis: Evidence from Six Southeast Asian Stock Markets. Emerging Markets Finance and Trade 42: 4–17. [Google Scholar] [CrossRef] [Green Version]
- Chow, Kwan Chow. 2008. Managing Capital Flows: The Case of Singapore. ADB Institute Discussion Paper No. 86. Available online: https://www.adb.org/sites/default/files/publication/156725/adbi-dp86.pdf (accessed on 10 May 2023).
- Dauda, Lamini, Xingle Long, Claudia Nyarko Mensah, and Muhammad Salman. 2019. The effects of economic growth and innovation on CO2 emissions in different regions. Environmental Science and Pollution Research International 26: 15028–38. [Google Scholar] [CrossRef]
- Deonanan, Deonanan, and Daren Conrad. 2022. Foreign Direct Investment and Economic Growth in Guyana: The Role of Financial Sector Development. The Review of Black Political Economy 49: 309–26. [Google Scholar] [CrossRef]
- Dinh, Trang Thi-Huyen, Duc Hong Vo, Anh The Vo, and Thang Cong Nguyen. 2019. Foreign Direct Investment and Economic Growth in The Short Run and Long Run: Empirical Evidence from Developing Countries. Journal of Risk and Financial Management 12: 176. [Google Scholar] [CrossRef] [Green Version]
- Donaubauer, Julian, Peter Kannen, and Frauke Steglich. 2022. Foreign Direct Investment & Petty Corruption in Sub-Saharan Africa: An Empirical Analysis at the Local Level. The Journal of Development Studies 51: 76–95. [Google Scholar] [CrossRef]
- Duasa, Jarita, and Salina Kassim. 2009. Foreign Portfolio Investment and Economic Growth in Malaysia. The Pakistan Development Review 48: 109–23. [Google Scholar] [CrossRef] [Green Version]
- Dumitrescu, Elena-Ivona, and Christophe Hurlin. 2012. Testing for Granger non-causality in heterogeneous panels. Economic Modelling 29: 1450–60. [Google Scholar] [CrossRef] [Green Version]
- Duxbury, Scott W. 2021. A General Panel Model for Unobserved Time Heterogeneity with Application to the Politics of Mass Incarceration. Sociological Methodology 51: 348–77. [Google Scholar] [CrossRef]
- Edmore, Mahembe, and Nicholas Mbaya Odhiambo. 2021. Does foreign aid reduce poverty? A dynamic panel data analysis for sub-saharan african countries. Journal of Economic Inequality 19: 875–93. [Google Scholar] [CrossRef]
- Ezeanyeji, Clement, and Ifeako Maureen. 2019. Foreign Portfolio Investment on Economic Growth of Nigeria: An Impact Analysis. International Journal of Academic Management Science Research 3: 24–36. [Google Scholar]
- Gumus, Guluzar Kurt, Atakan Duru, and Bener Gungor. 2013. The Relationship Between Foreign Portfolio Investment and Macroeconomic Variables. European Scientific Journal 9: 209–226. [Google Scholar]
- Gunaydin, Ihsan, and Ekrem Tatoglu. 2005. Does Foreign Direct Investment Promote Economic Growth? Evidence from Turkey. Multinational Business Review 13: 89–106. [Google Scholar] [CrossRef]
- Guvercin, Deniz, and Adem Gok. 2021. Foreign Direct Investment, Foreign Portfolio Investment and House Prices: The Case of European Union Countries. Journal of Administrative Sciences 19: 911–26. [Google Scholar] [CrossRef]
- Hafeez, Muhammad, Yuan Chunhui, David Strohmaier, Manzoor Ahmed, and Liu Jie. 2018. Does finance affect environmental degradation: Evidence from one belt and one road initiative region? Environmental Science and Pollution Research 25: 9579–92. [Google Scholar] [CrossRef]
- Hagan, Edmond, and Anthony Amoah. 2020. Foreign Direct Investment and Economic Growth Nexus in Africa: New Evidence from The New Financial Fragility Measure. African Journal of Economic and Management Studies 11: 1–17. [Google Scholar] [CrossRef]
- Horvatin, Darko. 2019. Foreign Direct Investment and Economic Growth: Taking Stock of The Current State of Empirical Research. Business Excellence 13: 179–201. [Google Scholar] [CrossRef] [Green Version]
- De Hoyos, Rafael, and Vasilis Sarafidis. 2006. Testing for cross-sectional dependence in panel-data models. The Stata Journal 6: 482–96. [Google Scholar] [CrossRef] [Green Version]
- Hsiao, Cheng. 2007. Panel Data Analysis—Advantages and Challenges. TEST 16: 1–22. [Google Scholar] [CrossRef] [Green Version]
- Hunt, Shelby D. 2012. Understanding the drivers of economic growth: Grounding endogenous economic growth models in resource-advantage theory. Contemporary Economics 6: 4–9. [Google Scholar] [CrossRef] [Green Version]
- Hurley, Dene T., and Rolando A. Santos. 2001. Exchange rate volatility and the role of regional currency linkages: The ASEAN case. Applied Economics 33: 1991–99. [Google Scholar] [CrossRef]
- Ibhagui, Oyakhilome. 2020. How Does Foreign Direct Investment Affect Growth in Sub-Saharan Africa? New Evidence from Threshold Analysis. Journal of Economic Studies 47: 149–81. [Google Scholar] [CrossRef]
- Jana, Shib Sankar, Tarak Nath Sahu, and Krishna Dayal Pandey. 2019. Foreign DIrect Investment and Economic Growth in India: A Sector Specific Analysis. Asia-Pacific Journal of Management Research and Innovation 15: 53–67. [Google Scholar] [CrossRef]
- Jangam, Bhushan Praveen. 2021. Global value chain embeddedness, labour productivity and employment in the Asia-Pacific countries. Studies in Economics and Finance 38: 339–60. [Google Scholar] [CrossRef]
- Kaur, Manpreet, Surendra Singh Yadav, and Vinayshil Gautam. 2013. A Bivariate Causality Link between Foreign Direct Investment and Economic Growth: Evidence from India. Journal of International Trade Law and Policy 12: 68–79. [Google Scholar] [CrossRef]
- Latief, Rashid, Sohail Ahmad Javeed, and Ahmed Shafique Joyo. 2020. The economic effects of foreign direct investment at firm level: Evidence from enterprises survey data. Applied Economics Letters 27: 753–58. [Google Scholar] [CrossRef]
- Levin, Andrew, Chien-Fu Lin, and Chia-Shang James Chu. 2002. Unit root tests in panel data: Asymptotic and finite-sample properties. Journal of Econometrics 108: 1–24. [Google Scholar] [CrossRef]
- Li, Xiaoying, and Xiaming Liu. 2005. Foreign Direct Investment and Economic Growth: An Increasingly Endogenous Relationship. World Development 33: 393–407. [Google Scholar] [CrossRef]
- Lim, Hyungwoo, Jaehyeok Kim, and Ha-Hyun Jo. 2020. Population Age Structure and Greenhouse Gas Emissions from Road Transportation: A Panel Cointegration Analysis of 21 OECD Countries. International Journal of Environmental Research and Public Health 17: 7734. [Google Scholar] [CrossRef]
- Maeso-Fernandez, Francisco, Chiara Osbat, and Bernd Schnatz. 2004. Towards the Estimation of Equilibrium Exchange Rates for CEE Acceding Countries: Methodological Issues and a Panel Cointegration Perspective. Frankfurt am Main, Germany. Available online: https://www.ecb.europa.eu/pub/pdf/scpwps/ecbwp353.pdf (accessed on 12 December 2022).
- Mankiw, Nicholas Gregory, David Romer, and David Nathan Weil. 1992. A Contribution to the Empirics of Economic Growth. Quarterly Journal of Economics 107: 407–37. [Google Scholar] [CrossRef]
- Mencinger, Joze. 2003. Does Foreign Direct Investment Always Enhance Economic Growth? KYKLOS 56: 491–508. [Google Scholar] [CrossRef]
- Menegaki, Angeliki. 2021. Chapter 8 Ways of treatment of cross-sectional dependence in. In A Guide to Econometrics Methods for the Energy-Growth Nexus, 1st ed. Edited by A. Menegaki. Cambridge: Academic Press, pp. 161–78. [Google Scholar] [CrossRef]
- El Menyari, Younesse. 2020. Effect of Tourism FDI and International Tourism to The Economic Growth in Morocco: Evidence from ARDL Bound Testing Approach. Journal of Policy Research in Tourism, Leisure and Events 13: 222–42. [Google Scholar] [CrossRef]
- Metwally, M. M. 2004. Impact of EU FDI on Economic Growth in Middle Eastern Countries. European Business Review 16: 381–89. [Google Scholar] [CrossRef]
- Minviel, Jean Joseph, and Timo Sipilainen. 2021. A dynamic stochastic frontier approach with persistent and transient inefficiency and unobserved heterogeneity. Agricultural Economics 52: 575–89. [Google Scholar] [CrossRef]
- Mlambo, Courage. 2022. The impact of international portfolio investment on economic growth: The case of selected African states. Research in Business & Social Science 11: 151–59. [Google Scholar] [CrossRef]
- Mohammed, Umar. 2022. Remittances, institutions and human development in Sub-Saharan Africa. Journal of Economics and Development 24: 142–57. [Google Scholar] [CrossRef]
- Mowlaei, Mohammad. 2018. The Impact of Foreign Ccapital Inflows on Economic Growth on Selected African Countries. African Journal of Economic and Management Studies 9: 523–36. [Google Scholar] [CrossRef]
- Ndugbu, Michael O, Kingsley C. Otiwu, and Uzowuru Lawrence N. 2021. The Effect Foreign Portfolio Investment on Economic Growth in Nigeria. South Asian Journal of Social Studies and Economics 11: 43–53. [Google Scholar] [CrossRef]
- Nicholas, Apergis, Mita Bhattacharya, and Walid Hadhri. 2020. Health care expenditure and environmental pollution: A cross-country comparison across different income groups. Environmental Science and Pollution Research International 27: 8142–56. [Google Scholar] [CrossRef]
- OECD. 2022. OECD International Direct Investment Statistics 2021. Paris: OECD Publishing. [Google Scholar] [CrossRef]
- Okwu, Andy Titus, Isiaq Olasunkanmi Oseni, and Rowland Tochukwu Obiakor. 2020. Does Foreign Direct Investment Enhance Economic Growth? Evidence from 30 Leading Global Economies. Global Journal of Emerging Market Economies 12: 217–30. [Google Scholar] [CrossRef]
- Olofin, Olabode Philip, Oluwole Oladipo Aiyegbusi, and Abayomi Ayinla Adebayo. 2019. Analysis of Foreign Direct Investment and Economic Growth in Nigeria: Application of Spatial Econometrics and Fully Modified Ordinary Least Square (FMOLS). Foreign Trade Review 54: 159–76. [Google Scholar] [CrossRef]
- Pedroni, Peter. 2004. Panel cointegration: Asymptotic and finite sample properties of pooled time series tests with an application to the PPP hypothesis. Econometric Theory 20: 597–625. [Google Scholar] [CrossRef] [Green Version]
- Pesaran, Mohammad Hashem. 2004. General Diagnostic Tests for Cross Section Dependence in Panels. Cambridge: University of Cambridge. [Google Scholar] [CrossRef]
- Pesaran, Mohammad Hashem, Aman Ullah, and Takashi Yamagata. 2008. A bias-adjusted LM test of error cross-section independence. The Econometrics Journal 11: 105–27. [Google Scholar] [CrossRef] [Green Version]
- Ramasamy, Bala, and Matthew Yeung. 2022. China’s outward foreign direct investment (OFDI) to developing countries: The case of Central and Eastern Europe (CEE). Journal of the Asia Pacific Economy 27: 124–46. [Google Scholar] [CrossRef]
- Rehman, Naqeeb Ur. 2016. FDI and Economic Growth: Empirical Evidence from Pakistan. Journal of Economic and Administrative Sciences 32: 63–76. [Google Scholar] [CrossRef]
- Sasana, Hadi, and Salman Fathoni. 2019. Determinant of Foreign Direct Investment Inflows in Asean Countries. Jurnal Ekonomi dan Kebijakan 12: 253–66. [Google Scholar] [CrossRef]
- Sawalha, Nabeel, Mohammad I. Elian, and Adil H. Suliman. 2016. Foreign Capital Inflows and Economic Growth in Developed and Emerging Economies: A Comparative Analysis. The Journal of Developing Areas 50: 237–56. [Google Scholar] [CrossRef]
- Sengupta, Pooja, and Roma Puri. 2020. Exploration of Relationship between FDI and GDP: A Comparison between India and Its Neighbouring Countries. Global Business Review 21: 473–89. [Google Scholar] [CrossRef]
- Shevelova, Svitlana, and Svitlana Plaskon. 2018. Is The Ukrainian Economy’s Absorptive Capacity Appropiate to Attract Foreign Direct Investment and Facilitate Economic Growth? International Journal of Emerging Markets 13: 1928–47. [Google Scholar] [CrossRef]
- Sothan, Seng. 2017. Causality between Foreign Direct Investment and Economic Growth for Cambodia. Cogent Economics & Finance 5: 1–13. [Google Scholar] [CrossRef]
- Soylu, Özgür Bayram. 2019. Do foreign direct investment and savings promote economic growth in poland? Economics and Business Review 5: 3–22. [Google Scholar] [CrossRef]
- Srinivasan, Palaniyappan, M. Kalaivani, and Peter Ibrahim. 2011. An Empirical Investigation of Foreign Direct Investment and Economic Growth in SAARC Nations. Journal of Asia Business Studies 5: 232–48. [Google Scholar] [CrossRef]
- Syarifuddin, Ferry. 2020. The Dynamics of Foreign Portfolio Investment and Exchange Rates: An Interconnection Approach in ASEAN. WP/8/2020. Jakarta: Bank Indonesia. Available online: http://publication-bi.org/repec/idn/wpaper/WP082020.pdf (accessed on 7 January 2023).
- Szarowská, Irena. 2018. Importance of R&D expenditure for economic growth in selected CEE countries. E+M Ekonomie a Management 21: 108–24. [Google Scholar] [CrossRef]
- Taiwo, Akinlo, and Simon-Oke Olayemi. 2015. Re-examine Foreign Direct Investment and Economic Growth: Panle Co-integration and Causality Tests for Sub-Saharan African Countries. International Area Studies Review 18: 73–86. [Google Scholar] [CrossRef]
- The ASEAN Secretariat. 2021. ASEAN Key Figures 2021. Jakarta, Indonesia. Available online: https://www.aseanstats.org/wp-content/uploads/2021/12/ASEAN-KEY-FIGURES-2021-FINAL-1.pdf (accessed on 5 January 2022).
- The ASEAN Secretariat. 2023. Investing in ASEAN 2023. Available online: https://asean.org/wp-content/uploads/2022/12/investment-report-2023.pdf (accessed on 24 June 2023).
- Theloudis, Alexandros. 2021. Consumption inequality across heterogeneous families. European Economic Review 136: 103765. [Google Scholar] [CrossRef]
- Triguero Cano, Angela, David Corcoles, and Sara Fernández. 2020. Influence of open innovation strategies on employment dynamics: Evidence for Spanish manufacturing firms. Economics of Innovation and New Technology 29: 242–65. [Google Scholar] [CrossRef]
- Tsaurai, Kunofiwa. 2022. Determinants of Foreign Portfolio Investments: BRICS as a Unit of Analysis. Acta Universitatis Danubius: Oeconomica 18: 81–99. [Google Scholar]
- Türkcan, Burcu, Alper Duman, and I. Hakan Yetkiner. 2008. How Does FDI and Economic Growth Affect Each Other? The OECD Case. In International Conference on Emerging Economic Issues in a Globalizing World. Izmir: UNCTAD, pp. 21–40. Available online: http://eco.ieu.edu.tr/wp-content/proceedings/2008/ (accessed on 20 April 2022).
- Udeogu, Ejike, Uzochukwu Amakom, and Shampa Roy-Mukherjee. 2021. Empirical Analysis of an Augmented Schumpeterian Endogenous Growth Model. Journal of Economic Development 46: 53–84. [Google Scholar] [CrossRef]
- Ullah, Safi, and Muhammad Tahir. 2022. Determinants of foreign investment in Pakistan. South Asian Journal of Business Studies 11: 67–81. [Google Scholar] [CrossRef]
- UNCTAD. 2021. ASEAN Investment Report 2020–2021 Investing in Industry 4.0. Jakarta, Indonesia. Available online: https://asean.org/wp-content/uploads/2021/09/AIR-2020-2021.pdf (accessed on 25 September 2022).
- Waliu, Otapo Toyin, and Adekunle Oludayo Elijah. 2020. Dynamic Effects of Foreign Portfolio Investment on Economic Growth in Nigeria. Financial Markets, Institutions and Risks 4: 5–12. [Google Scholar] [CrossRef]
- Westfall, Jacob, David Anthony Kenny, and Charles M. Judd. 2014. Statistical power and optimal design in experiments in which samples of participants respond to samples of stimuli. Journal of Experimental Psychology: General 143: 2020. [Google Scholar] [CrossRef] [Green Version]
- Yaacob, Mohd Hasimi, Raihan Mohd Nor, Hawati Janor, and Noor Azuan Hashim. 2021. The Influence of Asymmetric Information on Foreign Capital Inflows in ASEAN Plus Three Countries. International Journal of Management Studies 28: 89–114. [Google Scholar] [CrossRef]
- Yusuf, Hammed Agboola, Waliu Olawale Shittu, Saad Babatunde Akanbi, Habiba MohammedBello Umar, and Idris Abdulganiyu Abdulrahman. 2020. The Role of Foreign Direct Investment, Financial Development, Democracy and Political (In)stability on Economic Growth in West Africa. International Trade, Politics and Development 4: 27–46. [Google Scholar] [CrossRef]
Figure 1.
FDI for ASEAN Countries (2009–2020).

Figure 2.
FPI for ASEAN Countries (2009–2020).

Figure 3.
GDP for ASEAN Countries (2009–2020).

Figure 4.
The channel through which FDI and FPI affect GDP. Source: Author’s own development based on several empirical findings.
Figure 4.
The channel through which FDI and FPI affect GDP. Source: Author’s own development based on several empirical findings.


Table 1.
Country wise and year wise of the previous study.
| Author | Method | Country | Period | Result |
|---|---|---|---|---|
| FDI and GDP | ||||
| Yusuf et al. (2020) | Dynamic fixed effects ARDL | West Africa | 1996–2016 | Causality result: no causality (short term); FDI → GDP (long term). Regression results: FDI plays a significant and positive role in economic growth in West Africa. |
| Okwu et al. (2020) | Panel analysis | 30 leading global economies | 1998–2017 | Causality result: FDI → GDP. Regression result: FDI had a positive and significant impact on the economic growth of countries during this period. |
| Ibhagui (2020) | Threshold Regression Framework | 45 negara Sub-Sahara Africa (SSA) | 1985–2013 | Causality result: FDI → GDP. Regression result: FDI can accelerate economic growth when countries in the SSA have reached certain threshold levels of inflation, population growth, and financial market development. |
| Dinh et al. (2019) | ECM and FMOLS | 30 developing countries | 2000–2014 | Causality result: FDI → GDP. Regression result: FDI drives economic growth in the long run. FDI harms the economic growth of countries in the short term. |
| Carbonell and Werner (2018) | Unrestricted Autoregressive Distributed Lag | Spain | 1984–2010 | Causality result: FDI → GDP. Regression result: Foreign demand, human capital, productive credit, and labor have a significant favorable influence on economic growth. |
| Shevelova and Plaskon (2018) | GMM | 25 regions in Ukraine | 1996–2015 | Causality result: FDI → GDP. Regression result: FDI has no significant effect on Ukraine’s economic growth. |
| Sothan (2017) | VECM and Granger Causality | Cambodia | 1980–2014 | Causality result: No causality (short term); FDI → GDP (long term). Regression result: The long-run FDI-to-GDP coefficient is negative and statistically significant. In the short term, there is no causal relationship between FDI and GDP; in the long run, there is a unidirectional causal relationship between FDI and GDP; FDI contributes to Cambodia’s economic growth through growing physical capital. |
| Rehman (2016) | VECM | Pakistan | 1970–2012 | Causality result: GDP → FDI. Regression result: Foreign direct investment is dependent on economic growth, but the relationship does not operate the other way around. Pakistan’s economic progress may be hampered by a lack of human capital. |
| FPI and GDP | ||||
| Mlambo (2022) | GMM | South Africa, Botswana, Kenya, Mauritius and Nigeria | 1995–2014 | Causality result: FPI → GDP. Regression result: The FPI and GDP have a positive association. In the long run, the data likewise reveal a positive link between the exchange rate and GDP. |
| Ndugbu et al. (2021) | ECM and Granger Causality | Nigeria | 1986–2017 | Causality result: FPI → GDP. Regression result: Foreign portfolio investment has a negative and insignificant effect on economic growth in Nigeria. |
| Sawalha et al. (2016) | GMM | 21 samples of developed countries and 19 developing countries | 1980–2012 | Causality result: FPI → GDP. Regression result: FPI had a deleterious and statistically significant impact on both sample groups. |
| Albulescu (2015) | GMM | 13 CEE countries Central and Eastern European countries | 2005–2012 | Causality result: FPI → GDP. Regression result: Portfolio investment significantly affects long-term economic growth; FPI promotes long-term economic growth by providing broader investment financing. |
| Gumus et al. (2013) | VAR, Granger Causality Test; Impulse Responses and Variance Decomposition | Turkey | 2006–2012 | Causality result: FPI → GDP. Regression result: Foreign portfolio investment influences the Istanbul Stock Exchange Price Index, exchange rate, and industrial production index. |
| Duasa and Kassim (2009) | Panel analysis | Malaysia | 1991–2006 | Causality result: GDP → FPI. Regression result: Economic growth drives changes in FPI and its volatility, not the other way around. |
Table 2.
Definition of variables.
| Variables/Symbol | Definition | Expressed in |
|---|---|---|
| Gross Domestic Product (GDP) | The gross aggregate of all goods produced by residents, with sales taxes added and subsidies subtracted (Constant 2010). | USD |
| Foreign Direct Investment (FDI) | The net value of investments, including equity capital, reinvestment, other forms of long-term capital, and short-term capital, as shown in the balance of payments. | USD |
| Foreign Portfolio Investment (FPI) | Portfolio investments include equity and debt transactions. | USD |
Source: Author’s own summary based on data from World Bank Indicators, available on https://data.worldbank.org (accessed on 11 June 2022).
Table 3.
Descriptive statistics of the variables.
| GDP | FDI | FPI | |
|---|---|---|---|
| Mean | 11,892.14 | 12,832.71 | 3826.65 |
| Skewness | 2.401358 | 2.869135 | 3.092163 |
| Kurtosis | 7.544513 | 11.30705 | 14.82055 |
| Observations | 120 | 120 | 120 |
Source: Author’s own calculation using EVIEWS 12.
Table 4.
Cross dependency results.
| Test | Statistic | Prob. | Decision |
|---|---|---|---|
| Breusch–Pagan LM | 83.24470 | 0.0005 | Cross-sectional dependence |
| Pesaran scaled LM | 4.031346 | 0.0001 | Cross-sectional dependence |
| Pesaran | 1.396187 | 0.1627 | No cross-sectional dependence |
Source: Author’s own calculation using EVIEWS 12.
Table 5.
Panel unit root test results for FDI, FPI, and GDP.
| Variable | LLC | ADF | Fisher–PP | Stationarity | |||
|---|---|---|---|---|---|---|---|
| Statistic | Prob. | Statistic | Prob. | Statistic | Prob. | ||
| GDP | −4.23524 | 0.0000 * | 34.8405 | 0.0210 * | 34.5646 | 0.0225 * | Yes |
| FDI | −4.73696 | 0.0000 * | 46.8154 | 0.0006 * | 32.9874 | 0.0338 * | Yes |
| FPI | −2.53104 | 0.0057 * | 33.0321 | 0.0335 * | 54.0302 | 0.0001 * | Yes |
* denotes statistically at 5% significant level. The tests employ Akaike information criterion automatically as the lag length. Source: Author’s own calculation using EVIEWS 12.
Table 6.
Results of Pedroni residual cointegration testing.
| t-Statistic | Prob. | Weighted t-Statistic | Prob. | |
|---|---|---|---|---|
| Panel v-Statistic | −1.243595 | 0.8932 | −2.623041 | 0.9956 |
| Panel rho-Statistic | −0.322500 | 0.3735 | 1.622916 | 0.9477 |
| Panel PP-Statistic | −8.062853 | 0.0000 * | −6.110733 | 0.0000 * |
| Panel ADF-Statistic | −7.541982 | 0.0000 * | −5.429478 | 0.0000 * |
| Group rho-Statistic | 2.528469 | 0.9943 | ||
| Group PP-Statistic | −10.54840 | 0.0000 * | ||
| Group ADF-Statistic | −5.087689 | 0.0000 * |
* denotes statistically at 5% significant level. Source: Author’s own calculation using EVIEWS 12.
Table 7.
Pairwise Dumitrescu–Hurlin panel causality results.
| Null Hypothesis: | W-Stat. | Zbar-Stat. | Prob. | Causal Association | Decision |
|---|---|---|---|---|---|
| FDI does not homogeneously cause GDP (FDI → GDP) | 3.4630 | 2.6999 | 0.0069 | Yes | Bidirectional causality |
| GDP does not homogeneously cause FDI (GDP → FDI) | 3.4630 | 3.1786 | 0.0015 | Yes | |
| FPI does not homogeneously cause GDP (FPI → GDP) | 3.0860 | 2.2219 | 0.0263 | Yes | Unidirectional causality |
| GDP does not homogeneously cause FPI (GDP → FPI) | 1.3857 | 0.0663 | 0.9471 | No |
Source: Author’s own calculation using EVIEWS 12.
Table 8.
Results of FMOLS and DMOLS estimation. GDP is the dependent variable.
| Variable | FMOLS | DMOLS | ||||
|---|---|---|---|---|---|---|
| Coefficient | t-Statistic | Prob. | Coefficient | t-Statistic | Prob. | |
| FDI | 150,998 | 8.9396 | 0.0000 | 211,724.9 | 5.7462 | 0.0000 |
| FPI | −210,907.6 | −9.2474 | 0.0000 | −240,005.2 | −5.5540 | 0.0000 |
| R2 = 0.2650 Obs = 120 | R2 = 0.8394 Obs = 120 | |||||
Source: Author’s own calculation using EVIEWS 12.
Disclaimer/Publisher’s Note: The statements, opinions and data contained in all publications are solely those of the individual author(s) and contributor(s) and not of MDPI and/or the editor(s). MDPI and/or the editor(s) disclaim responsibility for any injury to people or property resulting from any ideas, methods, instructions or products referred to in the content. |
© 2023 by the author. Licensee MDPI, Basel, Switzerland. This article is an open access article distributed under the terms and conditions of the Creative Commons Attribution (CC BY) license (https://creativecommons.org/licenses/by/4.0/).
Share and Cite
MDPI and ACS Style
Sijabat, R. The Association between Foreign Investment and Gross Domestic Product in Ten ASEAN Countries. Economies 2023, 11, 188. https://doi.org/10.3390/economies11070188
AMA Style
Sijabat R. The Association between Foreign Investment and Gross Domestic Product in Ten ASEAN Countries. Economies. 2023; 11(7):188. https://doi.org/10.3390/economies11070188
Chicago/Turabian StyleSijabat, Rosdiana. 2023. "The Association between Foreign Investment and Gross Domestic Product in Ten ASEAN Countries" Economies 11, no. 7: 188. https://doi.org/10.3390/economies11070188
Note that from the first issue of 2016, this journal uses article numbers instead of page numbers. See further details here.