Review

Causes and Measures of Poverty, Inequality, and Social Exclusion: A Review

by
George E. Halkos
* and
Panagiotis-Stavros C. Aslanidis
Laboratory of Operations Research, Department of Economics, University of Thessaly, 28 Octobriou 78, 38333 Volos, Greece
*
Author to whom correspondence should be addressed.
Economies 2023, 11(4), 110; https://doi.org/10.3390/economies11040110
Submission received: 8 February 2023 / Revised: 28 March 2023 / Accepted: 30 March 2023 / Published: 4 April 2023
(This article belongs to the Section Economic Development)

Abstract

:
Prevailing measures on the topics of monetary and non-monetary poverty—as well as economic and carbon inequality—are being critically assessed under sustainable development goals (SDGs) with a worldwide perspective. On the one hand, the poverty headcount ratio and the indices poverty gap, poverty severity, and Watts are assessed as core poverty indices. On the other hand, important inequality measures such as the Gini index and the Palma ratio are evaluated in order to find their potentials for policymaking. Furthermore, social exclusion (with the extreme forms of aporophobia and homelessness) has detrimental ramifications on human wellbeing and disturbs public provision policies. Thus, poverty, inequality, and social exclusion are integral parts of SDGs (1, 6 and 10), emphasizing the multidisciplinary nature of the above issues. Additionally, intrinsic elements of Agenda 2030 and the measuring of poverty, inequality, and polarization would significantly improve integrated policy pathways in the national and international fora.

Graphical Abstract

1. Introduction

In a decent life, what really matters is access to nutritional rich food, safe drinking water, clean energy, proper education, satisfactory healthcare, and inclusive institutions. Poverty, inequalities, and social exclusion could create a hiatus between people and a decent life; hence, the monitoring of these phenomena is of utmost importance. In essence, which are the causes of poverty, inequality, and social exclusion?
In an era of inflation, climate change, and war, such ordeals take place overall and might also derail Agenda 2030 targets. Inflation destabilizes—energy and food—prices, spreading further inequality in modern societies (CSRI 2022; Ha et al. 2021). The World Bank warned that, on the eve of 2023, there were almost 700 million people under the status of extreme poverty, and this trend might reach a little below 600 million people by 2030 (WBG 2022b). Since the Brundtland report focused on the quote that ‘a world in which poverty is endemic will always be prone to ecological and other catastrophes’ (WCED 1987), poverty’s connections with climate change became visible and discernible. In addition, conflicts could further aggravate living standards and create more poverty and starvation (Goodhand 2003), for instance, the current warfare in Ukraine fundamentally affected wheat and corn prices (Artuc et al. 2022).
A paradox is also in action, that ‘nations become richer, but governments become poorer’, as the private sector tends to accumulate more and more wealth (Chancel et al. 2022). As shown in Figure 1, the top 10% richest of the population concentrates the lion’s share in income, wealth, and carbon emissions. Inequalities appear to have been reduced between countries, but within countries, the inequality standards have risen (Firebaugh 2009; UNDP 2022; OECD 2016). In parallel with this tendency, the accumulation of wealth by the private sector is also indirectly linked with the polarization phenomena, meaning that the middle class tends to be vanishing and moving either towards the bottom or towards the upper social classes.
On the matter of social exclusion, the most horrific situation is homelessness; homeless people have been characterized as ‘invisible citizens’, as they can fly below the radar of policymaking. Homelessness is related to psychological and health issues, but also, it is a core affair for the multidimensionality considerations of poverty measurement (Clifford et al. 2019; Hastings 2021; Harmon 2021). What could be more extreme that not having a last resort? Homelessness is the most extreme poverty characteristic, but it can also be accompanied by aporophobia. This term was defined about two decades ago: aporophobia expands the psychological problems to not only poor people, but also to non-poor people, as the non-poor people express a new phobia of impoverished and vulnerable people (Cortina 2022), such as the Roma and immigrants (Comim et al. 2020; Hellgren and Gabrielli 2021).
The present study delves into the interlinkages of poverty (Section 2.1) and inequality (Section 2.2), both of which hack people away from the middle classes (Section 2.3) and further burden the poorest, who live under the yoke of social exclusion (Section 2.4). The importance of SDGs related to poverty and inequality is evaluated in Section 2.5. A discussion on and the future directions of these current issues are presented in Section 3, and the main policy implications and conclusions are illustrated in Section 4. The novelty of the present study is the amalgamation of poverty, inequality, economic polarization, and social exclusion under the scope of the SDGs, as well as the provision of universally applicable policies that might alleviate the extent of the above phenomena.

2. Literature Review: Poverty, Inequality, and Social Exclusion

Different epochs do not necessarily mean different problems, but dilemmas under alternative interpretations. Poverty has been thoroughly examined; to exemplify, Sen (1976) distinguished two main dilemmas which were posed either on the conundrum of the identification of the poverty spectrum or the construction of an index to evaluate the poverty of citizens. Moreover, Zhou and Liu (2022) distinguished Sen’s contribution on poverty nomenclature in the ‘capability approach’, especially on the issue of what poverty really is: ‘a deprivation of basic necessities’, not only a matter of low income standards. In the same manner, Maslow’s ‘hierarchy of needs’ contains the basic necessities that a human being should fulfill (Maslow 1943). However, poverty can be a detrimental factor of rendering Maslow’s hierarchy improbable or unattainable.
On a similar basis, another concern was the concentration of wealth, or alternatively, the measurement of inequality as in Figure 2, which Lorenz (1905) tried to articulate through ‘‘two extremes’’: equality … and the ownership of all wealth by one individual on the other’. Figure 2 illustrates the wealth pyramid with the top 1.2% of world population to accrue over 1 million USD of wealth, more specifically: the top 1.2% can be further categorized into four groups in the focused area on the upper corner of the figure. The tip of the pyramid shows that, from the upper 1.2% of global population, there are 264 thousand people with over 50 million USD of wealth accumulation, whereas 54,124 thousand people have compiled personal wealth in the range from 1 to 5 million USD. Nevertheless, these two extremes seem to be related with two other core ideals, derived from the era of Enlightenment: the pursuits of ‘freedom and … equality’, as Boulding (1975), stated for their importance and apparent incompatibility.
However, why should anyone try to measure poverty or inequality for reasons other than the eradication of social exclusion? Social exclusion, introduced by Lenoir (1974) in his publication Les exclus (The Excluded), is composed of the ‘aged-people’, ‘the handicaps’, and the ‘inadaptés sociaux’1 (the socially unadapted). However, nowadays, social exclusion does not focus on these three categories alone, but has gained greater and wider significance. Furthermore, the novel nomenclature might avoid the use of ‘socially unadapted’; this might be less frequently found in contemporary agendas. The sum of the above dilemmas is incorporated into the ‘leaving no one behind’ (LNOB) idea (UNDP 2019; UNSDG 2022; WCED 1987). However, what is going on with aporophobia?
Aporophobia is a neologism derived from the Greek word ‘aporos’ (poor) and ‘phobia’ (fear), making the illustrative concept of the ‘rejection of the poor’. This term was first stated in 2000s by Adela Cortina and, in its whole meaning, makes the idea that:
‘It is the poor person, the “aporos”, who is an irritation, even to his own family. The poor relative is considered a source of shame it is best not to bring to light, while it is a pleasure to boast of a triumphant relation well situated in the academy, politics, art, or business. It is a phobia toward the poor that leads us to reject individuals, races, and ethnic groups that in general lack resources and that therefore cannot—or appear unable to—offer anything’.
The economic and social aspects of poverty can be found in Adam Smith’s Wealth of Nations, in which poverty was described as ‘the inability to purchase necessities required by nature or custom’ (Smith 1776). Several scientists refer to this specific term as the purely monetary-driven nature (absolute: the buying of necessities) and psychological aspect of ‘shame’ (relative: the buying of commodities), due to the inability to integrate to the common social life and adopt or follow local customs (Sen 1983; Davis and Sanchez-Martinez 2014; Cortina 2022).
Thus, poverty and inequality are two core primordial—social—pathogenies that push citizens into social exclusion with specific, lopsided consequences for the poorest people. How can these conundrums be measured in order to be easily dealt with? As Ravallion acknowledged, the ‘high inequality of outcomes or opportunities’ could hamper economic performance and the alleviation of poverty, but also, it could ‘foster social ills and excessive political influence of a rich elite’ (Ravallion 2018). The following sections are focused on the causes and measurements of these problems, in addition to the novel strategies of institutional bodies that strive to cope with them. To put it briefly, it is the shift from ‘conditional welfare for the few’ to ‘minimum rights for the many’, as Davis and Sanchez-Martinez (2014) referred to the proposal by Townsend (1979).

2.1. Poverty

Ravallion and Chen (1997) stated that a typical dual nexus is that when poverty rises, the average living standards plummet (Ravallion and Chen 1997). In addition, the same scientists stressed the phenomenon that the poorer a country is, the more demanding that the monitoring of the real poverty levels may prove to be, along with the possibility that the living standards may ameliorate—or not—in the years to come. The geography of poverty is a crucial scientific branch for examining and monitoring poverty. Two distinct parameters are the ‘place’ (urban or rural) and the ‘people’ dimensions of poverty, which can develop covert, multifaceted characteristics due to spatial heterogeneities (Zhou and Liu 2022).
WBG (2022a) recognizes that most countries have coped with poverty, but not necessarily with inequality, providing a further explanation that specifically the most populated countries have experienced ‘an increase in global extreme poverty of 71 million people’. The World Bank also developed its poverty and social impact analysis (PSIA) in order to evaluate the influence of policy reforms on impoverished people, such as consulting stakeholders and promoting public dialogue. A technical issue is the RAPID framework, which is composed of five policy directions. The RAPID framework emphasizes the guidelines that should be followed by governments: (i) reach every child and keep them in school, (ii) assess learning levels regularly, (iii) prioritize teaching the fundamentals, (iv) increase the efficiency of instruction, and (v) develop psychosocial health and well-being.
Broadly speaking, the most common debate on poverty is whether it should be evaluated in absolute or relative terms (Ravallion 1996; 2020; Davis and Sanchez-Martinez 2014). As mentioned before, on the one hand, absolute poverty reflects the inability to cope with the monetary aspects of life, and commonly, the poverty lines (in constant real values) are used as a measure. On the other hand, relative poverty refers to the socioeconomic status of a person regarding its fellow citizens, and it can be measured by finding 50% or 60% of the median (or mean) disposable income. The differences between the mean and median income in the European Union are illustrated in Figure 3, which shows the divergence between the country-members and potential causes of inequality, as well as a naive idea of the national poverty lines.
For instance, people on the verge of destitution do not cover their basic needs as in Maslow’s hierarchy, such as self-esteem and self-actualization, or even further, their needs for food, water, and warmth (Maslow 1943). The first elements refer to the relative poverty issues, while the second elements refer to the absolute poverty matters. A systematic review of generic and special needs children has shown that there are difficulties further imposed by poverty in low- and middle-income countries (Lygnegård et al. 2013). Typically, the feeling of ‘shame’ of Maslow’s and Sen’s approaches also share strong ethical issues with Adam Smith’s conceptualization.
Another categorization of poverty is due to the differences in the time period. Transitive (or ephemeral) poverty and persistent (or chronic) poverty can mean types of poverty regarding either the short-term or long-term period, or they can mean the capabilities that ought to be imposed by a state2 or region to deal with poverty (Carter and Barrett 2006; Goodhand 2003; Zhou and Liu 2022). The element of time can be a significant factor of chronic poverty in the shade of poverty traps (Haider et al. 2018). In parallel, what is the most detrimental effect of persistent poverty? It is the impact on children’s mentality that renders persistent poverty unfavorable, as the children might again encounter poverty in their later life years (Dickerson and Popli 2014). With this in mind, the measurement of poverty is beneficial in order to pave the way for pro-poor policies and practices.

2.1.1. Monetary Poverty

The monetary poverty lines are based on ‘a bundle of basic foods’ that cover specific calorific requirements, and these lines are imposed by either the World Bank or governments (Ravallion 2020). To exemplify this, since 2019, the poverty levels recorded by the World Bank have been measured based on the purchasing power parities (PPPs) of the year 2017, making it possible to compare the living standards between sovereign states. More specifically, the international poverty lines are USD 2.15 PPP, USD 3.65 PPP, and USD 6.85 PPP per day for extreme poverty for low-income, low-middle-income, and upper-middle-income countries, respectively (WBG 2022b).
Poverty ought to be approached via indicators that focus on four aspects: monetary expenditures on market goods, non-monetary expenditures on non-market goods, personal characteristics, and intra-household characteristics (Ravallion 1996; Bourguignon and Chakravarty 2019). Next, the ‘bundle of basic food’ requirements can be connected to Engel’s Law3, which denotes the relationship between food and expenditure. In more detail, it is the total expenditure on food requirements that diminishes as the total expenditure ascends, or, broadly speaking, if a society becomes richer, then food expenditure decreases, making space for expenditure on non-food goods (Ravallion 2020; Atkinson 2019a).
However, as Sen (1976) observed, when measuring poverty, there are two obstacles faced in the identification of poverty as percentage of the whole population (the making of a poverty line), in addition to the creation of an index that conglomerates the up-to-date information of the paupers (also known as the head-count ratio) (Bourguignon and Chakravarty 2019; Sen 1976; Bourguignon and Chakravarty 2003). The debate over an absolute or relative measure of poverty attempts to answer the question of whether a relatively poor person can also be absolutely poor. Sen (1983) found that it is of utmost importance that this puzzle is clarified.
The poverty lines imposed by the World Bank (USD 2.15 and USD 6.85) and the national headcount ratio (typically evaluated by a country’s statistical agency) are illustrated in Figure 4. This shows the percentage of people below the specific poverty lines; for instance, India has the highest levels among the BRICS4 in the years examined, based on World Bank’s poverty lines. More specifically, around the years 2010, 2015, and 2020, the Indian population that lived under the poverty line of USD 6.85 (2017 PPP) was 93%, 89%, and 84%, respectively. Apparently, there is a great reduction in poverty rates, but this reduction remains far from any desirable target of eradicating poverty.
Significant contributions have been made to poverty measurement with the indices of Sen (1976); the Sen–Shorrocks–Thon (SST) index of poverty intensity (Thon 1979; Shorrocks 1995; Xu 1998); the Foster–Greer–Thorbecke (FGT) index (Foster et al. 1984, 2010) which incorporated a poverty aversion parameter, and if this aversion takes some specific values, then FGT takes the form of other common poverty indicators; and the Hagenaars index (Hagenaars and van Praag 1985; INE 2007).
Four common indicators of poverty measurement—as in Table 1—are poverty headcount ratio (P0), poverty gap index (P1), poverty severity index (P2), and Watts index (W). Poverty (and also inequality) measures follow some axioms, the violation of which might render them improper for comparisons. One of the most important axioms is the Pigou–Dalton transfer axiom, which necessitates that by redistributing income among two individuals from different social statuses (from a rich to a poor), the measure should alter (Cowell 2000, 2009). The following measures are proper for measuring poverty according to the World Bank.
Firstly, the poverty headcount ratio can be depicted as the percentage of people below a poverty line divided by the total population; hence, its simplicity is beneficial. However, some disadvantages are that it does not evaluate the intensity of poverty, it cannot distinguish ‘how poor the poor are’, and it takes into account the number of people (as percentage of total population) and not the number of households (Haughton and Khandker 2009; WBG 2022b).
Secondly, the poverty gap (or ratio) refers to the section of the population that can be averagely found below the poverty line. It incorporates the poverty gap (Gi) as a notion in tandem with the level of poverty line. It also denotes that if a person is above the poverty line, meaning that they are not absolutely poor, they take the value 0. It is a valuable index as it can provide useful information for blueprinting pro-poor policies, in the way of answering to each poverty gap in order to eliminate this phenomenon (Haughton and Khandker 2009; WBG 2022b). Indeed, it denotes the percentage of the poverty line for a country, state, or region.
Thirdly, the poverty severity index (or, alternatively, the squared poverty gap index) takes into consideration the existence of unequal statuses between paupers. The poverty severity index can evaluate poor citizens according to their status, such as that, if they belong at the 20% of the poverty line, the index takes a weight of 20%, whereas if they belong at the 80% of the poverty line, the index takes a weight of 80%. Hence, the poorer the status of a person, the greater weight this will take in this poverty measure.
Last but not least, the Watts index depicts the average of the population regarding the proportionate poverty gaps, and was proposed by Harold W. Watts (Zheng 1993; WBG 2022b). The Watts index is evaluated through ‘the log of the ratio of poverty to income’. It has been suggested that the Watts index has advantages over the headcount poverty ratio and the poverty severity index as it covers the axioms of focus, monotonicity, and transfer5 (Ravallion and Chen 2001).
A case in point is Table 2, which shows the four aforementioned indices in some G20 countries as their percentage change from the years (around) 2010 to 2020. For instance, regarding the headcount poverty index, the greatest decline was recorded in China, from 13% to 0.14%, whereas the highest rise was in the United Kingdom, from 0.16% to 0.31%. However, in absolute terms, in 2020, the lowest level of poverty was in Russia, with 0.01% (based on the available data for the G20), while the highest was found in India, with 10.01% of population living in poverty.
Furthermore, in real numbers, the lowest poverty gaps were in Russia, France, and China; on the other hand, the greater values of poverty gaps were in Italy and India, with 1.02% and 1.84% accordingly. As a percentage change, again, the lowest standard of poverty gaps was illustrated in China, with –99.18%, and the greatest gap was in the UK, with a 108.48% rise. On the matter of poverty severity, it is Italy that had the greatest gap, with 0.91%. However, again, the UK had the greatest percentage of change, with a rise of 98.90%, followed by Australia and Italy, which showed rises of 38% and 14%, respectively.
The Watts index seems to measure the mean across the population of the proportionate poverty gaps, as stated before. In 2020, the Watts index in the US and Australia rose by about 177% and 117%, but plummeted by −93% and −99% in Russia and China, respectively.
Keeping these numbers in mind, the next section discusses another aspect of poverty, although not necessarily in absolute monetary terms, but by also taking into account other socio-economic factors and elements. These aspects of multidimensional poverty try to evaluate poverty under the scope of the critical changes imposed by pressing economic and environmental factors, for instance, energy poverty, health issues, and resilience to climate change.

2.1.2. Multidimensional Poverty

A one-dimensional concept has proved to be inadequate, as the multifaceted aspects of poverty were neglected until the beginning of the 21st century, when the multidimensionality of poverty was brought forward by Bourguignon and Chakravarty (2003), which incorporates both the monetary and non-monetary features of living standards. The first way of measuring multidimensional poverty was produced by Alkire and Foster (2011), who tried to approach poverty with several socioeconomic parameters. The ramifications of non-monetary poverty aspects were also focalized during the COVID–19 pandemic, as they are proving to be more difficult to manage than monetary dimensions (WBG 2022b). For example, Heuveline (2022) specified that the pandemic negatively affected global life expectancy in both developing and developed countries.
The first global multidimensional poverty index (MPI) was introduced in 2010 in the Human Development Report by the cooperation between the United Nations Development Programme (UNDP) and the Oxford Poverty and Human Development Initiative (OPHI) at the University of Oxford. The global MPI is composed of the multiplication of two parameters: the headcount ratio (or incidence of poverty) and the intensity of poverty. A person can be labelled as poor based on MPI if its ‘weighted deprivation score is equal or higher than the poverty cutoff of 33.33%’ (Alkire et al. 2022).
In 2022, the global MPI was altered slightly in its terminology and rendered into the novel moderate multidimensional poverty index (MMPI) (Alkire et al. 2022). In general, both global MPI and MMPI contain three general categories (education, health, and living standards) and ten deprivations that are centered on the household level (UNDP and OPHI 2020, 2022; Alkire et al. 2021; Oxford Poverty and Human Development Initiative 2018).
On the contrary, in 2018, the World Bank introduced the multidimensional poverty measure (MPM) (different to UNDP and OPHI global MPI); however, the MPM consists of nonmonetary and monetary elements (WBG 2018, 2020, 2022b). Table 3 juxtaposes the MPM and MMPI in order to clarify the differences between the two indicators proposed, on the one hand, by the World Bank, and on the other hand, by the UNDP and OPHI. This section is also explained in Section 2.5, as it is dedicated to the promotion of SDGs. SDGs create more equitable processes, ‘prioritizing interventions for the poorest of the poor’ through reduction in multidimensional poverty under the scope of the LNOB idea (UNDP and OPHI 2020; UNSDG 2022).

2.2. Inequality

What aspects does inequality affect? Has inequality increased or decreased? An illustrious issue was raised in the novel Human Development Report, based on Schäfer and Schwander (2019), as there is a separation between the top and bottom social classes, as the former is detached from political life due to privileges and the latter is defenseless and ‘disenfranchised in agency and voice’ (UNDP 2022). Cowell (2009) went further than the matter of inequality and stated that if inequality is monitored from a multidimensional perspective, then there is ambiguity in answering the above question.
In the book New Geography of Inequality, it is argued that between-countries inequalities seem to be alleviated, whereas within-country inequalities are widening (Firebaugh 2009). The World Bank, for instance, referred to this when discussing the impact of the COVID–19 pandemic as a driving force of global inequality, in particular regarding the within-countries social ills of inequality (WBG 2022b). To what extent, though, has this between-countries inequality decreased?
Underdeveloped markets, feeble state institutions, and fragile social institutions are all conditions which developing countries typically face (Berg and Ostry 2011; Birdsall 2007). However, which of these cause inequality? It is globalization that changed the game over the past three decades. Openness to external trade is followed by a parallel mobility of financial capital, and those who gain from this are the ‘emerging middle class’ (if middle class is divided into two subgroups), whereas the losers are the declining middle class and poor people (Ravallion 2018). The impact of globalization appears to be especially relevant when coping with poverty and inequality. There is one great potential: the poor might be strengthened by globalization through trade and international capital flows (Harrison 2006), only if integrated policies take place via investing in human capital, promoting the primary sector, and consolidating macroeconomic stability.

2.2.1. Types of Inequality

Among the most characteristic types of inequality are income, wealth, and status inequalities. Income and wealth inequalities show the most fundamental discrepancies in living standards within countries, with intertwined effects on the labor market (OECD 2016), while the central theme of Section 2.4 is social exclusion—the most marginal state of ‘status inequality’.
The pioneers of the understanding of these forms of inequalities are three scientists, according to the up-to-date world inequality report: Simon Kuznets, Anthony Atkinson, and Alan Harrison (Chancel et al. 2022); moreover, the impact of Thomas Piketty on the matter of inequality is worth mentioning.
In a debate about the intricacies of inequality, Lyubimov (2017) stated Kuznets’s and Piketty’s main conceptual differences: Kuznets6 declared that there is an inverted U-shaped curve between economic growth and income inequality, implying that the richer an economy becomes, the more equal it gets. In contrast, Lyubimov stated that Thomas Piketty suggested that inequality is maintained due to its longitudinal nature; hence, this persistent inequality could only be reversed by international control (Lyubimov 2017). Furthermore, Piketty (2014) put into question the effectiveness of inequality-driven policies on a state level (such as in the small countries in Europe), as the broader multinational level of coping with inequality is more effective (as in European Union, or in United States and China):
‘The nation-state is still the right level at which to modernize any number of social and fiscal policies and to develop new forms of governance and shared ownership intermediate between public and private ownership, which is one of the major challenges for the century ahead. But only regional political integration can lead to effective regulation of the globalized patrimonial capitalism of the twenty-first century’.
The International Monetary Fund (IMF) found four trends in inequality, in which, besides income and wealth inequalities, it further recognizes the lifetime inequality and inequality of opportunity (IMF 2014). The IMF defines lifetime inequality as the measuring of inequality not on the basis of one year but over an individual’s lifetime; in addition, the inequality of opportunity sheds light on the interconnections between income inequality and social mobility (possibly from an intergenerational perspective). Thus, the IMF recognizes the longitudinal elements of inequality in a socioeconomic agenda. Moreover, the inequality of opportunity has a greater specific matter as people criticize the opportunistic nature of inequalities on the basis of how and why others earn those incomes (Jenkins 2022). However, Marxist theory further criticizes some points of view of the aforementioned types of inequality.
Peet (1975) accentuated the Marxist theory that the inegalitarian social structures is an integral element of capitalism, both for poverty and inequality. For example, Marxist theory distinguishes two important categories—inter- and intragenerational inequalities—as forms of stagnating social (class) mobility. In parallel, the nexus of environmental and social resources is another debate, as ‘the individual’s struggle to earn income takes place in a certain physical, social, and economic environment’.
It is important to distinguish this important matter as these parameters of environment were incorporated in Barbier’s ‘sustainable economic development’ concept (Barbier 1987), in addition to the Brundtland report (WCED 1987) one decade prior to Peet’s publication. Sustainable development, however, capsulates eminent ideas with completely incongruous meanings of inequality and poverty: sustainability promotes inter- and intrageneration equity, meaning that inequality is an absolute social ill for a sustainable future. The notion of intergenerational equity was thoroughly examined by Rawls (1971). Furthermore, the importance of equity among people is not exclusively centered on socioeconomic issues, but also on environmental matters. In this way, the idea of carbon inequality has become crucial, as it combines the bottom line of sustainability with a more virtuous future. The sustainable development perspective of inequalities and poverty is thoroughly explained in Section 2.5.
Figure 5 shows that the bottom half7 of the global population had 8.4% and 2% of the income and wealth share, respectively, in 2021, meaning that only a petty share belongs to this humungous part of the world, whereas the top 1% had accumulated 19.30% and 38% of the income and wealth share by 2021, making the richest top 1% have triple the income of and fourteen times more wealth than the bottom half population (Chancel et al. 2022). The inequalities between the top 1% and bottom 50% are apparent and overt; however, there is one more inequality to consider: that of carbon. The carbon footprints8 of the bottom 50% are again lower, by about two-thirds of the share of the richest 1% in 2019, meaning that the richest share of the population not only accumulates more income and wealth, but also emits more greenhouse gases.

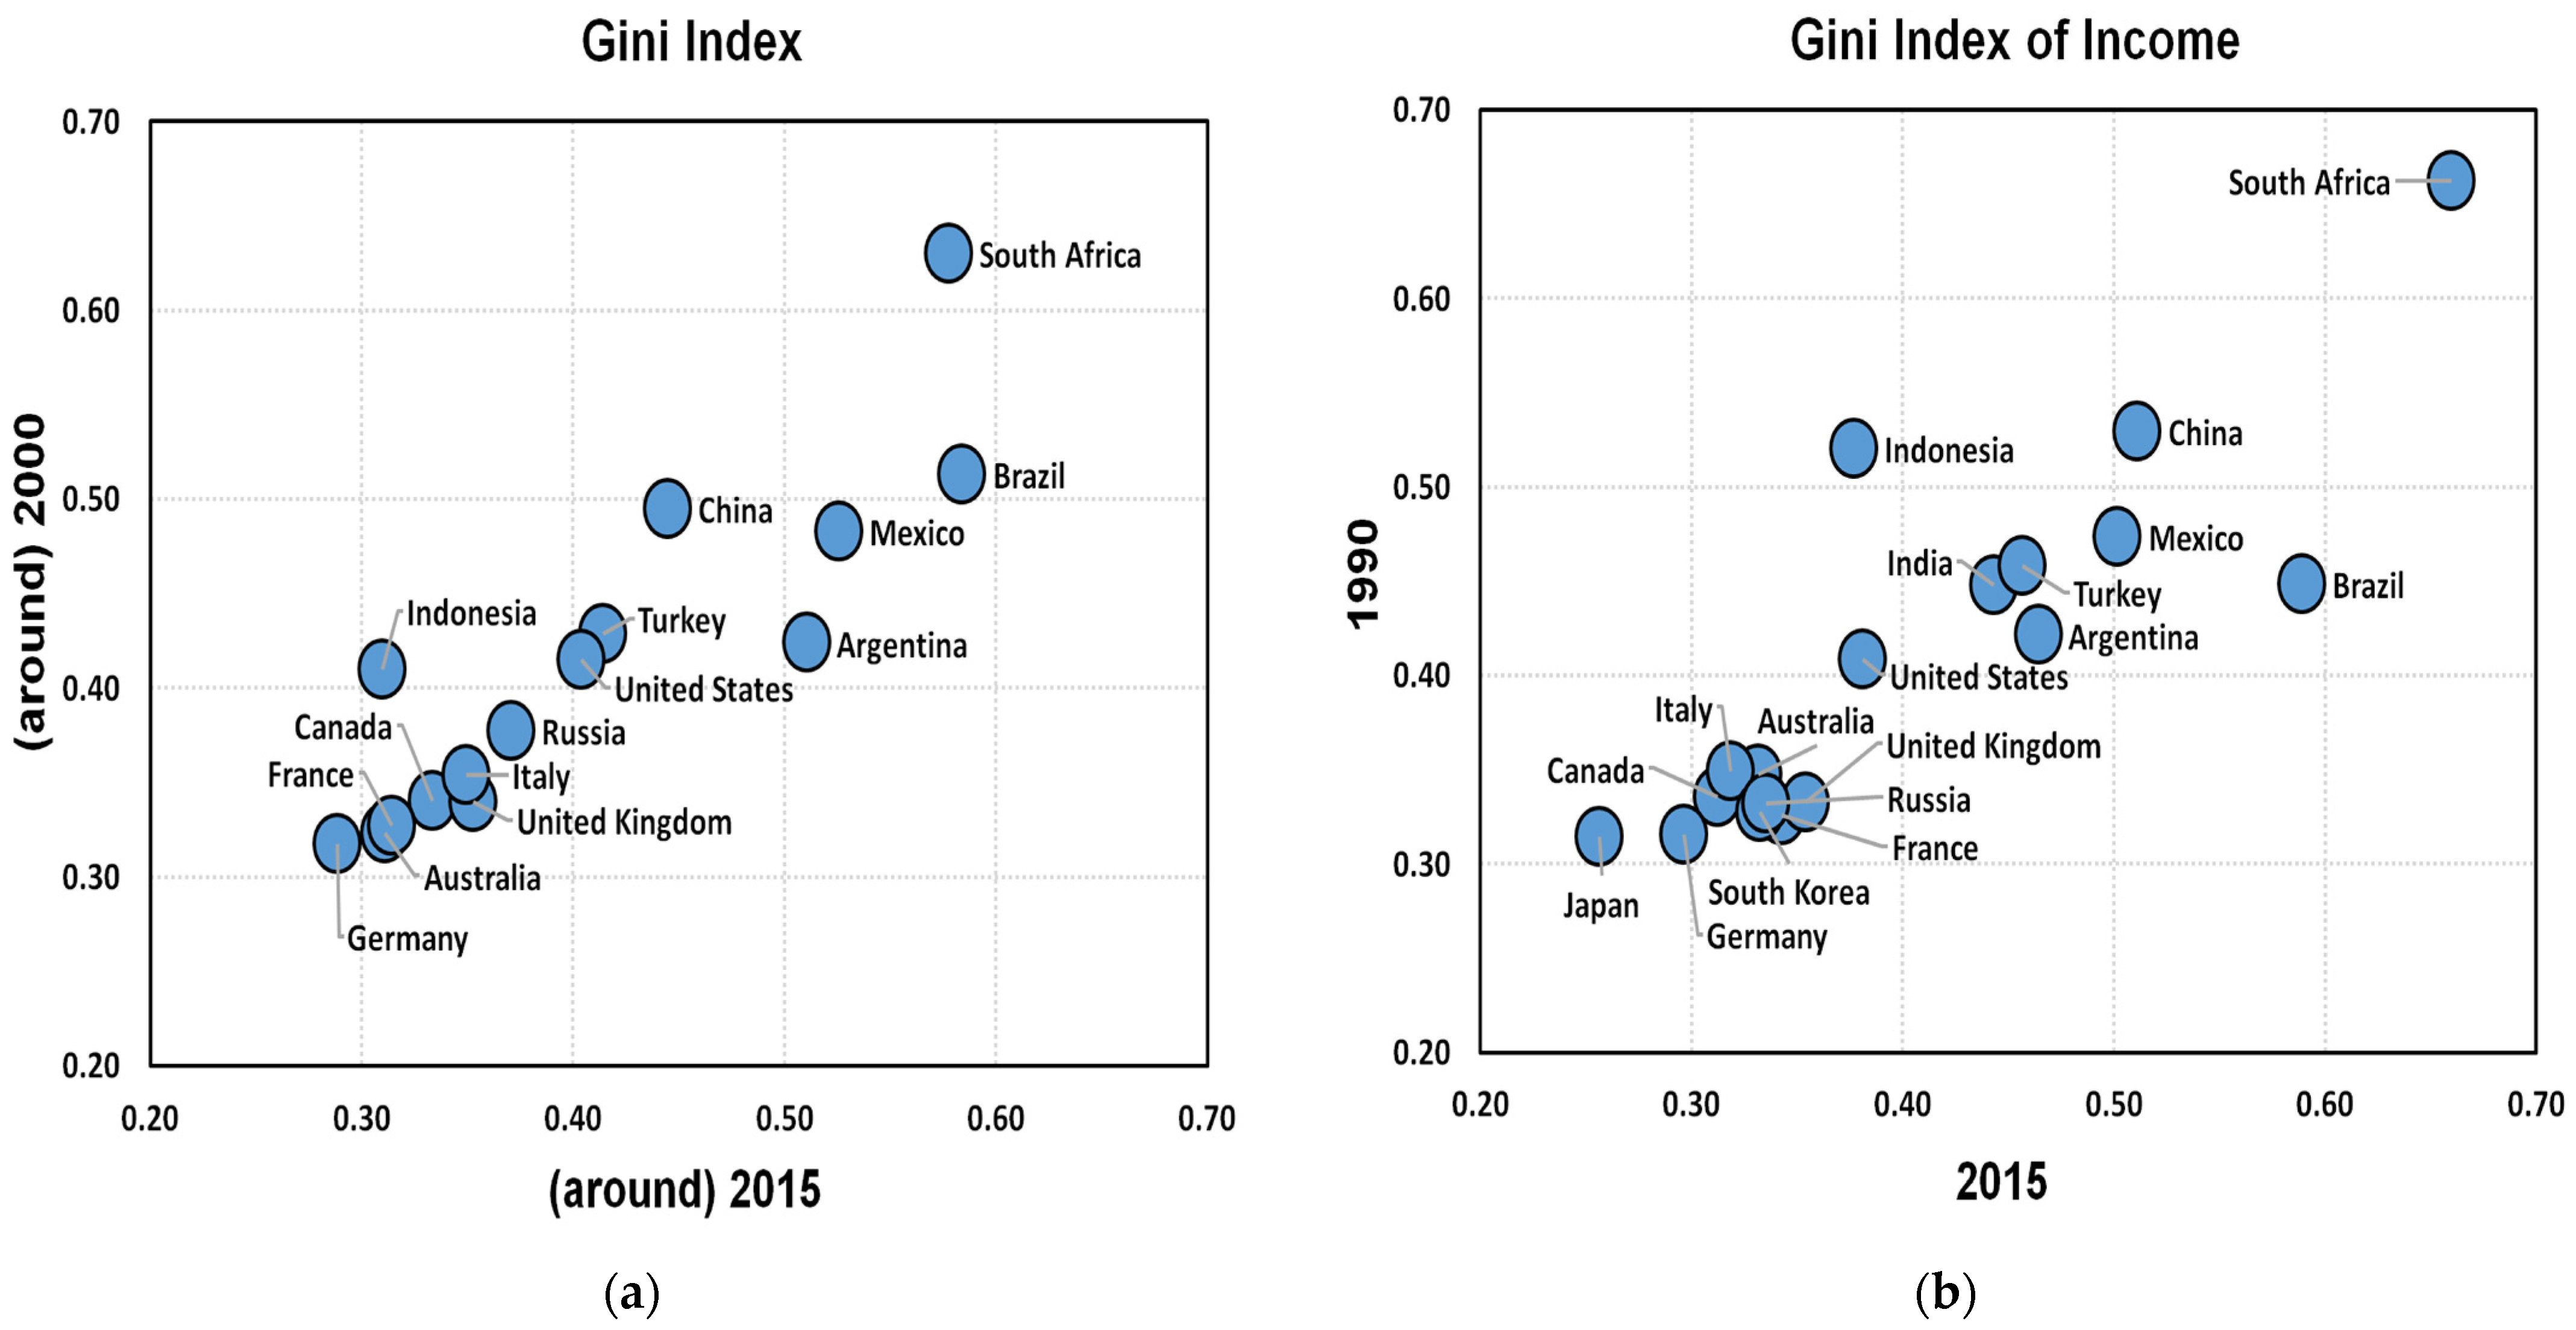
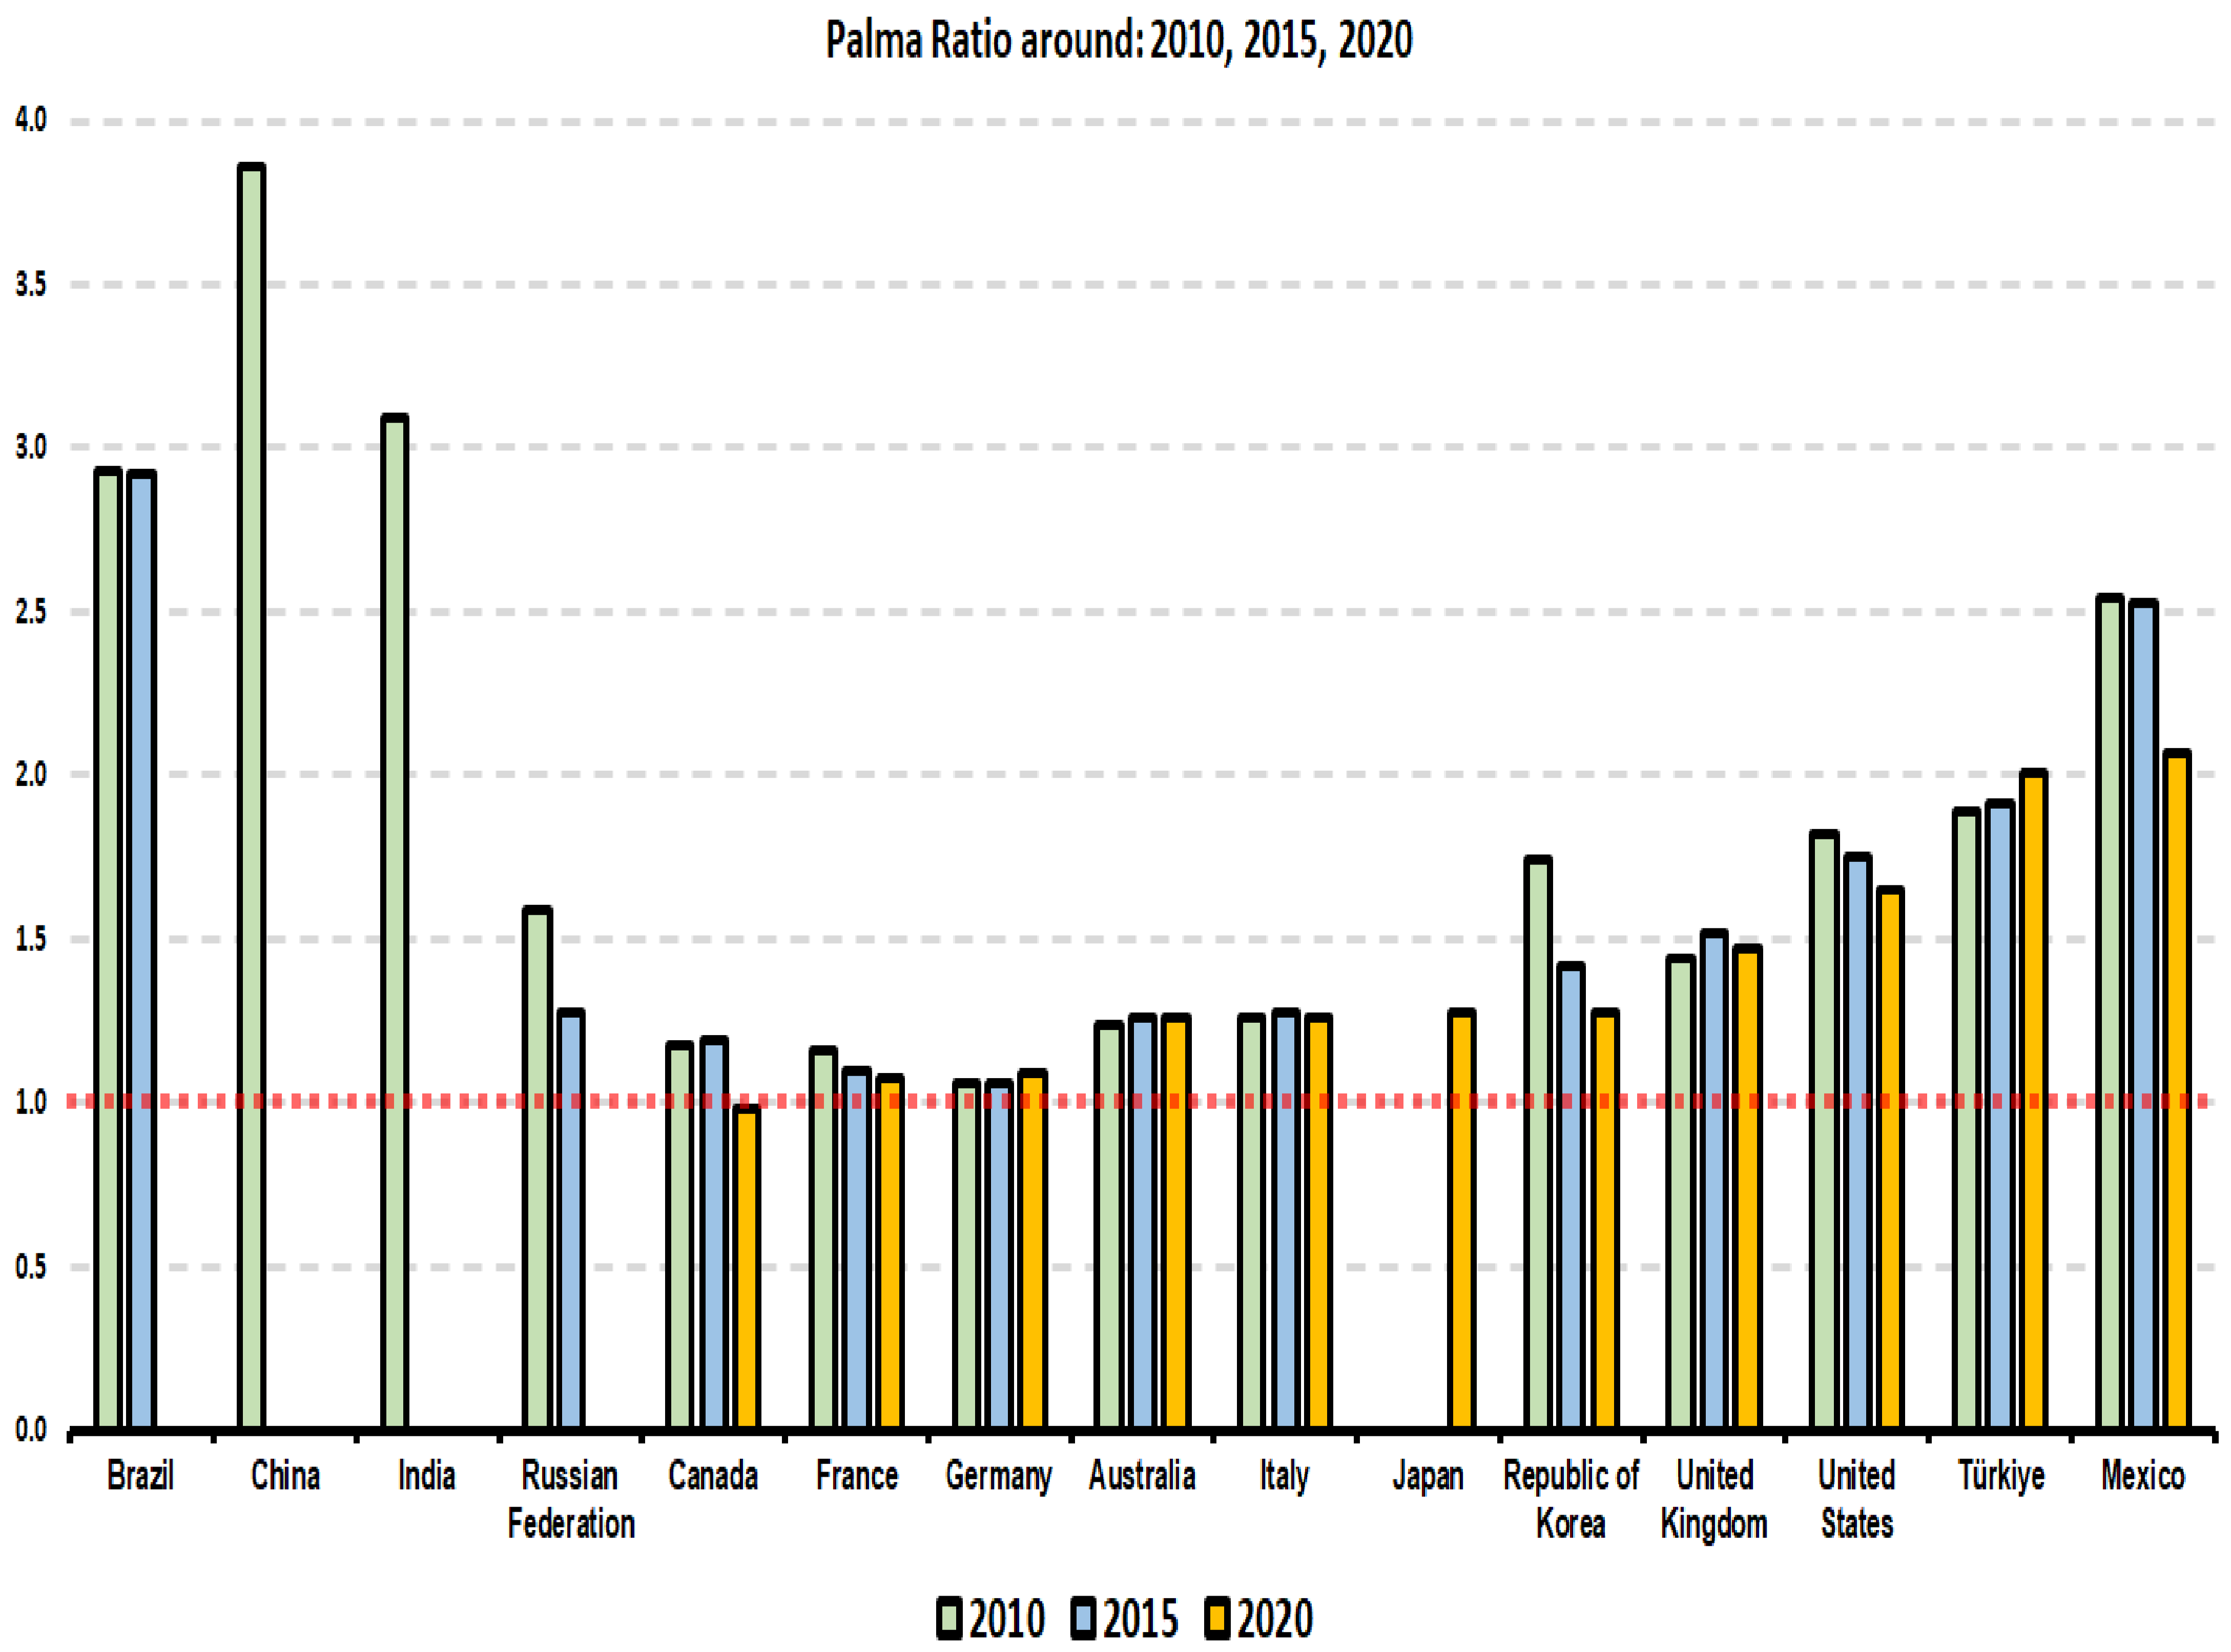
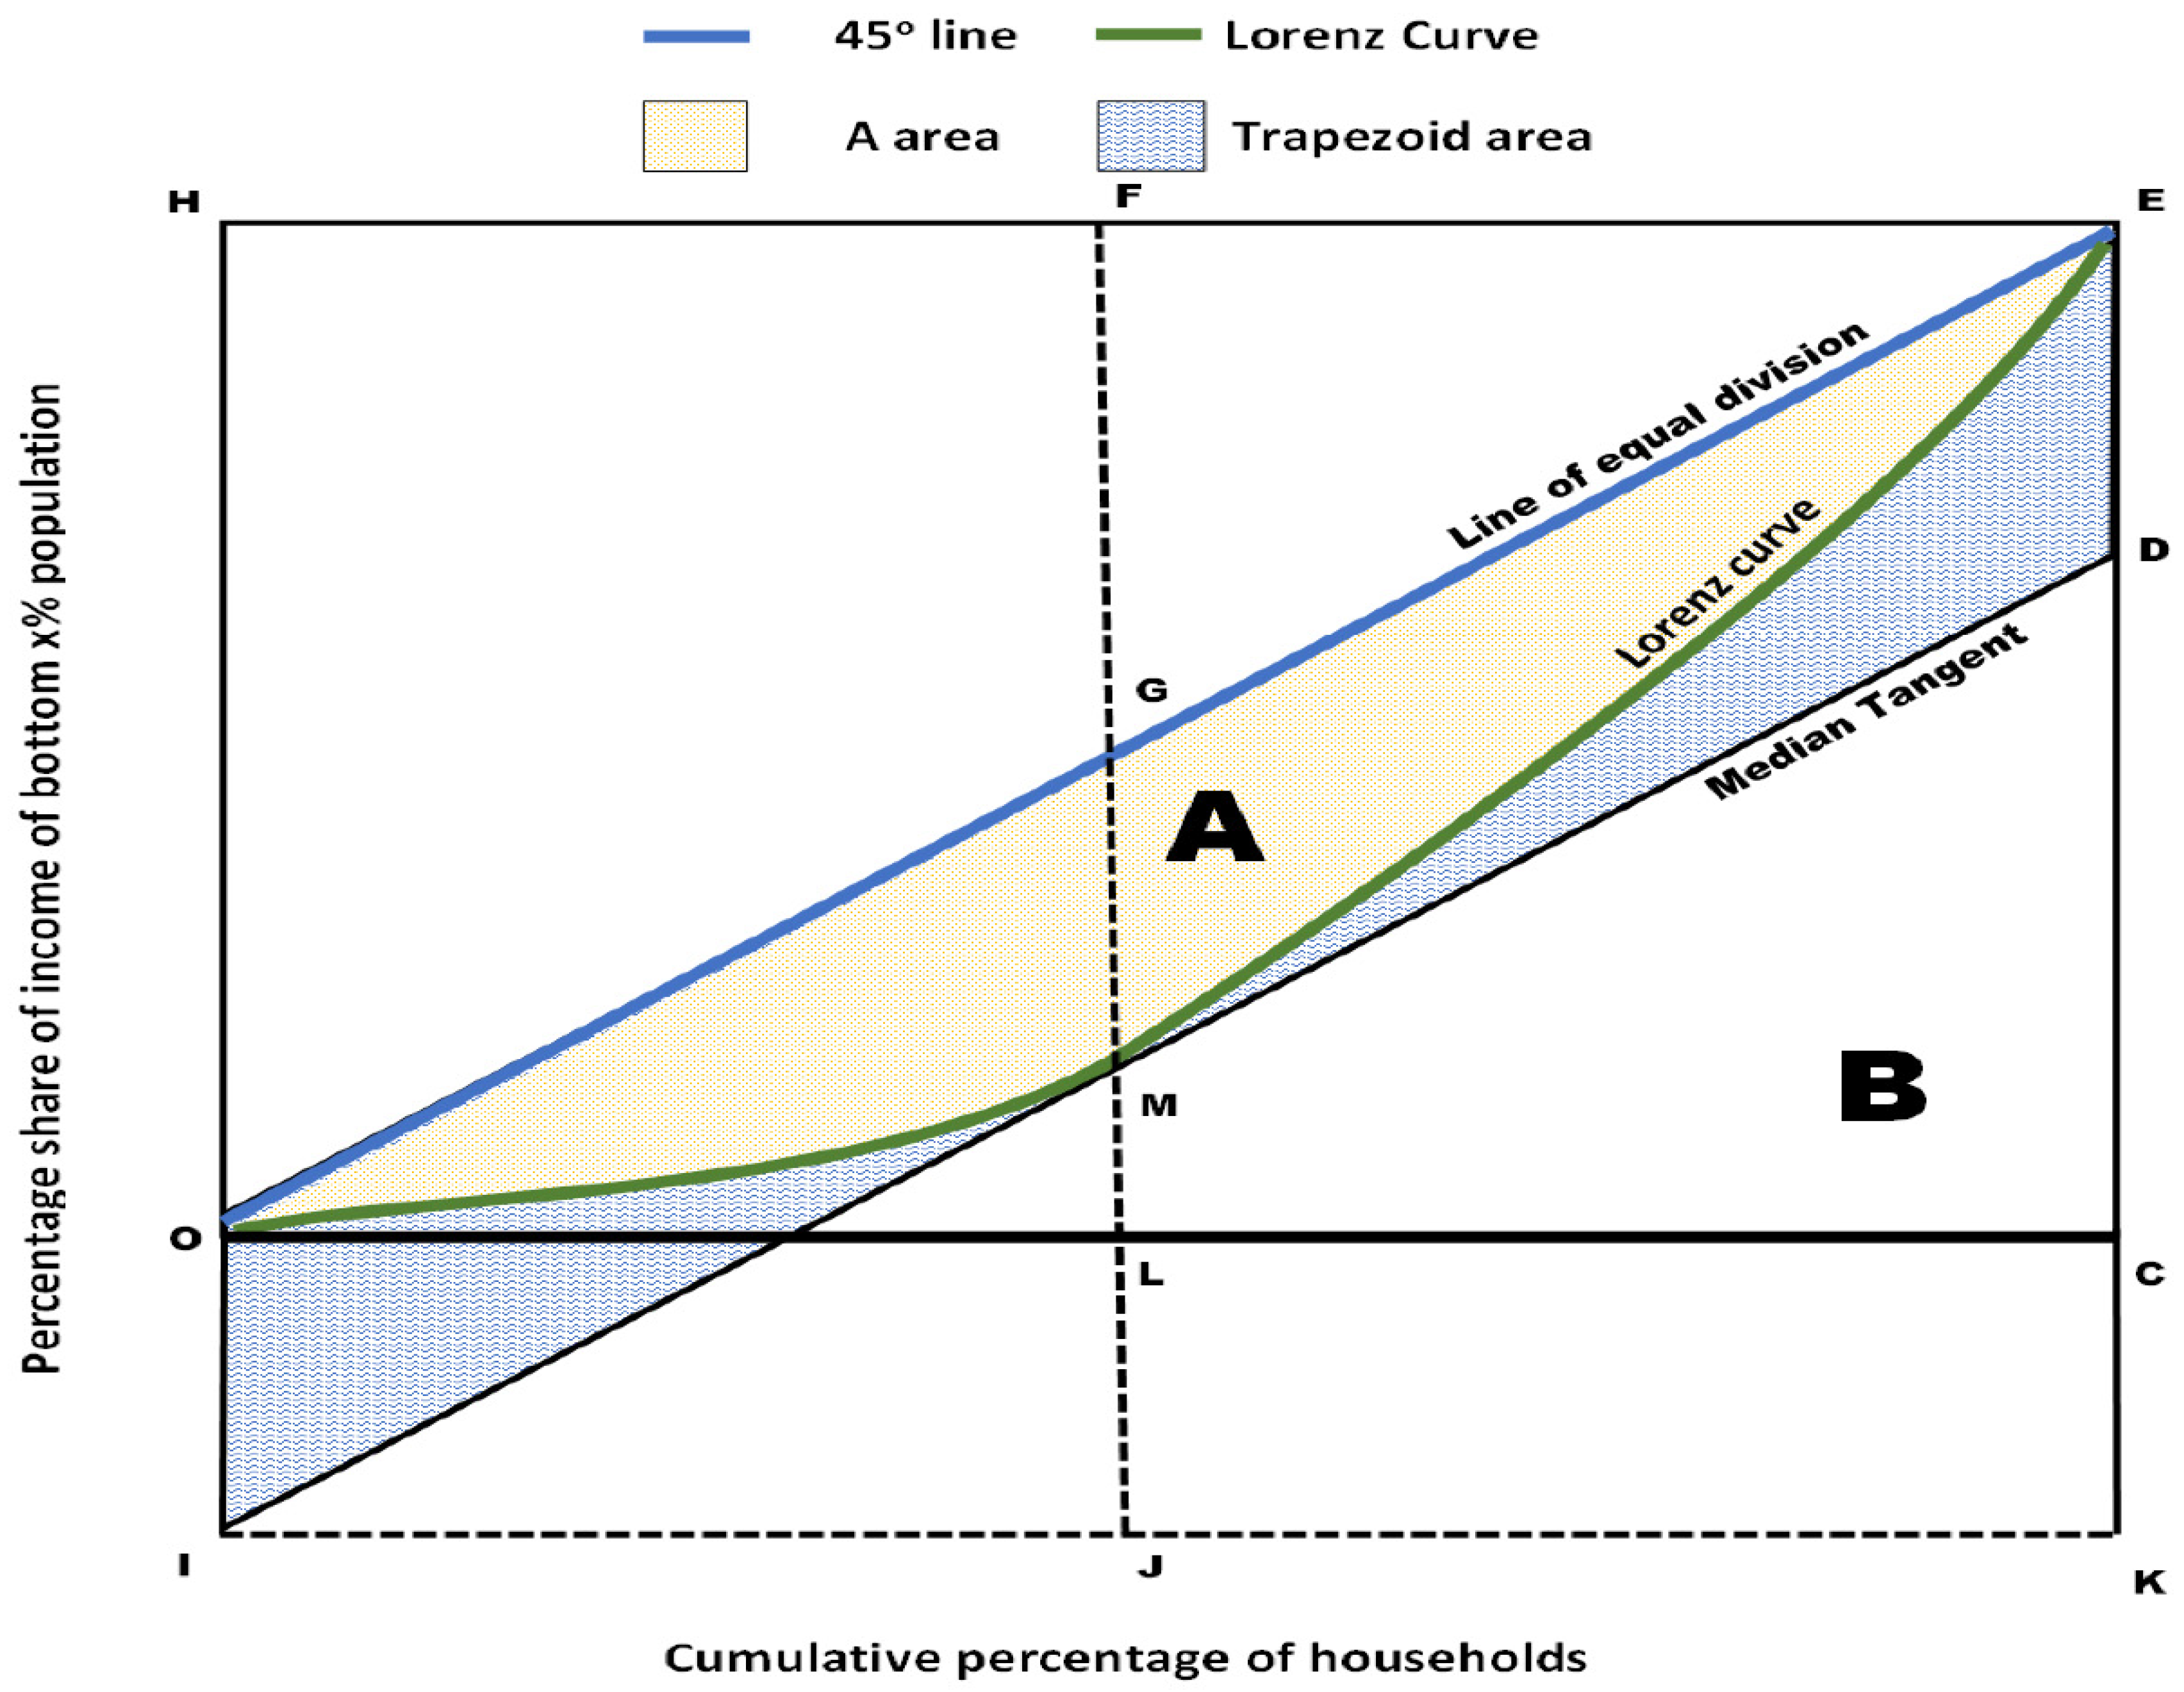
2.2.2. Measuring Inequality

The measurement of inequality should follow some axioms in order to have robust mathematical background and integrity. The important axioms are the Pigou–Dalton, or alternatively, the transfer principle, income scale independence, Dalton’s principle of population, decomposability, etc. (Donaldson and Weymark 1986; Cowell and Kuga 1981; Foster et al. 1984; Foster and Shorrocks 1991; Zheng 1993; Bourguignon and Fields 1997; Cowell 2000, 2009). However, there are also some other axioms referring to policy-based axioms for inequality measurement, such as the Atkinson axiom, the clarity axiom, and the vertical and horizontal indicators axioms (Cobham and Sumner 2013). Having these important axioms in mind, the following inequality measures are discussed.
The scientific literature provides a plethora of inequality measures; one of the most popular ways of measuring the inequality of the wealth distribution is through the Lorenz curve, which was developed in 1905 by Max Otto Lorenz9 (Cowell 2009, 2000). The Lorenz curve depicts that if it coincides with the line of total equality (45° line), there is total equality; on the contrary, if the curve is on the horizontal axis, then there is total inequality. Other measures consist of simple ratios among the deciles (or other stratification methods) of population and mathematical indices such as the Gini10, Robin Hood11, Atkinson, General Entropy (such as Theil), and—more recently—the Palma ratio (based on inter-decile ranges).
The Gini coefficient was introduced by the Italian statistician Corrado Gini (Cobham and Sumner 2013; OECD 2016; Ceriani and Verme 2012) and can be computed in Figure 6 as the ratio of two areas, firstly with the nominator as the area between the line of equality and Lorenz curve (symbolized as A), and secondly with denominator as the area below the line of equality (symbolized as A + B). It is characteristic that the tangent of the Lorenz curve at point J is of great importance as it provides information on the poor people if it is compared with the OD poverty (red dotted) line. In more detail, the relation of the area OJI to the area OKH denotes the ‘poverty measure’, in which OK reflects ‘the number of the poor’ (Sen 1976).
Moreover, the Robin Hood index, indicated as the grey dotted line, shows how much income should be distributed in order to attain perfect equality among people from the richer households (above the mean: point M in Figure 6) to the poorer households (UN 2015). Both indices take values in the range of zero (absolute equality) and unity (absolute inequality).
However, the Gini index has been criticized for several reasons. Atkinson’s critique on the Gini index was that it did not take into consideration the social welfare function (Atkinson 1969). Furthermore, the Gini index is not decomposable or additive, has lopsided sensitivity between transfers (either in the middle of the distribution or on the tails: it is middle-sensitive), and that it is possible to attain the same Gini index value by fundamentally different income distributions (UN 2015; Cowell 2009, 2000; Jenkins 2022; Cobham and Sumner 2013).
Most countries fall below extreme inequality in the Gini index, which is typically at the level of 0.5. Mexico, Brazil, and South Africa had inequalities of over 0.5 in both 2000 and 2015, as shown in Figure 7a, whereas in Figure 7b, between 1990 and 2015, Indonesia, China, Brazil, and, marginally, Mexico were above 0.5. Most importantly, South Africa had about 0.7 in the Gini index over these years, reaching the highest inequality among the G20.
Furthermore, there are also several ways to estimate inequality though ratios, which display the percentage above and below the defined ratio; for example, the most common ratios are S90/S10, S80/S20, S50/S10, and S40/S10 (which is the Palma ratio). The S90/S10 compares the average income of the top 10% to the bottom 10%.
The same also applies for the other ratios; however, the Palma ratio has some positive elements as it does not only compare the top 10% of the richest average income to the poorest bottom 40%; if one divides a distribution in ten equal shares, it takes its deciles, and Palma concluded that there are two contradictory driving forces on distributions.
On the one hand, there is a ‘centripetal’ driving force that creates something like equality on the deciles 5 to 9, while there is an opposite ‘centrifugal’ driving force that establishes inequality on the top decile compared with the four bottom deciles (Palma 2011, 2006). However, the Palma goes further as it can extricate itself from decile-minded stratification, as it can be decomposed in the bottom 40% and the middle 50% in order to make more robust comparisons with the Gini index possible (Cobham and Sumner 2013; Cobham et al. 2016).
The Palma ratio has as a rule of thumb that if it takes values below unity, then equality is more probable, while the values above unity seem to reach a more unequal status for the examined countries. For example, in Figure 8, regarding some G20 countries, there is equality in Canada, France, and Germany and slight inequality in Australia, Italy, Japan, Republic of Korea, and the UK. Furthermore, the USA, and Türkiye have moderate inequality among the bottom 40% and the top 10%, but the greatest inequality seems to be Mexico in 2020. Some other countries such as Brazil, China, India, and Russia illustrate some inequality, but on this specific graph, there is no comparison for the year 2020. Inequality is not only a matter of the tails in an income or wealth distribution; hence, the middle classes should also be monitored, and the core question is: is middle class disappearing?

2.3. Is the Middle Class Disappearing?

Harris (1939) criticized Karl Marx on the disappearance of the middle class12, as Marx explained in his Communist Manifesto that ‘the modern laborer … instead of rising with the progress of industry sinks deeper and deeper below the conditions of existence of his own class, he becomes a pauper (poor), and pauperism develops more rapidly than population and wealth’. Harris opposed the above statement on the basis that the banking sector creates opportunities for ‘men-without-wealth’ in the upper classes or even introduces novel ways of employment, and hence, it creates room for a greater middle class as the support of the upper classes. Thus, will the middle class disappear or persist through the redefining of work?
Social mobility does not necessarily adhere to a rule of moving solely upwards on the income/wealth ladder, but it can also go downwards. The evacuation of the middle classes towards the tails of the income/wealth distribution is called polarization (Wolfson 1994; Levy and Richard 1992), which is not identical to the term inequality, as it follows a different conceptual framework. Wolfson, in Figure 9, compares the notion of Lorenz–Gini with the polarization concept, even though this publication clarifies that the Pigou–Dalton axiom does not comply with polarization, as greater polarization means a smaller middle class. Hence, the proximity of the tangent of the median to the 45° line of equal distribution shows whether there is polarization or not, with greater distances denoting greater polarization. Alternatively, the blue-shaded area (trapezoid or IDEO area) covers a greater area if there is a disappearance of the middle class. Another important aspect was that alterations in average living standards were independent to shifts in inequality and polarization (Ravallion and Chen 1997), making the two concepts similar but not the same.
Against the selection of the mean, polarization takes into account the median individual income in order to create a ‘median-normalized “parade”13 at the 50th population percentile’ (Wolfson 1994). Typically, a highly spread-out distribution illustrates a feeble middle class and a greater curve, and vice versa. As Wolfson stated, the polarization curve in Figure 9 examines the disappearance of the middle class (or not), as the Lorenz curve monitors inequality. Ravallion and Chen emphasized that the Gini index’s middle stratum sensitivity lacks the ability to examine changes in income shares (Ravallion and Chen 1997), and thus, it is the polarization concept that offers a helping hand for policy reforms regarding this target population.
The scientific literature has given special attention to the polarization idea in terms of its interrelations with poverty and inequality studies, as polarization indices can be linked to Sen’s and Shorrocks’ poverty index (Rodríguez 2005). Moreover, the combined appearance and intensity of globalization, marketization, and rationalization played an important role in the hollowing of the middle classes, specifically, the hiatus in relations between workers and enterprises—in monetary terms—since 1980 in the USA (Lazonick 2015; Alichi et al. 2017). In accordance with the US, the middle population stratum became poorer in two-thirds of the EU in studies on the period of 2004–2014 (Derndorfer and Kranzinger 2021).
Bearing all these in mind, polarization ought to be emphasized, inter alia, in inequality studies and vice versa. Polarization has accentuated the incapabilities of inequality methodologies and can further promote poverty- and inequality-mitigating policy reforms. Hence, the strengthening of the middle classes might be a great impetus for SDGs and policymaking.

2.4. Social Exclusion: What Is Going on with Aporophobia?

As revealed earlier, ‘excluded’ people are typically older people and people with handicaps. Lenoir (1974) promoted the necessity of constructing a preventive social security net and posed—in an ironic way—the question of whether our society is truly developed and whether the system of protection is truly effective. Next, Sen (1983) also connected the aforementioned matters with his capabilities approach in a way to show that poverty is interconnected with ‘handicaps due to disability or age’.
Multidimensional poverty also covers the themes that Ravallion (2020) stated as two significant functions: on the one hand, the nutritional status of citizens, and on the other hand, their social inclusion. Notions such as shame (remembering Adam Smith’s contribution) and stigma have become further under the spotlight of social exclusion since the 1980s, when Townsend specified these social ills (Townsend 1979; Walker 2014). In tandem with these is the focus on the dynamic persistence of poverty in social exclusion due to its intrinsic characteristics that are not only a matter of material deprivation but also institutional facets (Davis and Sanchez-Martinez 2014; Atkinson 1969). In essence, poverty, income inequality, and social exclusion swell and surge status inequality.
Poverty, inequality, and social exclusion are subjects of great interest and importance regarding socio-economic agendas. Plenty of congresses, seminars, and meetings have been trying to find ways to cope with such complicated affairs, but how can all of this find common group? The eradication of homelessness is the answer to an otherwise appalling future, as there is no worse way to be than that of feeling poor, of being unequal with every other fellow human being, and—of course—to be socially estranged and excluded. Hence, by trying to deal with the three core social problems, homelessness might possibly be diminished.
In The Right to Exist, Harmon (2021) discussed the phenomenon of homelessness and its implications on an individual’s psychology, such as stigma and the ordeals of surviving in such difficult living situations. In addition, the causality between health and poverty has been crucially studied using holistic approaches (Clifford et al. 2019; Hastings 2021). Thus, the interconnection of multidimensional poverty with homelessness is, again, apparent and discernible, but on what basis does poverty and homelessness connect?
The eradication of poverty and social exclusion is, by no means, plain sailing, but it is also an imperative of the LNOB concept, as the UN Member States accepted the Agenda 2030 for ‘reaching the further behind first’ (UNSDG 2022; UN 2016). However, what do social exclusion and homelessness have in common? One could say that it is aporophobia that makes room for poverty persistence and the expansion of social exclusion.
Cortina (2022) shed light in an explanation of the meaning of aporophobia, as it does not explicitly focus on a person’s identity, but on a general group of poor people. Cortina also stated that more attention is needed to address the elitist attitude of non-poor people towards poor people, as an involuntary attitude but at the same time a morally unacceptable behavior (Cortina 2022). Aporophobia is, in essence, a matter of the social discrimination of the most impoverished and disadvantaged population groups, for example, migrants and Roma people (Hellgren and Gabrielli 2021). Comim et al. (2020) put aporophobia on a multidimensional framework with its micro (psychological), meso (institutional), and macro (inequality in great extents) dimensions. To put it briefly, the political agendas and economic institutions ought to share knowledge on the abatement of social exclusion to a greater global extent: here, SDGs is the answer.

2.5. The SDGs Overview

Based on Rawls’ social justice concept, inequalities loom either for different classes or as apparent in inter-community discrepancies (Rawls 1971). The eradication of poverty, as noted earlier, was the central theme of SDGs in all its forms and dimensions (UN 2016). Briefly, the core SDGs for poverty and inequality are SDGs 1, 2,3,4,6,7, 10, and 11 (UNDP and OPHI 2020; Dhahri and Omri 2020; Atkinson 2019b).
On the matter of eradicating poverty, the most important is SDG 1. For instance, the monetary features of (absolute) poverty could be found in SDG 1.1, in which a poverty line is introduced. Next, on the matter of multidimensionality, SDG 1.2 sets as a goal the halving of the population which is below the poverty line and the necessity of promoting social protection nets for these impoverished people (Antoniades et al. 2020). Meanwhile, SDG 1.3 puts more focus on socially excluded people such as vulnerable, unemployed, and disabled people.
Moreover, economic equity among people is raised in SDG 1.4, whereas environmental justice and protection are raised in SDG 1.5. However, not all of the notions of poverty or inequality are answered by SDG 1: reduction in inequalities is also answered in 10.3, for equal opportunities for anyone, in tandem with the SDG 1.4.
As SDG 1.1 focuses on absolute poverty, relative poverty is discussed by SDG 10.2.1, which focuses on the people who live in the lower 50% of the median income (Campagnolo and Davide 2019). Another significant debate is the matter of non-monetary poverty, which is raised in SDG 6.2.1, as it gives attention to sanitary living standards. Hence, SDG 6.2.1 can be co-examined with SDG 1.2 for multidimensionality reasons.
Ultimately, the SDGs are going to be judged at the end of the current decade, either positively or negatively. However, the SDGs offer a well-rounded socioeconomic framework, albeit with some defects in some respects, such as in the terminology of social exclusion. All in all, irrelevantly of the outcome by 2030, the SDGs have established a common understanding of poverty and inequality.

3. Discussion and Future Directions

Multifactor analysis is suitable for estimating either poverty or inequality in the modern scientific literature. One of the core problems is access to adequate nutritional food and clean energy. However, important phenomenon, according to the World Bank, is the augmentation of prices in the food and energy sectors due to the war in Ukraine (WBG 2022b; Ha et al. 2021). The still-raging war further ignited social inequalities and tumultuous price trends in food, especially in corn and wheat prices; thus, the war has created a vicious circle in poverty-laden countries (Artuc et al. 2022). Until the end of the war, its ramifications on poverty and inequalities will not be crystal clear.
Another issue is that the measuring of poverty or inequalities might be hampered by some computational or methodological obstacles. There is also debate over the choice between income or consumption surveys, as consumption surveys seem to incorporate the basic needs of a household better than income surveys (Jenkins 2022). The extreme standardization of data might also provide a false or—even worse— a deceiving image of the data (OECD 2016). There are also errors in the poverty-based samples from a limited number of units; another issue is that the utilization of equivalence scales on indicators is arbitrary because different households have different needs, and also, the preciseness of poverty indicators is a matter of discussion (Haughton and Khandker 2009).
Whether to measure income or consumption levels is a highly debated subject, but the scientific literature tends to accept the measurement of consumption levels as a better element due to the inclusion of households’ individual needs. Unequivocally, the debate over the incorporation—or not—of the monetary dimension is of great significance. Thus, common understanding is not the sole problem; finding a common methodology is also an issue.
A peculiar factor when measuring (multidimensional) poverty is the monetary facet of poverty: the World Bank takes into account monetary weights, whereas the OPHI and UN do not take into consideration a purely monetary dimension. There are, of course, advantages to measuring monetary aspects in multidimensional poverty, as there is conformity and transparency in the relative weights and some comparisons between the same data could be made. However, there are several reasons for not incorporating the monetary dimension into the analysis, such as (i) that the volatility of income or consumption makes the measurement difficult, (ii) the lack of harmonization between different surveys, (iii) the global MPI primarily observes policies indifferent to income poverty, (iv) the mixing of absolute and relative poverty lines might have negative impacts, (v) the risk of measuring something twice14, and most importantly, (vi) that it is still up for debate how monetary and non-monetary aspects can be equally weighted (UNECE 2017). Bearing these advantages and disadvantages in mind, the construction of poverty or inequality measures ought to be consistent, well-rounded, and fully explained regarding how and why which indicators (or dimensions) are computed. Afterwards, the notions of poverty, inequality, and polarization should be discussed.
The ‘lowering the ceiling’ idea gives even greater prominence to the dismantling of income or wealth polarization and also of barriers to education and social inclusion (Cowell 2009; Davis and Sanchez-Martinez 2014). However, Sen (1983) raised red flags on the matter of persisting poverty, as inescapable poverty captures only a part of the political agendas, which are typically biased due to lobby pressures to cover other political issues. Another decisive outlook is youth inactivity, as it negatively impacts youth social inclusion. Youth social mobility is at stake because many people are not employed or in education or training (NEET) (OECD 2016). Dealing with the lowering of the ceiling that hampers social mobility is undoubtedly intertwined with not only economic growth, but also with sustainable development. In parallel, the over-exploitation of natural resources in an unsustainable way might indirectly adversely affect poverty and inequality (Davis and Sanchez-Martinez 2014).
Regarding inequality measurement, there are several measures that provide interesting outcomes; however, it is the Gini index that is most commonly being implemented overall due to its simplicity. Critiques on why using the Gini index alone paved the way for a more recent measure—the Palma ratio—that gives more information about the inter-decile inequalities.
Human insecurity seems to construct interrelations with political extremism, enabling further polarization. The recent Human Development Report states that uncertainty has direct and indirect effects on polarization, either on a behavioral level (sense of belonging) or on an institutional basis (lack of trust on the political system and affiliation with extremist political waves) (UNDP 2022). These phenomena lead people to undemocratic attitudes and authoritarian leaderships. What is the role of institutions? Apparently, the democratic and inclusive institutions offer opportunities, while the authoritarian or exclusive institutions create disincentives and barriers to social mobility (Acemoglu and Robinson 2013). At the same time, the priorities of SDGs, as noted earlier, are centered on ‘the poorest of the poor’ (UNDP and OPHI 2020; UNSDG 2022). Hence, inequalities and poverty can be alleviated under inclusive institutions.
Earlier, it was noted that polarization is important (Wolfson 1994), but does it not connect with political polarization? As Marx stated regarding the extinction of the middle classes, it is the economic system that pushes people the lower social ladder, so the contemporary people of Marx were only capable of buying the commodities which were produced by themselves, the lower classes. It is a matter of great discussion of to what extent this situation has changed since.
The term polarization is also in tandem with inequalities; polarization can provide necessary information on the middle classes of income or wealth distribution. Hence, polarization analysis ought to be a complementary methodology in inequalities’ theoretical armamentarium.
Last but not least, homelessness and aporophobia are subjects that ought to be more in the spotlight of the scientific agenda as they comprise the most extreme forms of social exclusion. The recent scientific literature, the past two decades, has brought aporophobia into prominence (Cortina 2022). In essence, these two phenomena, if not monitored properly, might aggravate social insecurity and promote political polarization. Specifically, globalization creates winners and losers; among the greatest losers from this seem to be the poor workers in import-competing sectors (Harrison 2006).
Bearing these in mind, it is apparent that multidimensionality in poverty and inequalities is an issue of better understanding the SDGs and vice versa. The SDGs could be a helping hand in dealing with poverty and inequalities, as the sub-targets of SDGs embody great potential in eradicating these phenomena.

4. Policy Implications and Conclusions

The present times can be described as an era of inflation, energy crisis, pandemic, and war. These driving forces delay, postpone, and even disrupt pathways towards sustainability. However, political will seems to have achieved a greater percentage of people who have access to basic utilities, in contrast to the 20th century. In essence, the coverage of needs, as stated by Maslow, is in peril due to poverty, inequality, economic polarization, and social exclusion.
Poverty—either in its absoluteness (referred to a minimum living standard) or in its relativeness, in the sense of a person having less than their co-citizens, or even in the subjectivity of the term, in the sense of owning less than an optimal set of personal achievements—can be detrimental to an individual’s psychology. This feeling can be totally connected to inequality sentiments in terms of social, economic, and environmental aspects. The inequalities between countries are declining, but on the other hand, the inequalities within countries are increasing. However, in total, the smallest slices of the income and wealth accumulation and carbon emissions pie can be attributed to the poorest population.
Moreover, while multidimensional poverty measures appear to gain importance in the international political arena (such as the UN) and economic institutions (such as the World Bank), a unique measure has not yet been constructed by these institutions. SDGs 1, 6, and 10 paved the way in a very promising way, as they aligned policies on poverty, inequalities, and social exclusion. In addition, SDGs 2, 3, 4, 7, and 11 are used in complementary use with the aforementioned goals. Undoubtedly, the SDGs have constructed a common understanding of poverty, but more action should be taken in order to effectively cover the targets of Agenda 2030.
There are various policy implications that ought to be covered:
  • In order to diminish social exclusion and aporophobia, further utilization of poverty and inequality indices for the most needed target groups is necessary.
  • Discrepancies between indicators provided by institutions (i.e., the World Bank and the UN) ought to be adjusted in order to have a unique poverty indicator.
  • More focus on how to cover Maslow’s hierarchy of needs should be given from governments and international institutions, as it provides a framework for basic needs necessary for a decent life and is in tandem with the proposed indices of World Bank and the UN.
  • The diversification of the SDGs not only in their targets, but also in their sub-targets, ought to be conducted.
  • There is not a common rule on the acceptance and implementation of a specific poverty or inequality index: the application of two or more indices and their comparison might lead to better interpretation of the extent and depth of poverty or inequalities.
  • It is also suggested that inequality measures should be further compared with polarization, as the former measures focus on the tails of a population distribution and the latter polarization index delves into the disappearance of the middle class.
Above all, poverty, inequalities, and social exclusion are tightly interconnected and intertwined. It is the persistence of these phenomena that put the intra- and inter-generational perspective into debate. It can also be concluded that poverty eradication is, nowadays, in action: international fora, scientific community, and common people are participating in dynamic cooperation to drive political will and voluntary actions forwards. In short, it is a matter of a decent life with opportunities and rights both in households (i.e., access to nutritious food, safe water, and clean energy) and in society (i.e., access to education, health, and inclusive institutions).

Author Contributions

Conceptualization, G.E.H. and P.-S.C.A.; validation, G.E.H. and P.-S.C.A.; data curation, G.E.H. and P.-S.C.A.; writing—original draft preparation, G.E.H. and P.-S.C.A.; writing—review and editing, G.E.H. and P.-S.C.A.; visualization, G.E.H. and P.-S.C.A.; supervision, G.E.H. and P.-S.C.A. All authors have read and agreed to the published version of the manuscript.

Funding

This research received no external funding.

Informed Consent Statement

Not applicable.

Data Availability Statement

The utilized data were retrieved from: (Chancel 2022; Chancel et al. 2022; OWID 2023; Eurostat 2022; WBG 2022a; OECD 2022).

Conflicts of Interest

The authors declare no conflict of interest.

Notes

1
Lenoir expressed some categories of the socially excluded as: the adolescents in difficulty, the alone-parents that could not accommodate family’s needs, the isolated, victims of suicides, the drug users, and the alcoholics (Lenoir 1974).
2
Goodhand (2003) discussed the interlinkages of poverty with protracted conflict such as war.
3
Or food Engel curve honoris causa the German statistician Ernst Engel (Atkinson 2019a).
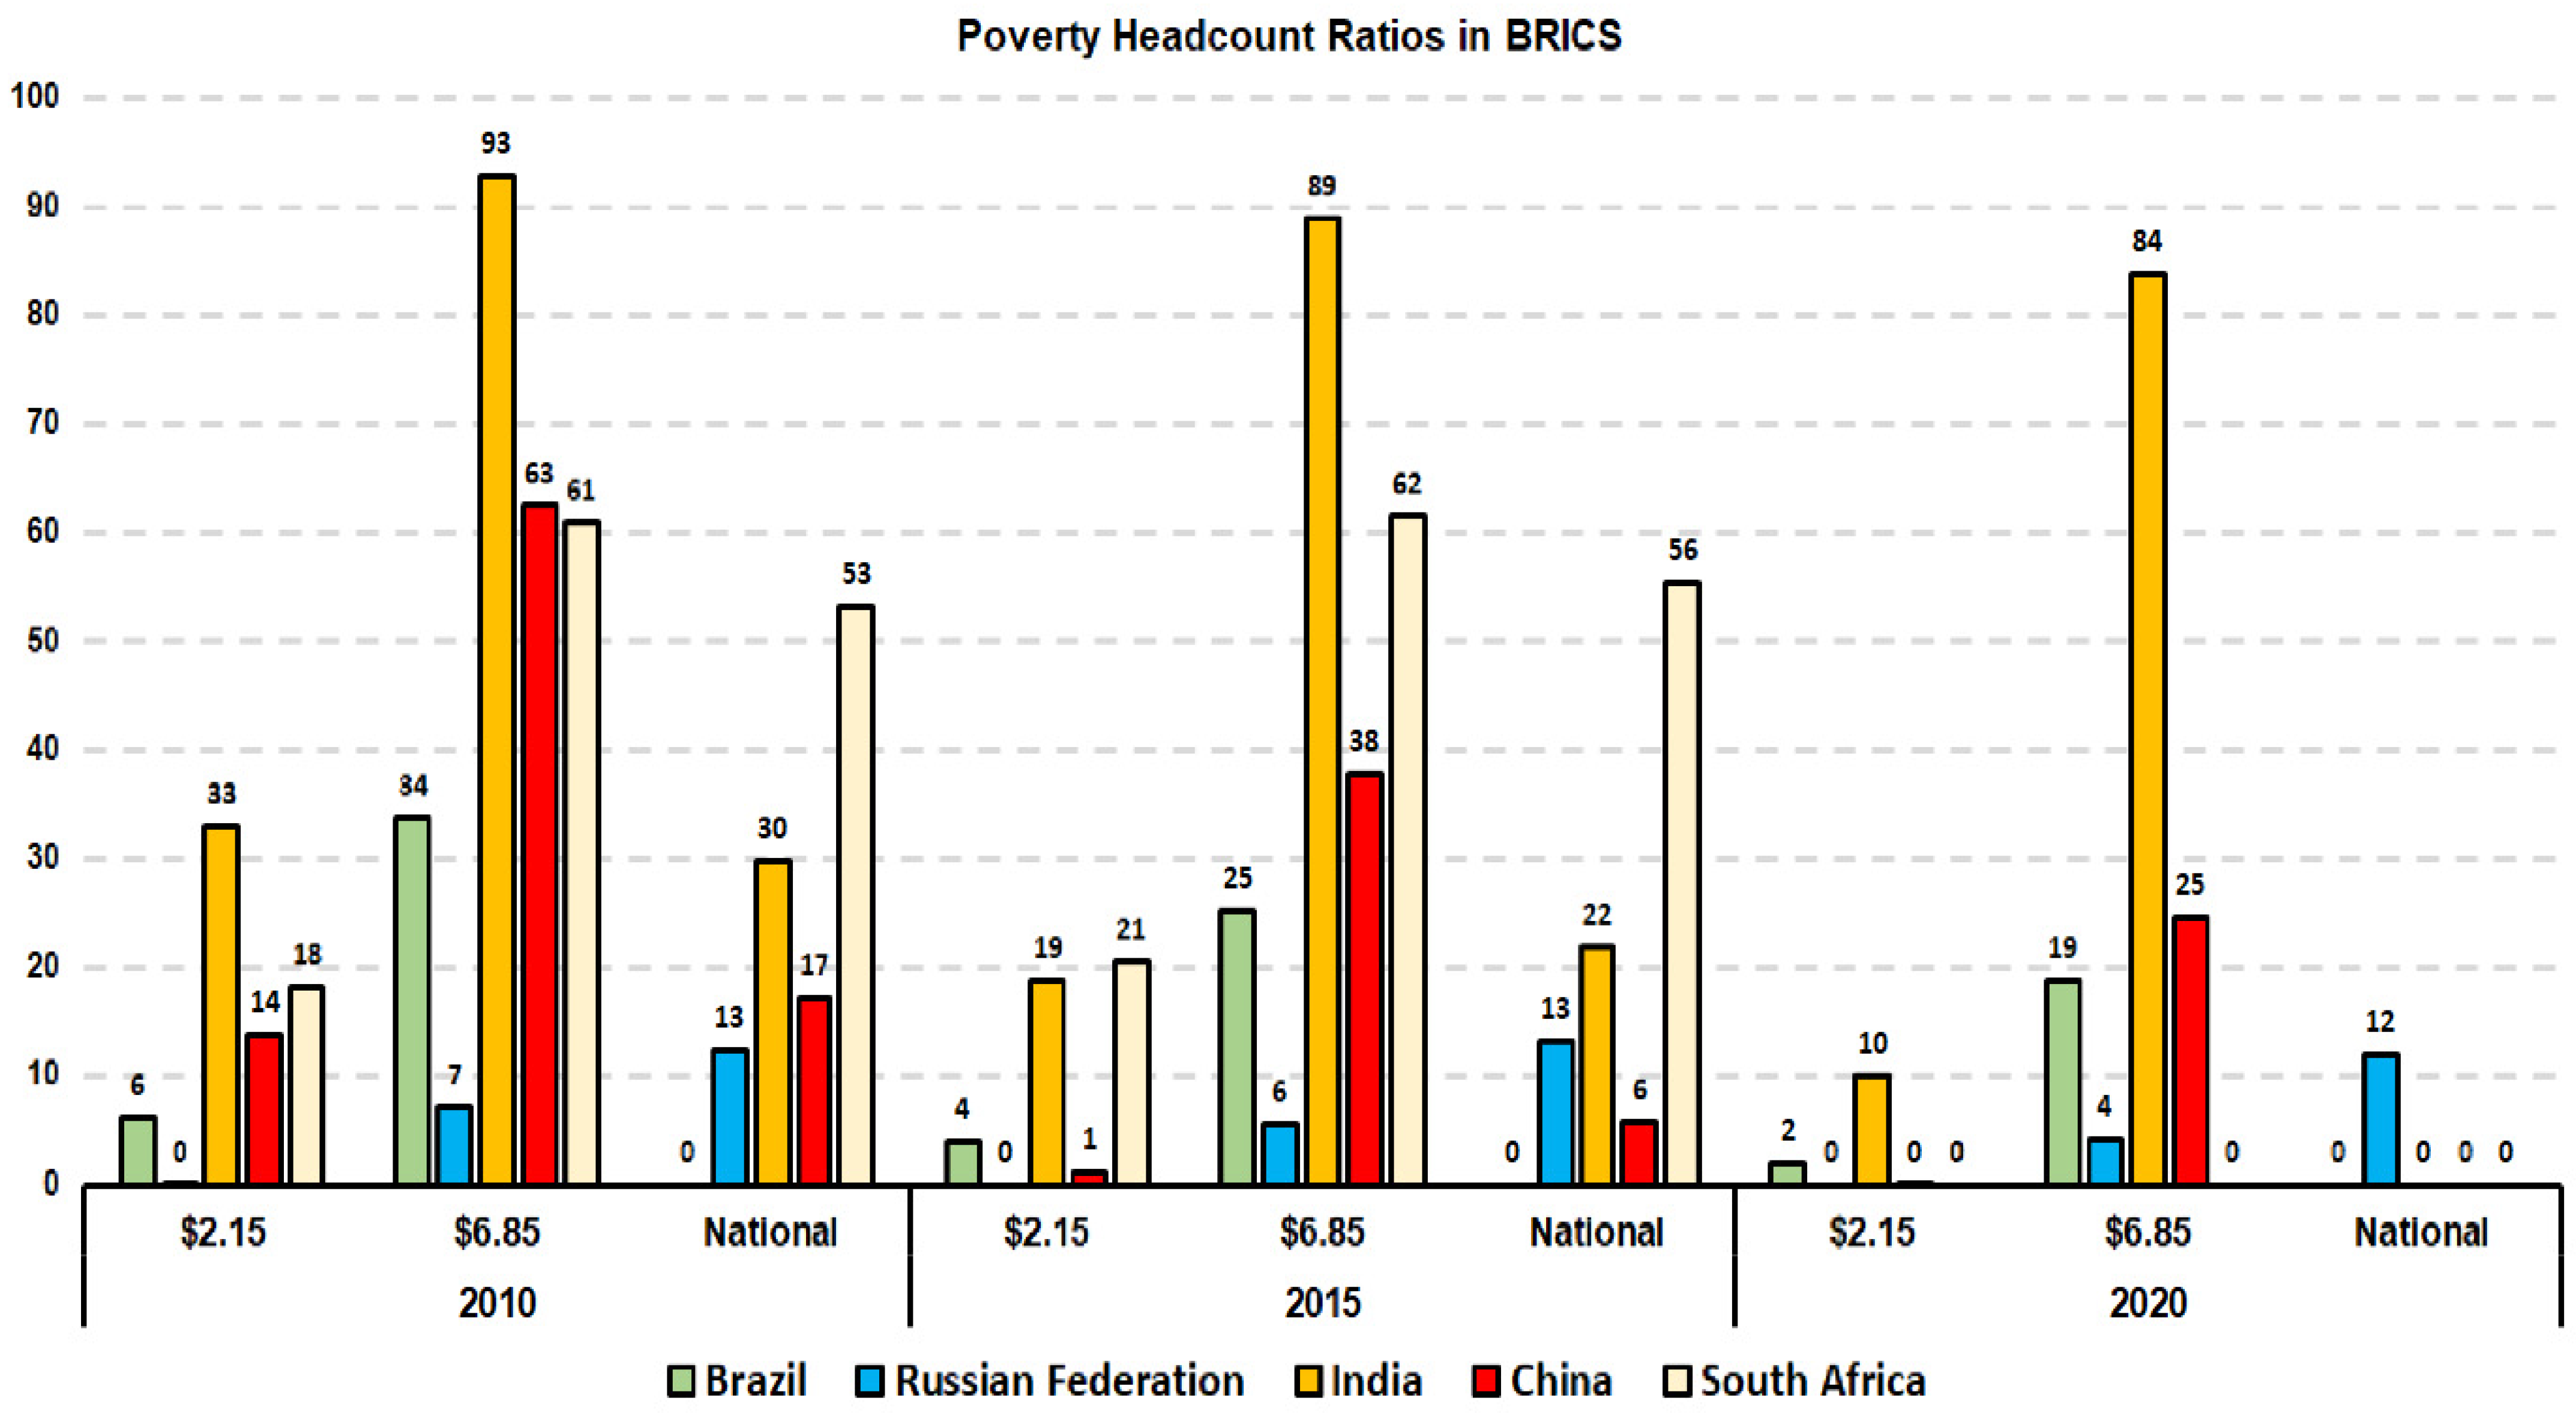
4
The countries: Brazil, Russian Federation, India, China, and South Africa.
5
For more details about the axioms on poverty measures, please see Zheng (1993); Bourguignon and Chakravarty (2003); Ravallion and Chen (2001).
6
For more information, please see (Kuznets 1955).
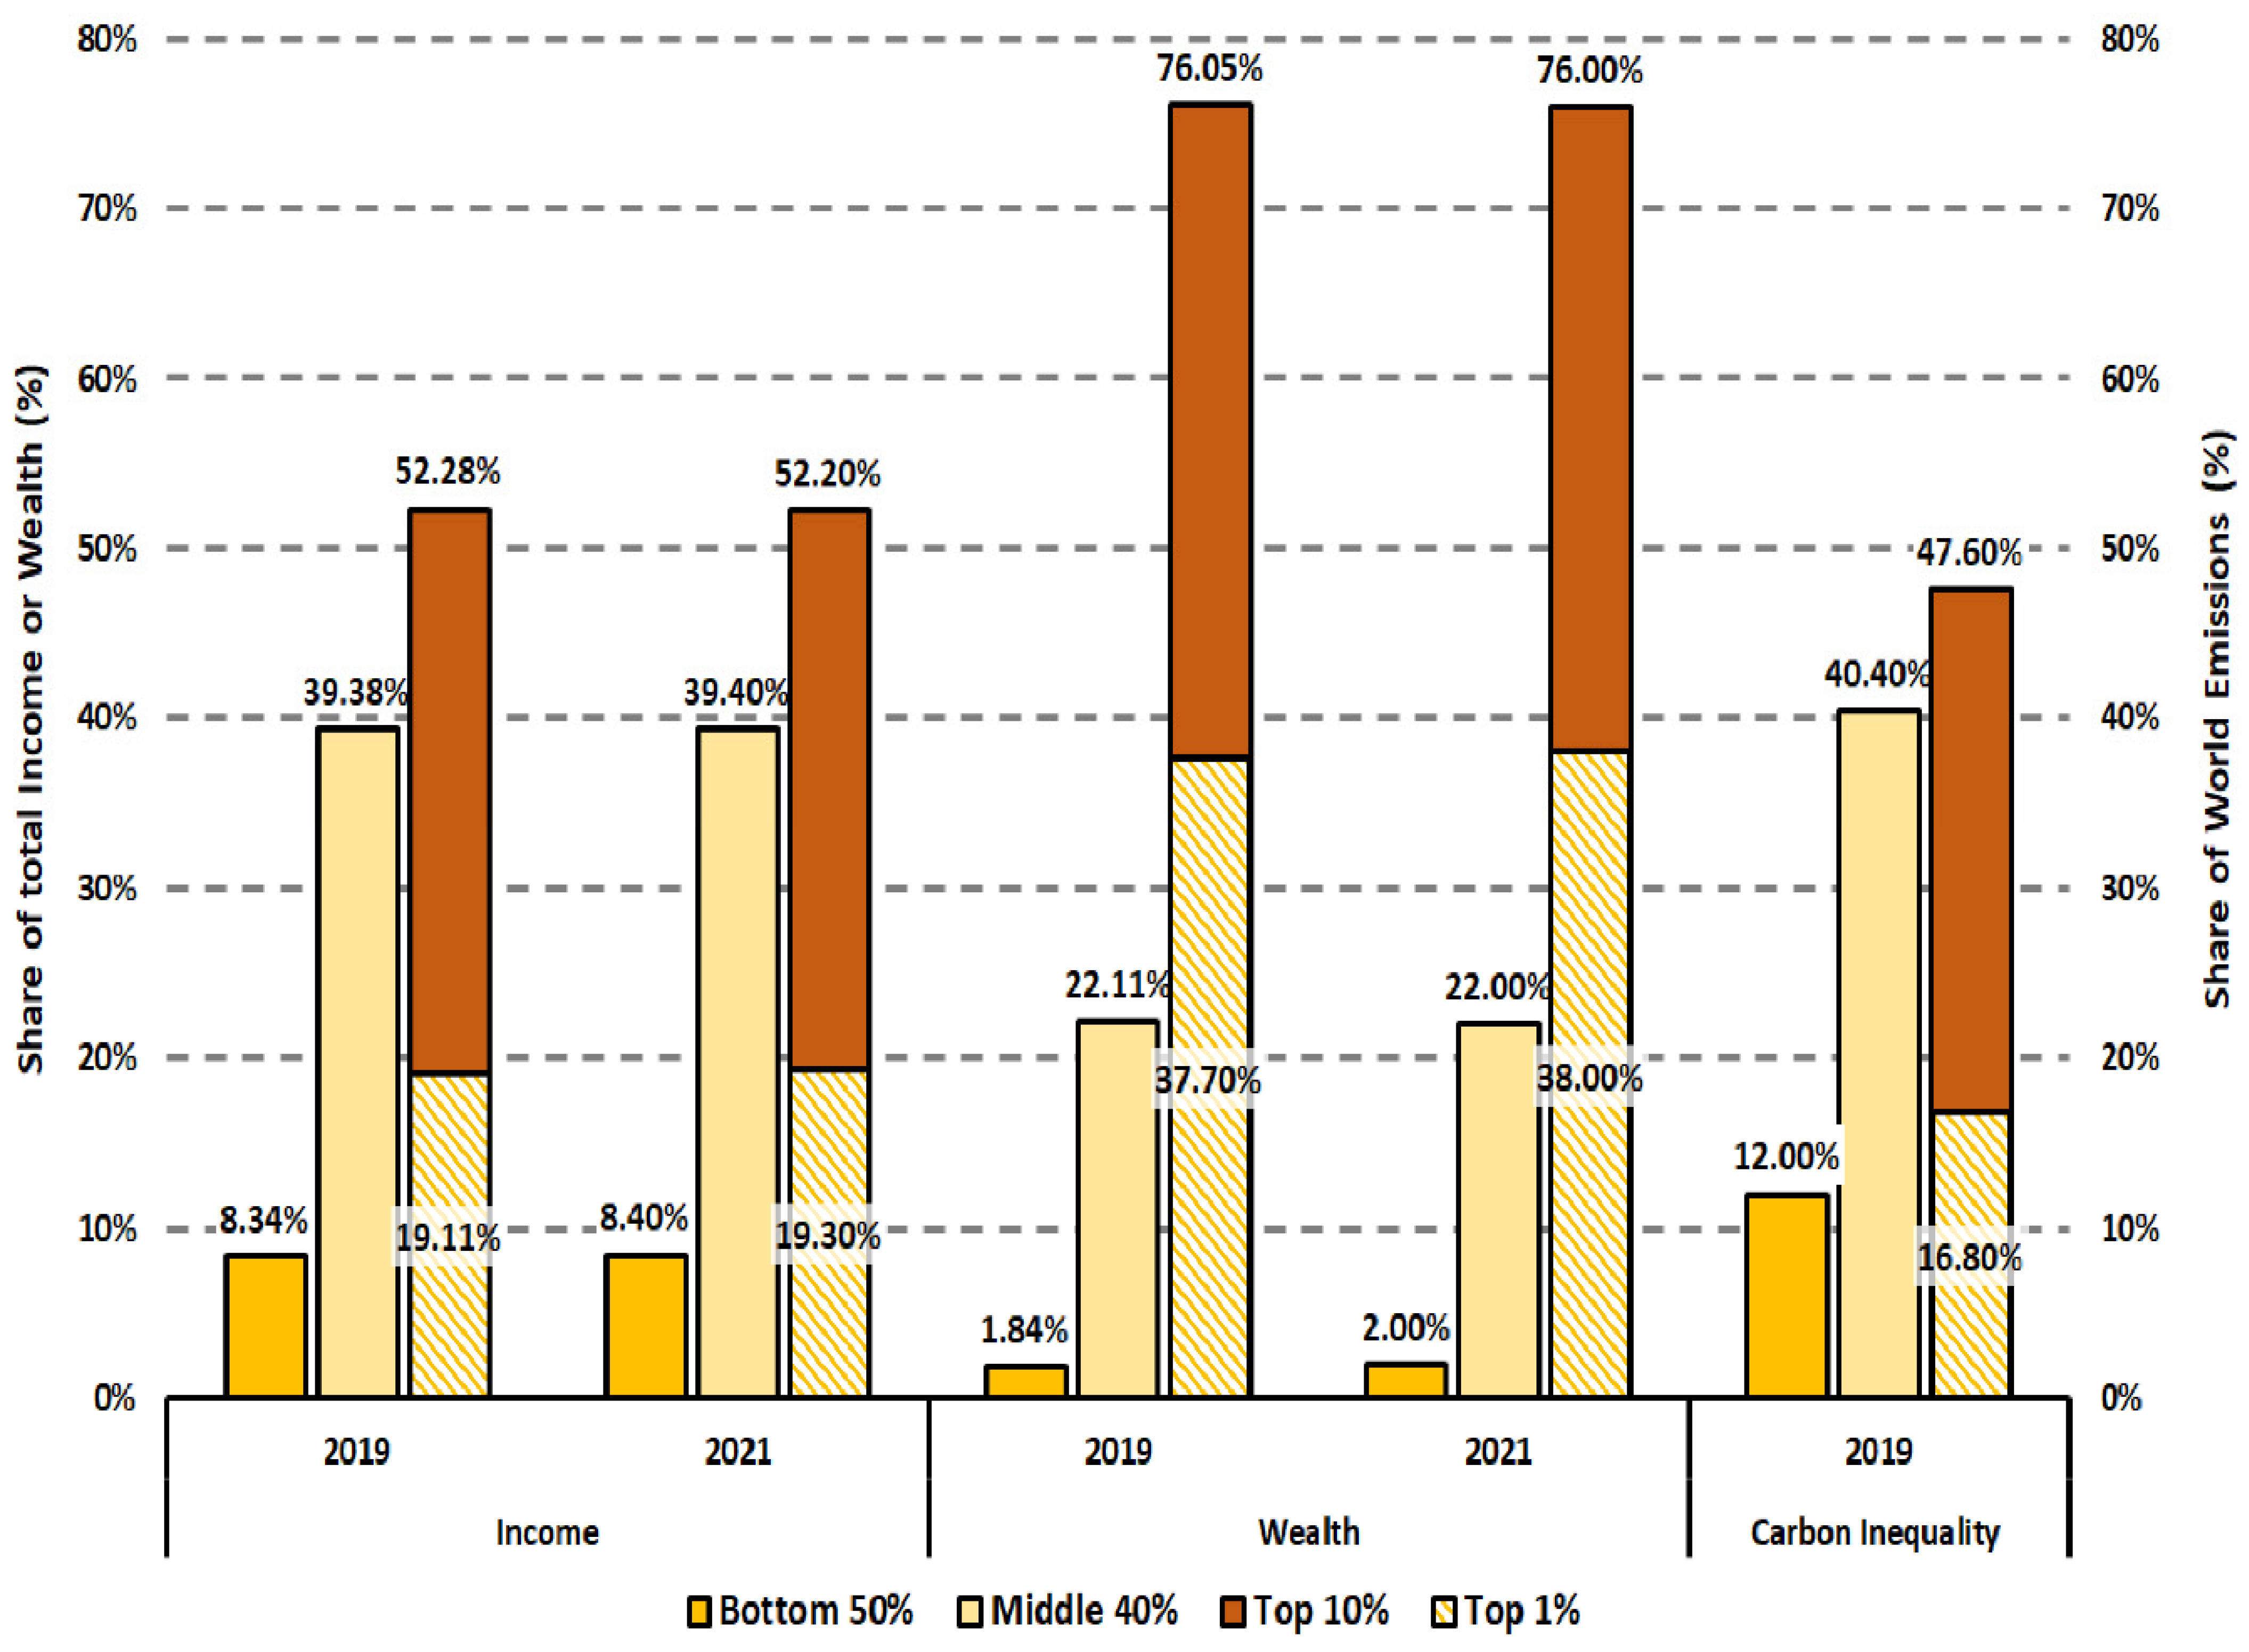
7
It should be noted that income and wealth is measured in purchasing power parity and that the population shares of income do not necessarily mean the same population share in wealth.
8
Emissions derived from public and private sector, nationally or internationally.
9
For more information, please see Lorenz (1905).
10
For more information, please see Gini (1921).
11
Also known as Hoover or Schutz or Pietra ratio (Pietra 2014; Schutz 1951; Hoover 1936; De Maio 2007).
12
It ought to be clarified that the middle class (the bourgeoisie) in the period of Marx included the owners of means of productions (i.e., bankers, etc.) but nowadays the modern middle class is identical to Marx’ petty bourgeoisie which consisted the small enterprises, the primary sector of small farms, and white-collar workers (Harris 1939).
13
For more info about Jan Pen’s parade of dwarves and a few giants, in which as giants are seem the richer strata of the income/wealth distribution whereas dwarves depict the poorer population, please see (Pen 1973), Cowell also examined Pen’s parade in a well-rounded way with great explanations of its expansion into inequality literature (Cowell 2000, 2009).
14
Some dimensions have common elements with others, hence if they are measured in a monetary way, there is the risk of measuring something more than one time.

References

  1. Acemoglu, Daron, and James A. Robinson. 2013. Why Nations Fail? The Origins of Power, Prosperity, and Poverty. New York: Profile Bo. [Google Scholar]
  2. Alichi, Ali, Rodrigo Mariscal, and Daniela Muhaj. 2017. Hollowing Out: The Channels of Income Polarization in the United States. Working Papers. no. 17. Washington, DC: International Monetary Fund (IMF). [Google Scholar] [CrossRef]
  3. Alkire, Sabina, and James Foster. 2011. Counting and Multidimensional Poverty Measurement. Journal of Public Economics 95: 476–87. [Google Scholar] [CrossRef] [Green Version]
  4. Alkire, Sabina, Fanni Kovesdi, Elina Scheja, and Frank Vollmer. 2022. Moderate Multidimensional Poverty Index: Paving the Way Out of Poverty. Available online: https://ophi.org.uk/rp59a/ (accessed on 14 January 2023).
  5. Alkire, Sabina, Usha Kanagaratman, and Nicolai Suppa. 2021. The Global Multidimensional Poverty Index (MPI) 2021. Oxford: Oxford Poverty and Human Development Initiative, University of Oxford. Available online: https://www.ophi.org.uk/wp-content/uploads/OPHI_MPI_MN_51_2021_4_2022.pdf (accessed on 14 January 2023).
  6. Antoniades, Andreas, Indra Widiarto, and Alexander S. Antonarakis. 2020. Financial Crises and the Attainment of the SDGs: An Adjusted Multidimensional Poverty Approach. Sustainability Science 15: 1683–98. [Google Scholar] [CrossRef] [Green Version]
  7. Artuc, Erhan, Guillermo Falcone, Guido Port, and Bob Rijkers. 2022. War-Induced Food Price Inflation Imperils the Poor. In Global Economic Consequences of the War in Ukraine: Sanctions, Supply Chains and Sustainability. Edited by Luis Garicano, Dominic Rohner and Beatrice Weder di Mauro. London: CEPR, pp. 155–63. [Google Scholar]
  8. Atkinson, Anthony B. 1969. On the Measurement of Inequality. Journal of Economic Theory 2: 244–63. [Google Scholar] [CrossRef]
  9. Atkinson, Anthony B. 2019a. Chapter 2: What Do We Mean by Poverty? In Measuring Poverty around the World. Edited by John Micklewright and Andrea Brandolini. Princeton and Oxford: Princeton University Press, pp. 28–57. [Google Scholar]
  10. Atkinson, Anthony B. 2019b. Chapter 5: Global Poverty and the Sustainable Development Goals. In Measuring Poverty around the World. Edited by John Micklewright and Andrea Brandolini. Princeton and Oxford: Princeton University Press, pp. 146–65. [Google Scholar]
  11. Barbier, Edward B. 1987. The Concept of Sustainable Economic Development. Environmental Conservation 14: 101–10. [Google Scholar] [CrossRef]
  12. Berg, Andrew G., and Jonathan Ostry. 2011. Inequality and Unsustainable Growth: Two Sides of the Same Coin? International Monetary Fund (IMF) Economic Review 65: 792–815. [Google Scholar] [CrossRef] [Green Version]
  13. Birdsall, Nancy. 2007. Income Distribution: Effects on Growth and Development. Working Paper Number 118. Available online: www.cgdev.org (accessed on 14 January 2023).
  14. Boulding, Kenneth E. 1975. The Pursuit of Equality. In National Bureau of Economic Research. Edited by James D. Smith. Cambridge: National Bureau of Economic Research, pp. 9–28. Available online: http://www.nber.org/books/smit75-1 (accessed on 17 January 2023).
  15. Bourguignon, Francois, and Gary Fields. 1997. Discontinuous Losses from Poverty, Generalized Pa Measures, and Optimal Transfers to the Poor. Journal of Public Economics 63: 155–75. [Google Scholar] [CrossRef] [Green Version]
  16. Bourguignon, Francois, and Satya R. Chakravarty. 2003. The Measurement of Multidimensional Poverty. Journal of Economic Inequality 1: 25–49. [Google Scholar] [CrossRef]
  17. Bourguignon, Francois, and Satya R. Chakravarty. 2019. The Measurement of Multidimensional Poverty. In Poverty, Social Exclusion and Stochastic Dominance. Edited by Satya R. Chakravarty. Springer: Singapore, pp. 83–108. [Google Scholar] [CrossRef]
  18. Campagnolo, Lorenza, and Marinella Davide. 2019. Can the Paris Deal Boost SDGs Achievement? An Assessment of Climate Mitigation Co-Benefits or Side-Effects on Poverty and Inequality. World Development 122: 96–109. [Google Scholar] [CrossRef]
  19. Carter, Michael R., and Christopher B. Barrett. 2006. The Economics of Poverty Traps and Persistent Poverty: An Asset-Based Approach. The Journal of Development Studies ISSN 42: 178–99. [Google Scholar] [CrossRef] [Green Version]
  20. Ceriani, Lidia, and Paolo Verme. 2012. The Origins of the Gini Index: Extracts from Variabilità e Mutabilità (1912) by Corrado Gini. Journal of Economic Inequality 10: 421–43. [Google Scholar] [CrossRef]
  21. Chancel, Lucas, Thomas Piketty, Emmanuel Saez, and Gabriel Zucman, eds. 2022. World Inequality Report. New York: World Inequality Lab, United Nations Development Program. Available online: https://wir2022.wid.world (accessed on 17 January 2023).
  22. Chancel, Lucas. 2022. Global Carbon Inequality over 1990–2019. Nature Sustainability 5: 931–38. [Google Scholar] [CrossRef]
  23. Clifford, Brendan, Andrew Wilson, and Patrick Harris. 2019. Homelessness, Health and the Policy Process: A Literature Review. Health Policy 123: 1125–32. [Google Scholar] [CrossRef] [PubMed]
  24. Cobham, Alex, and Andy Sumner. 2013. Is It All About the Tails? The Palma Measure of Income Inequality. Center for Global Development, 343. [Google Scholar] [CrossRef] [Green Version]
  25. Cobham, Alex, Lukas Schlogl, and Andy Sumner. 2016. Inequality and the Tails: The Palma Proposition and Ratio Revisited. New York: United Nations Department of Economic & Social Affairs (UNDESA), vol. 7, pp. 1–19. [Google Scholar] [CrossRef]
  26. Comim, Flavio, Mihály Tamás Borsi, and Octasiano Valerio Mendoza. 2020. The Multi-Dimensions of Aporophobia. MPRA, No. 35423: Paper No. 40041, Posted 17. Available online: https://mpra.ub.uni-muenchen.de/103124/ (accessed on 20 January 2023).
  27. Cortina, Adela. 2022. Aporophobia: Why We Reject the Poor Instead of Helping Them/Adela Cortina. Translated by Adrian Nathan West. Princeton: Princeton University Press. [Google Scholar]
  28. Cowell, Frank A. 2000. Chapter 2: Measurement of Inequality of Incomes. In Handbook of Income Distribution. Edited by Anthony B. Atkinson and Francois Bourguignon. Amsterdam: Elsevier B.V., pp. 87–166. Available online: https://www.sciencedirect.com/handbook/handbook-of-income-distribution/vol/1/suppl/C (accessed on 20 January 2023).
  29. Cowell, Frank A. 2009. Measuring Inequality. LSE Perspectives in Economic Analysis. Oxford: Oxford University Press. [Google Scholar]
  30. Cowell, Frank A., and Kiyoshi Kuga. 1981. Inequality Measurement. An Axiomatic Approach. European Economic Review 15: 287–305. [Google Scholar] [CrossRef]
  31. CSRI. 2022. Global Wealth Report 2022: Leading Perspectives to Navigate the Future; Credit Suisse Research Institute. Available online: https://www.studocu.com/en-au/document/university-of-queensland/introductory-macroeconomics/global-wealth-report-2022-en/41480059 (accessed on 20 January 2023).
  32. Davis, E. Philip, and Miguel Sanchez-Martinez. 2014. A Review of the Economic Theories of Poverty. National Institute of Economic and Social Research 435: 1–65. [Google Scholar]
  33. De Maio, Fernando G. 2007. Income Inequality Measures. Journal of Epidemiology and Community Health 61: 849–52. [Google Scholar] [CrossRef]
  34. Derndorfer, Judith, and Stefan Kranzinger. 2021. The Decline of the Middle Class: New Evidence for Europe. Journal of Economic Issues 55: 914–38. [Google Scholar] [CrossRef]
  35. Dhahri, Sabrine, and Anis Omri. 2020. Foreign Capital towards SDGs 1 & 2—Ending Poverty and Hunger: The Role of Agricultural Production. Structural Change and Economic Dynamics 53: 208–21. [Google Scholar] [CrossRef]
  36. Dickerson, Andy, and Gurleen Popli. 2014. Persistent Poverty and Children’s Cognitive Development: Evidence from the UK Millenium Cohort Study. Sheffield Economic Research Paper Series No. 2011023. Available online: https://www.sheffield.ac.uk/economics/research/serps (accessed on 20 January 2023).
  37. Donaldson, David, and John A. Weymark. 1986. Properties of Fixed-Population Poverty Indices. International Economic Review 27: 667–88. [Google Scholar] [CrossRef]
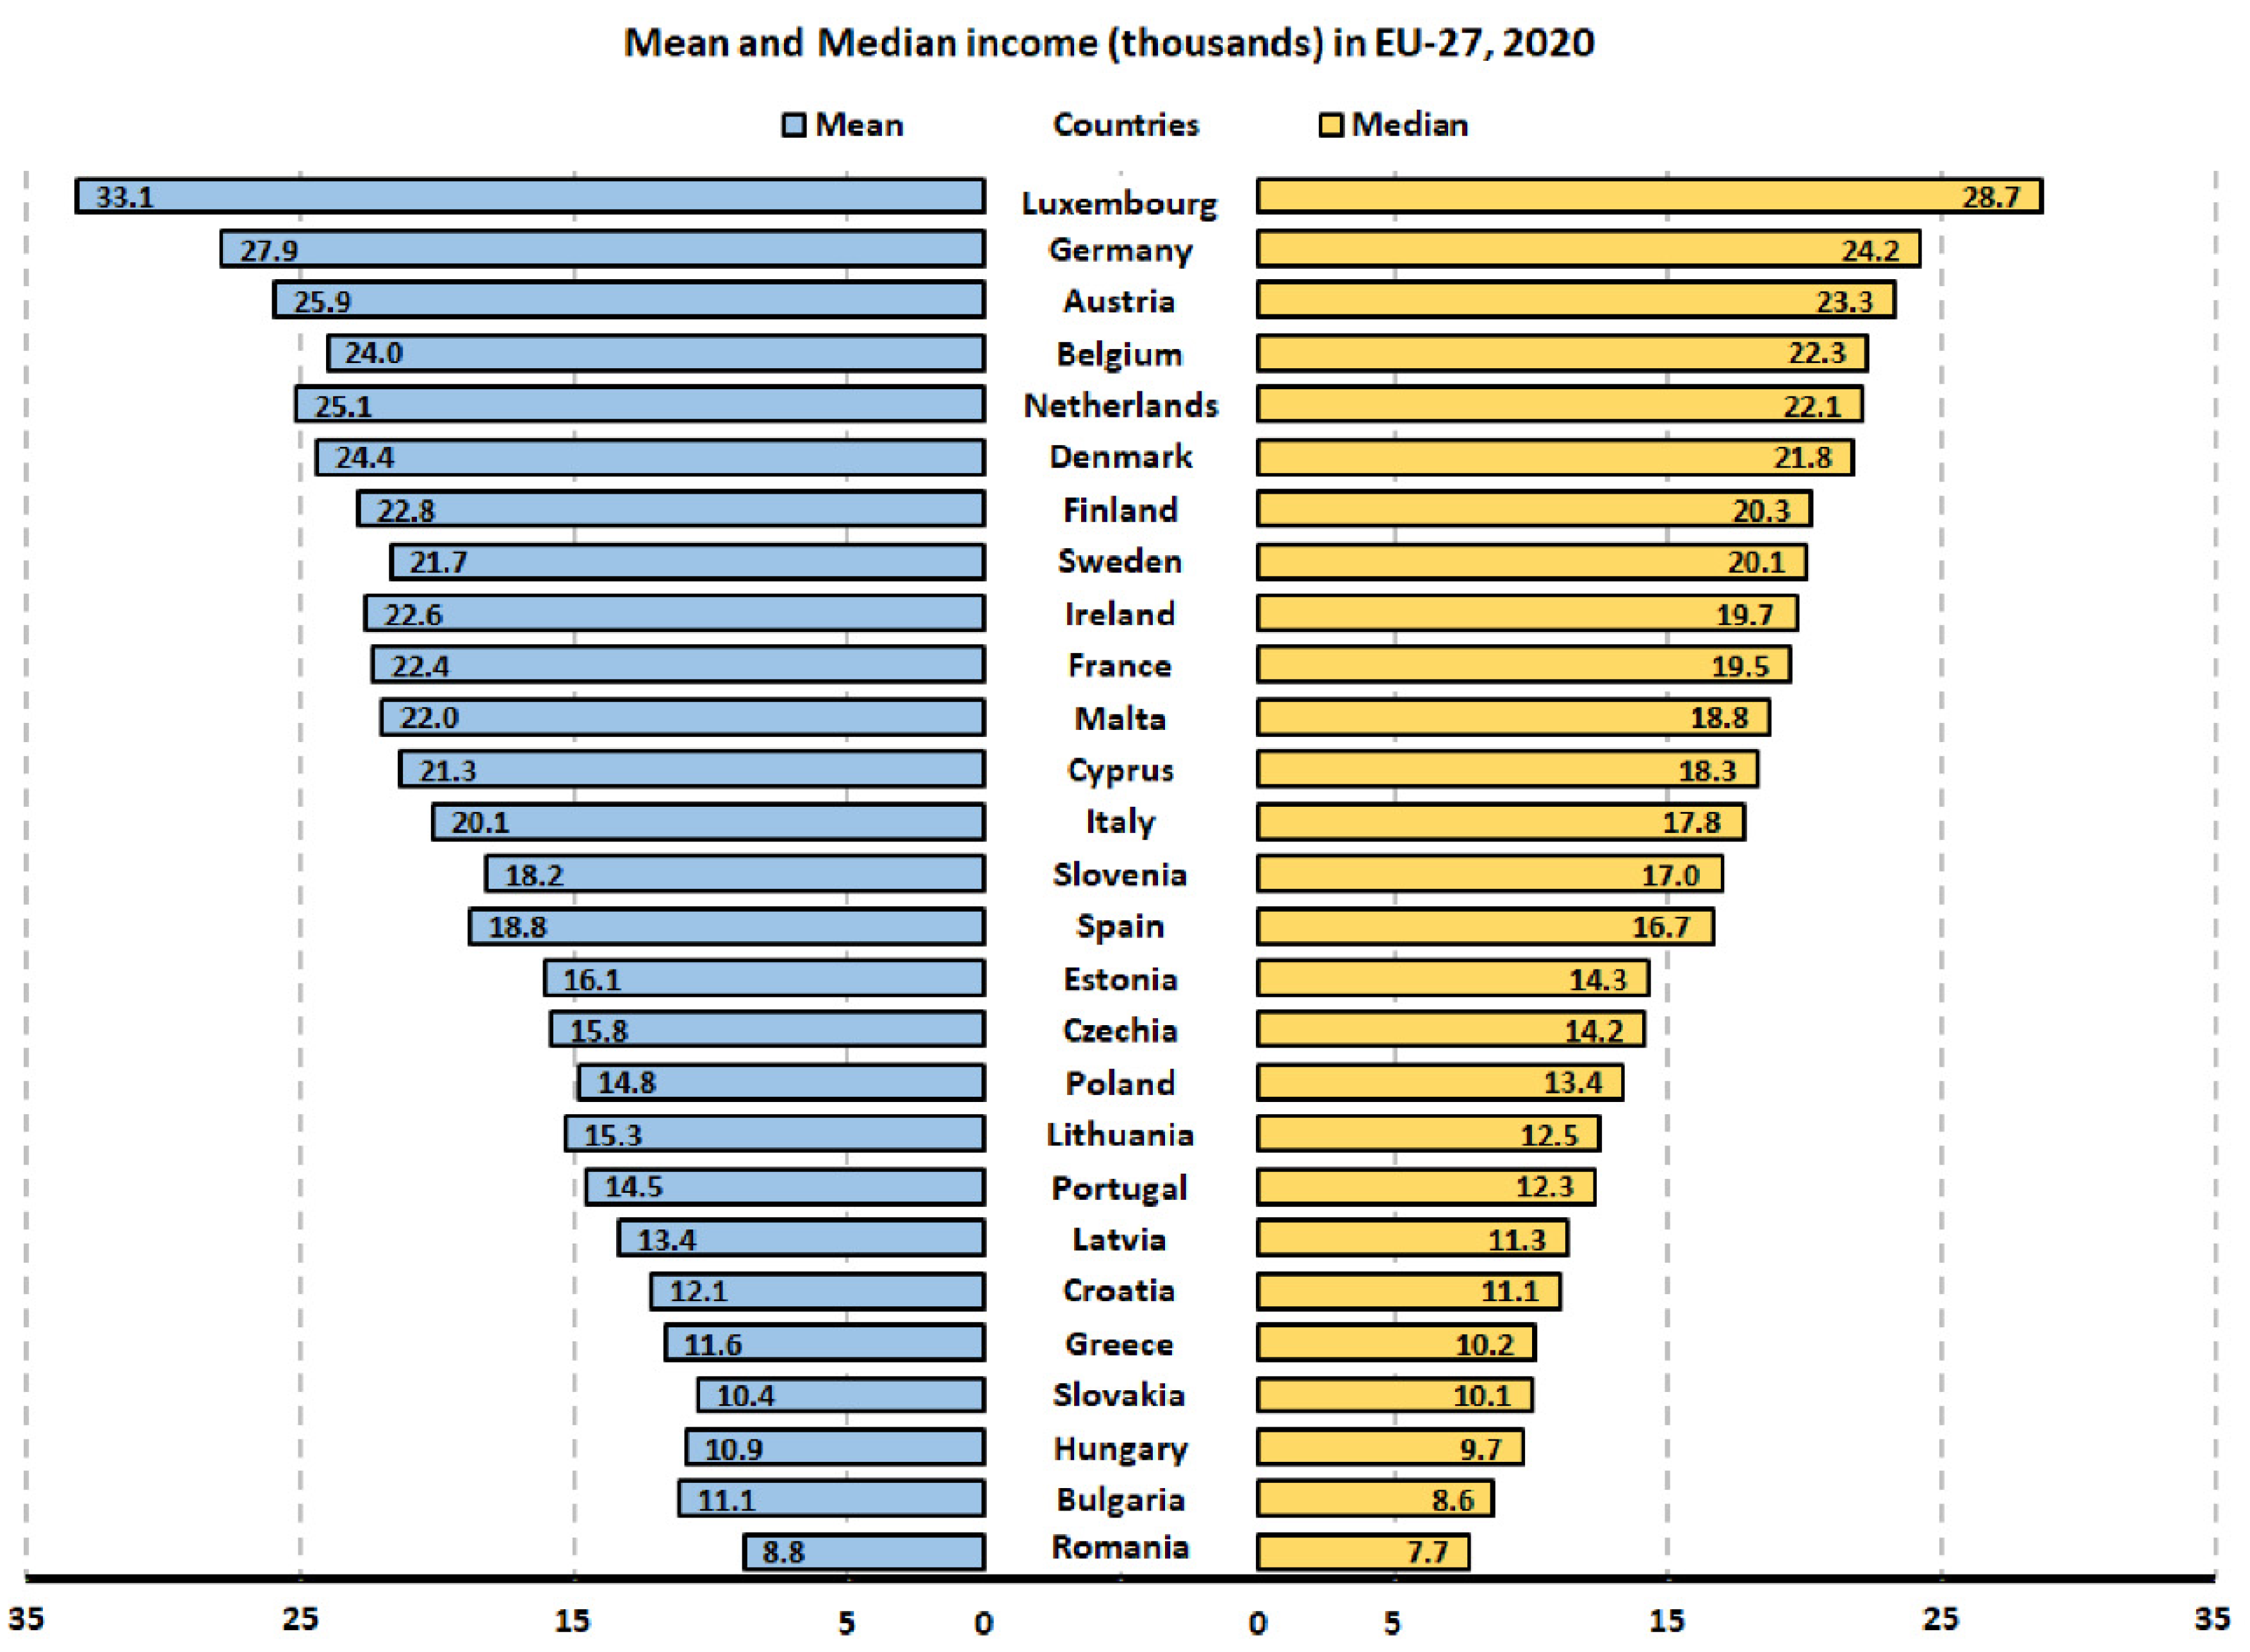
  38. Eurostat. 2022. Mean and Median Income by Age and Sex. Available online: https://ec.europa.eu/eurostat/databrowser/view/ILC_DI03__custom_4622063/default/table?lang=en (accessed on 30 December 2022).
  39. Firebaugh, Glenn. 2009. The New Geography of Global Income Inequality. Cambridge: Harvard University Press. [Google Scholar]
  40. Foster, James, and Anthony Shorrocks. 1991. Subgroup Consistent Poverty Indices. Econometrica 59: 687–709. [Google Scholar] [CrossRef] [Green Version]
  41. Foster, James, Joel Greer, and Erik Thorbecke. 1984. A Class of Decomposable Poverty Measures. Econometrica 52: 761–66. [Google Scholar] [CrossRef] [Green Version]
  42. Foster, James, Joel Greer, and Erik Thorbecke. 2010. The Foster-Greer-Thorbecke (FGT) Poverty Measures: 25 Years Later. Journal of Economic Inequality 8: 491–524. [Google Scholar] [CrossRef]
  43. Gini, Corrado. 1921. Measurement of Inequality of Incomes. The Economic Journal 31: 121. [Google Scholar] [CrossRef]
  44. Goodhand, Jonathan. 2003. Enduring Disorder and Persistent Poverty: A Review of the Linkages Between War and Chronic Poverty. World Development 31: 629–46. [Google Scholar] [CrossRef]
  45. Ha, Jongrim, M. Ayhan Kose, and Franziska Ohnsorge. 2021. One-Stop Source: A Global Database of Inflation. Policy Research Working Paper 9737. Washington, DC: World Bank Group. [Google Scholar] [CrossRef]
  46. Hagenaars, Aldi J. M., and Bernard M. S. van Praag. 1985. A Synthesis of Poverty Line Definitions. Review of Income and Wealth 31: 139–54. [Google Scholar] [CrossRef]
  47. Haider, L. Jamila, Wiebren J. Boonstra, Garry D. Peterson, and Maja Schlüter. 2018. Traps and Sustainable Development in Rural Areas: A Review. World Development 101: 311–21. [Google Scholar] [CrossRef] [Green Version]
  48. Harmon, Justin. 2021. The Right to Exist: Homelessness and the Paradox of Leisure. Leisure Studies 40: 31–41. [Google Scholar] [CrossRef]
  49. Harris, Abram L. 1939. Pure Capitalism and the Disappearance of the Middle Class. Race, Radicalism, and Reform 47: 328–56. [Google Scholar] [CrossRef] [Green Version]
  50. Harrison, Ann. 2006. Globalization and Poverty. NBER Working Paper Series 12347; Cambridge: NBER, vol. 13, Available online: http://www.nber.org/papers/w12347 (accessed on 20 January 2023).
  51. Hastings, Catherine. 2021. Homelessness and Critical Realism: A Search for Richer Explanations. Housing Studies 36: 737–57. [Google Scholar] [CrossRef]
  52. Haughton, Jonathan, and Shahidur R. Khandker. 2009. Handbook on Poverty and Inequality. Washington, DC: The World Bank. [Google Scholar] [CrossRef]
  53. Hellgren, Zenia, and Lorenzo Gabrielli. 2021. Racialization and Aporophobia: Intersecting Discriminations in the Experiences of Non-Western Migrants and Spanish Roma. Social Sciences 10: 163. [Google Scholar] [CrossRef]
  54. Heuveline, Patrick. 2022. Global and National Declines in Life Expectancy: An End-of-2021 Assessment. Population and Development Review 48: 31–50. [Google Scholar] [CrossRef]
  55. Hoover, Edgar M., Jr. 1936. All Use Subject to JSTOR Terms and Conditions THE AMERICAN. The Review of Economics and Statistics 18: 162–71. [Google Scholar] [CrossRef]
  56. IMF. 2014. Fiscal Policy and Income Inequality. Washington, DC: International Monetary Fund. Available online: https://www.imf.org/external/np/pp/eng/2014/012314.pdf (accessed on 20 January 2023).
  57. INE. 2007. Poverty and Its Measurement: The Presentation of a Range of Methods to Obtain Measures of Poverty. Madrid: Instituto Nacional De Estadística. Available online: https://www.ine.es/buscar/searchResults.do?searchString=Poverty+and+its+measurement++The+presentation+of+a+range+of+methods++to+obtain+measures+of+poverty+&Menu_botonBuscador=&searchType=DEF_SEARCH&startat=0&L=1 (accessed on 20 January 2023).
  58. Jenkins, Stephen P. 2022. Getting the Measure of Inequality. Available online: https://ifs.org.uk/inequality/getting-the-measure-of-inequality/ (accessed on 20 January 2023).
  59. Kuznets, Simon. 1955. Economic Growth and Income Inequality. The American Economic Review 45: 1–28. [Google Scholar]
  60. Lazonick, William. 2015. Labor in the Twenty-First Century: The Top 0.1% and the Disappearing Middle-Class. Working Paper No 4. New York: Institute for New Economic Thinking. [Google Scholar] [CrossRef] [Green Version]
  61. Lenoir, Rene. 1974. LES EXCLUS: Un Francais Sur Dix. Seuil, 1st ed. Available online: https://excerpts.numilog.com/books/9782021445206.pdf (accessed on 10 December 2022).
  62. Levy, Frank, and J. Murnane Richard. 1992. U.S. Earning Levels and Earnings Inequality: A Review of Recent Trends and Proposed Explanations. Journal of Economic Literature 30: 1333–81. [Google Scholar]
  63. Lorenz, Max O. 1905. Methods of Measuring the Concentration of Wealth. American Statistical Associatio 9: 209–19. [Google Scholar] [CrossRef]
  64. Lygnegård, Frida, Dana Donohue, Juan Bornman, Mats Granlund, and Karina Huus. 2013. A Systematic Review of Generic and Special Needs of Children with Disabilities Living in Poverty Settings in Low- and Middle-Income Countries. Journal of Policy Practice 12: 296–315. [Google Scholar] [CrossRef] [Green Version]
  65. Lyubimov, Ivan. 2017. Income Inequality Revisited 60 Years Later: Piketty vs. Kuznets. Russian Journal of Economics 3: 42–53. [Google Scholar] [CrossRef]
  66. Maslow, Abraham Harold. 1943. A Theory of Human Motivation A Theory of Human Motivation. Psychological Review 50: 370–96. [Google Scholar] [CrossRef] [Green Version]
  67. OECD. 2016. OECD Factbook 2015–2016: Economic, Environmental and Social Statistics. Paris: OECD Publishing. Available online: https://www.oecd-ilibrary.org/sites/factbook-2015-en/index.html?itemId=/content/publication/factbook-2015-en (accessed on 20 January 2023).
  68. OECD. 2022. “Income Inequality”: Organisation for Economic Co-Operation and Development. Available online: https://data.oecd.org/inequality/income-inequality.htm#indicator-chart (accessed on 20 January 2023).
  69. OWID. 2023. Top Income Shares. Our World in Data. Available online: https://ourworldindata.org/income-inequality#within-country-inequality-around-the-world (accessed on 20 January 2023).
  70. Oxford Poverty and Human Development Initiative. 2018. Global Multidimensional Poverty Index 2018: The Most Detailed Picture to Date of the World’s Poorest People. Oxford: University of Oxford. [Google Scholar] [CrossRef] [Green Version]
  71. Palma, José Gabriel. 2006. Globalizing Inequality: ‘Centrifugal’ and ‘Centripetal’ Forces at Work. DESA Working Paper 35. New York: UN DESA. [Google Scholar]
  72. Palma, José Gabriel. 2011. Homogeneous Middles vs. Heterogeneous Tails, and the End of the ‘Inverted-U’: The Share of the Rich Is What It’s All About. Cambridge: Cambridge Working Papers in Economics (CWPE), vol. 42, p. 1111. [Google Scholar] [CrossRef]
  73. Peet, Richard. 1975. Inequality and Poverty: A Marxist-Geographic Theory. Annals of the Association of American Geographers 65: 4. [Google Scholar] [CrossRef]
  74. Pen, Jan. 1973. A Parade of Dwarves (and a Few Giants). In Wealth, Income and Inequality. Edited by Anthony B. Atkinson. Middlesex: Penguin, pp. 73–82. [Google Scholar]
  75. Pietra, Gaetano. 2014. On the Relationships between Variability Indices (Note I) [Original: Pietra Gaetano (1915). Delle Relazioni Tra Gli Indici Di Variabilità (Nota I), Atti Del Reale Istituto Veneto Di Scienze, Lettere e Arti. 1915, Vol. LXXIV, Part I, Pages 775–792]. Metron 72: 5–16. [Google Scholar] [CrossRef]
  76. Piketty, Thomas. 2014. Capital in the Twenty-First Century. Cambridge and London: The Belknap Press of Harvard University Press. [Google Scholar]
  77. Ravallion, Martin, and Shaohua Chen. 1997. What Can New Survey Data Tell Us about Recent Changes in Distribution and Poverty? World Bank Economic Review 11: 357–82. [Google Scholar] [CrossRef] [Green Version]
  78. Ravallion, Martin, and Shaohua Chen. 2001. Measuring Pro-Poor Growth. 2666. Available online: http://econ.worldbank.org (accessed on 20 January 2023).
  79. Ravallion, Martin. 1996. Issues in Measuring and Modelling Poverty. The Economic Journal 106: 1328–43. [Google Scholar] [CrossRef]
  80. Ravallion, Martin. 2018. Inequality and Globalization: A Review Essay. Journal of Economic Literature 56: 620–42. [Google Scholar] [CrossRef] [Green Version]
  81. Ravallion, Martin. 2020. On Measuring Global Poverty. Annual Review of Economics 12: 167–88. [Google Scholar] [CrossRef]
  82. Rawls, John. 1971. A Theory of Justice. The Belknap Press of Harvard University Press. Revised ed. Cambridge: The Belknap Press of Harvard University Press. [Google Scholar]
  83. Rodríguez, Juan Gabriel. 2005. Measuring Polarization, Inequality, Welfare and Poverty. E2004/75. Available online: https://ideas.repec.org/p/cea/doctra/e2004_75.html (accessed on 20 December 2022).
  84. Schäfer, Armin, and Hanna Schwander. 2019. ‘Don’t Play If You Can’t Win’: Does Economic Inequality Undermine Political Equality? European Political Science Review 11: 395–413. [Google Scholar] [CrossRef] [Green Version]
  85. Schutz, Robert R. 1951. On the Measurement of Income Inequality. The American Economic Review 41: 107–22. [Google Scholar] [CrossRef]
  86. Sen, Amartya. 1976. An Ordinal Approach to Measurement. Econometrica 44: 219–31. [Google Scholar] [CrossRef]
  87. Sen, Amartya. 1983. Poor, Relatively Speaking. Oxford Economic Papers 35: 153–69. [Google Scholar] [CrossRef]
  88. Shorrocks, Anthony F. 1995. Revisiting the Sen Poverty Index. Econometrica 63: 1225–30. [Google Scholar] [CrossRef]
  89. Smith, Adam. 1776. An Inquiry into the Nature and Causes of the Wealth of Nations. London: Everyman Edition, Home University Library. [Google Scholar]
  90. Thon, Dominique. 1979. On Measuring Poverty. Review of Income and Wealth 25: 429–39. [Google Scholar] [CrossRef]
  91. Townsend, Peter. 1979. Poverty in the United Kingdom: A Survey of Household Resources and Standards of Living. Berkeley: University of California Press. [Google Scholar]
  92. UN. 2015. Inequality Measurement: Development Issues No. 2. New York: United Nations. [Google Scholar]
  93. UN. 2016. The Sustainable Development Goals. New York: United Nations. Available online: https://unstats.un.org/sdgs/report/2016/the sustainable development goals report 2016.pdf (accessed on 20 January 2023).
  94. UNDP, and OPHI. 2020. Global MPI 2020–Charting Pathways Out of Multidimensional Poverty: Achieving the SDGs. New York: United Nations Development Programme (UNDP). Oxford: Oxford Poverty and Human Development Initiative (OPHI). Available online: http://hdr.undp.org/sites/default/files/2020_mpi_report_en.pdf (accessed on 20 January 2023).
  95. UNDP, and OPHI. 2022. Poverty Multiidimensional Poverty Index 2022: Unpacking Deprivation Bundles to Reduce Multidimensional Poverty. New York: United Nations Development Programme. Oxford: Oxford Poverty and Human Development Initiative. Available online: https://hdr.undp.org/content/2022-global-multidimensional-poverty-index-mpi#/indicies/MPI (accessed on 20 January 2023).
  96. UNDP. 2019. Human Development Report 2019: Beyond Income, beyond Averages, beyond Today. United Nations Development Program. Nairobi: United Nations Environment Programme. [Google Scholar]
  97. UNDP. 2022. Human Development Report 2021/2022: Uncertain Times, Unsettled Lives: Shaping Our Future in a Transforming World. Nairobi: United Nations Environment Programme. Available online: https://globalcompactrefugees.org/media/undp-report-humandevelopmentreport20212022overviewpdf (accessed on 25 January 2023).
  98. UNECE. 2017. Guide on Poverty Measurement. Geneva: United Nation Economic Commission for Europe, pp. 1–218. Available online: https://unece.org/fileadmin/DAM/stats/publications/2018/ECECESSTAT20174.pdf (accessed on 25 January 2023).
  99. UNSDG. 2022. Operationalizing Leaving No One Behind. New York: United Nations Sustainable Development Group. [Google Scholar] [CrossRef]
  100. Walker, R. 2014. The Shame of Poverty. Oxford: Oxford University Press. [Google Scholar]
  101. WBG. 2018. Poverty and Shared Prosperty 2018: Piecing Together the Poverty Puzzle. Washington, DC: World Bank Group. Available online: https://www.worldbank.org/en/publication/poverty-and-shared-prosperity-2018 (accessed on 25 January 2023).
  102. WBG. 2020. Poverty and Shared Prosperity 2020: Reversals of Fortune. Washington, DC: World Bank Group. [Google Scholar] [CrossRef]
  103. WBG. 2022a. Poverty and Inequality Platform (PIP). Washington, DC: World Bank Group. Available online: https://pip.worldbank.org/home (accessed on 25 January 2023).
  104. WBG. 2022b. Poverty and Shared Prosperity 2022: Correcting Course. Washington, DC: World Bank Group. Available online: https://openknowledge.worldbank.org/handle/10986/37739 (accessed on 25 January 2023).
  105. WCED. 1987. The Brundtland Report: ‘Our Common Future’. New York: World Commission on Environment and Development. Available online: https://sustainabledevelopment.un.org/content/documents/5987our-common-future.pdf (accessed on 20 December 2022).
  106. Wolfson, Michael. 1994. When Inequalities Diverge. The American Economic Review 84: 353–58. [Google Scholar]
  107. Xu, Kuan. 1998. Statistical Inference for the Sen-Shorrocks-Thon Index of Poverty Intensity. Journal of Income Distribution 8: 143–52. [Google Scholar] [CrossRef]
  108. Zheng, Buhong. 1993. An Axiomatic Characterization of the Watts Poverty Index. Economics Letters 42: 81–86. [Google Scholar] [CrossRef]
  109. Zhou, Yang, and Yansui Liu. 2022. The Geography of Poverty: Review and Research Prospects. Journal of Rural Studies 93: 408–16. [Google Scholar] [CrossRef]
Figure 1. National income received by the richest top 10% in G20 countries. Note: No data for the UK. Sources: Figure produced by the authors relying on data from OWID (2023).
Economies 11 00110 g001
Figure 2. The wealth pyramid in 2021. Source: Figure produced by the authors modifying Figures 1 and 5 by CSRI (2022).
Economies 11 00110 g002
Figure 3. Mean and median income in EU-27. Note: Mean and median equivalized net income as income and living condition indicators. Unit of measure: purchasing power standard (PPS). Source: Figure produced by the authors relying on data from Eurostat (2022).
Economies 11 00110 g003
Figure 4. Poverty headcount ratios in BRICS around the years 2010, 2015, and 2020. Note: the international poverty lines are USD 2.15 PPP and USD 6.85 PPP. Source: Figure produced by the authors relying on data from WBG (2022a).
Economies 11 00110 g004
Figure 5. Population shares of income, wealth, and carbon inequalities. Source: Figure produced by the authors relying on data and figures from (Chancel et al. 2022; Chancel 2022).
Economies 11 00110 g005
Figure 6. The Gini and Robin Hood indices on the Lorenz curve. Note: This figure was drawn only to provide a graphical visualization of the notions of Gini and Robin Hood indices in tandem with the Lorenz curve. Source: The figure was modified by authors relying on figures of Sen (1976) and UN (2015).
Economies 11 00110 g006
Figure 7. (a) The Gini index in 2000 and 2015, and (b) the Gini index in 1990 and 2015. Source: The figure was produced by the authors relying on data from OWID (2023).
Economies 11 00110 g007
Figure 8. Palma ration in G20 countries in 2010, 2015, and 2020. Source: The figure was produced by the authors relying on data from OECD (2022).
Economies 11 00110 g008
Figure 9. Polarization and the Gini index on the Lorenz curve. Note: The greater the spreading out of the curve from the 45° line (equal division), the greater the polarization. Source: The figure was modified by the authors relying on Figure 2 by Wolfson (1994).
Economies 11 00110 g009
Table 1. Poverty measures.
IndexFormulae
Poverty Headcount Ratio
(P0)
P 0 = 1 N i = 1 N I ( y i < z )
Poverty Gap G i = ( z y i ) × I ( y i < z )
Poverty Gap Index
(P1)
P 1 = 1 N i = 1 N G i z
Poverty Severity Index
(P2)
P 2 = 1 N i = 1 N ( G i z ) 2
Watts Index
(W)
W = 1 N i = 1 q [ ln ( z ) ln ( y i ) ] = 1 N i = 1 q ( z y i )
Note: the yi refers to the expenditure or income and is compared with the poverty line (z), while I ( · ) takes the value 1 if the household is poor, and 0 if it is above the poverty line. Further, q shows the individuals that their income (or expenditure) falls below the poverty line. Source: Authors’ edit from Haughton and Khandker (2009).
Table 2. Percentage change of poverty measures in some of G20 countries around 2010 and 2020.
CountriesP0P1P2W
Australia42.37%36.25%36.86%117.47%
Brazil–68.15%–72.11%–74.41%–75.78%
Canada–0.73%–17.11%–30.78%–21.66%
China–98.98%–99.18%–99.06%–99.26%
France–75.78%–72.24%–72.21%–82.60%
United Kingdom90.78%108.48%98.90%77.54%
India–69.54%–75.39%–78.20%–76.01%
Indonesia–79.01%–87.00%–91.15%–87.80%
Italy15.20%10.94%14.24%64.08%
Mexico–31.39%–38.78%–40.33%–42.41%
Russian Federation–87.80%–92.67%–94.99%–93.32%
Türkiye–53.40%–44.12%–22.41%–41.78%
United States–0.06%–10.15%–12.20%177.40%
Note: Based on income or consumption surveys. Values around 2010: Brazil and India values of 2009. Values around 2020: Canada and United Kingdom values of 2017; Australia, Germany, France, and Italy values of 2018; China and India values of 2019. Source: Authors’ calculations relying on data from WBG (2022a).
Table 3. Comparison of poverty measured by World Bank and by UNDP and OPHI.
Multidimensional Poverty Measure (MPM)Moderate Multidimensional Poverty Index (MMPI)SDG
Dim.ParametersRWDim.IndicatorA Household Is Deprived If:RW
Monetary PovertyDaily consumption or income is less than USD 2.15 per person. 1 3 Economies 11 00110 i001
EducationAt least one school-age child up to the (equivalent) age of trade 8 is not enrolled in school. 1 6 EducationYears of schoolingNo man and no woman aged 10 years or older in the household has completed nine years of schooling. 1 6 Economies 11 00110 i002
No adult in the household (equivalent age of grade 9 or above has completed primary education. 1 6 School
attendance
Any school-aged child is not attending school up to the age at which he/she would complete grade 10. 1 6 Economies 11 00110 i003
Access to basic InfrastructureThe household lacks access to limited-standard drinking water. 1 9 Living standardsDrinking waterA household does not have access to safe piped water on the premises. 1 18 Economies 11 00110 i004
The household lacks access to limited-standard sanitation. 1 9 SanitationA household does not have flush toilet that is not shared with any other household. 1 18 Economies 11 00110 i005
The household has no access to electricity. 1 9 ElectricityA household does not have electricity or does not have access to the internet or a smartphone. 1 18 Economies 11 00110 i006
Cooking fuelA household cooks with dung, agricultural crops, shrubs, wood, charcoal, or coal. 1 18 Economies 11 00110 i007
HousingA household has inadequate housing: the floor or roof or walls are made of natural or rudimentary materials or there are more than three people per sleeping room. 1 18 Economies 11 00110 i008
AssetsA household does not own more than two assets (radio, TV, telephone, computer, animal cart, bicycle, motorbike, refrigerator, washing machine, bank account) and does not own a car or truck. 1 18 Economies 11 00110 i009
HealthNutritionAny person under 70 years of age, for whom there is nutritional information, is malnourished or obese. 1 6 Economies 11 00110 i010
Child
Mortality
A child under 18 years of age has died in the family in the five-year period preceding the survey or not all eligible household members are covered by health insurance. 1 6 Economies 11 00110 i011
Note: Dim. indicates the dimension of poverty; RW indicates relative weights of the total indicators. The MMPI was chosen instead of global MPI because it further expands the notion of multidimensional poverty with more advanced details, thus the words in bold which differentiate MMPI from global MPI. Sources: (WBG 2018, 2020, 2022b; Oxford Poverty and Human Development Initiative 2018; Alkire et al. 2022). Authors’ edit.
Disclaimer/Publisher’s Note: The statements, opinions and data contained in all publications are solely those of the individual author(s) and contributor(s) and not of MDPI and/or the editor(s). MDPI and/or the editor(s) disclaim responsibility for any injury to people or property resulting from any ideas, methods, instructions or products referred to in the content.

