1. Introduction
There is a large number of factors that affect financial development: openness, political stability, financial liberalization, national regulatory factor, etc. (
Čižo et al. 2020). Innovations in the sphere of finance emerge on the basis of economic digitalization. Market participants apply innovative approaches to products and services that are currently offered in the traditional financial services sector (
Global FinTech Report 2017;
Błach and Klimontowicz 2021). Technologies that have been developed in recent decades as a result of the digital revolution fundamentally change financial markets and financial services. The scale of qualitative and quantitative changes in the financial market grows thanks to blockchain technology and cryptocurrency, which are outside the control of the state, undermining the central bank’s monopoly on the control of money flow. Modern technology introduces new business models, such as financial technology (FinTech) in the financial market (FinTech start-ups, FinTech centers, FinTech enterprises, FinTech clusters, and financial ecosystems), which constitute the FinTech industry and influence traditional financial technology and institutions. FinTech is used not only in the financial market but also beyond it: from IT companies to retail and social networks, which demonstrates the convergence of the financial world (
Global FinTech Report 2017).
The history of FinTech as a concept dates back to 1866. The first stage (1866–1967) began with transatlantic cabling and the development of the telegraph as a means of financial communication. The second stage (1967–2008) marked the emergence of online banking and ATMs. The third stage (2008 onwards) is characterized by the use of high technologies by new market participants, which compete with financial institutions (
Consumer International 2017;
Alshater et al. 2022).
The FinTech term emerged in the early 1990s when banks proposed projects to foster the delivery of banking services using technological tools. These kinds of projects were called “FinTech”. The term FinTech was originally used to refer to the operational technology of financial institutions. It was later integrated more widely, including projects on financial literacy and cryptocurrencies (
Schueffel 2016;
Čižo 2021, p. 85).
In scientific literature, the definition of FinTech is diverse. Arner, Barberis, and Buckley (
Arner et al. 2016) state that FinTech covers not only individual sectors but the entire spectrum of financial services and products.
McAuley (
2015) defines FinTech as an industry consisting of many companies that improve the efficiency of financial systems. The IMF/World Bank Bali FinTech Agenda in the field of FinTech defines it as advances in technology that can transform the provision of financial services, promoting the emergence of new business models, applications, processes, and products (
Schueffel 2016). Therefore, FinTech covers a wide range of activities, including such new areas as cryptocurrencies and the use of artificial intelligence for fraud detection, as well as other innovations in the field of traditional financial services.
FinTech can be divided into eight industry segments (
Imerman and Fabozzi 2020): payments and money transfers; digital banking; digital wealth managers, including robo-advisors; capital markets innovations, including algorithmic trading, high-frequency traders, and market analytics; FinTech lending, including P2P and marketplace lenders; equity crowdfunding; InsureTech, which refers to innovations in the insurance industry; PropTech, which refers to innovations in the property and real estate industry. “The emerging technologies that are being used across the above industry segments in FinTech include blockchain and distributed ledger technology (DLT), biometrics, quantum computing, cloud computing, open-source computing and APIs, big data analytics, machine learning (ML) and AI, Internet-of-Things (IoT) technology, and cybersecurity among others” (
Imerman and Fabozzi 2020).
Alshater et al. (
2022), having studied top influential articles on Islamic FinTech, stated that the studies on the blockchain, bitcoin, artificial intelligence, and NLP-based Islamic FinTech model, as well as the studies on the challenges for Islamic finance and banking in the post COVID-19 era, etc., are the most popular and cited.
Hudaefi (
2020) investigated the existing Islamic financial lending technologies in Indonesia to advance toward sustainable development goals in a local context. This work shows that FinTech companies promote the idea of financial accessibility by financing underdeveloped sectors such as agriculture and small and microenterprises. In addition, certain FinTech firms collect and distribute Islamic social funds (charitable contributions, donations), as well as initiate charitable programs for low-income segments of the population.
Suryono et al. (
2020), having reviewed 1002 articles from the ACM, IEEE, SCOPUS, and ScienceDirect databases, established the following research areas: payments research, risk management, investment, finance (crowdfunding and P2P lending), market aggregators, cryptocurrency, and blockchain technologies. The introduction of FinTech was the most common research topic (
Hu et al. 2019). The meta-analysis results show that the problems of FinTech research begin with the definition of a FinTech structure (
Eickhoff et al. 2017;
Basole and Patel 2018;
Abdullah et al. 2018, p. 7), as well as a business model and a model corresponding to the culture of each country (
Chandra et al. 2018).
Suryono et al. (
2020) also identified the main challenges reviewed in the articles: Framework and Model, Regulation and Policy, Regulator, Financial Ethics, Financial Literacy, Supervisory, Personal data protection, Customer Protection, Portfolio risk management, Collaboration, Security, Infrastructure, Payment Systems, Blockchain, Bitcoin, Technology, Robo-Advisor, and Digital Insurances.
Hu et al. (
2019) contributes to the literature on adopting Fintech services by providing a more comprehensive view of the determinants of users’ attitudes by combining the trust of Fintech services with TAM (technology acceptance model).
The study by
Bittini et al. (
2022) investigates the offer of services by Spanish FinTech companies to both end-consumers and B2C companies by conducting a survey of 186 companies. The polynomial logit regression study shows that the growing demand for FinTech services from other companies (B2B operations) can be identified with the presence of departments of sustainable development at FinTech companies.
The purpose of the study by
Dospinescu et al. (
2021) is to determine the importance level of different factors that influence consumer satisfaction regarding the use of FinTech technologies in Romania. The most important factors that influence the level of satisfaction when using FinTech services are as follows: comfort and ease of use, legal regulations, ease of account opening, mobile payments features, crowdfunding options, international money transfers features, reduced costs associated with transactions, peer-to-peer lending, insurances options, online brokerage, crypto coins options, and exchange options. The study is conducted on 162 people. Factor regression coefficients have been established for each category of FinTech users to help FinTech service providers make personalized decisions in order to maximize customer satisfaction levels. Research and tests conducted in this study show that the most important factors in terms of statistical significance for the degree of satisfaction in using FinTech services are legal regulations, crowdfunding options, reduced costs, insurances options, online brokerage features, and exchange options (for the Millennials), while for the Generation Z users, international money transfer features, reduced costs, and exchange options are important. The study also highlights the fact that customers with different socio-demographic characteristics (excluding the division between Millennials and Generation Z) do not differ in terms of the level of satisfaction offered by FinTech services.
The objective of M.
Grabowski’s (
2022) research is to present the two existing virtual account models operating in the European Union, examine their legal validity, and identify legal problems in the operation of these models associated with IBAN and vIBAN virtual accounts. There have been identified the most acute problems which require prompt regulation at the European level and related to the current deposit protection scheme as well as to administrative constraints in certain member states that may cause difficulties in the provision of vIBAN services to business entities.
Moreira-Santos et al. (
2022) devoted their study to an in-depth analysis of FinTech, as well as the factors that have led to its implementation, consequences, etc. Having analyzed the survey data of 49 firms that are FinTech clients in Portugal, the authors examine the positive and significant impact of technological context (perceived convenience, usefulness, and efficiency as well as perceived security and trust) and organizational context (reducing environmental footprint and decreasing internal costs) on the intention to introduce FinTech services. As a result, it was found that consumer trends and perception of reputation have a positive and significant impact on the intention of small and medium-sized enterprises to introduce FinTech. The constraining effect of the environmental context on the relationship between the technological context and the intention to introduce FinTech by small and medium-sized enterprises is partially proven, although the same is not confirmed regarding the relationship between the organizational context and the intention to introduce FinTech.
Bao and Roubaud (
2022) have devoted their research to Recent Development in Fintech, to Non-Fungible Tokens in particular.
However, the authors did not mention the impact of FinTech on countries’ financial development, so it is necessary to close this gap.
Despite the fact that FinTech research is a fairly new field due to poor data availability, the impact of FinTech on the countries’ financial development has been studied by the following authors:
Leong et al. (
2017),
Jagtiani and Lemieux (
2018),
Skwierawska (
2019),
Cole et al. (
2019),
Chien et al. (
2020),
Giri et al. (
2021),
Sinha and Shastri (
2021),
Aduba et al. (
2022),
Tran and Huynh (
2022),
Yao et al. (
2021), and others.
Chien, Cheng, and Kurniawati (
Chien et al. 2020) studied linear and non-linear effects of information and communication technology (ICT) on financial development in 81 countries over the period 1990–2015. A smooth non-linear impact of the spread of ICT on financial development has been determined, in which the effect of ICT diffusion on financial development is positive in the lower level of ICT diffusion but turns negative in the higher level of ICT diffusion.
Other authors have also identified a link between the development of technology and financial development in India (
Giri et al. 2021) and Tunisia (
Festa et al. 2022).
The research by
Sinha and Shastri (
2021) emphasizes that improvements in technology are critical to improving local investment in the form of domestic household savings, which ultimately contributes to the financial development of the country.
Aduba et al. (
2022) have found that financial technology penetration stimulates financial development in countries with lower financial accessibility and poorer financial development index. These results show that despite poor financial infrastructure and weak financial performance, financial development in developing countries and countries with emerging market economies can be improved by implementing appropriate policies that foster innovation in financial technology.
The article by
Tran and Huynh (
2022) empirically examines the impact of information and communication technology (ICT) on financial development as expressed by the domestic credit-to-GDP ratio and the money supply-to-GDP ratio in ten ASEAN countries over the period 2000–2020. It states that ICT fosters financial development on both indicators. The impact of ICT on financial development, mediated by the money supply-to-GDP ratio, is stronger than the impact mediated by the domestic credit-to-GDP ratio. The results confirm the use of ICT to accelerate financial development in ASEAN countries.
The purpose of our research is to determine the impact of financial technology (FinTech) on financial development in EU countries.
In what way does FinTech affect Financial Institutions Access, Financial Institutions Depth, Financial Institutions Efficiency, Financial Markets Access, Financial Markets Depth, and Financial Markets Efficiency? The hypothesis is that there is a linear relationship between Financial Institutions Access, Financial Institutions Depth, Financial Institutions Efficiency, Financial Markets Access, Financial Markets Depth, Financial Markets Efficiency, and FinTech development in the EU countries in 2020.
2. Design and the Sample of the Research
To investigate the impact of financial technology on financial development, the authors use the FinTech Index (
Simon Hardie 2020). The index is based on three criteria: the number of FinTech companies, their achievements, and work environment indicators by country group. The index is based on objective data. FinTech is any business that uses technology-activated innovations specifically designed to provide or distribute financial services (
Simon Hardie 2020).
The lowest Global FinTech Index value is in Slovakia and comprises 1.24; the highest value is in Sweden and comprises 13.14. The median value for the EU countries is 4.41; the mean value is 5.57, and the standard deviation is 3.4 (
Table 1).
Low indicators in some EU countries may result from excessive regulation of financial technology development. There are also problems in attracting skilled labor and the environment that is not very supportive of new developments in the sphere of finance. Some researchers (
Rupeika-Apoga and Wendt 2021) believe that financial technology regulation requires to be modernized and harmonized in order to create equal conditions for all market participants: FinTech companies, traditional financial service providers, and those who initially integrated FinTech solutions into their business model.
Indexes of financial development (Rethinking Financial Deepening: Stability and Growth in Emerging Markets) in the EU countries in 2020 reflect on financial development within the given research.
The definition of financial development and its structure is described in more detail in work by the World Bank (
Čihák et al. 2012) in the late 1980s to reflect the relationship between the saturation of economic resources, the complexity, and fragmentation of the financial and monetary system, on the one hand, and economic growth rates, on the other (
World Bank 2012).
Financial development can also be described using quantitative characteristics based on the results of its development: depth, access, efficiency, and stability (
Levine 2004). It is possible to gain an understanding of the role of a financial market in an economy on the basis of the indicators of financial depth that are relative indicators demonstrating the proportion of a particular segment of this market in relation to GDP. At the macroeconomic level, the depth of a public financial market is usually defined as the ratio of aggregate financial claims and liabilities to GDP and shows the extent to which corporations, households, and public institutions can finance their activities through the financial market and financial intermediaries. This indicator is very close to the indicator of saturation of commodity turnover in the country with monetary and financial instruments and reflects the development of financial architecture, which generally provides opportunities for assessment, accumulation, and distribution of monetary resources to meet the needs of economic growth. Access to financial services (financial integration) means that businesses and households have access to financial services and are able to effectively use services that meet their needs. Financial services must be provided responsibly, economically, and continuously under the conditions of appropriate regulations. Expanding access to financial services reduces inequality, accelerates economic growth, and increases competition and labor demand (
Beck et al. 2010,
2007a,
2007b). According to the
World Bank (
2005), access to financial services includes four areas: savings, loans, banking, and insurance. The availability of financial services means that there are no barriers to the use of these services, neither in terms of price nor non-price barriers to accessing finance. It is important to distinguish between access to financial services and the actual use of these services. Sometimes an individual or legal entity has access to services but decides not to use them. Failure to address this difference can make it difficult to identify and measure the availability of financial services. Malfunctions in financial markets, such as asymmetries of information and transaction costs, are likely to be particularly significant for micro- and small-sized businesses that lack the collateral to access finance, credit history, or necessary contacts. The aspect of access to finance was not examined in the traditional literature about the financial system characteristics, mainly because of the lack of serious data on who has access to financial services, as well as the lack of systematic information on barriers that impede the expansion of the access. The financial literature explores the low level of access to financial services in the context of social exclusion and isolation of disadvantaged segments of society.
Carbo et al. (
2005) and
Conroy (
2005) believe that financial exclusion is the inability of certain poor and disadvantaged groups to access the financial system.
Mohan (
2006) believes that the availability of financial services is low when certain segments of the population and groups do not have access to inexpensive and secure financial products and services they need from major suppliers. Therefore, we can conclude that the low availability of financial services mainly affects disadvantaged segments of society. Finance efficiency. In order to be able to perform its functions well, the financial sector should be efficient; it should perform its intermediary functions well. If the use of mediation services is expensive, these costs are borne by households and businesses. The efficiency of the financial sector can be assessed using both the performance indicators of the financial mediation sector itself and of its efficiency as an intermediary for investment capital. Therefore, when assessing the key performance indicator of the banking system—deposits to credit rates ratio—it can be noted that it is close to the average for the countries with developing markets. However, a number of other indicators, such as non-interest income to total income ratio, and overheads to assets ratio, reflect the fact that credit institutions cover their operating costs from income that is not related to their core business. Financial stability is a significant feature of the financial sector. The systemic risk identification is thoroughly studied in a large number of literature sources. Since financial stability is of paramount importance for macroeconomic stability, it is sometimes considered in isolation, out of the concept of financial development. Financial stability is an important feature of financial systems, which is closely linked to the broader process of financial development (
Loayza and Ranciere 2006).
The authors believe that financial development is a complex concept that reflects the indicators of financial markets and financial indicators of institutions—financial depth, access to financial services (financial integration), financial efficiency, and financial stability, which quantitatively change in the process of globalization, convergence, liberalization, and digital transformation, and characterize a certain country or region.
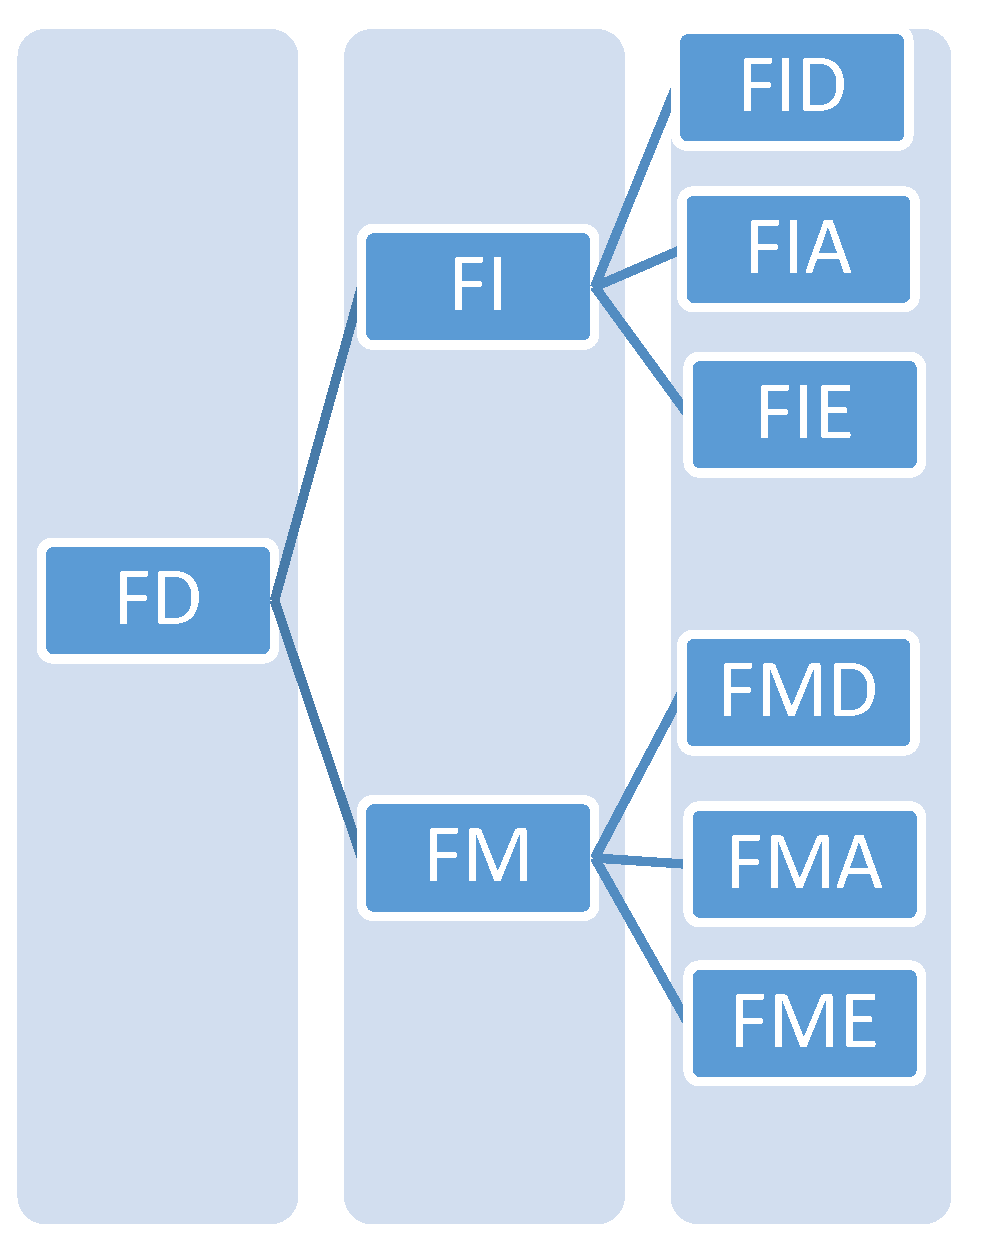
Therefore, the Financial Development Index has the following structure (
Figure 1):
Note: FD—financial development; FI—financial institutions; FM—financial markets; FID—financial institutions depth; FIA—financial institutions access; FIE—financial institutions efficiency; FMD—financial markets depth; FMA—financial markets access; FME—financial markets efficiency. FID—financial institutions depth (private-sector credit (% of GDP), pension fund assets (% of GDP), mutual fund assets (% of GDP), insurance premiums, life and non-life (% of GDP)). FIA—financial institutions access (branches (commercial banks) per 100,000 adults; ATMs per 100,000 adults). FIE—financial institutions efficiency (net interest margin; lending-deposits spread; non-interest income to total income; overhead costs to total assets; return on assets; return on equity). FMD—financial markets depth (stocks market capitalization to GDP; stocks traded to GDP; international debt securities government (% of GDP); total debt securities of nonfinancial corporations (% of GDP); total debt securities of financial corporations (% of GDP). FMA—financial markets access (percent of market capitalization outside of top 10 largest companies; the total number of issuers of debt (domestic and external, nonfinancial corporations, and financial corporations)). FME—financial markets efficiency (stock market turnover ratio (stocks traded/capitalization)) (
Čižo et al. 2020).
Each indicator is standardized on the interval from 0 to 1. The lowest value of the indicator by country is zero, and all other values are measured relative to this minimum value. To avoid the pitfalls resulting from extreme data, values of the variables for the 5th and 95th percentiles are defined as cut-off levels. The indicators are defined in such a way that higher values indicate greater financial development. The indicators are then combined into six sub-indices at the bottom of the pyramid (see the Figure above). The aggregation is a weighted average of the baseline series, where weights are the squares of factor loadings from the principal component analysis so that their sum is 1. Finally, the sub-indices are similarly aggregated into higher indices using the principal component factor analysis, and the Financial Development Index is aggregated in a similar way (
Čižo et al. 2020).
Figure 2 shows the values of the Financial Development Index in the EU countries in 2020.
Spain (0.81), France (0.78), and Italy (0.75) have the highest values of the Financial Development Index, while Lithuania (0.21) and Latvia (0.22) demonstrate the lowest index values. There is a clear division of the EU countries into two groups: in the group of the old EU countries, the indicator values are higher than the EU average; in the group of the new EU countries, including countries with a former planned economy (Lithuania, Latvia, Romania, Estonia, Slovakia, Bulgaria, Slovenia, Hungary, Poland, Czech Republic, Croatia, Greece, and Cyprus) the indicator values are lower than the EU average value.
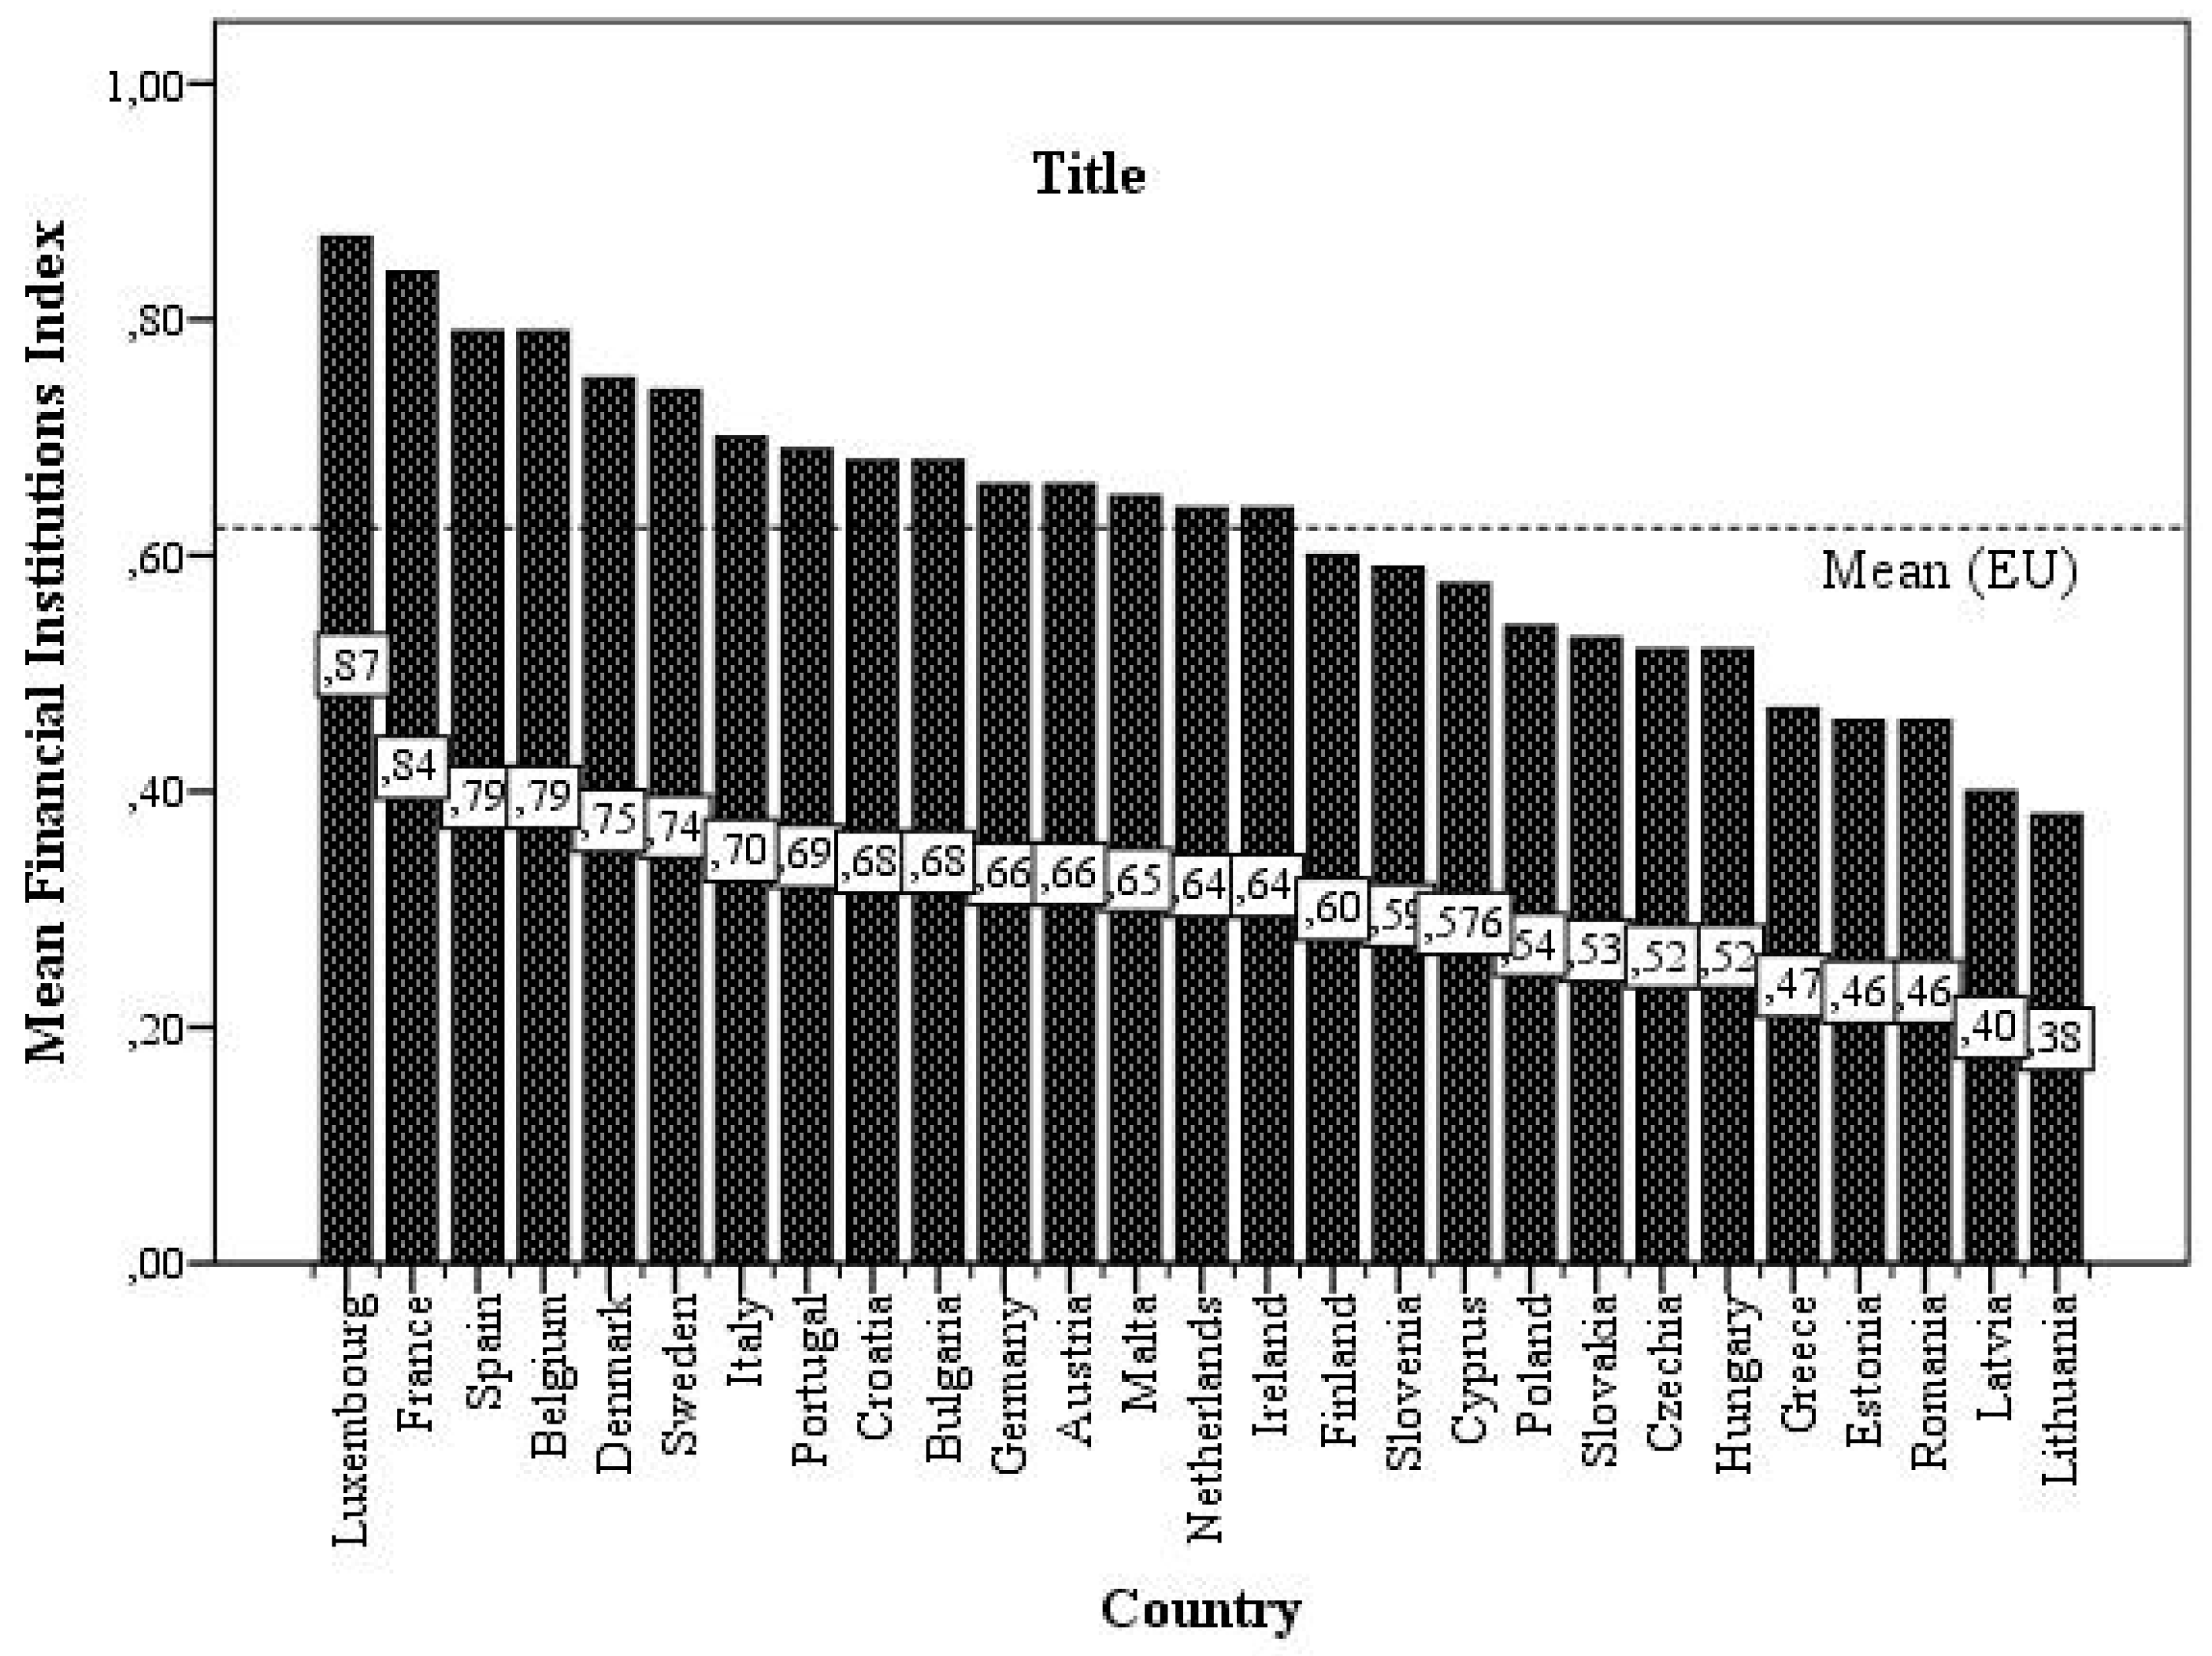
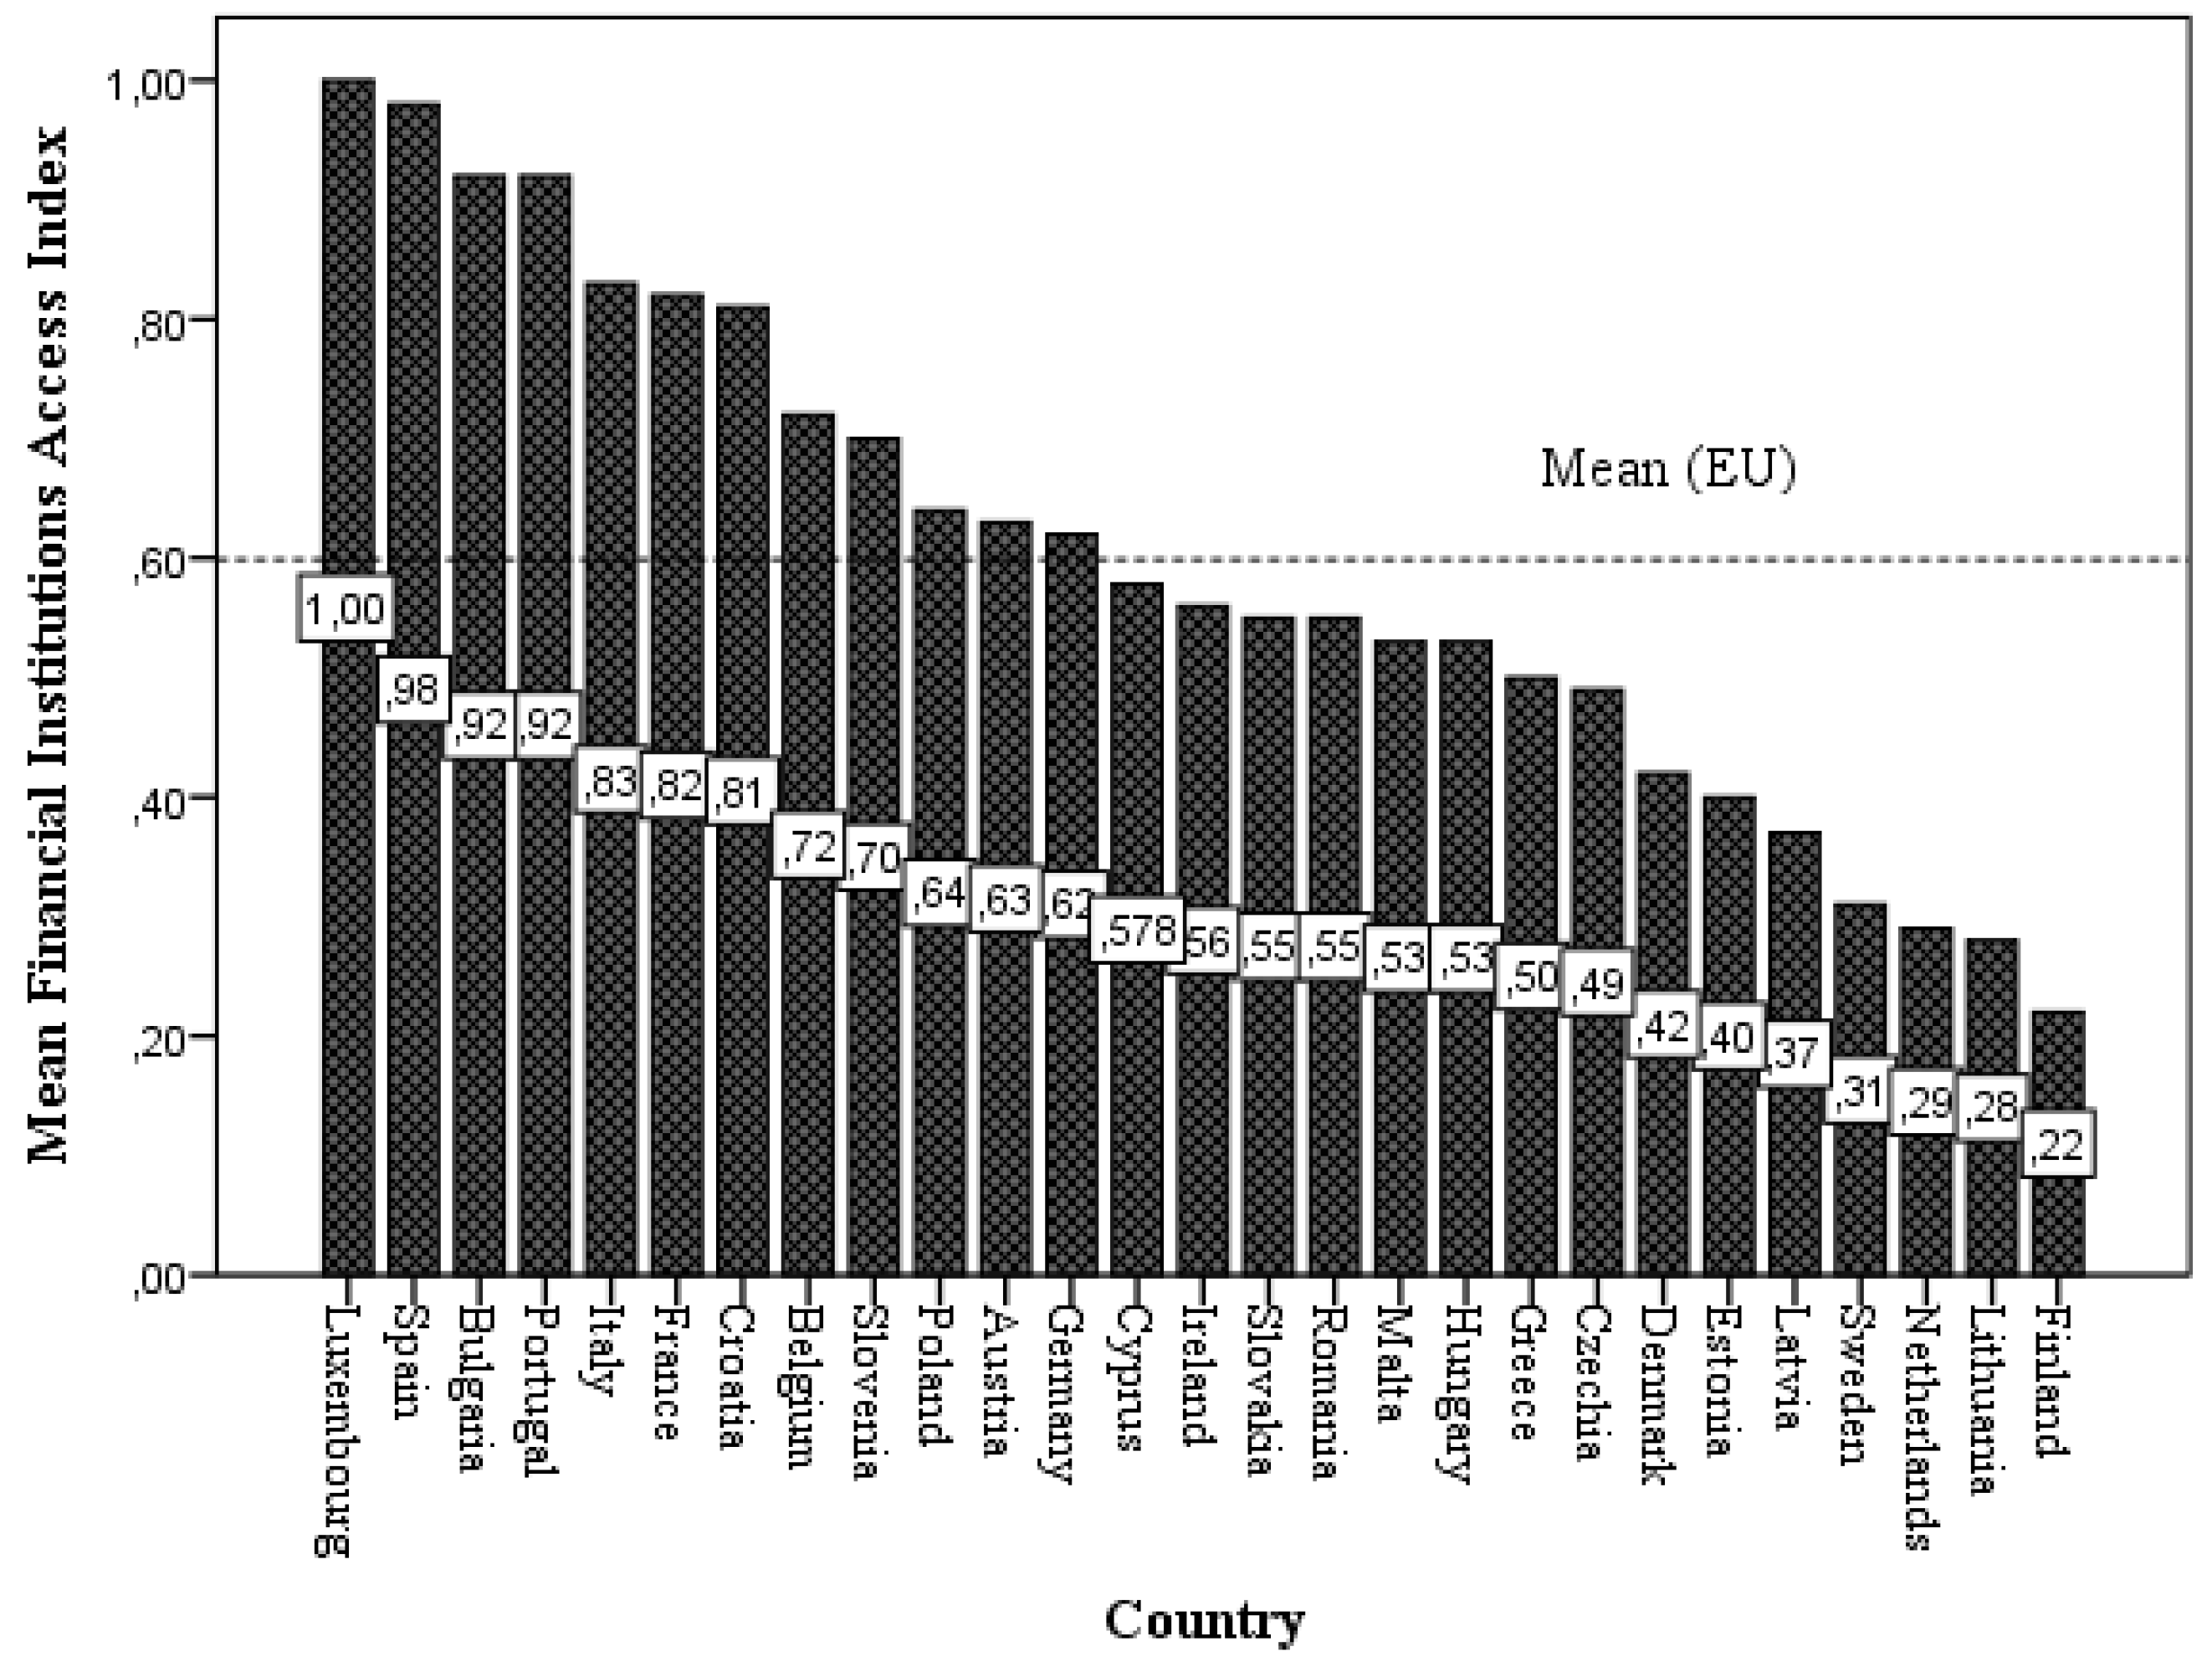
A similar situation is observed when we deal with the values of the financial institutions sub-index: the sub-index values in Lithuania, Latvia, Romania, Estonia, Greece, Hungary, the Czech Republic, Slovakia, Poland, Cyprus, Slovenia, and Finland are below the EU average. It is noteworthy that Bulgaria and Croatia (0.68) have relatively high sub-index values (see
Figure 3).
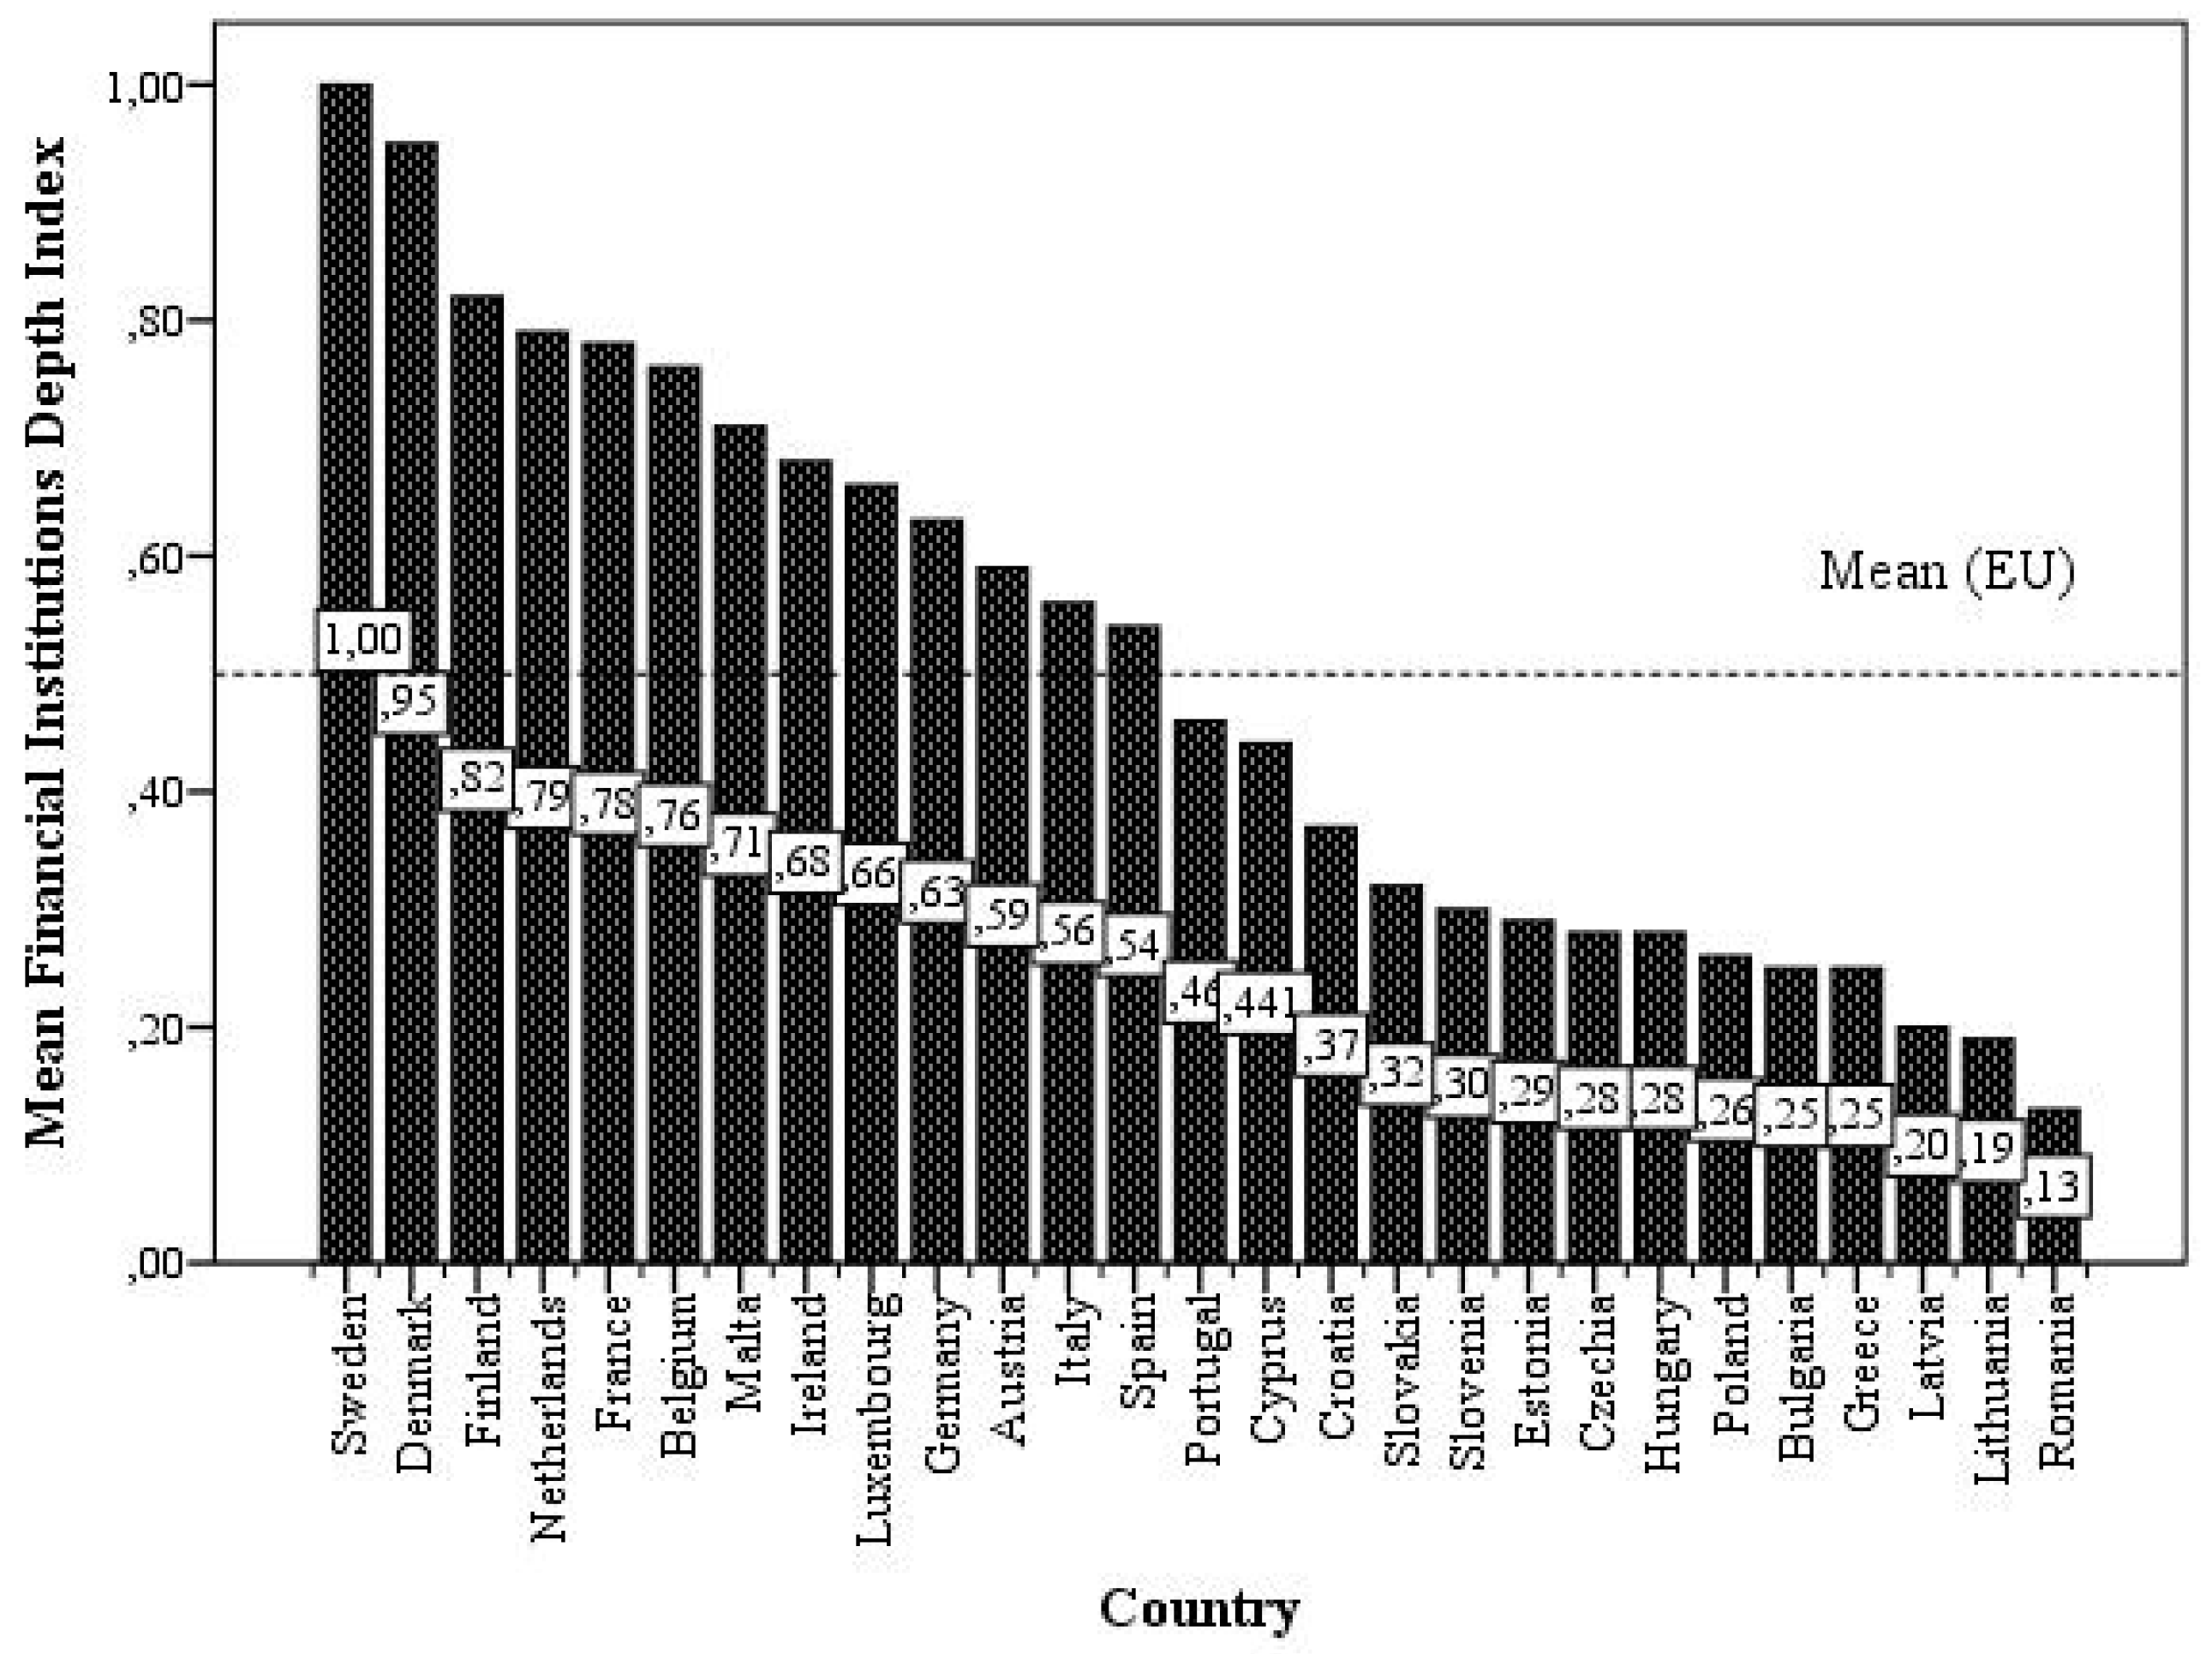
The Financial Institutions Depth sub-index also reflects the situation which characterizes two groups of countries (the group of old countries and the group of countries that include former planned economies) by the values of the sub-index being above and below the EU average (see
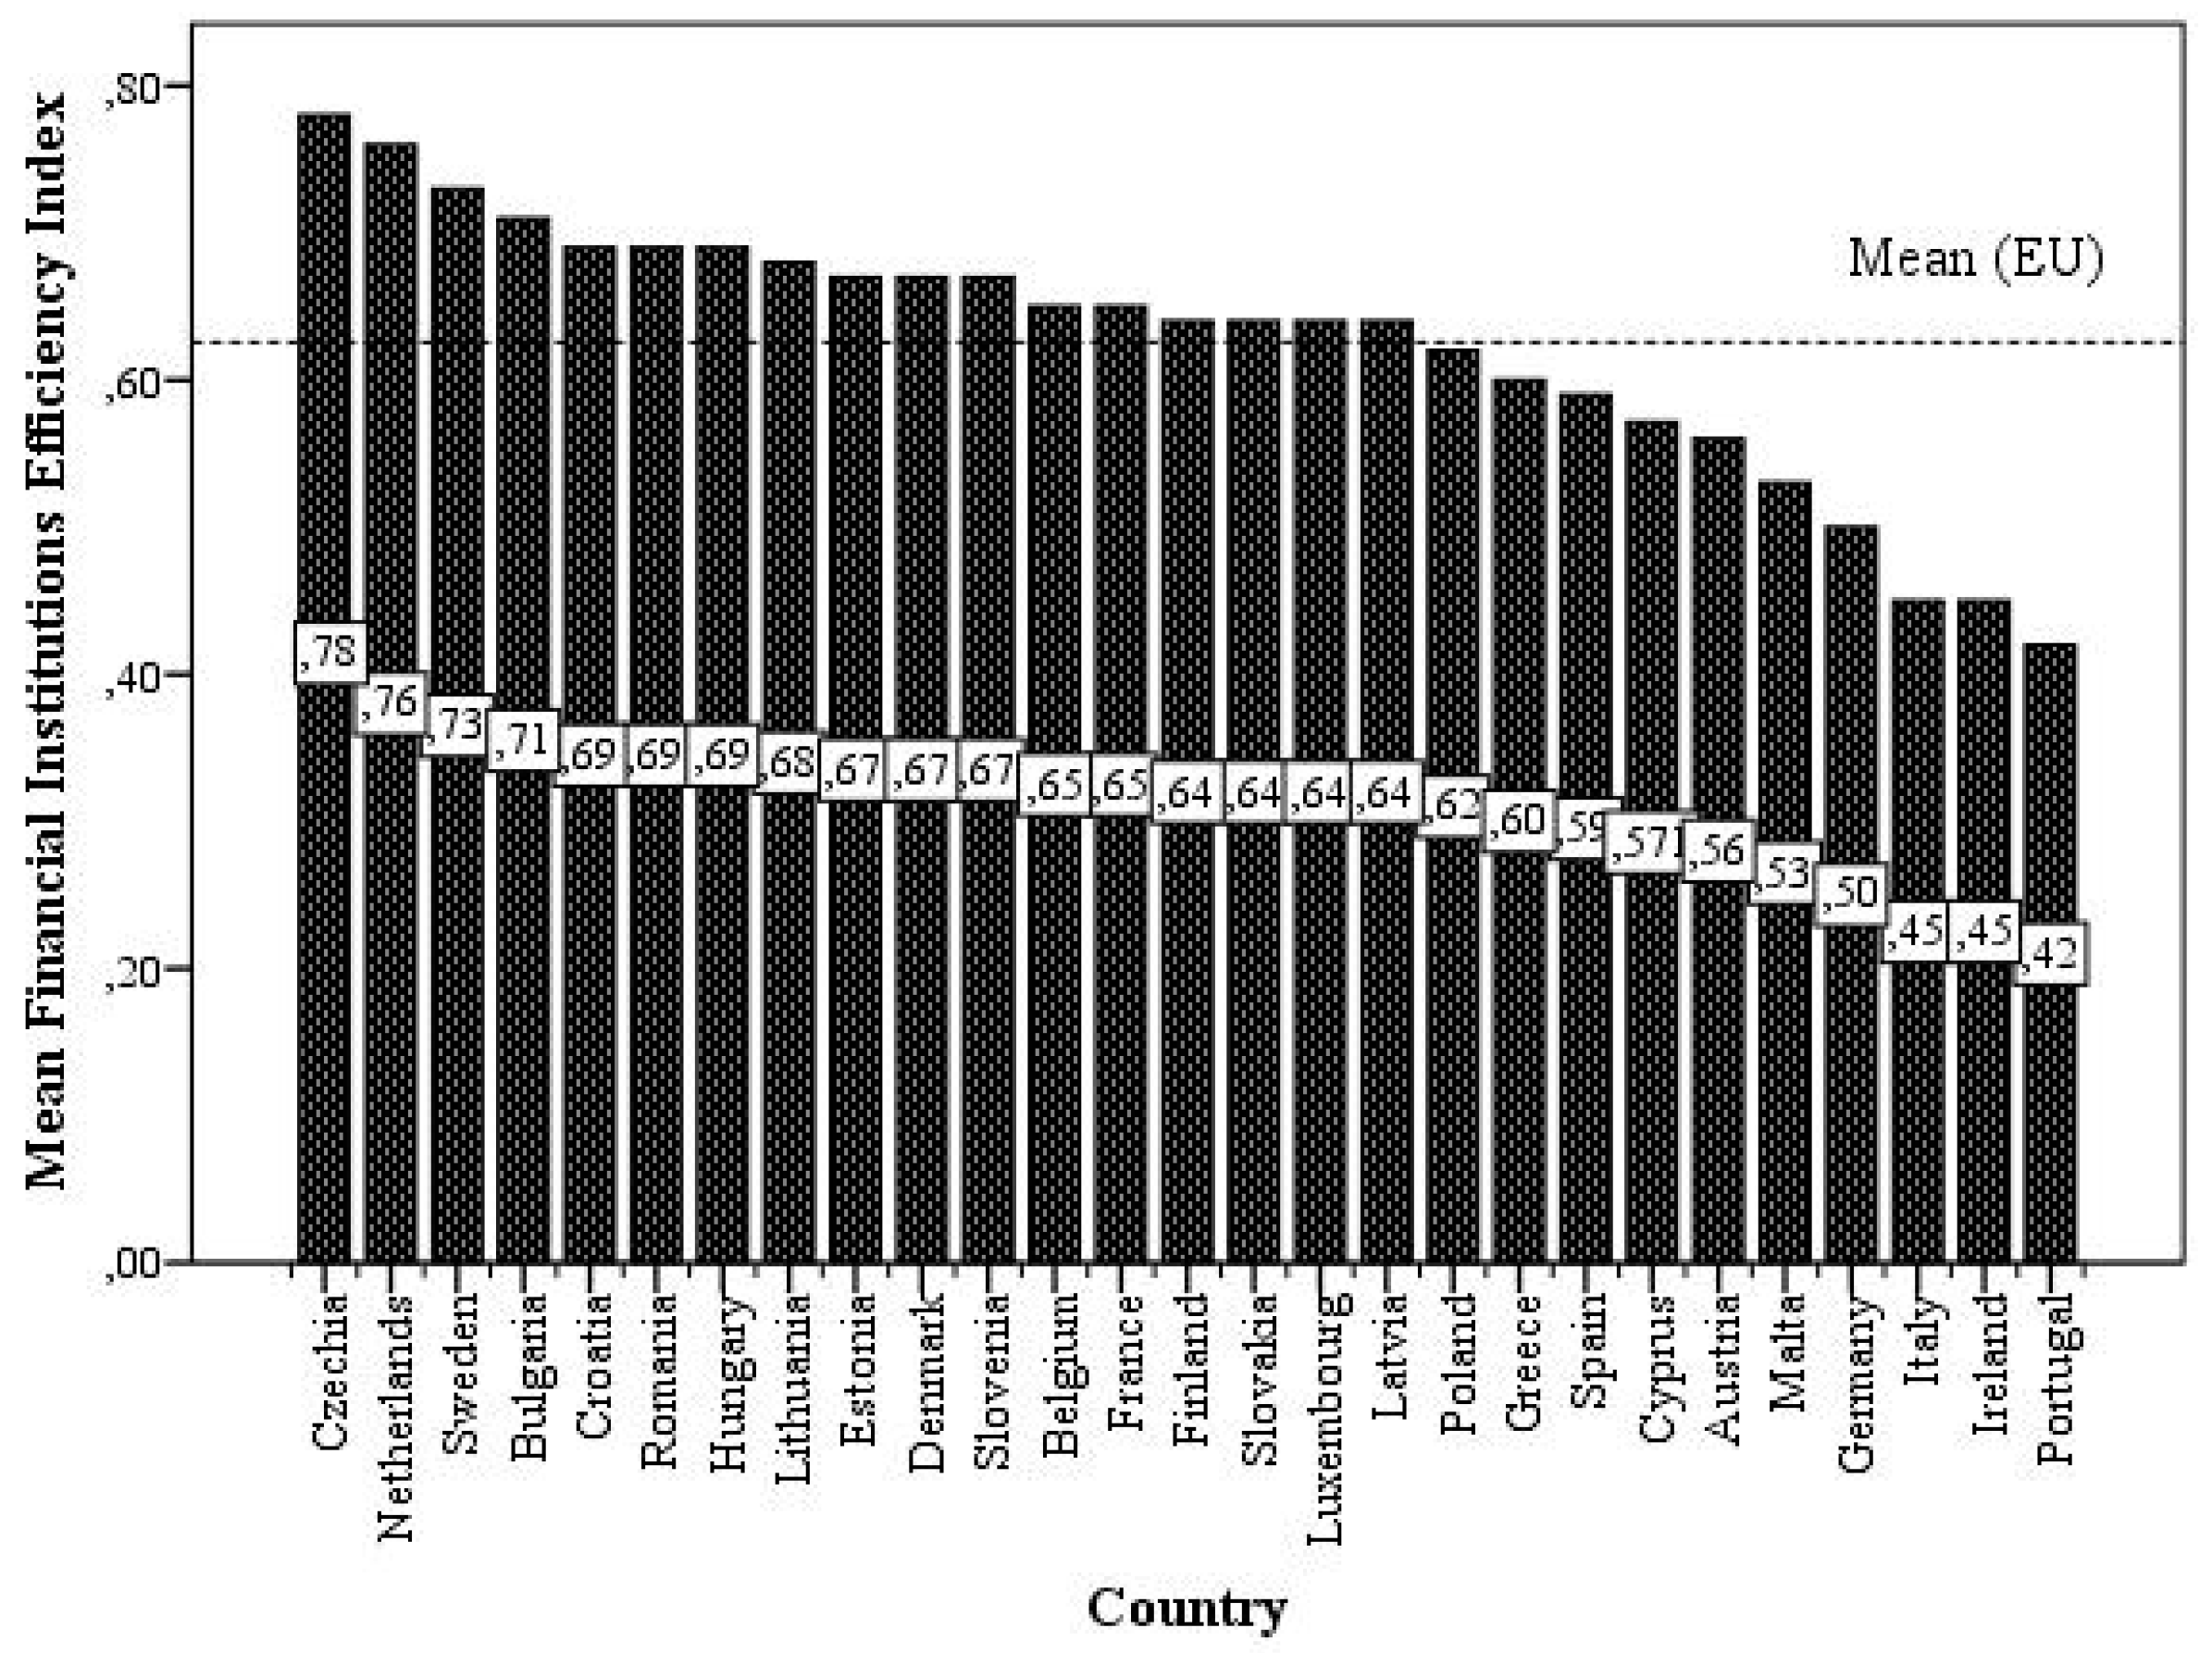
Appendix A). Values of the Financial Institutions Efficiency sub-index and Financial Intuitions Access sub-index are also provided in
Appendix A.
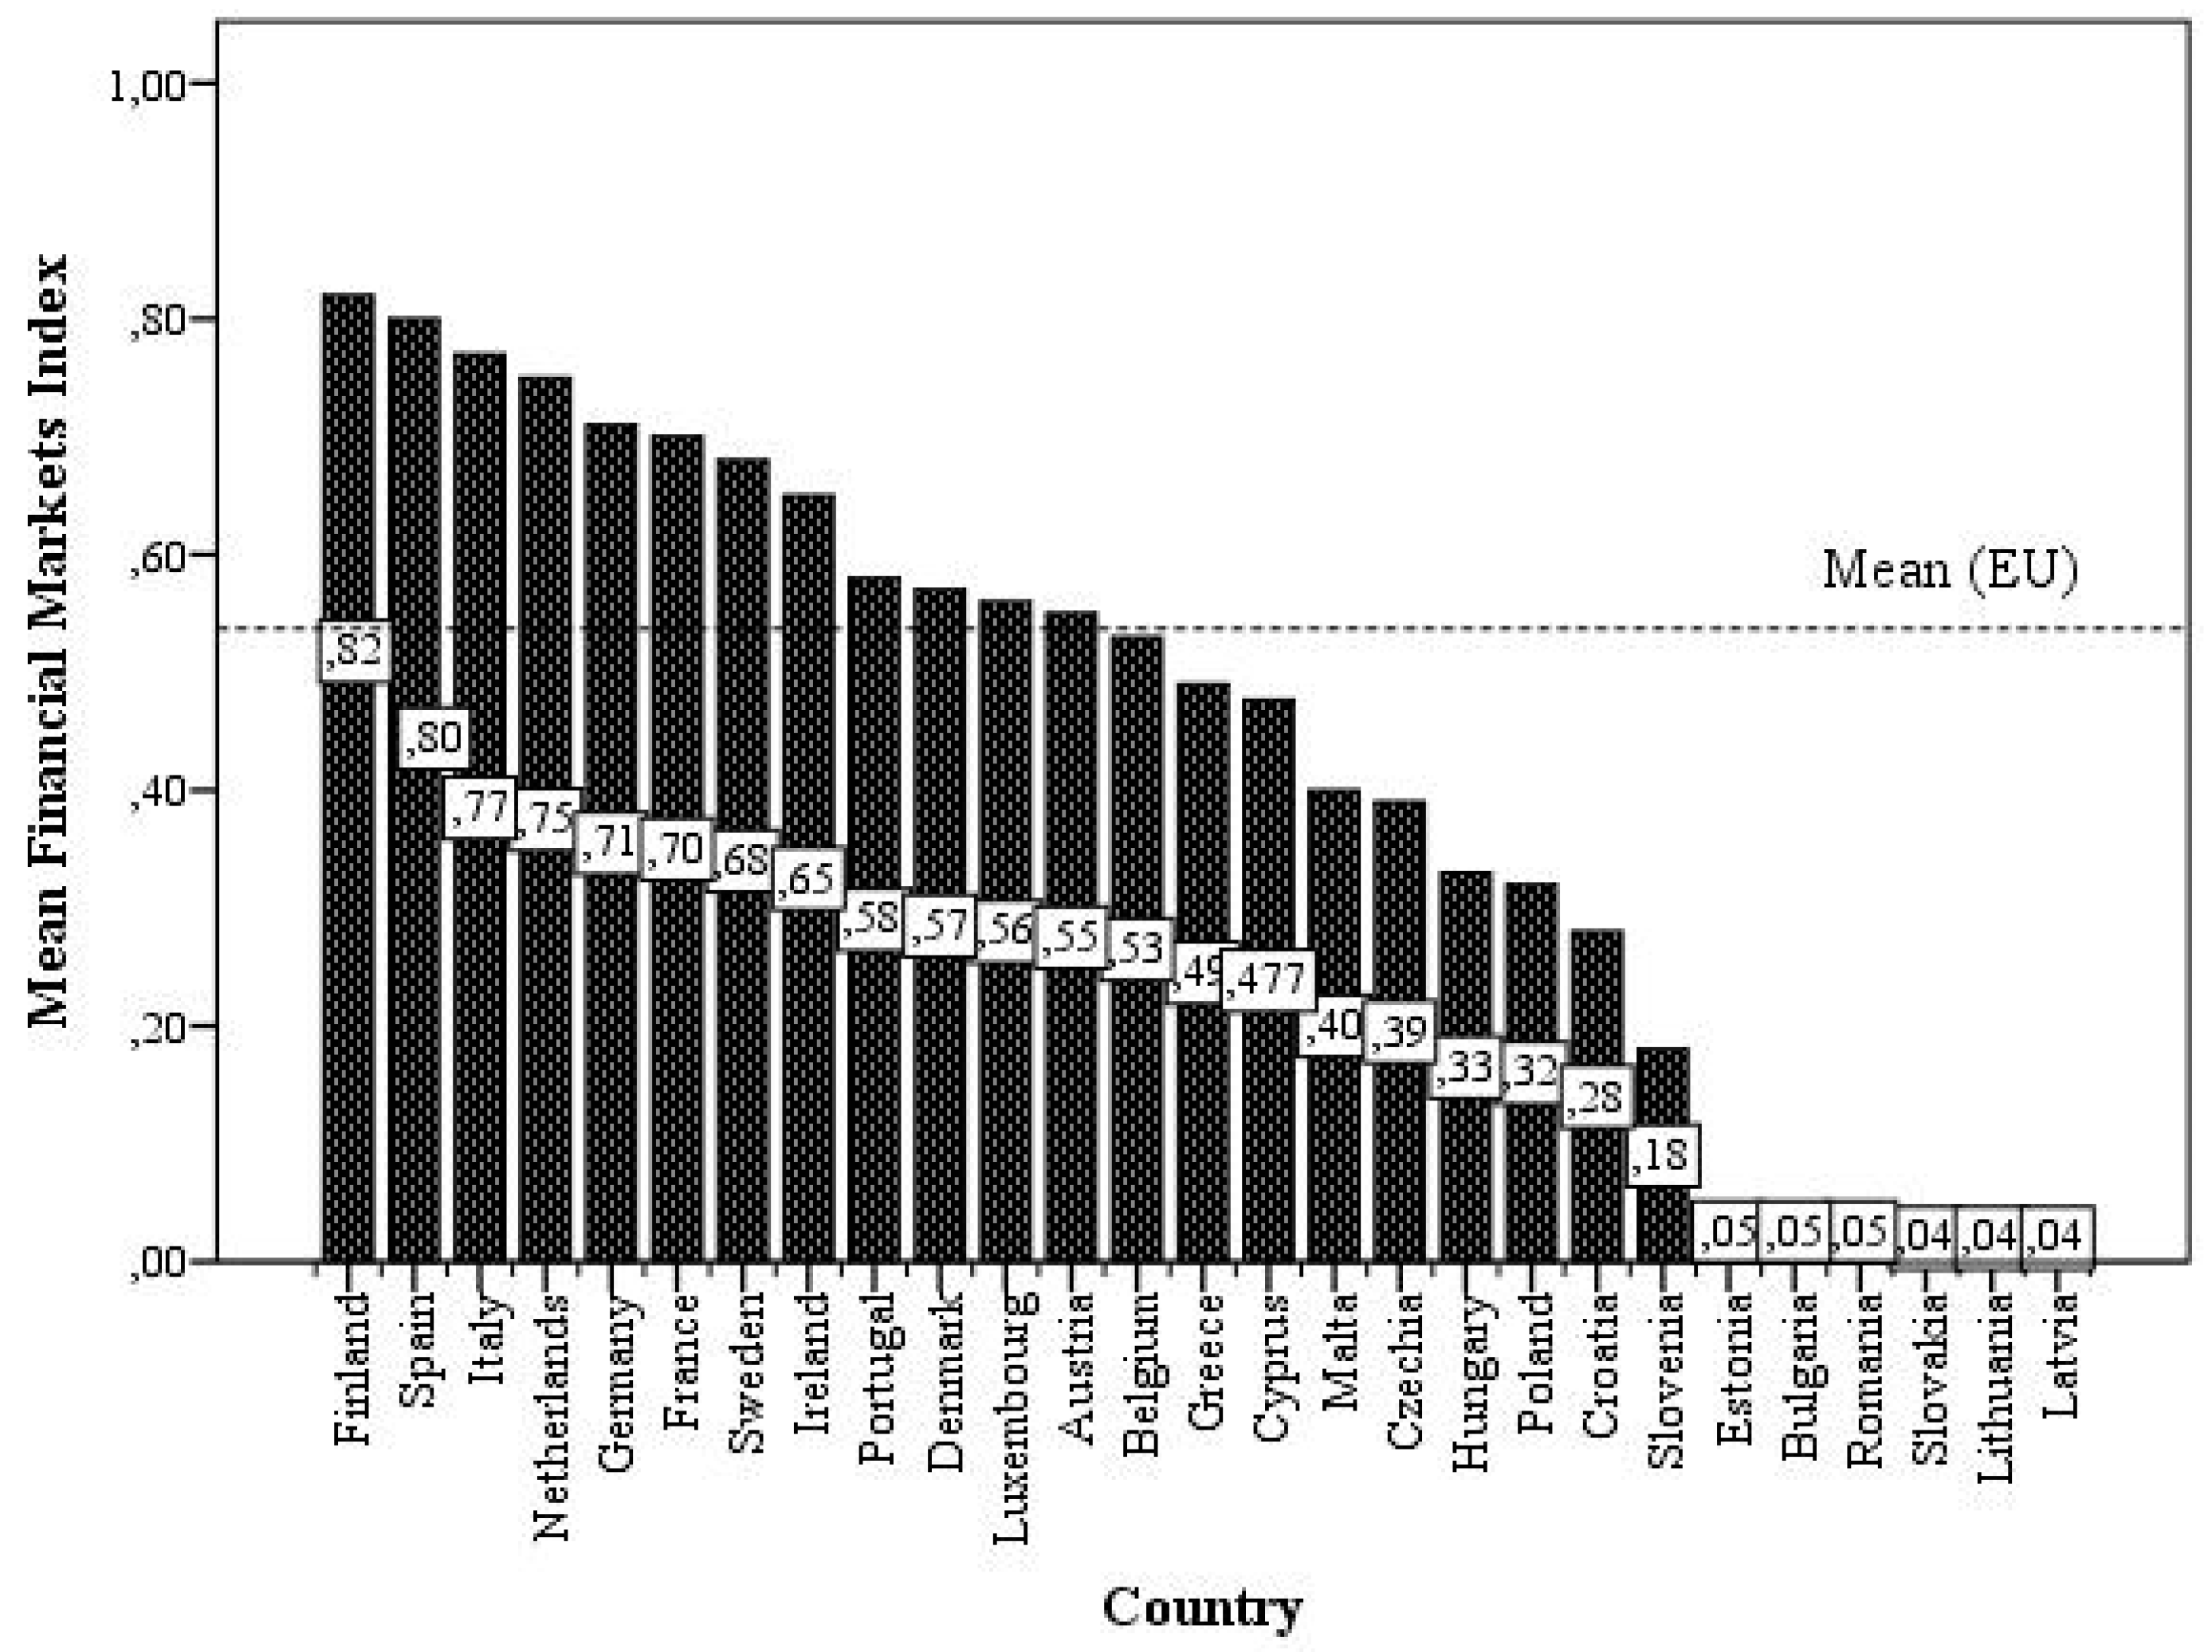
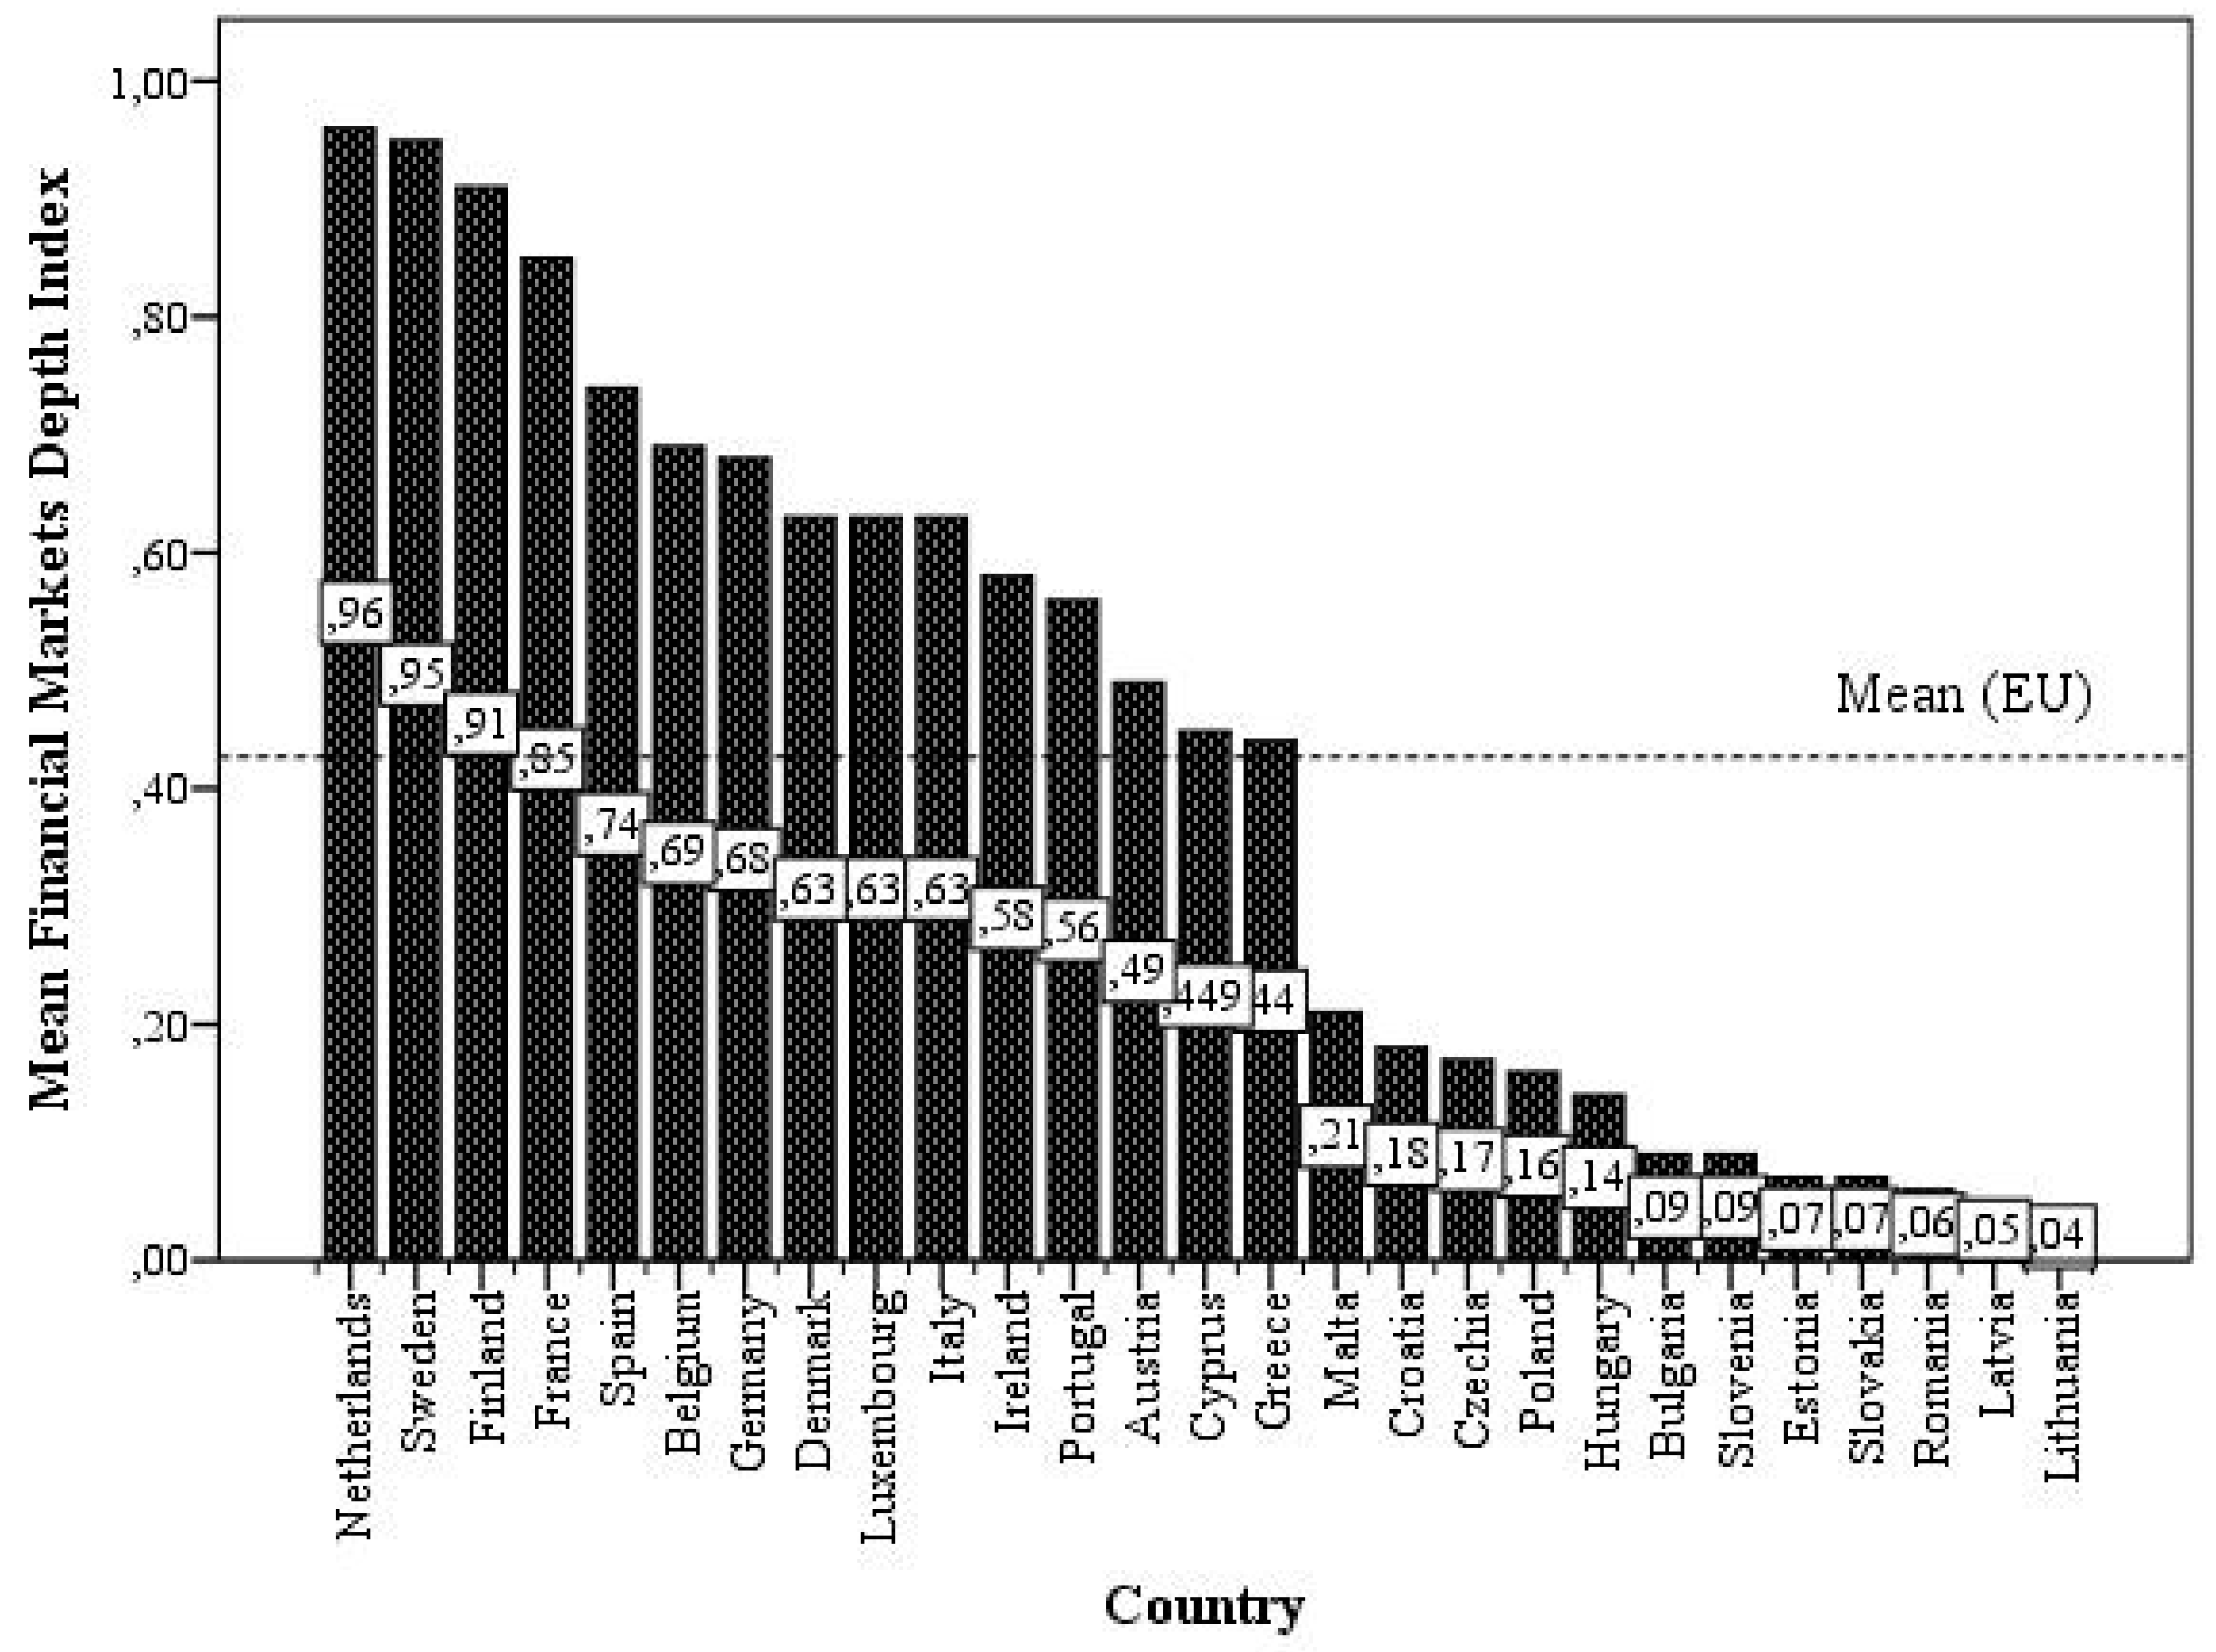
The most depressing situation is with the values of the Financial Markets sub-index (see
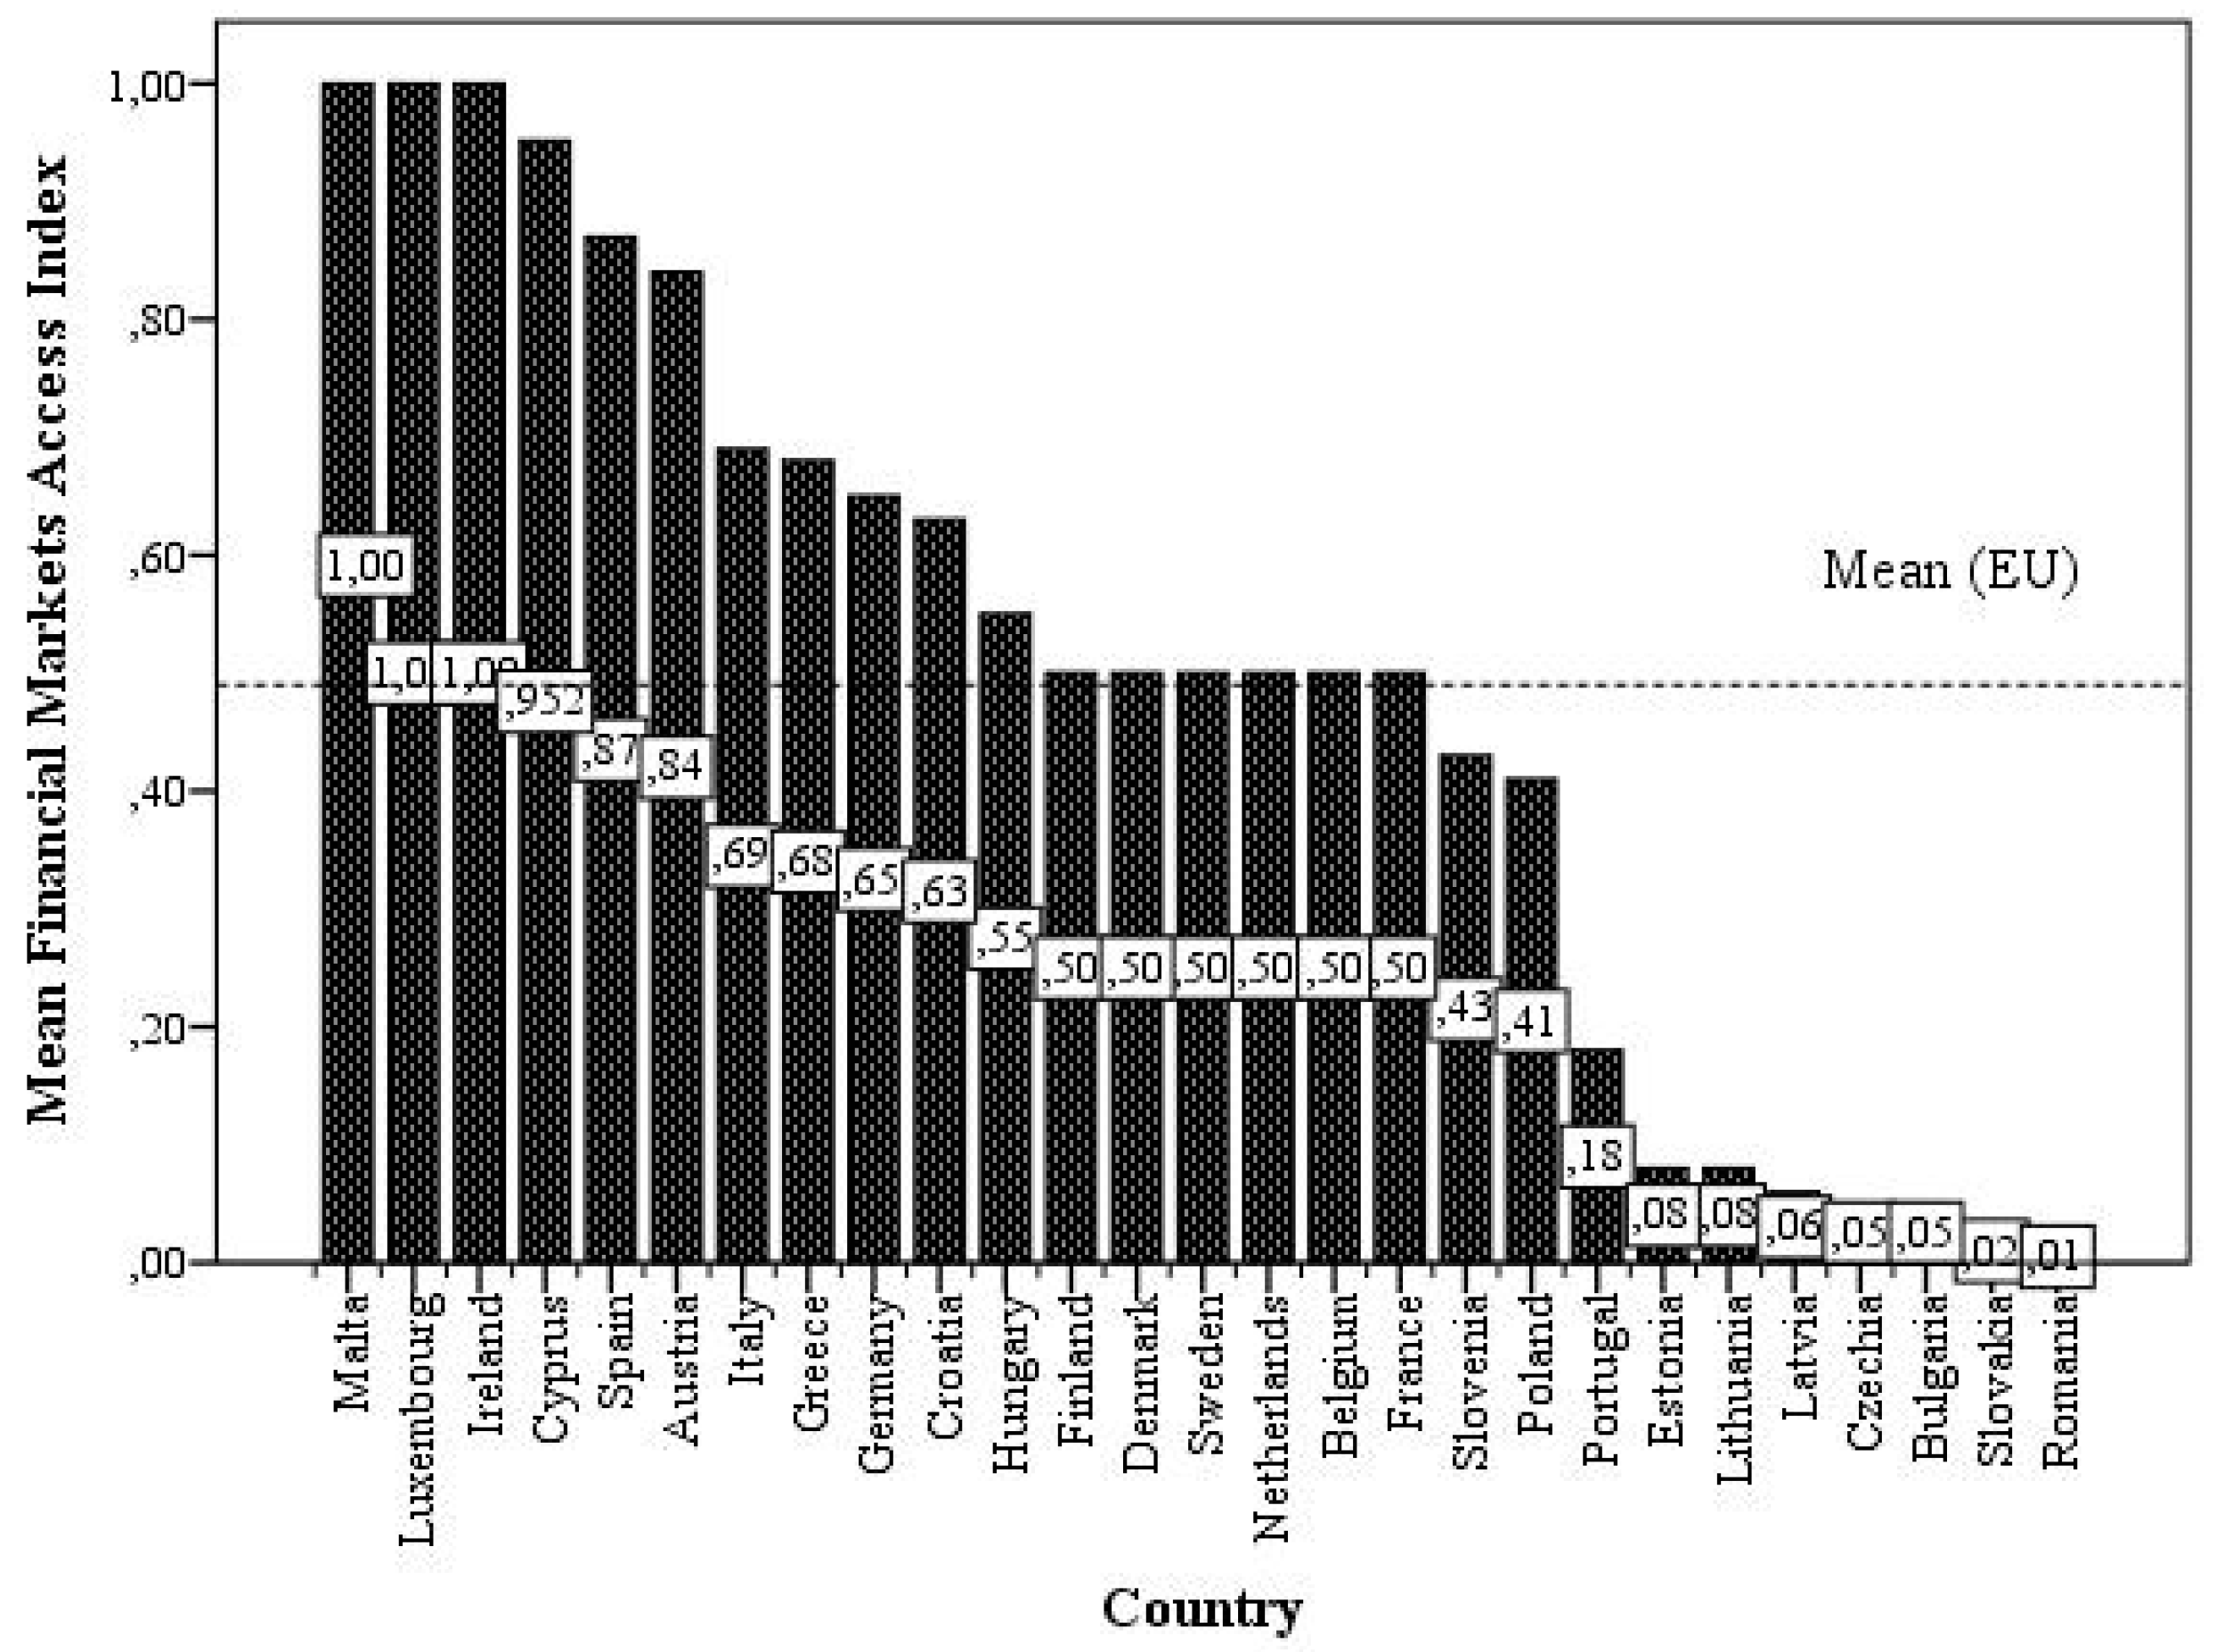
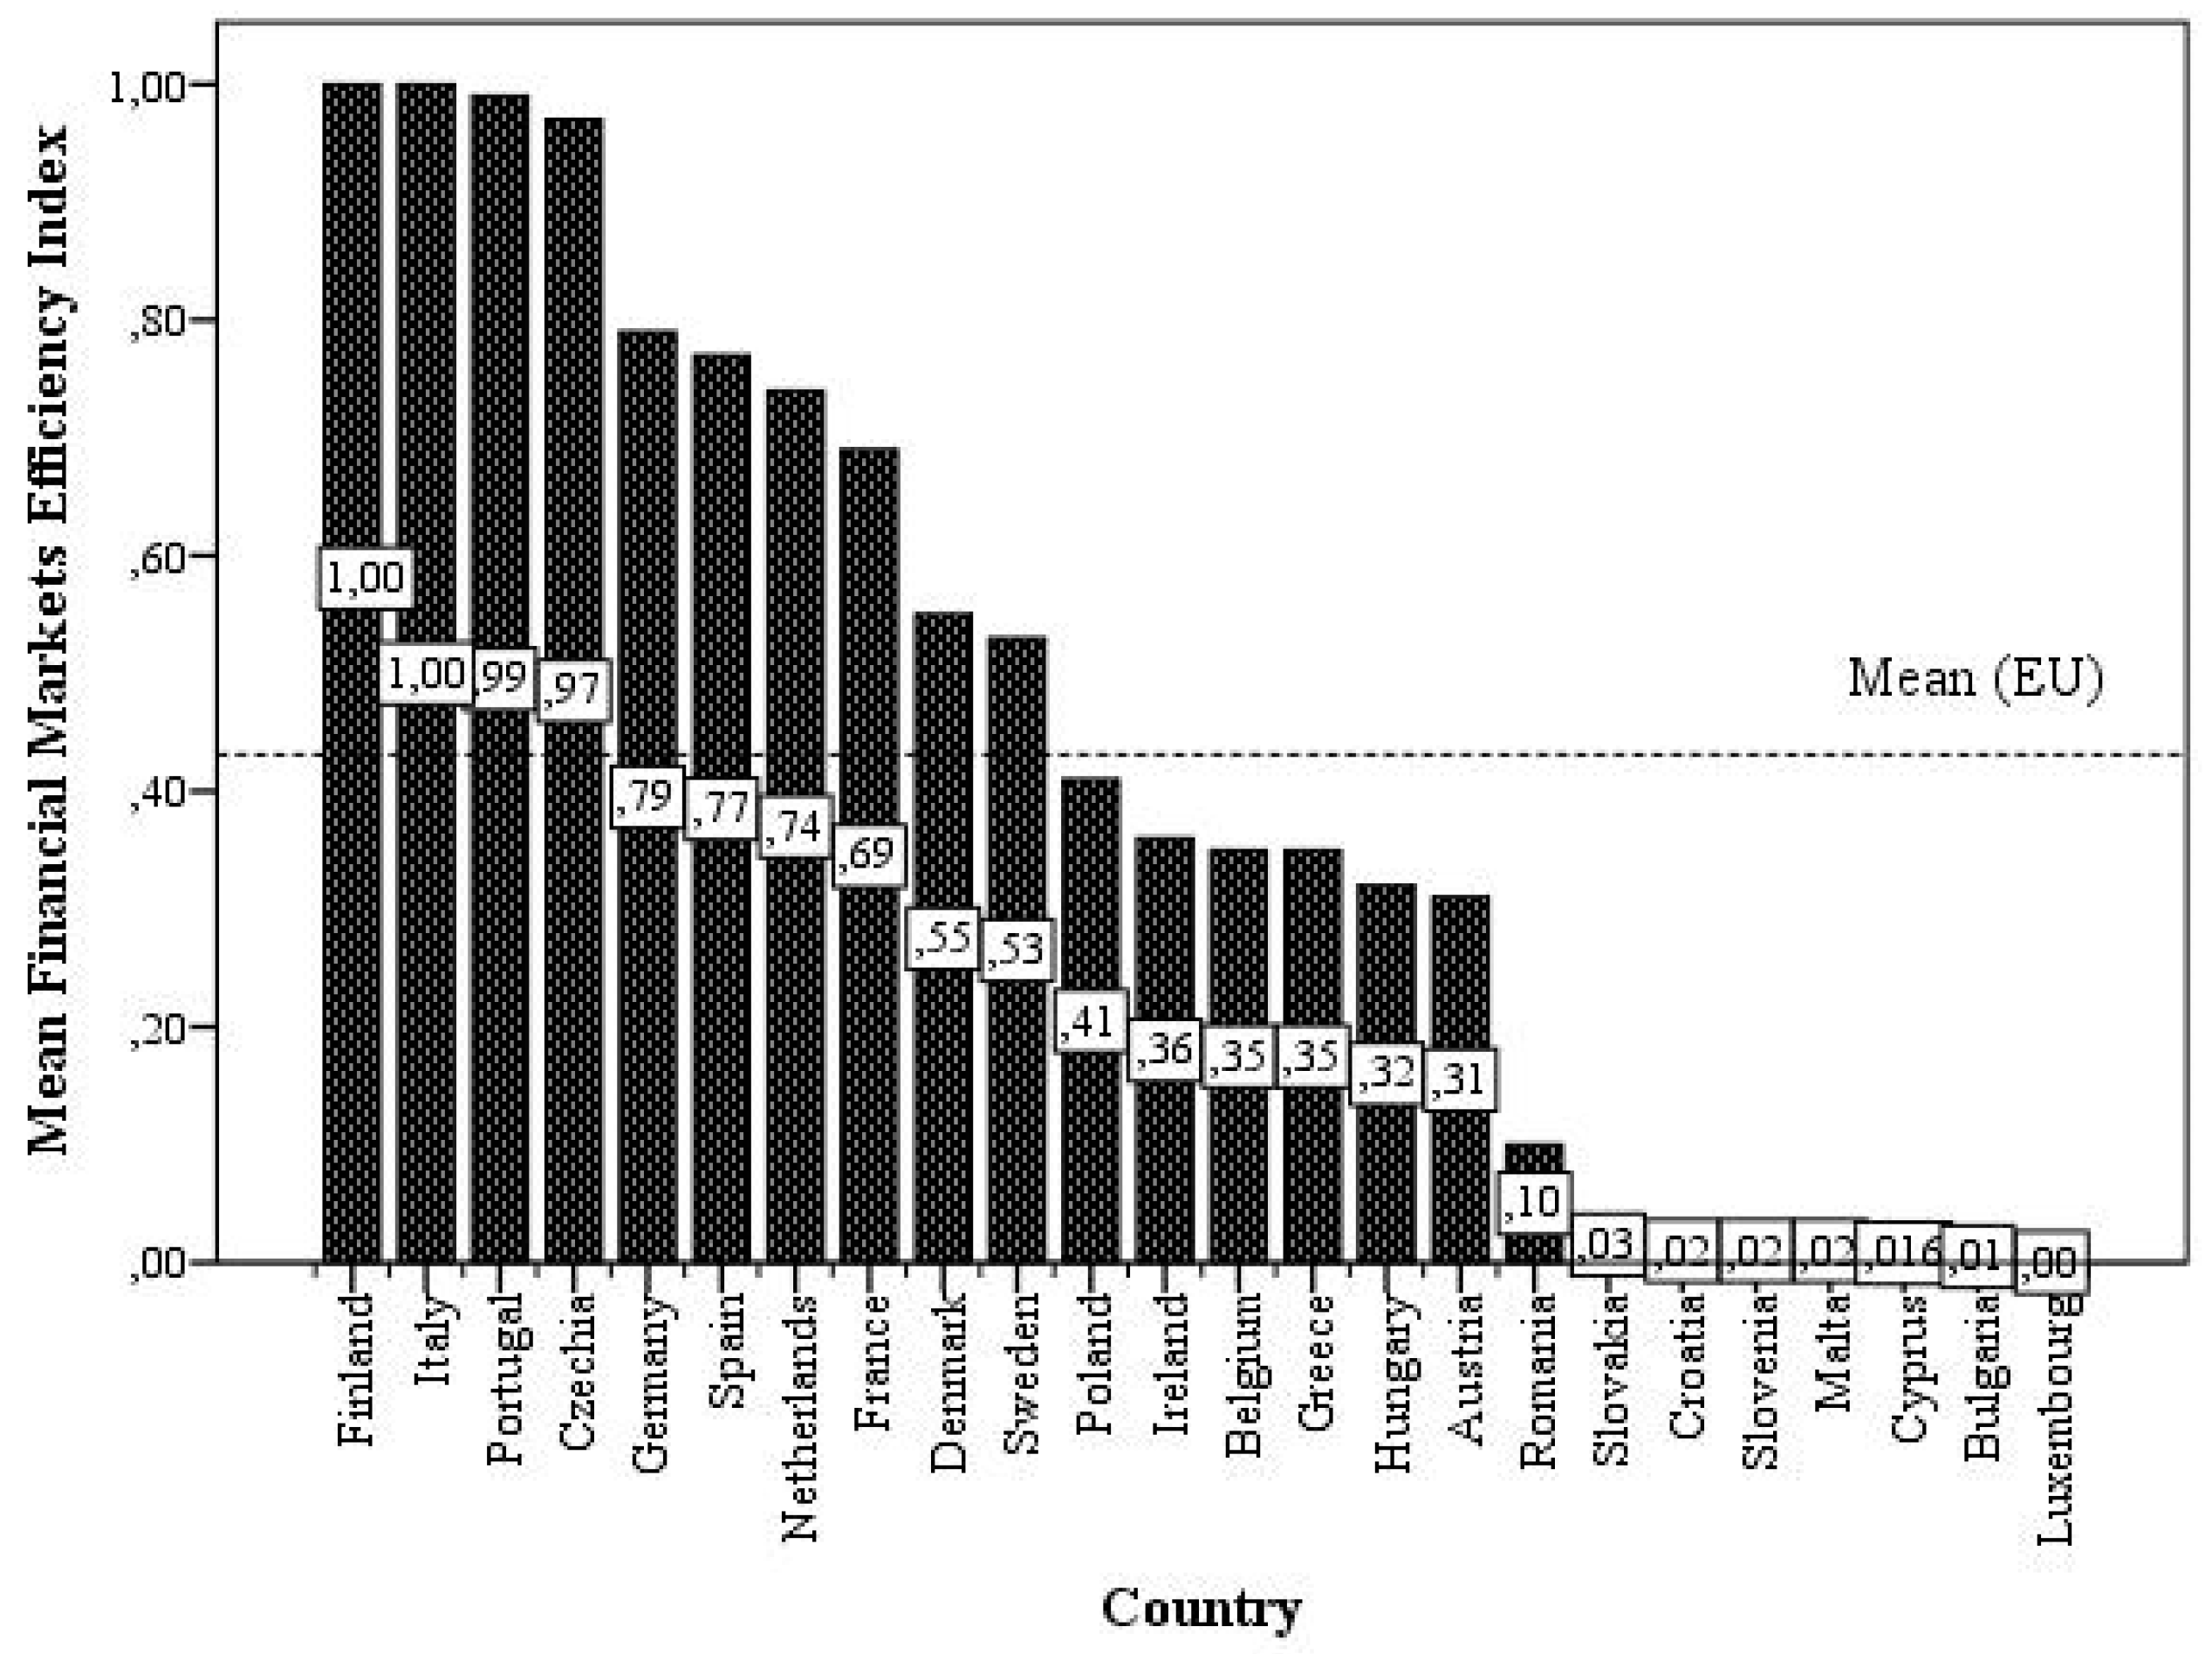
Figure 4). Its values are really low (0.04–0.05) in Latvia, Lithuania, Slovakia, Romania, Bulgaria, and Estonia. Speaking about the rest of the countries, there is a distribution into two groups according to the sub-index value, which is below or above the EU average. Lithuania, Latvia, Romania, Slovakia, Estonia, Slovenia, and Bulgaria have the lowest values of the financial markets depth sub-index (0.04–0.09). The lowest values of the financial markets efficiency sub-index (0–0.03) are in Luxembourg, Bulgaria, Cyprus, Malta, Slovenia, Croatia, and Slovakia (0–0.03). Romania, Slovakia, Bulgaria, the Czech Republic, Latvia, Lithuania, and Estonia have the lowest values (0.01–0.08) of the financial markets access sub-index (see
Appendix A).
An interesting fact is that some countries, such as Estonia, Latvia, and Lithuania, which have sufficiently high values of the Global Fintech Index, have rather poor financial development. Therefore, it is necessary to identify whether FinTech is a factor of both financial development in general and the considered sub-indexes of financial development in the sample of the EU countries in 2020.
3. Research Results
In order to prove the hypothesis, the authors apply the Pearson correlation analysis (
Pearson 1895). The Pearson correlation coefficient is calculated as follows:
where
—values of indicators
x,
y;
—arithmetic mean of indicators
x,
y;
—standard deviations of indicators
x,
y;
n—number of observations.
The research proved that there is no linear relationship between Global FinTech Index and Financial Development Index (
p-value = 0.117) (
Figure 5).
However, there is a linear relationship between the Global FinTech Index and some sub-indexes of the Financial Development Index (see
Table 2 below).
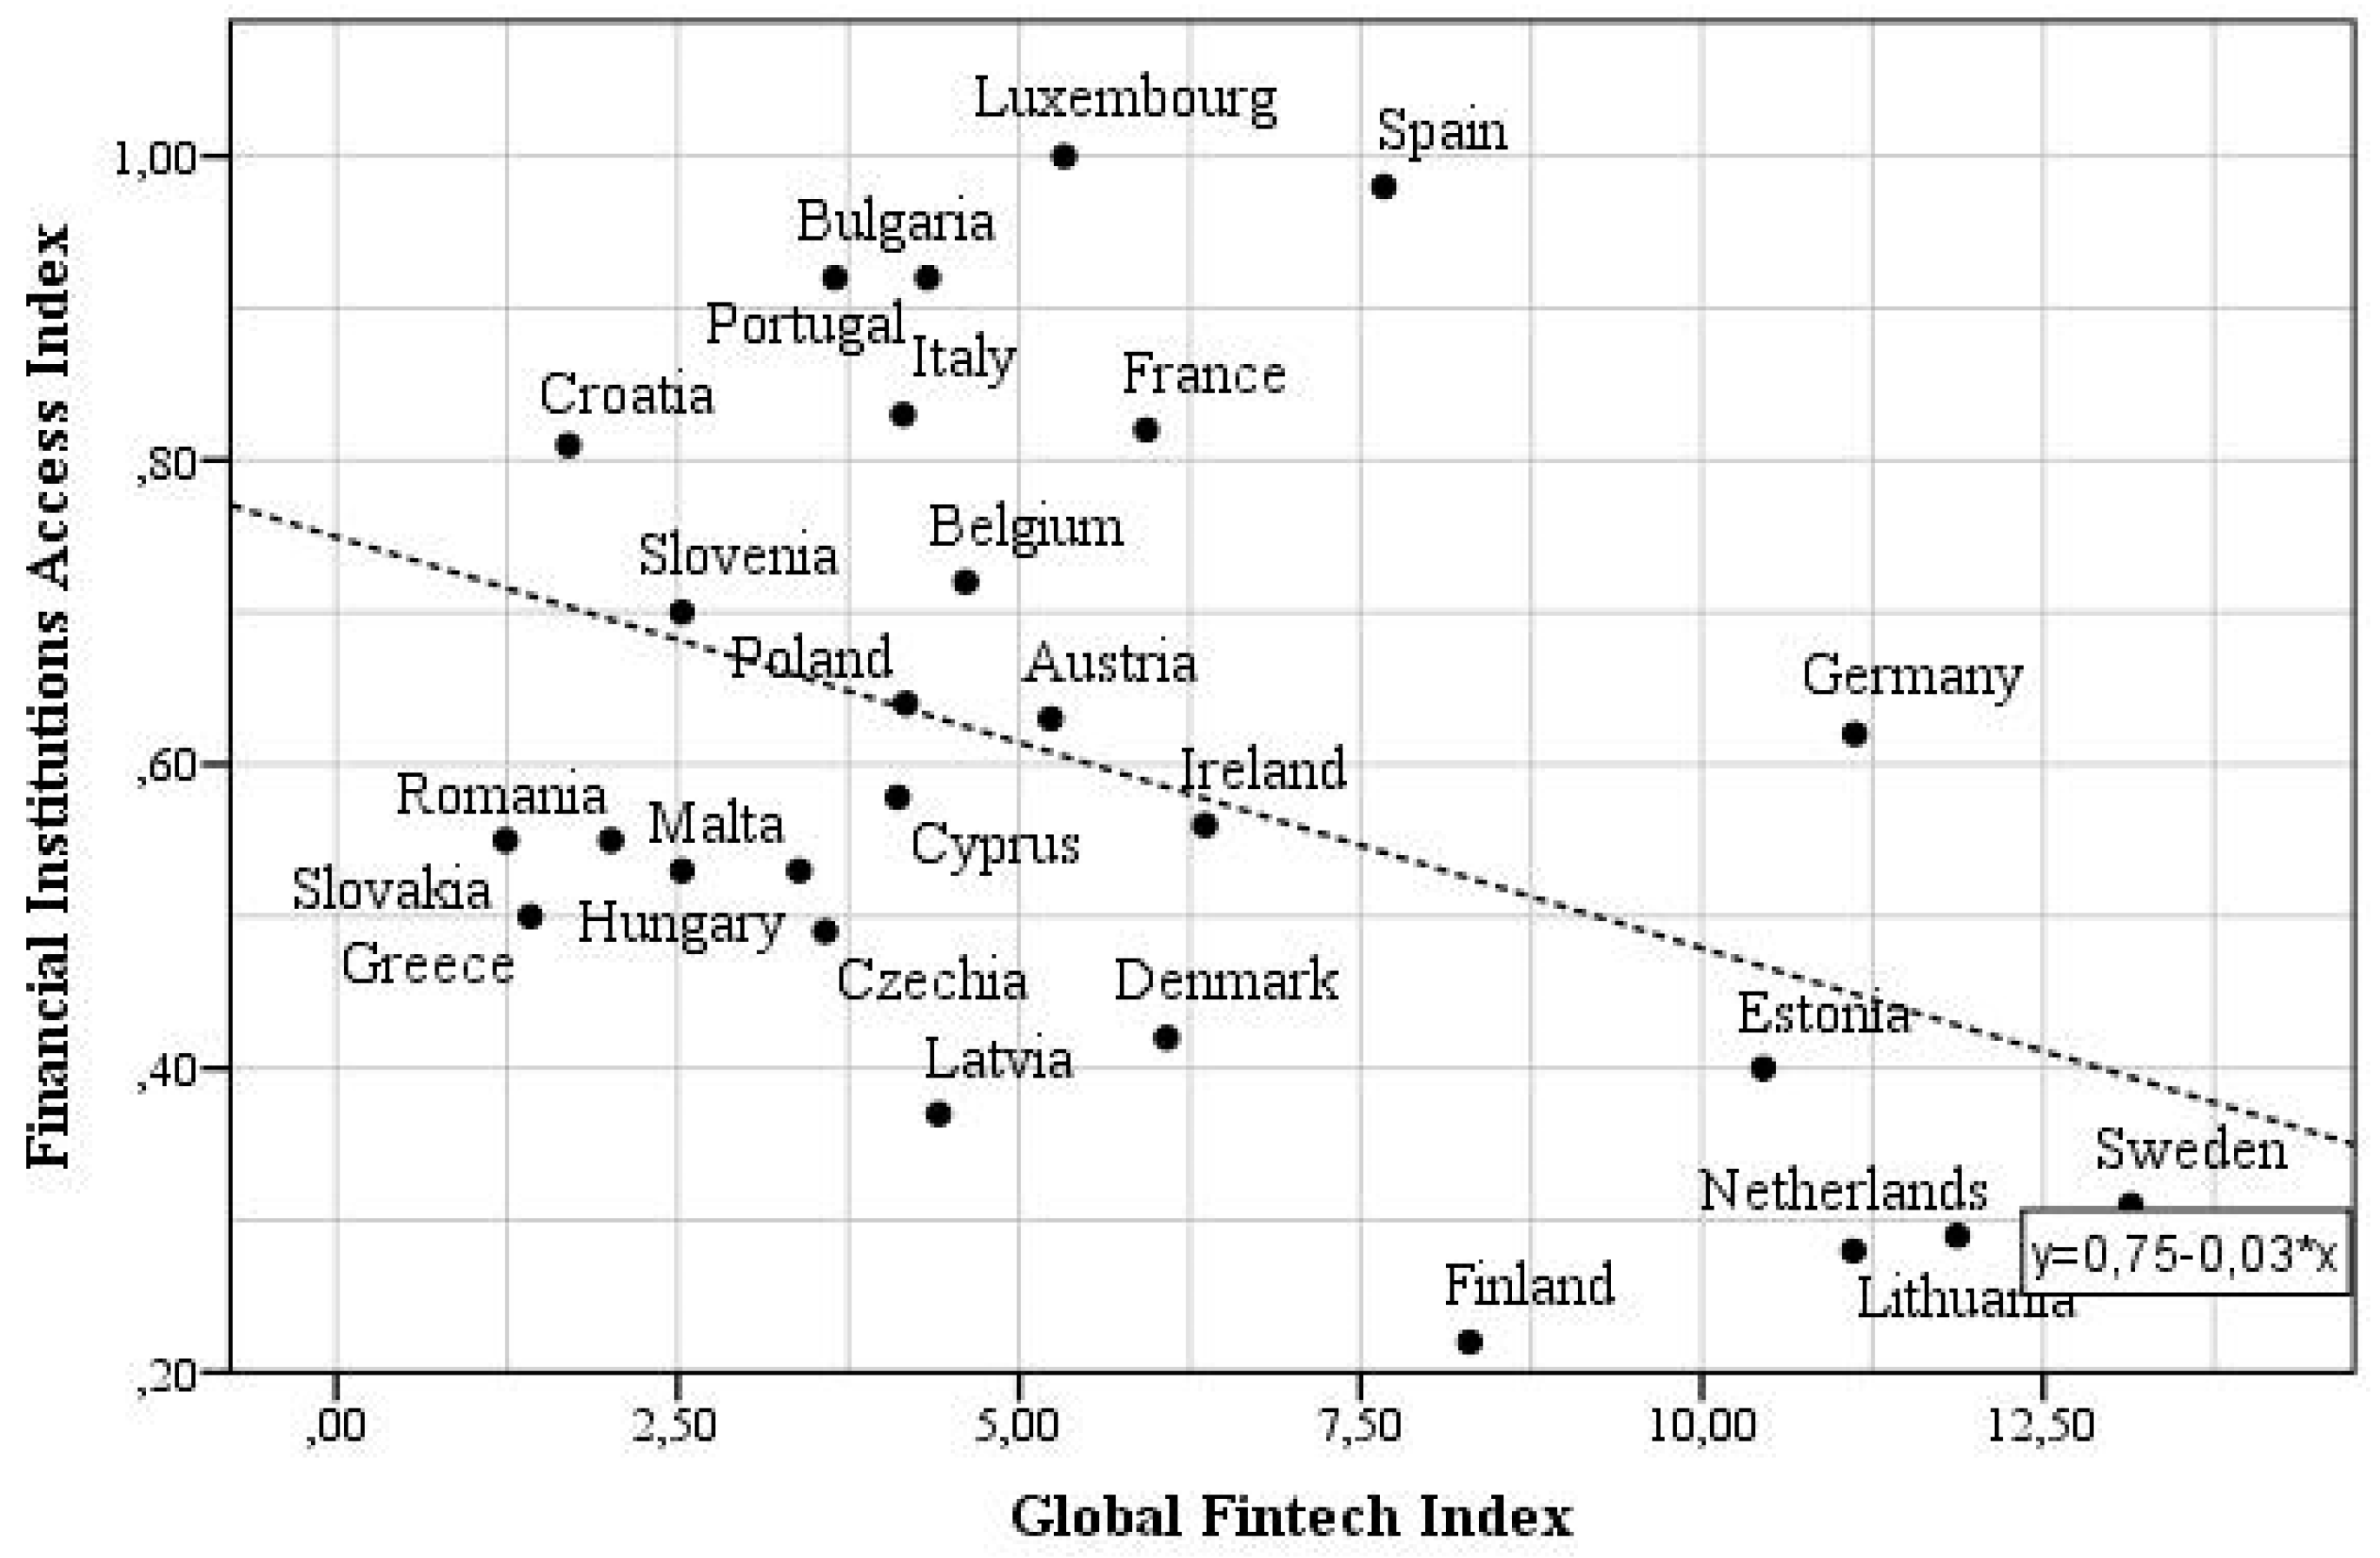
A negative linear relationship between the Global FinTech Index and the Financial Institutions Access Index (Pearson coefficient −0.415,
p-value 0.031) was determined. Therefore, we can conclude that FinTech develops in territories with low access to financial institutions (branches of commercial banks and ATMs per 100,000) (
Figure 6).
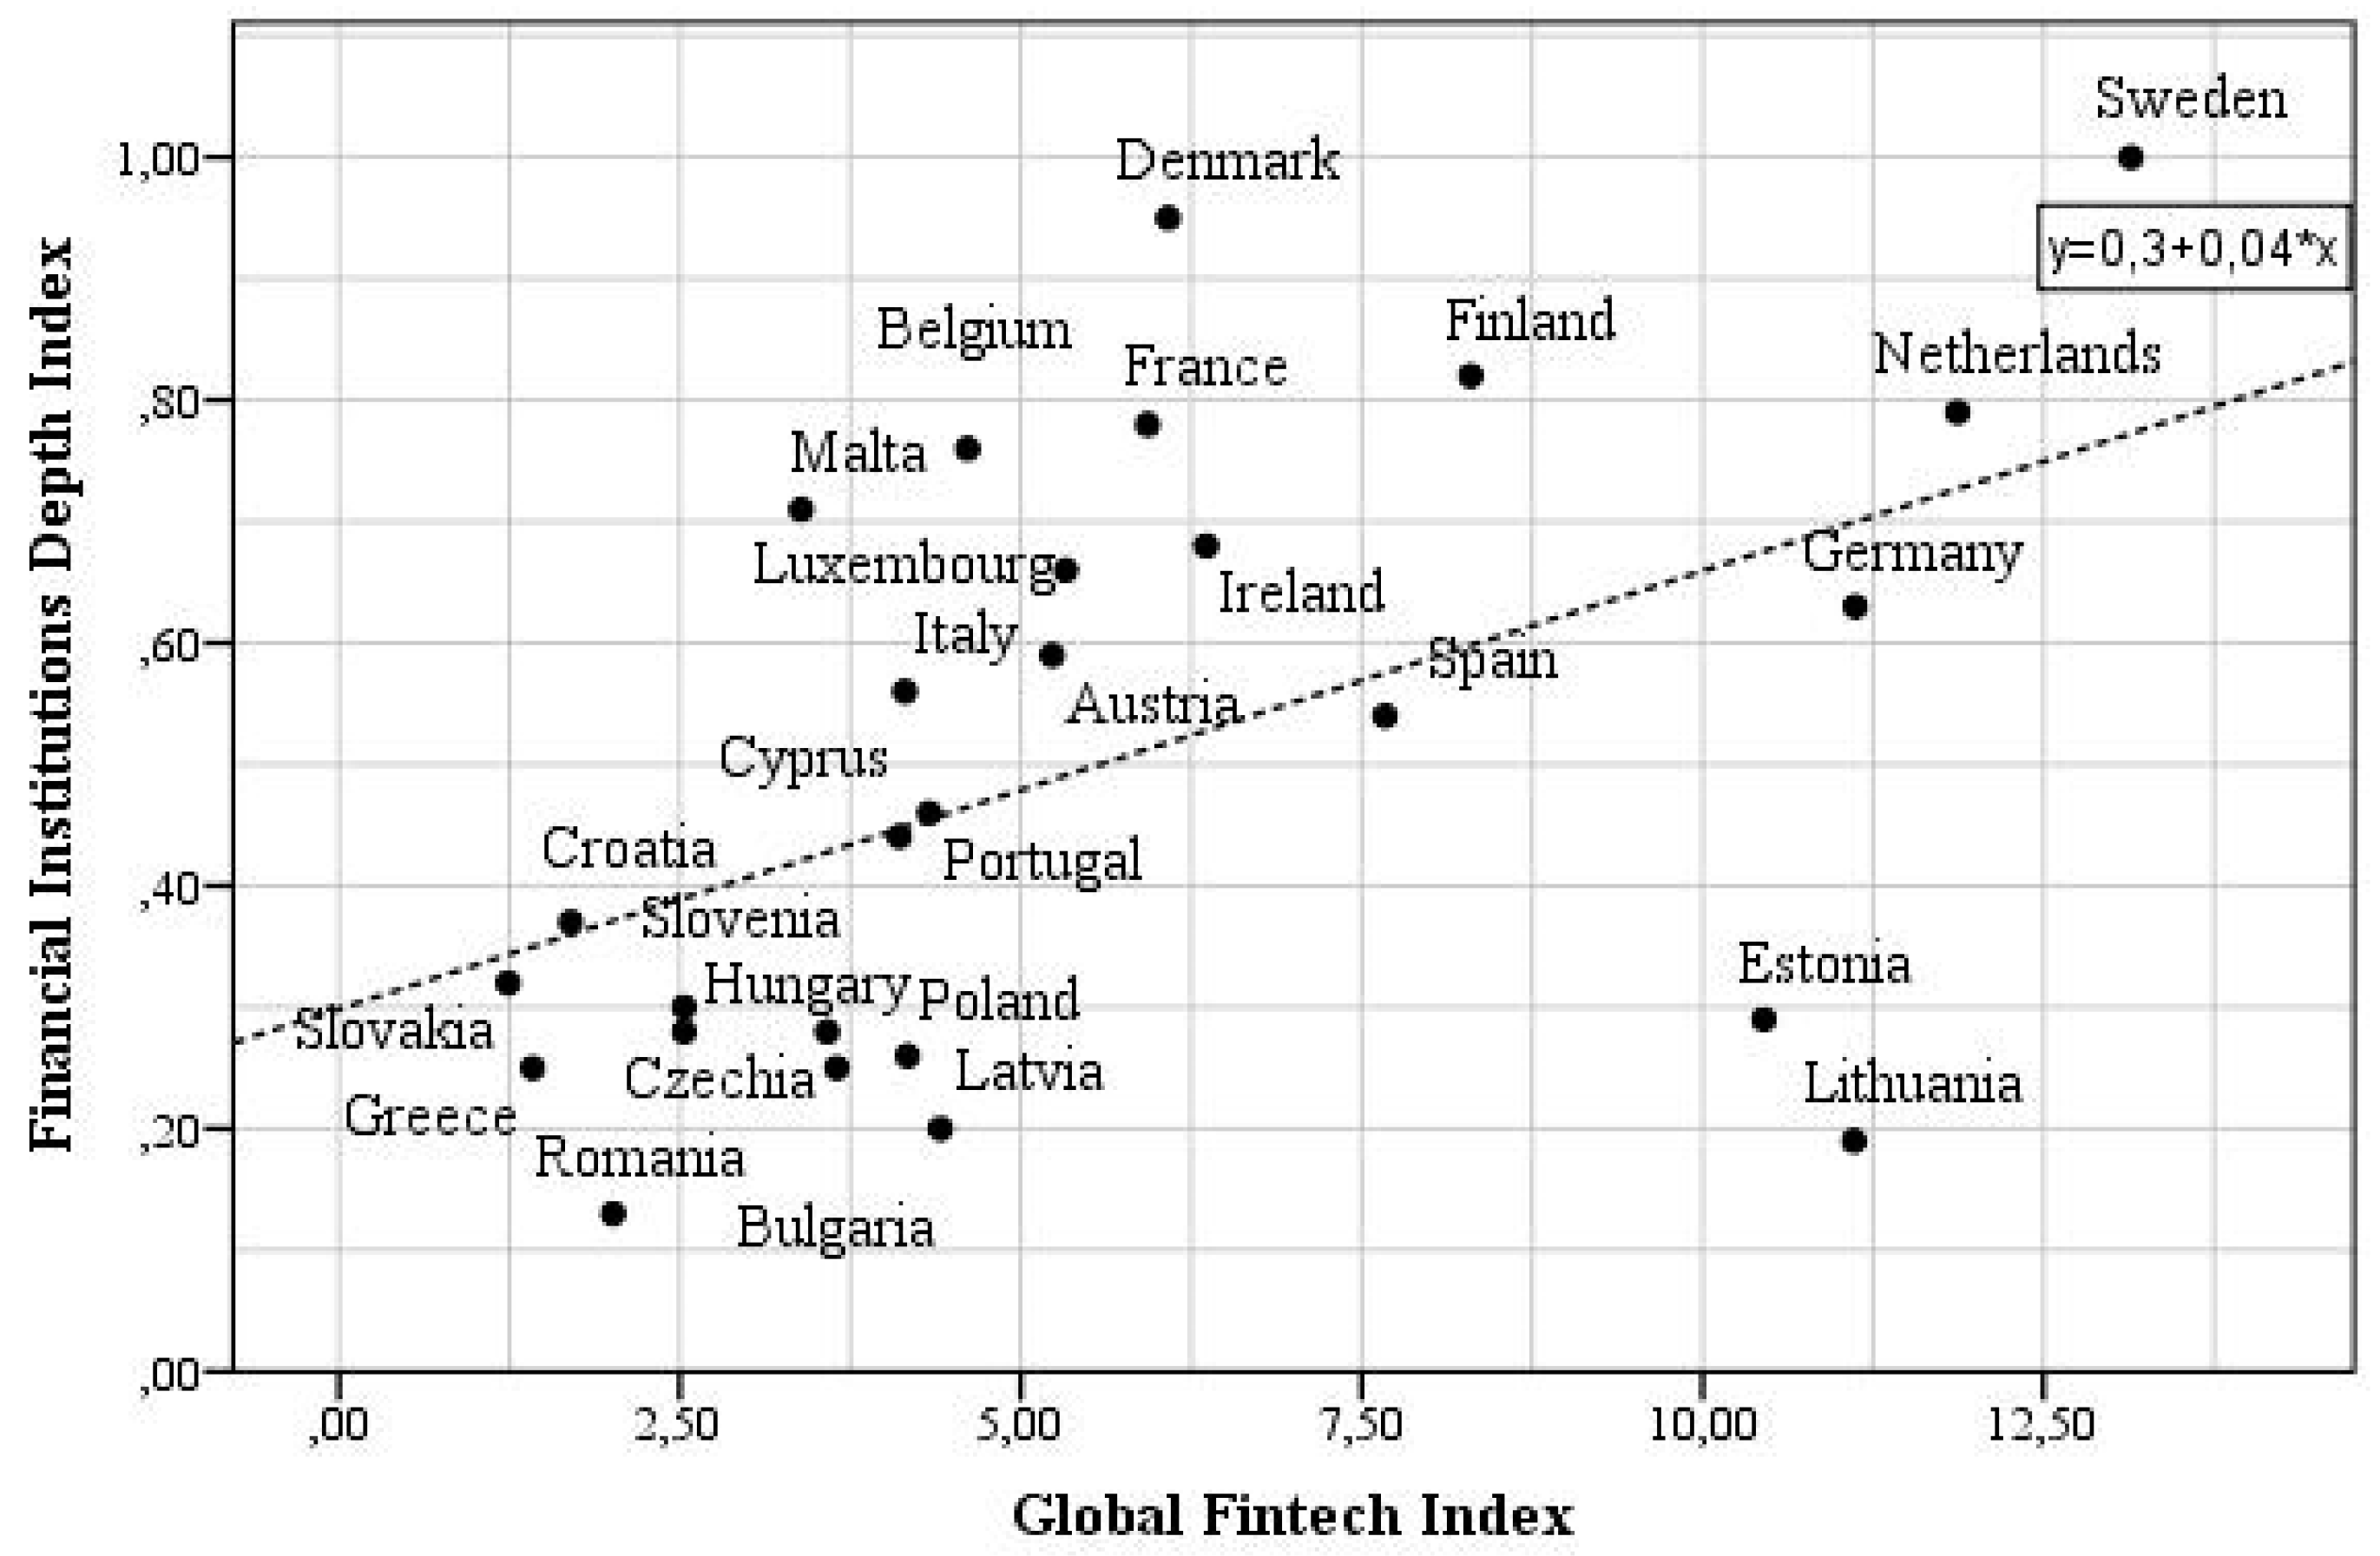
There is a positive linear relationship between the Global FinTech Index and Financial Institutions Depth Index, which is characterized by such indicators as private-sector credit (% of GDP), pension fund assets (% of GDP), mutual fund assets (% of GDP), insurance premiums, and life and non-life (% of GDP). Pearson coefficient is 0.485,
p-value 0.01 (see
Figure 7).
There is no linear relationship between the Global FinTech Index and Financial Institutions Efficiency Index or between the Global FinTech Index and Financial Institutions Index (p-value 0.601 and 0.555, respectively).
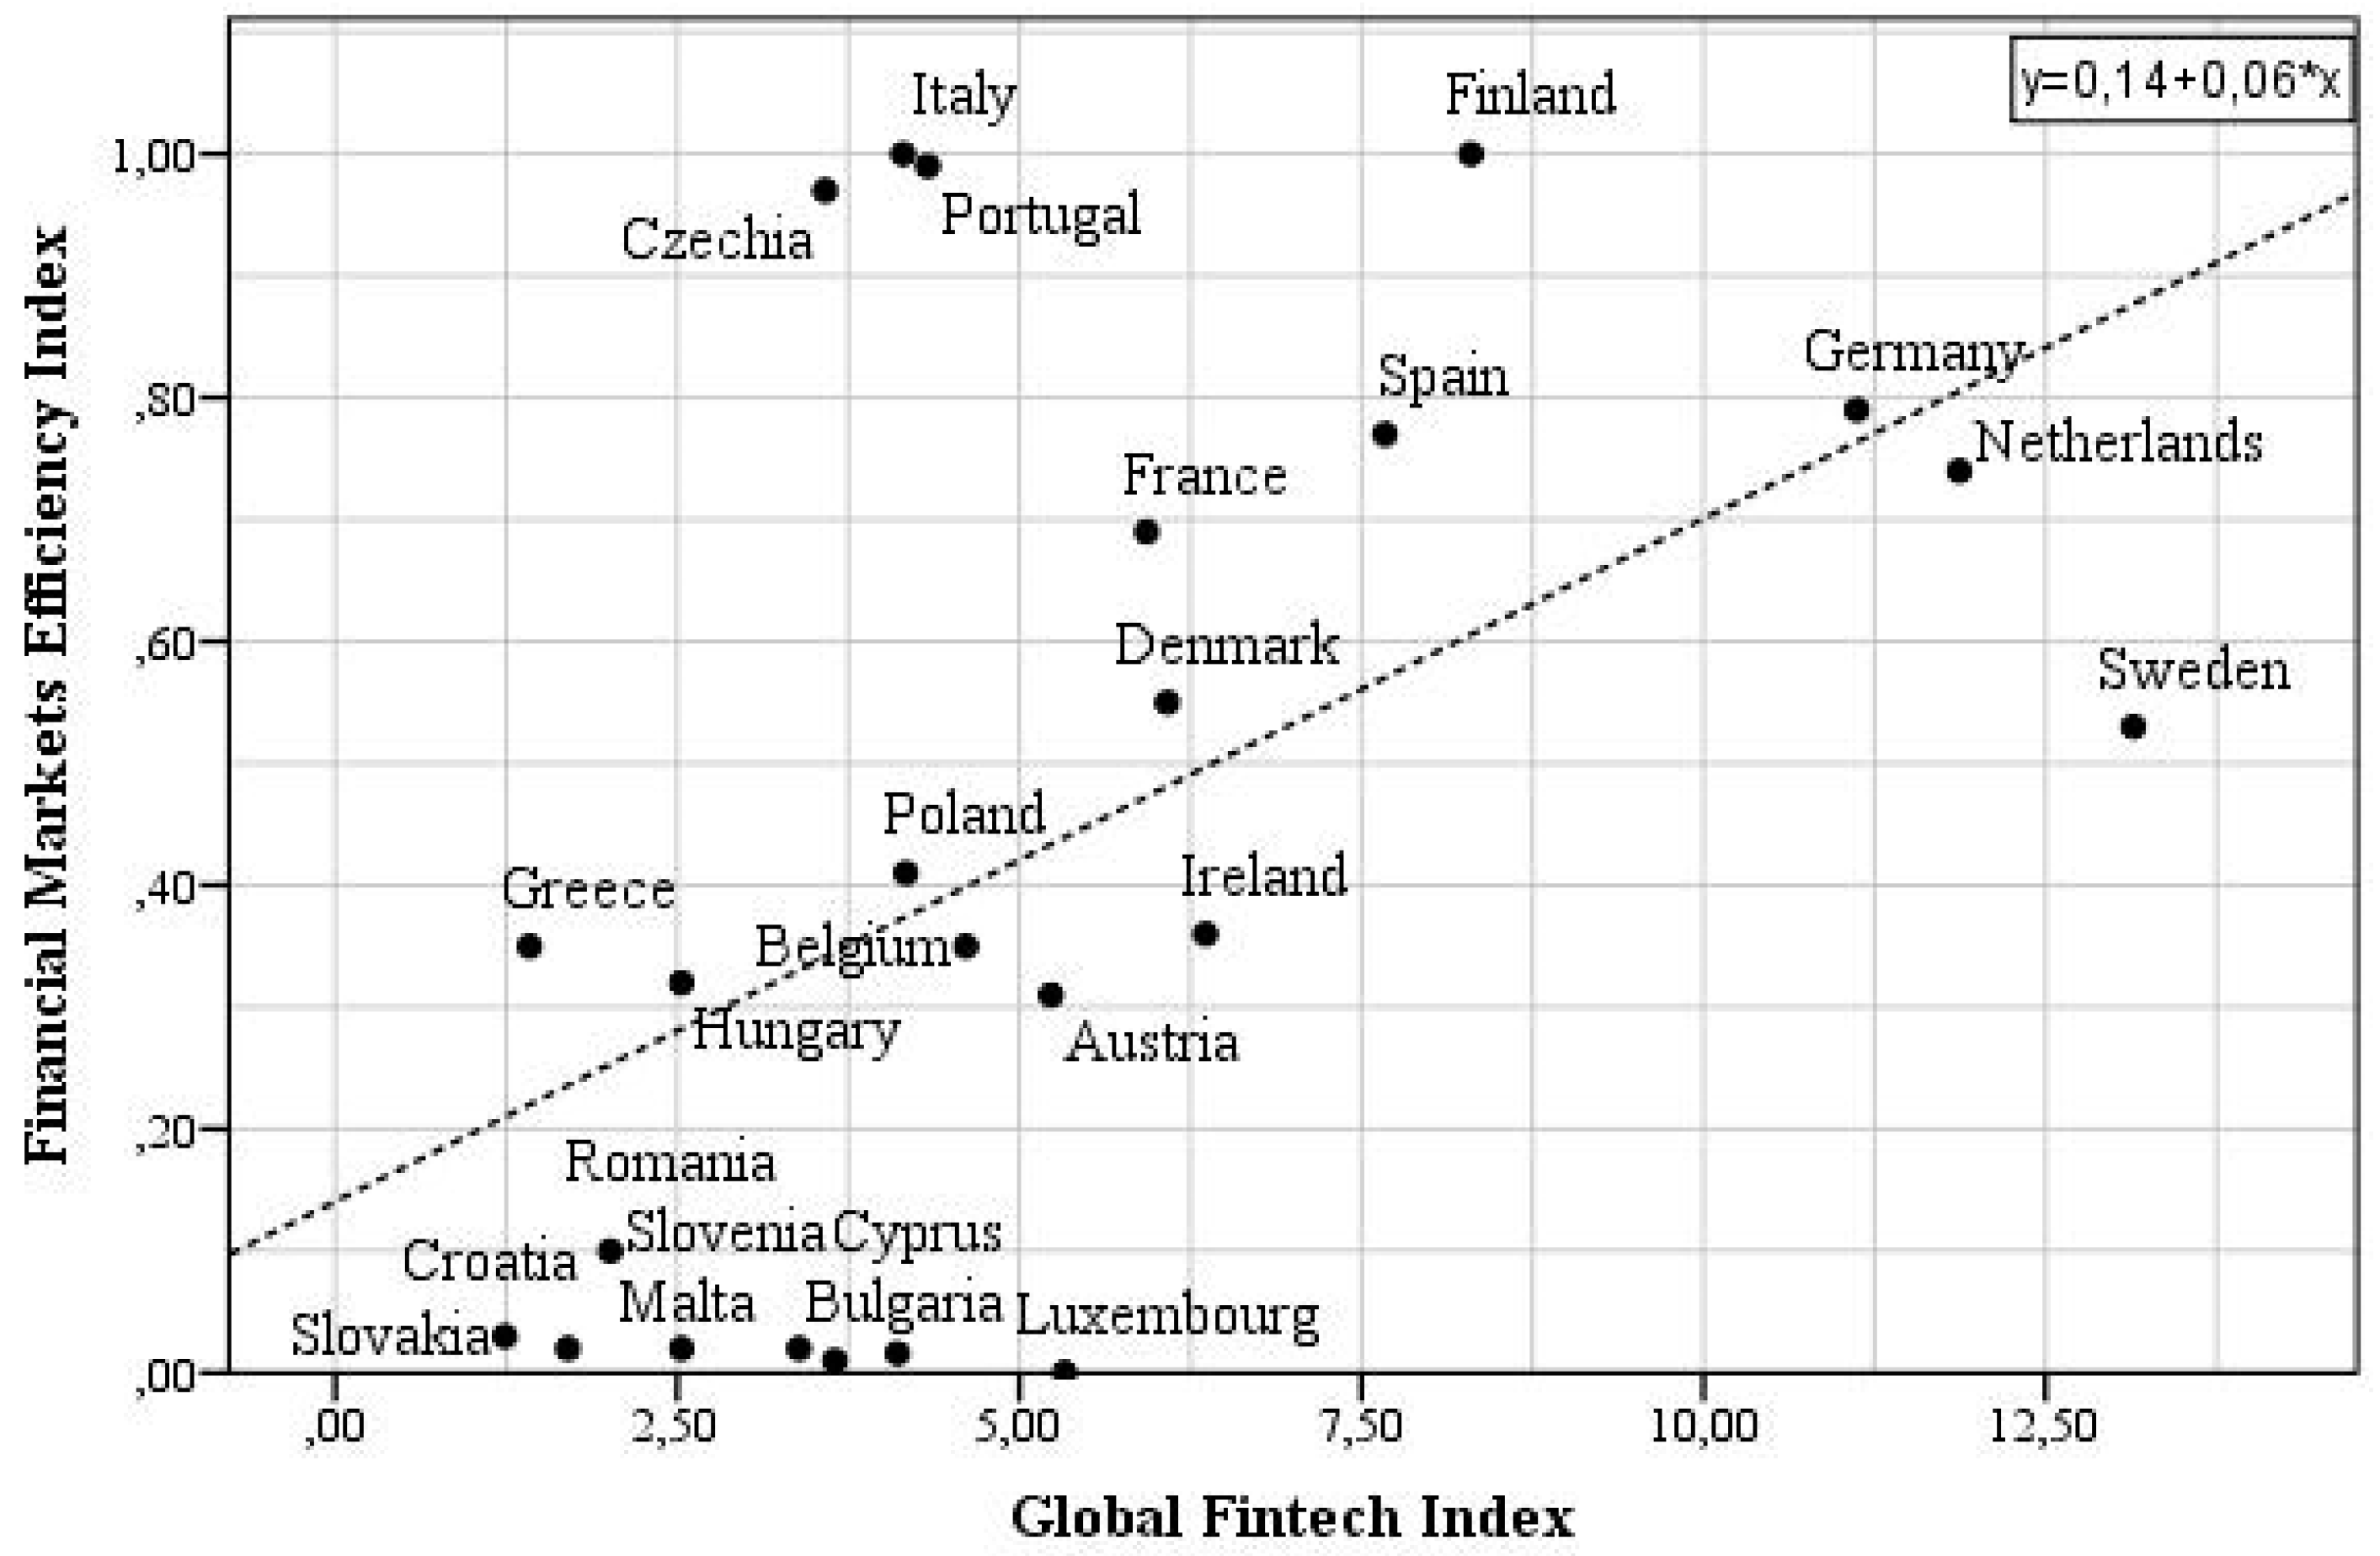
The financial market is a system of market economy that allows performing lending operations, purchase and sale of securities, investment, as well as carrying out the turnover of other highly liquid assets. There is a positive linear relationship between the Global FinTech Index and Financial Markets Efficiency Index, which is characterized by the stock market turnover ratio (stocks traded/capitalization) (Pearson coefficient 0.498,
p-value 0.013), see
Figure 8.
No linear relationship between the Global FinTech Index and Financial Markets Access Index is found (p-value 0.892).
In recent years, there has been an increasing debate about the validity of using a
p-value as a measure of credibility. It is pointed out that this indicator is very sensitive to sample size and is often poorly reproducible. There has been some change of tradition but bringing in a
p-value is a much better solution than not having any assessment of credibility at all. If a
p-value is <0.05, it is considered an indication of the reliability of the results obtained (
Nuzzo 2014).
Will Koehrsen (
2018) believes that a
p-value of 0.05 is arbitrary, and R.A. Fischer, the father of modern statistics, chooses a
p-value of 0.05 for indeterminate reasons.
Kleinberg (
2016, p. 77) quotes that although a threshold value of 0.05 is usually used, there is no law according to which results with a
p-value < 0.05 are significant, but with a
p-value > 0.05 are not significant.
Nasledov (
2013) recommends assuming that there is a linear relationship tendency with a
p-value > 0.05 and
p-value < 0.1. Therefore, we have identified a linear relationship tendency between the Global FinTech Index and Financial Markets Index as a whole (Pearson coefficient 0.366,
p-value 0.06); between the Global FinTech Index and Financial Markets Depth Index, which is characterized by indicators of stocks market capitalization to GDP, stocks traded to GDP, international debt securities government (% of GDP), total debt securities of nonfinancial corporations (% of GDP), and total debt securities of financial corporations (% of GDP) (Pearson coefficient 0.518,
p-value 0.006)—see
Figure 9.
As an example, collinearity and autocorrelation tests can also be carried out. This is not entirely justified for a pairwise regression, so we express the Financial Markets Depth Index through the Global Fintech Index and GDP per capita:
Positive coefficients at the independent variables of the Global Fintech Index and GDP per capita indicate that they increase the value of the dependent variable of the Financial Markets Depth Index. However, the ratio of the coefficients does not allow us to draw a conclusion about the impact of a particular factor on the dependent variable. To solve this problem, standardized linear regression coefficients (β), which reflect the partial correlations of the dependent and independent variables, are used: β (Global Fintech Index) = 0.389; β (GDP per capita = 0.398), which suggests that the impact of the Global Fintech Index on the Financial Markets Depth Index is commensurate with the impact of GDP per capita on this sub-factor of financial development. The multiple correlation coefficient is R = 0.640. The proportion of dispersion of the Financial Markets Depth Index explained by the combined effect of the independent variables included in the equation comprises 41%.
Durbin–Watson statistic is one of the most common criteria for checking auto-correlation. DW = 2.064—a coefficient value close to 2 indicates no autocorrelation. Collinearity (or multicollinearity) is an undesirable situation where one independent variable is a linear combination of other independent variables. The VIF—variance inflation factor for both independent variables—does not exceed 1.2. It means that, in this case, there is no multicollinearity.
It is interesting that the Global FinTech Index is high in Lithuania and Estonia, although these countries have transitioned from a planned economy to a market economy, while the values of the Financial Development Index are very low. This fact might require more detailed scrutiny.
4. Conclusions and Discussion
The limitations of our research, such as the low availability of data characterizing both financial development and FinTech, as well as the fact that the concepts described above are multidimensional, create difficulties in determining their values and the relationship between them. It would definitely be more informative to study the relationship between financial development and FinTech in smaller territories, but the low availability of data for the NUTS2 and NUTS3 regions does not contribute to the construction of indices consisting of a whole series of indicators that characterize the concept. Therefore, it is necessary to use country indices that determine the values of financial development and FinTech, characterized by a certain averaging of values over a large area, which negatively affects the strength of the relationship under study.
It is obvious that FinTech has a significant impact on financial development. FinTech strongly affects financial markets. A positive correlation of financial development with the Financial Markets Depth Index and the Financial Markets Efficiency Index, as well as with the Financial Institutions Depth Index, shows that the emergence of financial technology has allowed financial institutions to attract more deposits and savings from consumers, which can be attributed to both traditional banks and FinTech services. The fact that traditional financial service providers invest heavily in their digital transformation also might contribute to this.
A negative correlation of FinTech with the Financial Institutions Access Index shows the financial technology boom with low access to finance in financial institutions, for example, in territories with a minimum number of commercial bank branches and ATMs per 100,000 people.
The data obtained within the framework of the research, in general, correlate with the findings in another research.
Muganyi et al. (
2022), using the example of China, determined that FinTech has a significant positive impact on all three aspects of financial development (accessibility, depth, and stability), with FinTech having the greatest impact on financial accessibility: a 10-percent increase in FinTech share improves access to finance (as measured by credit balance at financial institutions) by 7.5%.
Bollaert et al. (
2021) believe that FinTech is a progressive innovation that evolves as a result of the main factor related to the problems of the inefficiency of existing traditional practices. Conventional financial players, such as banks and securities exchanges, foster their performance by carefully selecting the project (
Bollaert et al. 2021) and, as a result, decreasing the accessibility to finance.
Aduba et al. (
2022), using two indexes of financial performance estimated from the information-intensive processes of asset transformations in deposit-taking financial institutions in more than 60 countries, determined that financial technology penetration promotes financial development in countries with lower financial accessibility and poorer financial performance indexes.
Therefore, in the EU countries with an emerging market economy and poorly developed financial infrastructure, as well as low financial indicators, financial development can be improved through certain policies that stimulate innovation in the field of financial technology without overregulating the development of this area, attracting skilled labor and creating the environment that supports the introduction of new developments in the sphere of finance. The impact of financial technology on financial development needs to be further explored, with a particular focus on the impact of FinTech on Financial Markets, whose development is not quite satisfactory in the former planned economies that are now members of the EU. FinTech contributes to the financial market evolution equipping the financial market actors with the latest infrastructure and service solutions created as part of the fourth industrial revolution. The results of future research in this area can be used by commercial banks, banking supervisors, and public authorities to manage banking activities, IT enterprises, and financial and credit institutions to effectively implement existing financial technologies or to develop their own. However, financial technology is evolving so rapidly that it is difficult to legally regulate all innovative features, which becomes a problem not only for the states but also for start-up companies and their consumers. Therefore, the regulation of financial technologies is also a priority for future research.


 ,
, 


