Article

Artificial Neural Network for Classifying Financial Performance in Jordanian Insurance Sector

1
Department of Accounting, School of Business, The University of Jordan, Aqaba 77110, Jordan
2
Department of Computer Information Systems, The University of Jordan, Aqaba 77110, Jordan
3
Department of Finance, School of Business, The University of Jordan, Aqaba 77110, Jordan
*
Author to whom correspondence should be addressed.
Economies 2023, 11(4), 106; https://doi.org/10.3390/economies11040106
Submission received: 3 January 2023 / Revised: 17 March 2023 / Accepted: 20 March 2023 / Published: 29 March 2023

Abstract

:
Over the past few decades, financial performance has attracted researchers’ attention, especially in the insurance sector. Insurance is a tool for the growth and sustainability of both rising and developing economies. It promotes economic stability for people, organizations, and governments by taking on risk and spreading it across the market. We intend to classify insurance companies’ financial performance in Jordan’s Amman Stock Exchange (ASE). The sample size is 15 out of 22 selected insurance firms from 2008 to 2020. We apply the Multi-Layer Perceptron (MLP) model for the detection of (high/low) total asset turnover (TAT) as output, while we select the subrogation (SB), claims paid (CP), market capitalization (MC), and total shareholders’ equity (SE) as input to the MLP model. The performance of the MLP model is evaluated using different criteria, namely the false positive rate (FP rate), false negative rate (FN rate), F-measure, precision, and accuracy (ACC). The results show that MLP is efficient and performs well in multiple criterion tests through iteration growth. Based on our knowledge, the paper assesses the financial performance of Jordanian insurance firms, which has not been investigated previously. Furthermore, this study gives valuable information to regulators and policymakers to improve asset management efficiency in the insurance sector.

1. Introduction

The insurance sector is essential to the economic growth of industrialized countries since it plays a critical role in all sectors of any economy. It provides protection in economic operations and stimulates investors through compensation for financial losses (Rahmani et al. 2014). The insurance sector serves as a hedge for all other sectors, and its efficiency has an inverse influence on other sectors, particularly those that are risky (Alomari and Azzam 2017). According to the Jordan Insurance Federation (JIF), insurance services first appeared in Jordan in 1946, when the Egyptian Middle East Company, founded in 1921 by an Egyptian French capitalist, established a branch. Jordan witnessed a significant expansion in the insurance business, particularly in accidental and shipping products, in the early 1950s. Jordan’s first insurance firm, the “Jordan Insurance Company”, was founded (Santri et al. 2022). The number of insurance firms expanded during the 1960s until it reached 23 in the mid-1980s. Due to the economic recession of the 1980s and random competition in the insurance sector, which caused many firms to lose profitability, the government enacted Law No. 30 of 1984, which established a regulatory law for monitoring the performance of insurance companies. This law was enacted to raise the capital amount of an insurance company and forced some firms to merge with other firms or close down and exit the market, resulting in a reduction in the number of insurance firms to 17 in 1987. This number of firms remained constant until 19941.
In 1995, Law No. 9 was enacted, allowing new insurance firms to be licensed with a capital of USD 2 million for existing insurance firms, USD 20 million for reinsurance firms, and USD 4 million for foreign insurance firms. As a result of the new law, eight new insurance firms joined the Jordanian market in 1995, increasing the number of operational firms to 25 local firms in 2000. One firm closed in 2001, and the number of firms had declined to 26 by 2006. Three new insurance firms entered the Jordanian market in 2007–2008, increasing the total number of firms to 29. The firm “DARKOM” left the sector at the end of 2008 to engage in the financial sector, reducing the number of enterprises to 28 by 2011. Three firms closed between 2012 and 2013, reducing the total number of operating firms to 25. The number of insurance firms at the end of 2022 was 22: 14 composite firms (non-life, life, and medical), 7 composite firms (non-life and medical), and one life insurance firm.
Insurance is a means of protection from financial loss, in which, in exchange for a fee, a party agrees to guarantee another party compensation in the event of a certain loss, damage, or injury. It is a form of risk management, primarily used to hedge against the risk of a contingent or uncertain loss. An entity that provides insurance is called an insurer, insurance firm, insurance carrier, or underwriter. A person or entity who buys insurance is known as a policyholder, while a person or entity covered under the policy is called the insured. The insurance transaction involves the policyholder assuming a guaranteed, known, and relatively small loss in the form of a payment to the insurer in exchange for the insurer’s promise to compensate the insured in the event of a covered loss. Insurers make money in two ways. The first is through underwriting, the process by which insurers select the risks to insure and decide how much in premiums to charge for accepting those risks, and taking the brunt of the risk should it come to fruition. The second is through investing the premiums that are collected from insured parties. However, insurance can have various effects on society through the way in which it changes who bears the costs of losses and damage. On one hand, it can increase fraud; on the other, it can help societies and individuals to prepare for catastrophes and mitigate the effects of catastrophes on both households and societies (Rejda and McNamara 2022).
The problem in this study appears from changes (up/down) in the number of insurance firms, with some of these firms suffering losses that have forced them to leave the market in recent years. The performance of any firm affects its market growth in the sector that it serves. The fluctuation in the number of insurance firms during the previous few years might be attributed to differences in insurance company profitability. The financial performance of insurance firms refers to TAT in our study. TAT is a financial ratio that measures the efficiency of a firm’s use of its assets in generating sales revenue or sales income to the firm (Siregar and Mardiana 2022). Sales in insurance firms are written premiums that reflect the number of policies sold by an insurance firm during a certain period and are often reported at the top of a firm’s income statement. TAT can be further subdivided into fixed asset turnover, which measures a firm’s use of its fixed assets to generate revenue, and working capital turnover, which measures a company’s use of its current assets minus liabilities to generate revenue. The TAT ratio can be used to estimate the profitability of firms through return on equity (ROE) figures as part of DuPont analysis. As a financial and activity ratio, and as part of DuPont analysis, asset turnover is a part of the company’s fundamental analysis. Firms with low profit margins tend to have high TAT, while those with high profit margins have low TAT. Firms in the retail industry tend to have a very high TAT ratio due mainly to competitive pricing. In this study, TAT is calculated as the total premium divided by total assets (Nurlaela et al. 2019; Ross et al. 2022). The effect of TAT, working capital turnover, and the debt ratio on stock closing prices as a measure of financial performance for consumption sector firms listed on the Stock Exchange between 2007 and 2016 was examined by Lubis et al. (2018). According to the findings, all variables had a significant influence on stock prices.
An artificial neural network (or simulated neural network) is a network or circuit of artificial neurons or nodes that uses a mathematical or computational model for information processing based on a connection’s approach to computation. The connections of the biological neuron are modeled as weights between nodes. A positive weight reflects an excitatory connection, while negative values mean inhibitory connections. Each input is weighted, and then the results are added. A linear combination is the term used to describe this activity. The output’s amplitude is then controlled by an activation function. The ANN is often an adaptive system that modifies its structure in response to information flowing through the network, whether it be internal or external. In more concrete terms, neural networks are non-linear statistical data modeling or decision making tools. They can be used to model complex relationships between inputs and outputs or to find patterns in data (Kruse et al. 2022; Alkhawaldeh et al. 2019, 2022; Alkhawaldeh 2021).
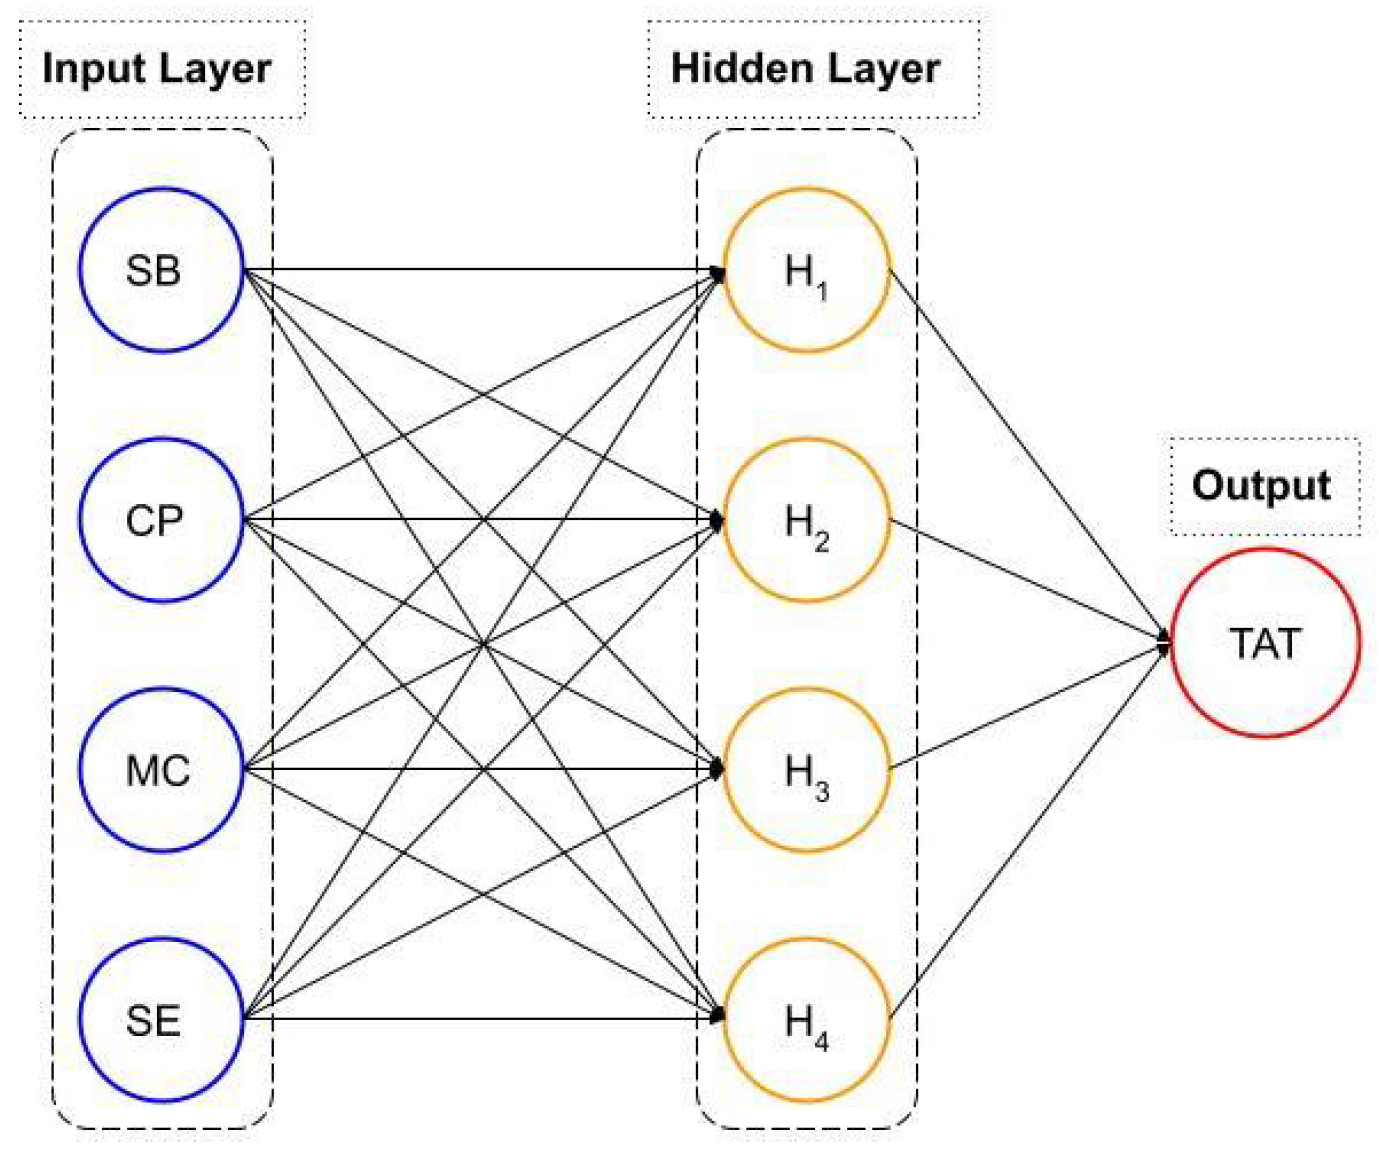
Numerous alternative neural networks are discussed in the literature; however, in our work, we focus on the Multilayer Perceptron (MLP), one of the most often used neural networks. MLP is a fully connected class of feed-forward artificial neural networks. MLP consists of at least three layers of nodes: an input layer, a hidden layer, and an output layer. Each node, except the input nodes, is a neuron that employs a non-linear activation function. MLP is a supervised learning technique that uses a backpropagation approach for training. MLP differs from a linear perceptron due to its numerous layers and non-linear activation. It can identify non-linearly separable data (Ben Abdel Ouahab et al. 2022; Kruse et al. 2022).
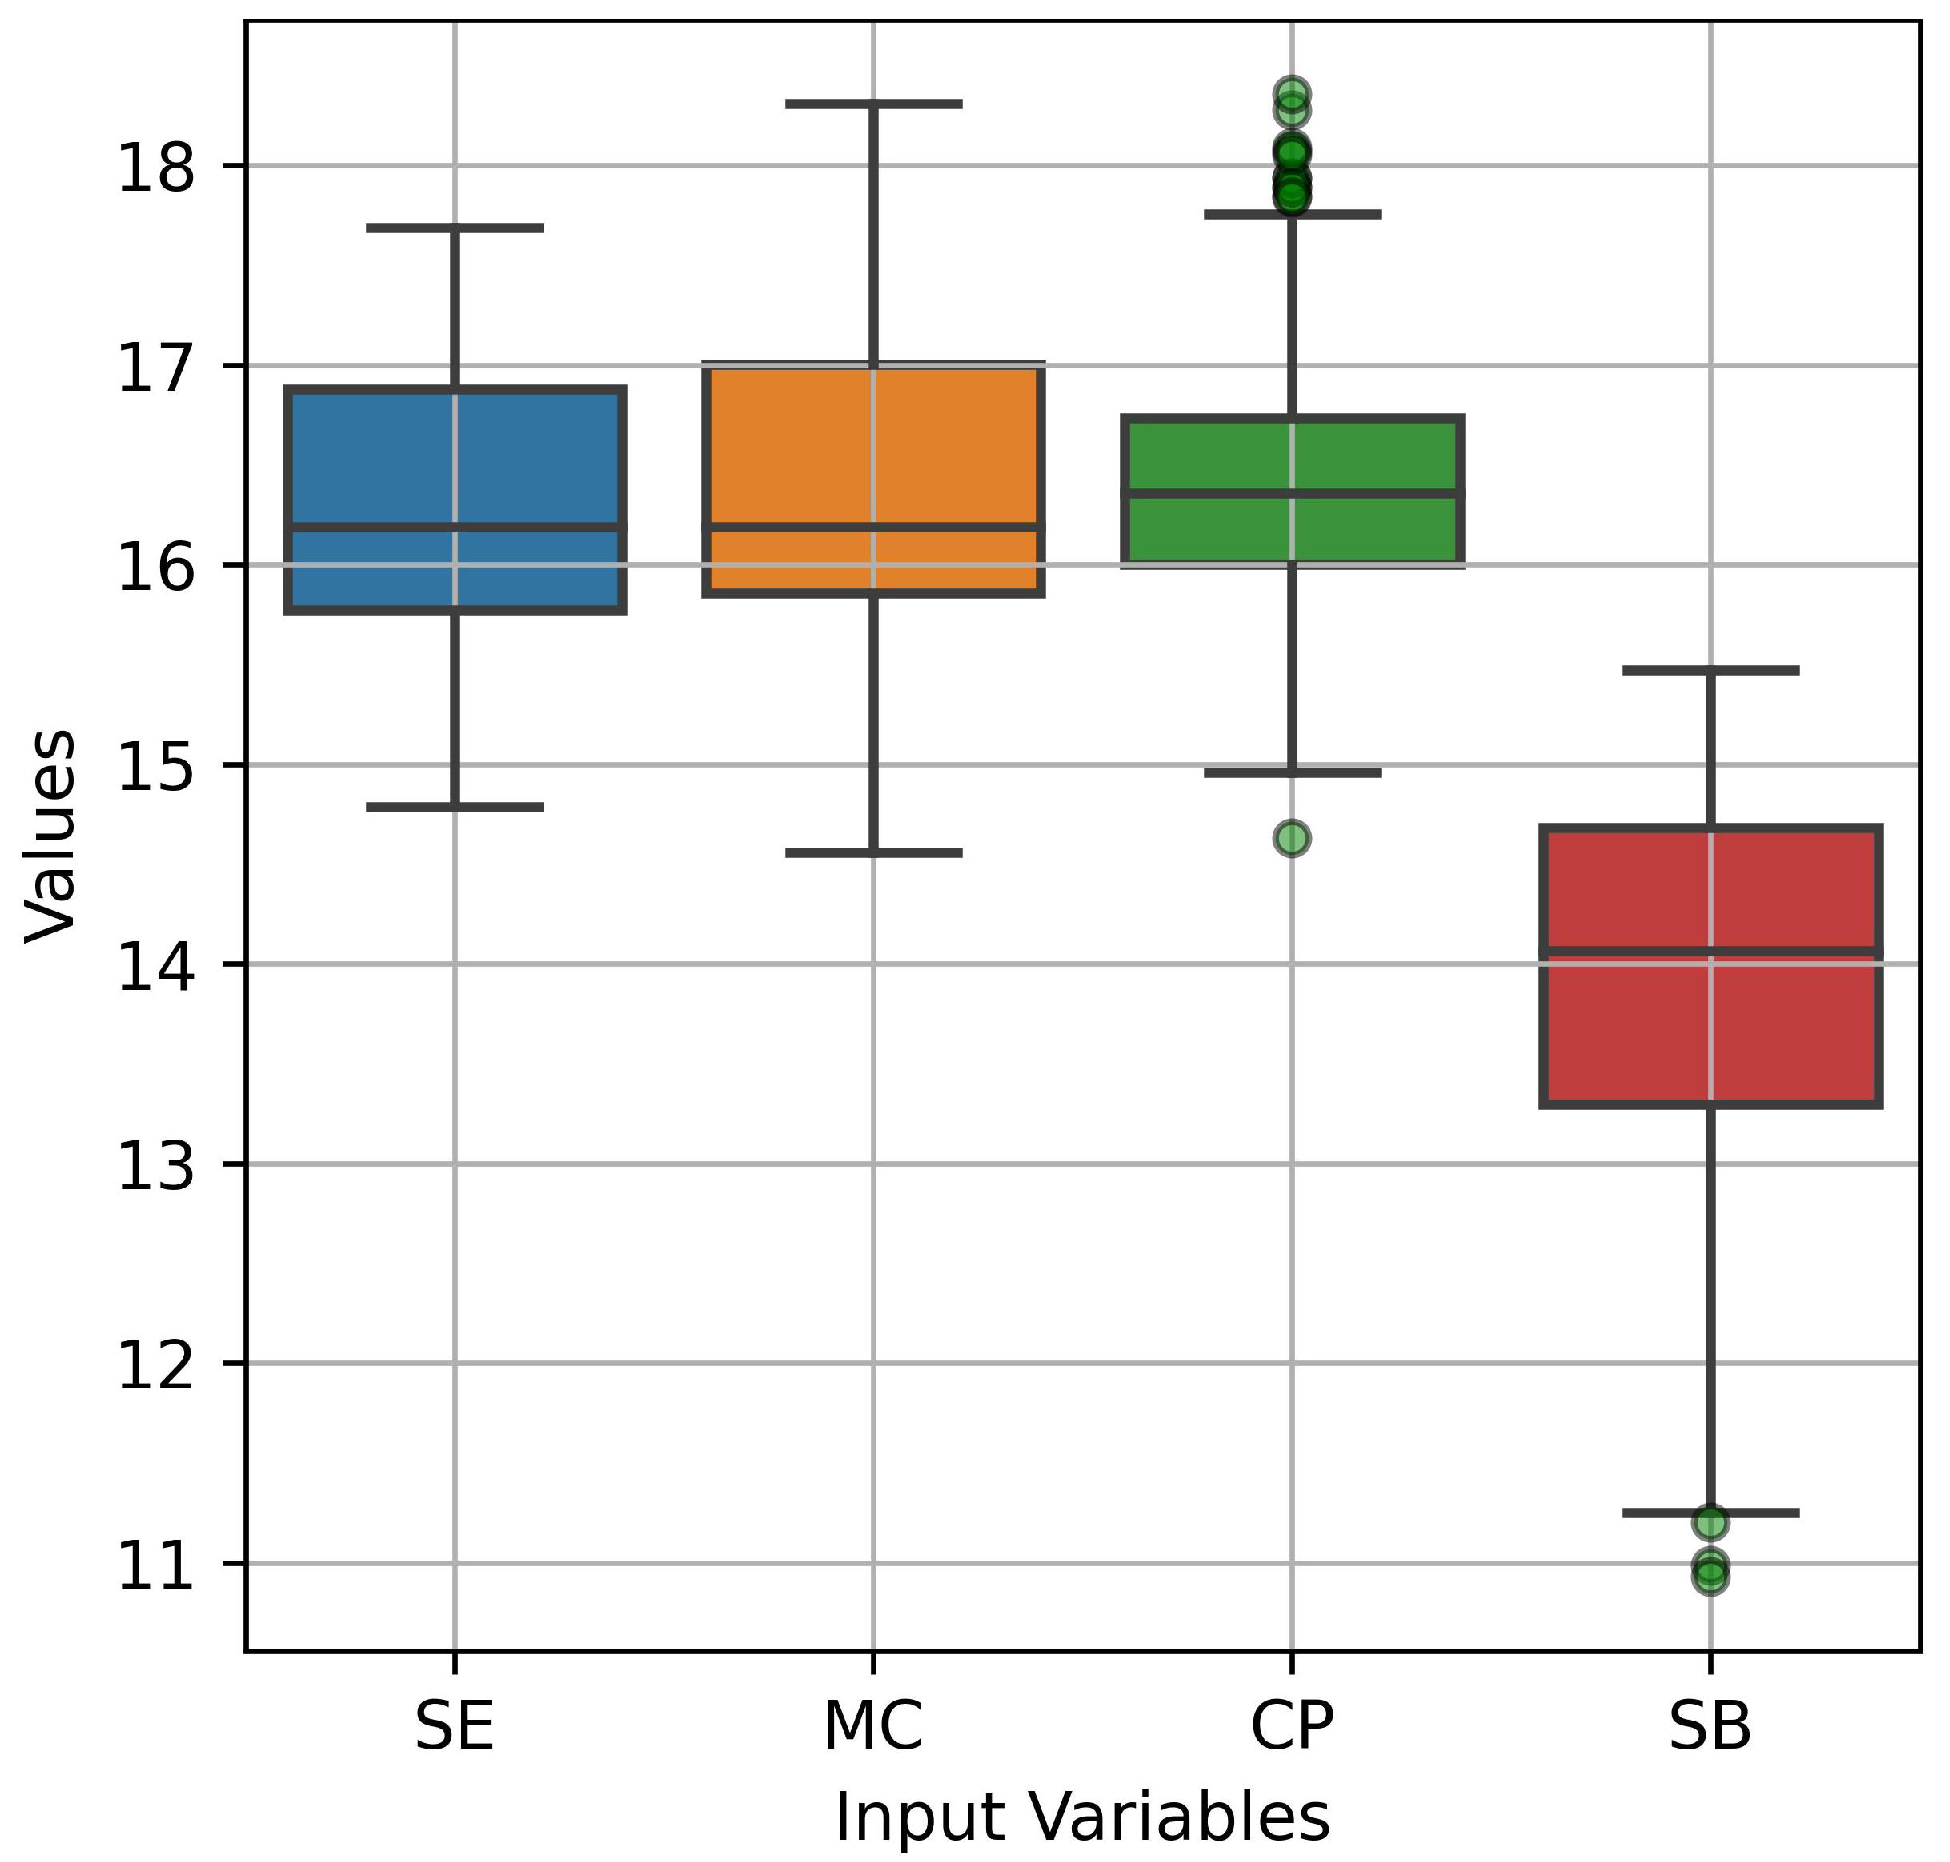
The high/low-performance detection problem in the financial sector is resolved using machine learning methods. In this work, we predict whether a data point has high or low performance based on how similar it is to previously observed data. There are other statistical approaches available in the literature for predicting financial performance in firms, but our focus is on utilizing MLP to forecast high/low financial performance in the insurance sector. As far as we know, no research has been conducted on the application of MLP to the measurement of financial performance in Jordanian insurance companies. Based on this dataset, we choose also extra factors SB, CP, MC, and SE as input variables to the MLP for high/low financial performance detection.
The input variable in MLP, the total dollar market value of a company’s outstanding shares of stock, is referred to as MC. It is a significant indicator that is derived by multiplying a company’s outstanding shares by its share price (Nurhayati et al. 2021). It allows investors to know the size of one firm in comparison to another. MC represents a firm’s open market value as well as the market’s estimate of its future prospects, since it reflects what investors are prepared to pay for its stock. SE is the amount of money invested in a firm in exchange for stocks, plus all subsequent earnings, less all subsequent dividends paid out. Many smaller firms are suffering from financial distress and have never paid dividends. SE in their case is simply invested capital plus all subsequent earnings (Welc 2022). CP refers to the entire sum that an insurance provider pays to the insured when insurable risks occur. To prevent the insured from profiting from a loss and to minimize moral hazard, the insurance company, in this situation, agrees to pay no more than the actual value of the loss. SB refers to the amount of money recovered after the claim is paid. The principle of subrogation in insurance firms refers to replacing the insured with the insurer to obtain compensation from a third party for a loss covered by insurance, to stop the insured from receiving payments twice for the same loss, to leave the wrong person liable for the damage, and to keep insurance costs low (Melsew 2022).
There are two main objectives of this study: (1) to identify the determinants of TAT in insurance companies in Jordan and (2) to classify insurance companies’ financial performance (TAT) based on the MLP model. The main hypothesis in this study is H 0 : there is no statistically significant impact of micro-economic variables on the financial performance of Jordanian insurance companies. Meanwhile, the sub-hypotheses are as follows.
H01: 
There is no statistically significant relationship between SB and TAT in the Jordanian insurance sector.
H02: 
There is no statistically significant relationship between CP and TAT in the Jordanian insurance sector.
H03: 
There is no statistically significant relationship between MC and TAT in the Jordanian insurance sector.
H04: 
There is no statistically significant relationship between SE and TAT in the Jordanian insurance sector.
The organization of the paper is structured as follows: Section 2 discusses the literature review and several research studies. In 
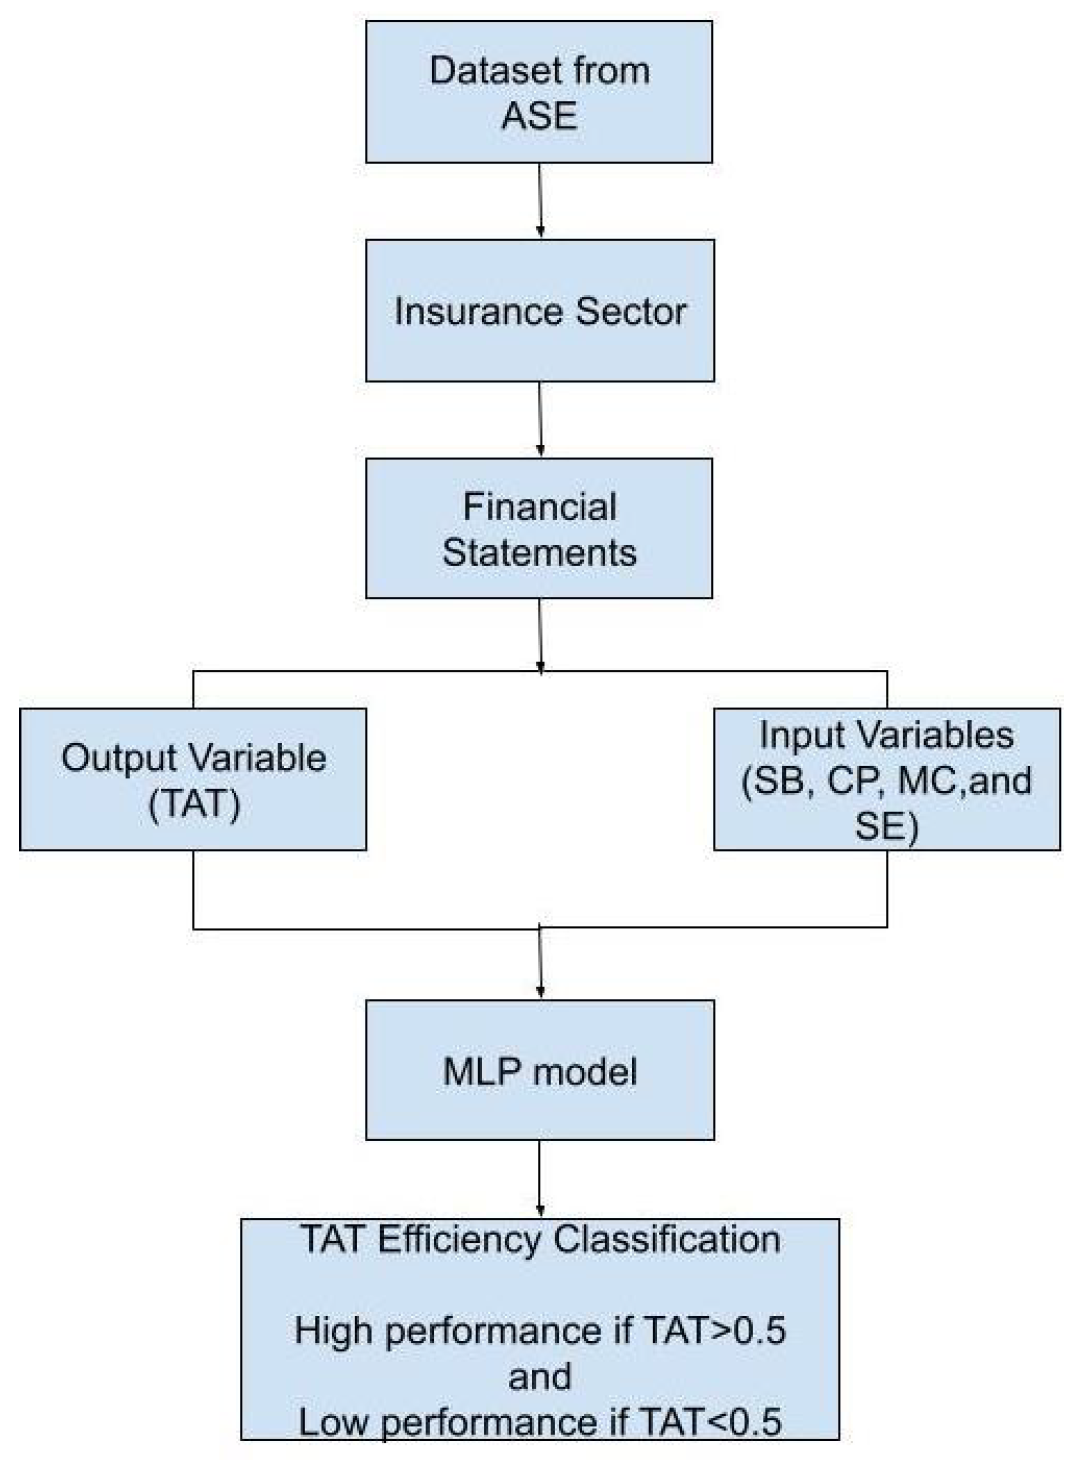
Section 3, we set out the methodology with a flowchart that shows the stages that describe how the data are processed. A description of the MLP neural network is given also in Section 3. The experimental settings, results, and discussion are presented in Section 4 and Section 5. Limitations and directions for future research are given in Section 6, while the conclusions follow in Section 7.

2. Literature Review

In the literature, there are several research studies around the firm’s performance (Jaber et al. 2022) using Data Envelopment Analysis (DEA) to evaluate the performance efficiency of Jordan’s mining and extraction industry. The information used covered six out of fifteen firms that accounted for around 90% of the overall market capitalization in the mining and extraction industry in the Amman Stock Exchange (ASE). From 2000 to 2020, 126 observations were collected. Market capitalization and operational revenue were used to assess the performance of the companies. The DEA models also included current assets, non-current assets, operational expenditures, and general administration expenses as input variables. This study also looked at the impact of GDP growth and return on assets (ROA) on performance efficiency scores for BCC models. The influence on efficiency performance under BCC models was revealed through GDP growth and ROA. Derbali (2014) investigated the influence of firm-specific factors (size, leverage, tangibility, risk, premium growth, liquidity, and age) on the performance of eight insurance firms in Tunisia from 2005 to 2012. According to the findings of a regression using panel data, age and premium growth are the most important indicators of an insurance firm’s profitability as assessed by the ROA. The performance of insurance companies is then not statistically significant in terms of leverage, tangibility, liquidity, and risk. Septina (2022) investigated the impact of insurance-company-specific characteristics (the claims ratio, premium growth ratio, and risk-based capital ratio) and macroeconomic factors (GDP and inflation) on the financial performance of Indonesian general insurance firms. Financial performance was proxied by the return on assets and return on equity. The research sample consisted of 35 registered general insurance businesses with the Financial Services Authority (OJK) from 2016 to 2019. The study technique was panel data regression analysis using a three-stage model estimation methodology, the Chow test, Hausman test, and Lagrange multiplier test, to determine the most suitable regression model among the Common Effect Model, Fixed Effect Model, or Random Effect Model. The Random Effect Model was found to be the best regression model to use. The results demonstrate that the claims ratio has a considerable impact on ROA and ROE, whereas the risk-based capital ratio has little impact on ROA but has no impact on ROE. Meanwhile, the premium growth ratio, GDP, and inflation have no significant effect on ROA and ROE.
Osman and Samontaray (2022) discussed the relationship between important corporate governance characteristics and the performance of general insurance companies in the Saudi stock exchange (TADAWUL). The study’s methodology was based on pooled data collection for 11 firms between 2011 and 2020. The linear regression model and the logarithm regression model were proposed. Firm performance as evaluated by ROA, ROE, and Tobin’s Q was the dependent variable. The independent variables were corporate governance variables that included all aspects of the board and audit committee. The empirical findings showed that corporate governance factors impact insurance firms’ performance. The size of the board, the tenure of the board, the number of independent directors on the board, the size of the audit committee, the frequency of audit committee meetings, and the proportion of health insurance premiums all had a favorable influence. However, the independence of the audit committee, the size of the firm, and the share of reinsurance premiums had a detrimental influence on the performance of Saudi general insurance companies. Finally, the empirical findings revealed an ambiguous relationship between performance and board meeting frequency, board compensation, and the average age of the board.
Alsamhi et al. (2022) investigated the influence of the pandemic (COVID-19) on the financial performance of many Indian sectors (construction, tourism and hospitality, food, and consumer sectors). The study gathered information from 371 businesses. In the tourism, hospitality, and consumer sectors, there was a considerable difference in total revenue, net sales, net profit, earnings per share, and diluted earnings per share before and after the pandemic. The study also discovered that the COVID-19 epidemic had the greatest impact on the tourism, hospitality, and consumer sectors, followed by the construction sector and the food sector, which experienced a slight impact. Mwanja (2021) investigated the impact of operational and market risk exposures on the financial performance of Kenyan DT-SACCOs. The impact of the interest rate risk and foreign exchange risk, operational risk, and market risk exposure on financial performance was considered. The study examined panel data from 2010 to 2019. The findings demonstrated that the operational expenditure risk, operating efficiency, and foreign exchange risk exposure had a significant influence on financial performance in both bivariate and multivariate regression. Only interest rate risk exposure had no influence on the financial performance of Kenyan DT-SACCOs. Almajali and Shamsuddin (2019) investigated the impact of capital structures on the profitability of Jordanian insurance firms. From 2008 to 2017, a sample of 19 insurance companies listed on the Amman Stock Exchange was chosen. The regression analysis and correlations were used to estimate the functions associated with profitability, as defined by return on equity (ROE) and Tobin’s Q, and capital structure, as defined by short-term debt (STD), long-term debt (LTD), and equity financing (TQ). Inflation and sales growth were also utilized as control factors. Statistical evidence demonstrates that STD and LTD are favorably connected with ROE, but ETQ is adversely correlated with all profitability indicators. The results also demonstrate that financial leverage has a positive impact on profitability. Melsew (2022) determined the variables influencing the performance of the Nile Insurance Company, S.C. (NIC). Structured questionnaires were used to collect data from clients, employees, and intermediaries. He discovered that the most important determinants of NIC performance were accident notification, brokers, risk management, competitor pricing, premium growth, and inspectors.
Jaber et al. (2022) estimated the performance efficiency of Jordan’s mining and extraction industry using Data Envelopment Analysis (DEA). The dataset covered six out of fifteen companies that accounted for around ninety percent of the total market capitalization in the sector on the Amman Stock Exchange (ASE). The collection included 126 observations from 2000 to 2020. As the output of the DEA model, the market capitalization and operating revenue were used to evaluate the company’s performance. Current assets, non-current assets, operating expenses, and general administrative expenses were also used as input variables in the DEA models. They determined the sector’s average efficiency to identify company weaknesses and strengths. It was observed that the performance efficiency of the NAST Company was better than that of the other companies based on BCC (input/output). Furthermore, Sadeghi et al. (2023) investigated the dual effect of marketing and profit creation in insurance companies with DEA in the three periods of 1396 to 1398. The marketing performance and profitability of 20 insurance companies were examined and the efficiency of the companies was calculated. The results showed that the Asia, Parsian, Dey, Pasargad, Kowsar, and Ta’avon insurance companies were fully efficient and the Novin Insurance Company had the lowest efficiency.
Moro and Anderloni (2014) investigated the economic performance of non-life insurance companies in the Italian market. The study used a panel data approach and analyzed the financial data of 52 insurance companies from 2006 to 2011. The authors examined the relationship between company size, asset turnover (premium to asset ratio), profitability, and solvency, and how these factors affected the economic performance of the companies. According to the authors, asset size and diversification have a negative influence on ROA, but reserve size and asset turnover have a positive impact. Furthermore, the larger companies have higher profitability and solvency ratios, which positively affect their economic performance. However, they found no evidence that profitability and solvency have a significant impact on the economic performance of smaller companies. Derbali and Jamel (2018) investigated the determinants of performance in Tunisian life insurance companies. The study analyzed the financial data of 12 life insurance companies from 2010 to 2016 using a panel data approach. The authors examined the impact of various factors, including company size, profitability, solvency, and efficiency, on the performance of the companies. According to the findings, company size, profitability, and solvency all have a positive influence on performance; however, efficiency has a negative impact. Furthermore, the study discovered that the influence of these determinants on performance varied between different types of life insurance companies.
Guendouz and Ouassaf (2018) investigated the factors that contribute to Saudi takaful insurance companies’ profitability. A comprehensive set of 18 exogenous and 5 endogenous variables were used over a sample period of 2012-2016. Empirical results through regression analysis indicate that insurance penetration and education level have a positive effect on profitability, while Islamic credit, operational complexity, and financial leverage have a negative effect on profitability. Additionally, results show that increasing premiums, age, and cooperatives on a regional level are also positively associated with profitability. Abebe and Abera (2019) examined the determinants of financial performance in Ethiopian insurance companies. The study used a panel data approach and analyzed the financial data of 17 insurance companies from 2010 to 2017. The authors investigated the impact of various factors, including company size, liquidity, leverage, and efficiency, on financial performance. According to the findings, corporate size and efficiency are major elements that affect financial performance positively, whereas liquidity and leverage have a negative impact. Ben Dhiab (2021) examined the determinants of insurance firms’ profitability in the Saudi insurance market, using panel data from six insurers listed on the Riyadh Stock Exchange (RSX) over the period 2014-2018. Five financial performance measures were used to analyze profitability in this sector. The study found that shareholder equity, underwriting policies, premiums, and investments had significant positive effects on profitability, while operational expenses had significant negative effects on profitability.
Irman and Purwati (2020) examined the effects of the current ratio, debt-to-equity ratio, and total asset turnover on the return on assets of automotive and component companies listed in the Indonesian Stock Exchange between 2011 and 2017. Statistical analysis was conducted using secondary data from the Indonesian Stock Exchange and 11 firms within the automotive and components industry. The results indicated that the current ratio and total asset turnover had a positive and significant effect on the return on assets of the automotive and component companies studied. Additionally, the debt-to-equity ratio had no significant influence on the return on assets of these firms. The implications of these findings and suggestions for further research were discussed. Munawar (2019) examined the impact of three financial ratios—liquidity, leverage, and total asset turnover—on the profitability of non-financial manufacturing companies listed on the Indonesian Stock Exchange (IDX) during the period 2012–2017. The panel data regression analysis of 388 non-financial manufacturing firms shows that the liquidity ratio has positive and statistically significant effects on firm profitability. Leverage and total asset turnover have a negative effect on firm profitability. Other control variables such as ownership concentration, size, and growth opportunities have significant effects on firm profitability.
Rajagukguk and Siagian (2021) examined the influence of liquidity and total asset turnover on the profitability of pharmaceutical companies listed on the Indonesian Stock Exchange. The sample consisted of eleven listed pharmaceutical companies in Indonesia, and the data were taken from their financial statements over the period 2017–2020. The analysis employed regression analysis, random effect panel models, and two-stage least squares to analyze the effect of liquidity (accounts receivable and inventory turnover) and total asset turnover on profitability. The research revealed that both accounts receivable and inventory turnover had a significant positive effect on profitability. Additionally, the results suggested that total asset turnover had a significant negative effect on profitability. Kurniawan (2021) investigated the effects of return on assets (ROA), the debt-to-equity ratio (DER), and total assets turnover (TAT) on the share return. Secondary data from 23 property and real estate companies listed on the Indonesian Stock Exchange in the period from 2009 to 2016 were used for this research. The data were analyzed using the regression method. The results of the analysis show that ROA, DER, and TAT have a positive and significant effect on the share return. Meanwhile, the multiple linear regression model proved that the three independent variables had an R-square of 87%.

3. Methodology and Mathematical Models

We divide the methodology in this study into two parts. In the first part, we compute TAT using financial information from insurance firms listed on the Amman Stock Exchange (ASE). Because the majority of TAT data are less than one, the threshold of 0.5 is used to separate TAT data into (high/low) efficiency performance. In the second part, we employ the MLP neural network with the microeconomic variables SB, CP, MC, and SE as input variables. The two parts are depicted in Figure 1.

3.1. Multilayer Perceptron

Multilayer Perceptron (MLP) is a perceptron that collaborates with other perceptrons stacked in several layers to solve complicated tasks. Rosenblatt (1961), a Cornell scientist, introduced the perceptron as a simple binary classification technique. The perceptron is the fundamental unit that supports what is known as deep learning. It is the artificial neuron that, when combined with many others of its kind, can solve difficult, unsolvable problems in the same way that people do. A perceptron is a very simple machine for learning. It may accept a few inputs, each with a weight to indicate how essential it is, and output a “0” or “1” decision. When linked with a large number of additional perceptrons, it produces an artificial neural network. Given enough training data and computing power, a neural network can potentially answer any question.
Figure 2 depicts the structure of a three-layered MLP network. Each perceptron in the first layer on the left (the input layer) provides its output to all of the perceptrons in the second layer (the hidden layer), and all of the perceptrons in the second layer send their output to the final layer on the right (the output layer). Each perceptron delivers numerous signals, one to each perceptron in the next layer. The perceptron uses different weights for each signal. A non-deep or shallow neural network is a three-layer MLP, as seen in the diagram below. A deep neural network is an MLP with four or more layers. The conventional perceptron’s decision function is a step function, and the output is binary, which distinguishes an MLP from a neural network. Other activation functions that are used in real-valued outputs, typically between 0 and 1 or -1 and 1, can be employed in neural networks that originate from MLPs. This enables probability-based forecasts or object categorization into several labels.
The perceptron receives n features as input X = < S B , C P , M C , a n d S E > , and each of these features is associated with a weight on arcs connected to the hidden layers. Input features must be numeric and are passed as input to compute the weighted sum:
s ( x ) = i = 1 n w i j X i + b i
The weights enable the perceptron to assess the relative value of each output. Neural network algorithms learn by accumulating ever better weights, resulting in predictions that are more accurate. To fine-tune the weights, numerous methods are utilized; the most frequent one is the backpropagation method.
The weighted summation is then passed as input to an activation function f, which produces the output of the perceptron. In the original perceptron, the activation function is a step function:
o u t p u t = f ( S ( x ) ) = 1 , i f S ( x ) > θ 0 , o t h e r w i s e
where θ is a threshold parameter.

3.2. Learning Process

With numerous weights w i j that connect the input node to hidden neurons and then to the output node, the learning process updates the value of weights using a backpropagation algorithm according to the output errors E between the predicted and actual outputs. The network minimizes the difference between the actual responses and predicted TAT to be close to each other in a series of epochs (or iterations) using Equation (3).
w i j ( t + 1 ) = w i j ( t ) ϵ E w i j ( t )
The learning rate ϵ controls how quickly the backpropagation algorithm operates with a batch of samples during each iteration. A lower learning rate value results in more training time for each epoch, whereas a large learning rate hinders the learning from reaching the minimum error. The gradient descent using derivation with respect to weight updates the weights that are handled by the learning rate. The value of the learning rate determines the performance of the backpropagation algorithm in reducing the error to achieve optimality. To control the oscillation when using a large learning rate value, Riedmiller and Braun (1993) proposed to combine momentum term μ as given by Equation (4).
Δ w i j ( t ) = ϵ E w i j ( t ) + μ Δ w i j ( t 1 )
Although the stability of the learning process depends on the momentum term, selecting the optimal value presents a challenge. The default value in the majority of MLP networks typically works well and is varied within the range of 0.1 to 0.9.

3.3. Resilient Propagation (Rprop)

The appropriate learning rate requires a resilient propagation-learning scheme that directly adapts the weight from local gradient information Almiani et al. (2022). The Rprop method performs a local update for each weight as in the following learning rule. The rule states that each individual update value Δ i j either rises or decreases at each iteration when multiplied by an asymmetric factor η + or η . This depends on the direction of the gradient regarding w i j between two iterations.
Δ i j ( t ) = η + Δ i j ( t 1 ) , i f E t 1 w i j E t w i j > 0 η Δ i j ( t 1 ) , i f E t 1 w i j E t w i j < 0 Δ i j ( t 1 ) , o t h e r w i s e
where 0 < η < 1 < η + ; w i j is the weight from neuron j to neuron i, and t is the partial derivative degree. Therefore, the updated value for weight Δ i j is dropped by the factor η each time the partial derivative of the error E concerning weight w i j changes sign, indicating that the most recent update is high and the algorithm leaps over a local minimum. The modified value is raised slightly to speed up convergence if the derivative preserves its sign.

3.4. Evaluation Measures

The evaluation metrics are crucial indications to validate the performance of ML models. There are a variety of metrics that provide information about the performance of models for unknown (or future) instances. However, to cover the participation in each instance of the training set in evaluating the performance of the model, we use a 10-fold cross-validation technique. The technique sequentially divides the dataset in each epoch (iteration) into training and test sets of 90% and 10%, respectively, and then evaluates the performance of the trained model using the test set. The average of ten models is the final performance result expected for the ML model. However, the evaluation metrics comprise a set of parameters that define how correct the target to predicted values in the test set are. True positive (TP) is one of the parameters and metrics, referring to positive instances labeled as positive. False positive (FP) refers to negative instances labeled as positive. True negative (TN) is a metric that refers to negative targets and predicted instances. False negative (FN) is the number of positive cases labeled as negative.
-
Precision focuses on positive instances by computing the percentage of TP instances pertaining to true and false positive instances.
P r e c i s i o n = T P T P + F P
-
The false positive rate (FP rate) refers to a type I error that associates the percentage of FP to FP and TN metrics.
F P r a t e = F P F P + T N = 1 T N r a t e
-
The false negative rate (FN rate) refers to a type II error that associates the percentage of FN to FN and TP metrics.
F N r a t e = F N F N + T P = 1 T P r a t e
-
The F-measure (or F-score) is the harmonic mean of precision and sensitivity T P T P + F N .
- F m e a s u r e = 2 P r e c i s i o n S e n s i t i v i t y P r e c i s i o n + S e n s i t i v i t y
-
Accuracy (ACC) is the proportion of true positive and negative instances over the total number of instances.
A C C = T P + T N P + N = T P + T N T P + T N + F P + F N

4. Empirical Setting and Results

4.1. Data Description

The variables are drawn from the financial statements of insurance companies. These firms are listed on the Amman Stock Exchange (ASE) in Jordan. From 2008 through 2020, an annual dataset was gathered from 15 out of 17 insurance companies. The variables have equal time series with 195 observations. The firms selected are Al-Nisr Al-Arabi Insurance, Jordan Insurance, Delta Insurance, Jerusalem Insurance, The United Insurance, Jordan French Insurance, Al-Manara Insurance Plc. Co., the Arab Orient Insurance Company, Arab Union International Insurance, National Insurance, Jordan International Insurance, the Euro Arab Insurance Group, the Arab Jordanian Insurance Group, the Mediterranean & Gulf Insurance Company, Jordan P.L.C, and Middle East Insurance. Table 1 presents the descriptive statistics for the dataset, which we will utilize as input and output variables in our model. The output variable is TAT in our investigation. The input variables are SB, CP, MC, and SE. We believe that these input variables are independent non-stationary time series with a strong influence on TAT, which we investigate in the next subsections.
The boxplot of the input variables is presented in Figure 3. As shown, the SB variable values are distributed from approximately 11 to 15.5, while the SE, MC, and CP variables’ values are disseminated from 14.5 to 18.5. The CP and SB contain outliers that have an effect on ML classifiers.

4.2. Multicollinearity Tests

In this section, we examine the multicollinearity problem. When the regression model’s input variables have a significant correlation with one another, multicollinearity occurs. It makes the model difficult to interpret and produces an overfitting problem. It is a typical assumption that researchers test before deciding which variables to include in the regression model. The variance inflation factor (VIF) and tolerance test are used to detect the severity of multicollinearity in the ordinary least square (OLS) regression analysis. The VIF is a statistical term that represents the increase in the variance of a regression coefficient caused by collinearity. The greater the value of VIF, the stronger the connection between this variable and the others. Tolerance is calculated using the formula tolerance = 1/VIF. In general, a VIF greater than 4 or tolerance less than 0.25 suggests the possibility of multicollinearity. In Table 2, the VIF and tolerance of Ln (SB) are 1.953 and 0.512, respectively. Furthermore, the VIF and tolerance of Ln (CP) are 2.391 and 0.418, respectively. Moreover, the VIF and tolerance of Ln (MC) are 3.356 and 0.298, respectively. Finally, the VIF and tolerance of Ln (ES) are 3.718 and 0.269, respectively. Multicollinearity does not exist in any of the selected input variables in Table 2.

4.3. Multiple Regression Models

In this section, the OLS, fixed effect, and random effect are used to explore the effectiveness of the input variables (SB, CP, MC, and SE) on the output variable (TAT), as shown in Table 3. In OLS, the results show that the variable SB ( β = 0.042) has a significant positive effect on TAT at a substantial level of less than 5%. This, therefore, rejects H 01 . The variable of CP ( β = 0.204) has a significant positive effect on TAT at a considerable level of less than 1%, which rejects H 02 . The variable of MC ( β = 0.047) has a significant positive effect on TAT at a substantial level of less than 5%. As a result, we reject H 03 . There is a significant negative effect of variable SE ( β = −0.211) on TAT at a substantial level of less than 1%. Therefore, we reject H 04 . The R-squared and adjusted R-squared are 0.59 and 0.58, respectively. In the fixed effect, the results in the table show that the variable SB ( β = 0.043) has a significant positive effect on TAT at a considerable level of less than 1%, which rejects H 01 . The CP variable ( β = 0.133) significantly positively affects TAT at a significant level of less than 1%. Consequently, we reject H 02 . The MC variable ( β = 0.081) has a significant positive effect on TAT at a substantial level of less than 1%, which rejects H 03 . There is a substantial negative effect of the SE variable ( β = −0.215) on TAT at a significant level of less than 1%. Thus, we reject H 04 . The R-squared and adjusted R-squared are 0.461 and 0.414, respectively. In the random effect, the results in the table show that the SB variable ( β = 0.044) has a significant positive effect on TAT at a substantial level of less than 1%. Thus, we reject H 01 . The CP variable ( β = 0.155) significantly positively affects TAT at a significant level of less than 1%. Therefore, we reject H 02 . The MC variable ( β = 0.065) significantly positively affects TAT at a significant level of less than 1%. Hence, we reject H 03 . There is a substantial negative effect of the SE variable ( β = −0.212) on TAT at a substantial level of less than 1%. Therefore, we reject H 04 . The R-squared and adjusted R-squared are 0.461 and 0.414, respectively. Hence, the multiple regression models support our claim that the variables (SB, CP, MC, and SE) have a direct effect on the TAT.

4.4. MLP Model

The MLP model serves to determine if a data point from the TAT series has high or low performance. Our dataset was divided into 80% training (156 observations) and 20% testing (39 observations). We utilize four input neurons, 50 hidden neurons, 0.001 parameters for the learning function, and one output neuron as input to the MLP network. The four variables SB, CP, MC, and SE are accepted by the input neurons, while the output neuron’s predicted value is either 0 (low performance) or 1 (high performance). The low performance occurs if the TAT is less than 0.5, whereas the high performance occurs if TAT is more than 0.5. We used the Rprop method with 500, 1000, 1500, and 10,000 iterations to run the MLP model. Table 4 indicates that the TP rate grew from 53.2% with n = 500 to 77.8% with n = 10,000 in the 80% train data sample, while the TN rate increased from 82.26% with n = 500 to 91.9% with n = 10,000. However, the FP rate fell from 17.4% with n = 500 to 8.1% with n = 10,000, while the FN rate fell from 46.8% with n = 500 to 22.2% with n = 10,000. Table 4 also illustrates these rates for the 20% dataset sample. The TP rate in the test data grew somewhat from 45.5% with n = 500 to 70% with n = 10,000, whereas the TN rate climbed from 82.1% with n = 500 to 89.7% with n = 10,000. However, the FP rate fell from 17.9% for n = 500 to 10.3% for n = 10,000, while the FN rate fell from 54.5% for n = 500 to 30% for n = 10,000. Table 4 shows that the MLP provides superior results in detecting TAT performance in insurance firms based on the overall accuracy criterion rate.
Table 5 summarizes the rest of the criteria to measure the performance of the MLP model. Under 80% of the training sample, the ACC rate in the dataset grew from 73.7% with n = 500 to 87.8% with n = 10,000, whereas the precision rate climbed from 56.8% with n = 500 to 79.5% with n = 10,000. Furthermore, the F-score in the dataset grew from 54.9% with n = 500 to 70% with n = 10,000. Under 20% testing, the ACC rate in the dataset grew from 71.8% with n = 500 to 84.6% with n = 10,000, whereas the precision rate climbed from 50% with n = 500 to 70% with n = 10,000. Moreover, the F-score climbed from 47.6% with n = 500 to 70% with n = 10,000. Consequently, all the performance measurement criteria increased when the number of iterations increased from n = 500 to n = 10,000. Table 5 reveals that, based on the overall accuracy rate, the MLP was successful in determining the TAT performance in insurance companies.

5. Discussion

Asset turnover is a metric used to measure the efficiency of a company’s ability to use its assets to generate revenue. Companies use this metric to assess the effectiveness of their use of resources and to determine ways in which they can improve their profitability. One advantage of total asset turnover is that it enables a company to measure its performance against its competitors and identify areas for improvement. Companies have direct control over their asset base and can use asset turnover as a benchmark to measure their performance compared to other organizations in their industry. By examining asset turnover, companies can determine whether their investments in resources deliver the desired returns and can focus on optimizing their asset utilization for the best possible returns. Another advantage is that total asset turnover is often used as an indication of profitability. By analyzing the asset turnover of different companies, investors can obtain an idea of which companies are more profitable than their rivals. A higher asset turnover ratio may indicate that a company is more efficient at deploying its resources and is likely to generate more profits than its rivals. As such, investors may be more likely to invest in companies with high asset turnover ratios. Moro and Anderloni (2014) discovered a positive effect of asset turnover on the performance of insurance companies in the Italian market. In addition, Irman and Purwati (2020) found that total asset turnover has a positive and significant influence on automotive and component firms’ profitability (return on assets). Moreover, return on assets (ROA), the debt to equity ratio (DER), and total asset turnover (TAT) have a good and significant influence on stock returns in property and real estate firms, according to Kurniawan (2021). However, total asset turnover has a negative influence on the firm profitability of non-financial manufacturing and pharmaceutical companies listed on the Indonesian Stock Exchange; see Munawar (2019) and Rajagukguk and Siagian (2021).
The OLS, fixed effect, and random effect were used in the first portion of this study to discover the determinants of the output variable (TAT). The multiple regression models show that the input variables (SB, CP, MC, and SE) directly influence TAT at a less than 5% significance level. In other words, there is a positive, statistically significant relationship between SB, CP, and MC and TAT in the Jordanian insurance sector. Thus, H 01 , H 02 , and H 03 are all rejected. However, there is a negative, statistically significant relationship between SE and TAT in the Jordanian insurance sector. Thus, H 04 is rejected also. In short, high SB, CP, and MC will improve TAT, while SE will decrease it. In the second portion of this study, the MLP model was used to predict the TAT efficiency classification of the insurance sector. TAT efficiency performance is classified as high performance (TAT > 0.5) and low performance (TAT < 0.5). The accuracy criteria were used to measure the performance of the MLP model. The results show that all the performance measurement criteria increased when the number of iterations increased from n = 500 to n = 10,000. In brief, TAT prediction will assist in insurance performance prediction.

6. Limitations and Directions for Future Research

This research used the Multilayer Perceptron (MLP) to detect the (high/low) total asset turnover (TAT) of insurance companies on Jordan’s Amman Stock Exchange (ASE). There are several limitations to the research. (1) We merely use subrogation (SB), claims paid (CP), market capitalization (MC), and total shareholders’ equity (SE) as input variables to the MLP model. In the future, we intend to address this restriction, utilizing different financial variables. (2) We consider the insurance companies listed on the Amman Stock Exchange (ASE), intending to expand the experiments to include insurance companies from other developing countries in the future. (3) The limited yearly financial data are selected from 2008 to 2020, without considering the COVID-19 period. In future work, we will consider COVID-19’s financial data in our upcoming research.
Our future work will aim to evaluate our models on samples from various developing countries, which would be beneficial. Additionally, we plan to incorporate different neural network models and compare them with our current study. The results of this study are expected to have managerial implications for improving decision making and contributing to management policies. We recommend that insurance companies utilize the indicator results to enhance their efficiency performance.

7. Conclusions

In this study, we predicted the financial performance of insurance firms in Jordan. In the Jordanian insurance sector, the MLP model is used to categorize financial performance as high or low. According to multicollinearity tests (tolerance and VIF) and multiple regression models (OLS, fixed effect, and random effect), we selected the subrogation, claims paid, market capitalization, and total shareholders’ equity as input to the MLP model. The results showed that the input variables do not have multicollinearity because the VIFs are less than 4 and the tolerance is more than 0.25. However, multiple regression tests were used to determine whether the inputs were significant with the output (TAT). The multiple regression models confirm that the input variables (SB, CP, MC, and SE) have a direct effect on the TAT at a significant level of less than 5%. The output variable is based on 195 yearly observations from the sample size of 15 out of 22 selected insurance firms from 2008 to 2020. The MLP model seeks to determine if a data point from the TAT series has high or low performance. Our dataset was divided into 80% training (156 observations) and 20% testing (39 observations). The four variables SB, CP, MC, and SE are accepted by the input neurons, while the output neuron’s predicted value is either 0 (low performance) or 1 (high performance). The low performance occurs if TAT is less than 0.5, whereas the high performance occurs if TAT is more than 0.5. We used the Rprop method with 500, 1000, 1500, and 10,000 iterations to run the MLP model. All the performance measurement criteria increased when the number of iterations (n) increased from 500 to 10,000. As a result, the prediction model proposed could be applied to other sectors of the economy.

Author Contributions

Conceptualization, R.A.O., R.S.A. and J.J.J.; methodology, R.A.O., R.S.A. and J.J.J.; software, R.A.O. and J.J.J.; validation, R.S.A. and J.J.J.; formal analysis, R.A.O. and J.J.J.; investigation R.S.A.; resources, R.A.O. and J.J.J.; data curation, R.A.O.; writing—original draft preparation, R.A.O.; writing—review and editing, R.S.A. and J.J.J.; visualization, R.S.A. and J.J.J.; supervision, R.S.A. and J.J.J.; project administration, J.J.J.; funding acquisition, R.A.O. All authors have read and agreed to the published version of the manuscript.

Funding

This research received no external funding.

Informed Consent Statement

Not applicable.

Data Availability Statement

The data presented in this study are available on request from the corresponding author.

Conflicts of Interest

The authors declare no conflict of interest.

Note

1
History of Insurance Regulations and Development of Regulations in Jordan. Jordan Insurance Federation, Retrieved from http://www.joif.org/ (accessed on 1 December 2022).

References

  1. Abebe, Aster Ketema, and Meseret Tadesse Abera. 2019. Determinants of financial performance: Evidence from ethiopia insurance companies. Journal of Accounting, Finance and Auditing Studies 5: 155–72. [Google Scholar]
  2. Alkhawaldeh, Rami S. 2021. Arabic (indian) digit handwritten recognition using recurrent transfer deep architecture. Soft Computing 25: 3131–41. [Google Scholar] [CrossRef]
  3. Alkhawaldeh, Rami S., Moatsum Alawida, Nawaf Farhan Funkur Alshdaifat, Wafa’Za’al Alma’aitah, and Ammar Almasri. 2022. Ensemble deep transfer learning model for arabic (indian) handwritten digit recognition. Neural Computing and Applications 34: 705–19. [Google Scholar] [CrossRef]
  4. Alkhawaldeh, Rami S., Saed Khawaldeh, Usama Pervaiz, Moatsum Alawida, and Hamzah Alkhawaldeh. 2019. Niml: Non-intrusive machine learning-based speech quality prediction on voip networks. IET Communications 13: 2609–16. [Google Scholar] [CrossRef]
  5. Almajali, Mohannad, and Zelhuda Shamsuddin. 2019. The effect of capital structure on performance of insurance companies: Evidence from jordan. International Journal of Accounting 4: 64–73. [Google Scholar]
  6. Almiani, Muder, Alia Abughazleh, Yaser Jararweh, and Abdul Razaque. 2022. Resilient back propagation neural network security model for containerized cloud computing. Simulation Modelling Practice and Theory 118: 102544. [Google Scholar] [CrossRef]
  7. Alomari, Mohammad W., and Islam A. Azzam. 2017. Effect of the micro and macro factors on the performance of the listed jordanian insurance companies. International Journal of Business and Social Science 8: 66–73. [Google Scholar]
  8. Alsamhi, Mohammed H., Fuad A. Al-Ofairi, Najib H. S. Farhan, Waleed M. Al-ahdal, and Ayesha Siddiqui. 2022. Impact of covid-19 on firms’ performance: Empirical evidence from india. Cogent Business & Management 9: 2044593. [Google Scholar]
  9. Ben Abdel Ouahab, Ikram, Lotfi Elaachak, and Mohammed Bouhorma. 2022. Image-based malware classification using multi-layer perceptron. In Networking, Intelligent Systems and Security. Singapore: Springer, pp. 453–64. [Google Scholar]
  10. Ben Dhiab, Lassad. 2021. Determinants of insurance firms’ profitability: An empirical study of saudi insurance market. The Journal of Asian Finance, Economics and Business 8: 235–43. [Google Scholar]
  11. Derbali, Abdelkader, and Lamia Jamel. 2018. Determinants of performance of tunisia insurance companies: Case of life insurance. International Journal of Productivity and Quality Management 24: 531–42. [Google Scholar] [CrossRef]
  12. Derbali, Abdelkader Mohamed Sghaier. 2014. Determinants of performance of insurance companies in tunisia: The case of life insurance. International Journal of Innovation and Applied Studies 6: 90–96. [Google Scholar] [CrossRef]
  13. Guendouz, Abdelkrim Ahmed, and Saidi Ouassaf. 2018. Determinants of saudi takaful insurance companies profitability. Academy of Accounting and Financial Studies Journal 22: 1–24. [Google Scholar]
  14. Irman, Mimelientesa, and Astri Ayu Purwati. 2020. Analysis on the influence of current ratio, debt to equity ratio and total asset turnover toward return on assets on the otomotive and component company that has been registered in indonesia stock exchange within 2011–2017. International Journal of Economics Development Research (IJEDR) 1: 36–44. [Google Scholar] [CrossRef]
  15. Jaber, Jamil J., Fatiha Beldjilali, Ali A. Shehadeh, Nawaf N. Hamadneh, Mohammad Saleh, Muhammad Tahir, and S. Al Wadi. 2022. Estimating performance efficiency of mining and extracting sectors using dea models: The case of jordan. Complexity 2022: 3688381. [Google Scholar]
  16. Kruse, Rudolf, Sanaz Mostaghim, Christian Borgelt, Christian Braune, and Matthias Steinbrecher. 2022. Multi-layer perceptrons. In Computational Intelligence. Cham: Springer, pp. 53–124. [Google Scholar]
  17. Kurniawan, Andrie. 2021. Analysis of the effect of return on asset, debt to equity ratio, and total asset turnover on share return. Journal of Industrial Engineering & Management Research 2: 64–72. [Google Scholar]
  18. Lubis, Chairani, Bintang Sahala Marpaung, and Annaria Magdalena Marpaung. 2018. Total asset turnover effect, working capital turnover and debt ratio on stock price. Paper presented at International Conference on Accounting and Management Science, Kesatuan Economics Institute, Jakarta, Indonesia, July 16; pp. 269–74. [Google Scholar]
  19. Melsew, Habtamu. 2022. Factors Affecting The Performance Of Nile Insurance Company Sc. Ph.D. thesis, St. Mary’s University, San Antonio, TX, USA. [Google Scholar]
  20. Moro, Ornella, and Luisa Anderloni. 2014. Non-life insurance economic performances-an empirical investigation. Journal of Economics & Management 18: 159–77. [Google Scholar]
  21. Munawar, Aang. 2019. The effect of liquidity, leverage and total asset turnover on profitability: Empirical study of manufacturing companies in indonesia stock exchange 2012–2017. Internaational Journal of Economics and Management Studies 6: 126–31. [Google Scholar]
  22. Mwanja, Sisimonda Kinya. 2021. Effect of operational and market risk exposures on financial performance of dt-saccos in kenya. International Journal of Research in Business and Social Science 10: 107–18. [Google Scholar] [CrossRef]
  23. Nurhayati, Immas, Endri Endri, Renea Shinta Aminda, and Leny Muniroh. 2021. Impact of covid-19 on performance evaluation large market capitalization stocks and open innovation. Journal of Open Innovation: Technology, Market, and Complexity 7: 56. [Google Scholar] [CrossRef]
  24. Nurlaela, Siti, Bambang Mursito, Eny Kustiyah, Istiqomah Istiqomah, and Sri Hartono. 2019. Asset turnover, capital structure and financial performance consumption industry company in indonesia stock exchange. International Journal of Economics and Financial Issues 9: 297. [Google Scholar] [CrossRef]
  25. Osman, Mohamed Abdel Mawla, and Durga Prasad Samontaray. 2022. Corporate governance and performance of insurance companies in the saudi market. The Journal of Asian Finance, Economics and Business 9: 213–28. [Google Scholar]
  26. Rahmani, I., B. Barati, V. Majazi Dalfard, and L. Hatami-Shirkouhi. 2014. Nonparametric frontier analysis models for efficiency evaluation in insurance industry: A case study of iranian insurance market. Neural Computing and Applications 24: 1153–61. [Google Scholar] [CrossRef]
  27. Rajagukguk, Jocelyn, and Harlyn Siagian. 2021. The effect of liquidity and total asset turnover on profitability: Research study n pharmaceutical companies in indonesia stock exchange. Ekonomis: Journal of Economics and Business 5: 444–48. [Google Scholar] [CrossRef]
  28. Rejda, George E., and Michael J. McNamara. 2022. Principles of Risk Management and Insurance. London: Pearson. [Google Scholar]
  29. Riedmiller, Martin, and Heinrich Braun. 1993. A direct adaptive method for faster backpropagation learning: The rprop algorithm. Paper presented at IEEE International Conference on Neural Networks, Nagoya, Japan, October 25–29; pp. 586–91. [Google Scholar]
  30. Rosenblatt, Frank. 1961. Principles of Neurodynamics. Perceptrons and the Theory of Brain Mechanisms. Technical Report. Buffalo: Cornell Aeronautical Lab Inc. [Google Scholar]
  31. Ross, Stephen A., Randolph Westerfield, and Bradford Jordan. 2022. Fundamentals of Corporate Finance. New York: McGraw Hill, p. 1008. [Google Scholar]
  32. Sadeghi, Elham, Mohammad Reza Miri Lavasani, Mohsen Rostai Malkhalife, and Mohammadhamed Khanmohammadi. 2023. Evaluating the performance of iranian insurance companies using efficiency measurement method based on modified slack-based measure in the network data envelopment analysis approach. International Journal of Finance & Managerial Accounting 8: 25–41. [Google Scholar]
  33. Santri, Selvi Harvia, Yaswirman Yaswirman, Kurnia Warman, and Wetria Fauzi. 2022. Accountability answers company insurance life based investing against the risk of failure to pay for policyholders. Linguistics and Culture Review 6: 427–37. [Google Scholar] [CrossRef]
  34. Septina, Fanny. 2022. Determinant of financial performance for general insurance companies in indonesia. Jurnal Ecodemica Jurnal Ekonomi Manajemen dan Bisnis 6: 88–97. [Google Scholar] [CrossRef]
  35. Siregar, Muhammad Yamin, and Mardiana Mardiana. 2022. Effect of quick ratio, total asset turnover, and receivable turnover on return on assets in food and beverages companies listed on the indonesia stock exchange (idx). Budapest International Research and Critics Institute (BIRCI-Journal): Humanities and Social Sciences. [Google Scholar] [CrossRef]
  36. Welc, Jacek. 2022. Financial statement analysis. In Evaluating Corporate Financial Performance. Cham: Springer, pp. 131–212. [Google Scholar]
Figure 1. Flowchart based on MLP neural network.
Economies 11 00106 g001
Figure 2. MLP structure model.
Economies 11 00106 g002
Figure 3. The boxplot of the independent variables.
Economies 11 00106 g003
Table 1. Descriptive statistics for the ASE dataset.
VariablesSizeMeanStd. DeviationMinimumMaximum
TAT1950.636040.187470.305431.16872
Subrogation (SB)1951,601,1351,210,2070.0000005,237,623
Claims Paid (CP)19517,496,88215,278,1532,260,27793,965,336
Market Capitalization (MC)19517,901,86417,295,5582,100,00089,400,000
Total Shareholders’ Equity (SE)19515,431,18011,107,5212,642,70348,140,795
Table 2. Multicollinearity tests.
ToleranceVIF
Ln(SB)0.5121.953
Ln(CP)0.4182.391
Ln(MC)0.2983.356
Ln(ES)0.2693.718
Table 3. OLS, fixed effect, and random effect.
Independent VariablesOLSFixed EffectRandom Effect
EstimateStd. ErrorT-StatEstimateStd. ErrorT-StatEstimateStd. ErrorT-Stat
Intercept−0.6050.247−2.447 ** −0.1330.278−0.480 ***
Ln(SB)0.0420.0133.138 ***0.0430.0143.148 ***0.0440.0133.293 ***
Ln(CP)0.2040.0219.883 ***0.1330.0216.394 ***0.1550.0217.539 ***
Ln(MC)0.0470.0202.352 **0.0810.0263.169 ***0.0650.0232.870 ***
Ln(SE)−0.2110.025−8.506 ***−0.2150.027−7.843 ***−0.2120.026−8.060 ***
R-squared/Adjusted R-squared0.590/0.5810.462/0.4140.498/0.487
F-stat.68.36 ***38.251 ***188.409 ***
Significant codes: “***” 0.01 “**” 0.05.
Table 4. Statistical criteria to classify datasets.
IterationsSampleMatrixTP RateTN RateFP RateFN Rate
LowHigh
n = 500Train (80%)Low25190.5320.8260.1740.468
High2290
Test (20%)Low550.4550.8210.1790.545
High623
n = 1000Train (80%)Low34100.6420.9030.0970.358
High1993
Test (20%)Low730.6360.8930.1070.364
High425
n = 1500Train (80%)Low33110.6470.8950.1050.353
High1894
Test (20%)Low730.6360.8930.1070.364
High425
n = 10,000Train (80%)Low3590.7780.9190.0810.222
High10102
Test (20%)Low730.7000.8970.1030.300
High326
Table 5. Statistical criteria for detecting high/low performance.
IterationsSampleACCPrecisionF-Score
n = 500Train (80%)0.7370.5680.549
Test (20%)0.7180.5000.476
n = 1000Train (80%)0.8140.7730.701
Test (20%)0.8210.7000.667
n = 1500Train (80%)0.8140.7500.695
Test (20%)0.8210.7000.667
n = 10,000Train (80%)0.8780.7950.787
Test (20%)0.8460.7000.700
Disclaimer/Publisher’s Note: The statements, opinions and data contained in all publications are solely those of the individual author(s) and contributor(s) and not of MDPI and/or the editor(s). MDPI and/or the editor(s) disclaim responsibility for any injury to people or property resulting from any ideas, methods, instructions or products referred to in the content.

