Article

An Improved Photovoltaic Module Array Global Maximum Power Tracker Combining a Genetic Algorithm and Ant Colony Optimization

Department of Electrical Engineering, National Chin-Yi University of Technology, Taichung 41170, Taiwan
*
Author to whom correspondence should be addressed.
Technologies 2023, 11(2), 61; https://doi.org/10.3390/technologies11020061
Submission received: 17 January 2023 / Revised: 20 March 2023 / Accepted: 17 April 2023 / Published: 20 April 2023
(This article belongs to the Topic Advances in Solar Technologies)

Abstract

:
In this paper, a hybrid optimization controller that combines a genetic algorithm (GA) and ant colony optimization (ACO) called GA-ACO algorithm is proposed. It is applied to a photovoltaic module array (PVMA) to carry out maximum power point tracking (MPPT). This way, under the condition that the PVMA is partially shaded and that multiple peaks are produced in the power-voltage (P-V) characteristic curve, the system can still operate at the global maximum power point (GMPP). This solves the problem seen in general traditional MPPT controllers where the PVMA works at the local maximum power point (LMPP). The improved MPPT controller that combines GA and ACO uses the slope of the P-V characteristic curve at the PVMA work point to dynamically adjust the iteration parameters of ACO. The simulation results prove that the improved GA-ACO MPPT controller is able to quickly track GMPP when the output P-V characteristic curve of PVMA shows the phenomenon of multiple peaks. Comparing the time required for tracking to MPP with different MPPT approaches for the PVMA under five different shading levels, it was observed that the improved GA-ACO algorithm requires 19.5~35.9% (average 29.2%) fewer iterations to complete tracking than the mentioned GA-ACO algorithm. Compared with the ACO algorithm, it requires 74.9~79.7% (average 78.2%) fewer iterations, and 75.0~92.5% (average 81.0%) fewer than the conventional P&O method. Therefore, it is proved that by selecting properly adjusted values of the Pheromone evaporation rate and the Gaussian standard deviation of the proposed GA-ACO algorithm based on the slope scope of the P-V characteristic curves, a better response performance of MPPT is obtained.

1. Introduction

In recent years, with the rise of environmental protection awareness and the exhaustion of petroleum, natural gas, coal mines and other forms of energy, scientists have begun searching for environmentally-friendly and sustainable alternative energy. For scientists, solar power has become one of the ideal forms of alternative energy as it is not bound by geographical conditions and is easily installed. In order to realize energy independence and reduce carbon emissions to alleviate global warming, photovoltaic power generation that does not rely on imports has become one of the renewable energies actively developed by the world’s governments. The governments around the world have also set their own capacity goals. In order to achieve these goals, an appropriate MPPT controller has been designed to increase the power generation utilization of photovoltaic power generation systems.
The conventional algorithms generally applied to track the maximum power of PVMAs include perturbation and observation (P&O) [1,2,3] and incremental conductance (INC) [4,5]. These two conventional approaches, while being able to effectively track the MPPs when PVMAs operate under normal working conditions, when PVMAs are shaded, these conventional approaches may only track the LMPPs rather than the GMPP. Thus, the power generation efficiency of PVMAs is reduced. Therefore, the problem of tracking the maximum power point when shading occurs in the photovoltaic module cannot be solved [6].
To address the aforesaid issue, in recent years, some solutions for determining the optimal values have been proposed which reduce the probability that local optimal solutions are obtained during the solution process. For instance, an efficient hybrid starling murmuration optimizer that combines dynamic opposition, a Taylor-based optimal neighborhood strategy, and a crossover operator (DTCSMO) [7], an efficient enhanced modified chameleon swarm algorithm termed MCSA [8] and an enhanced hierarchical guided slime mould algorithm called HG-SMA [9] etc. have been developed. While these optimization algorithms may effectively address the issue of optimal solutions, there is no practical case for tracking the GMPP of PVMAs when multiple peak values appear in the P-V characteristic curves.
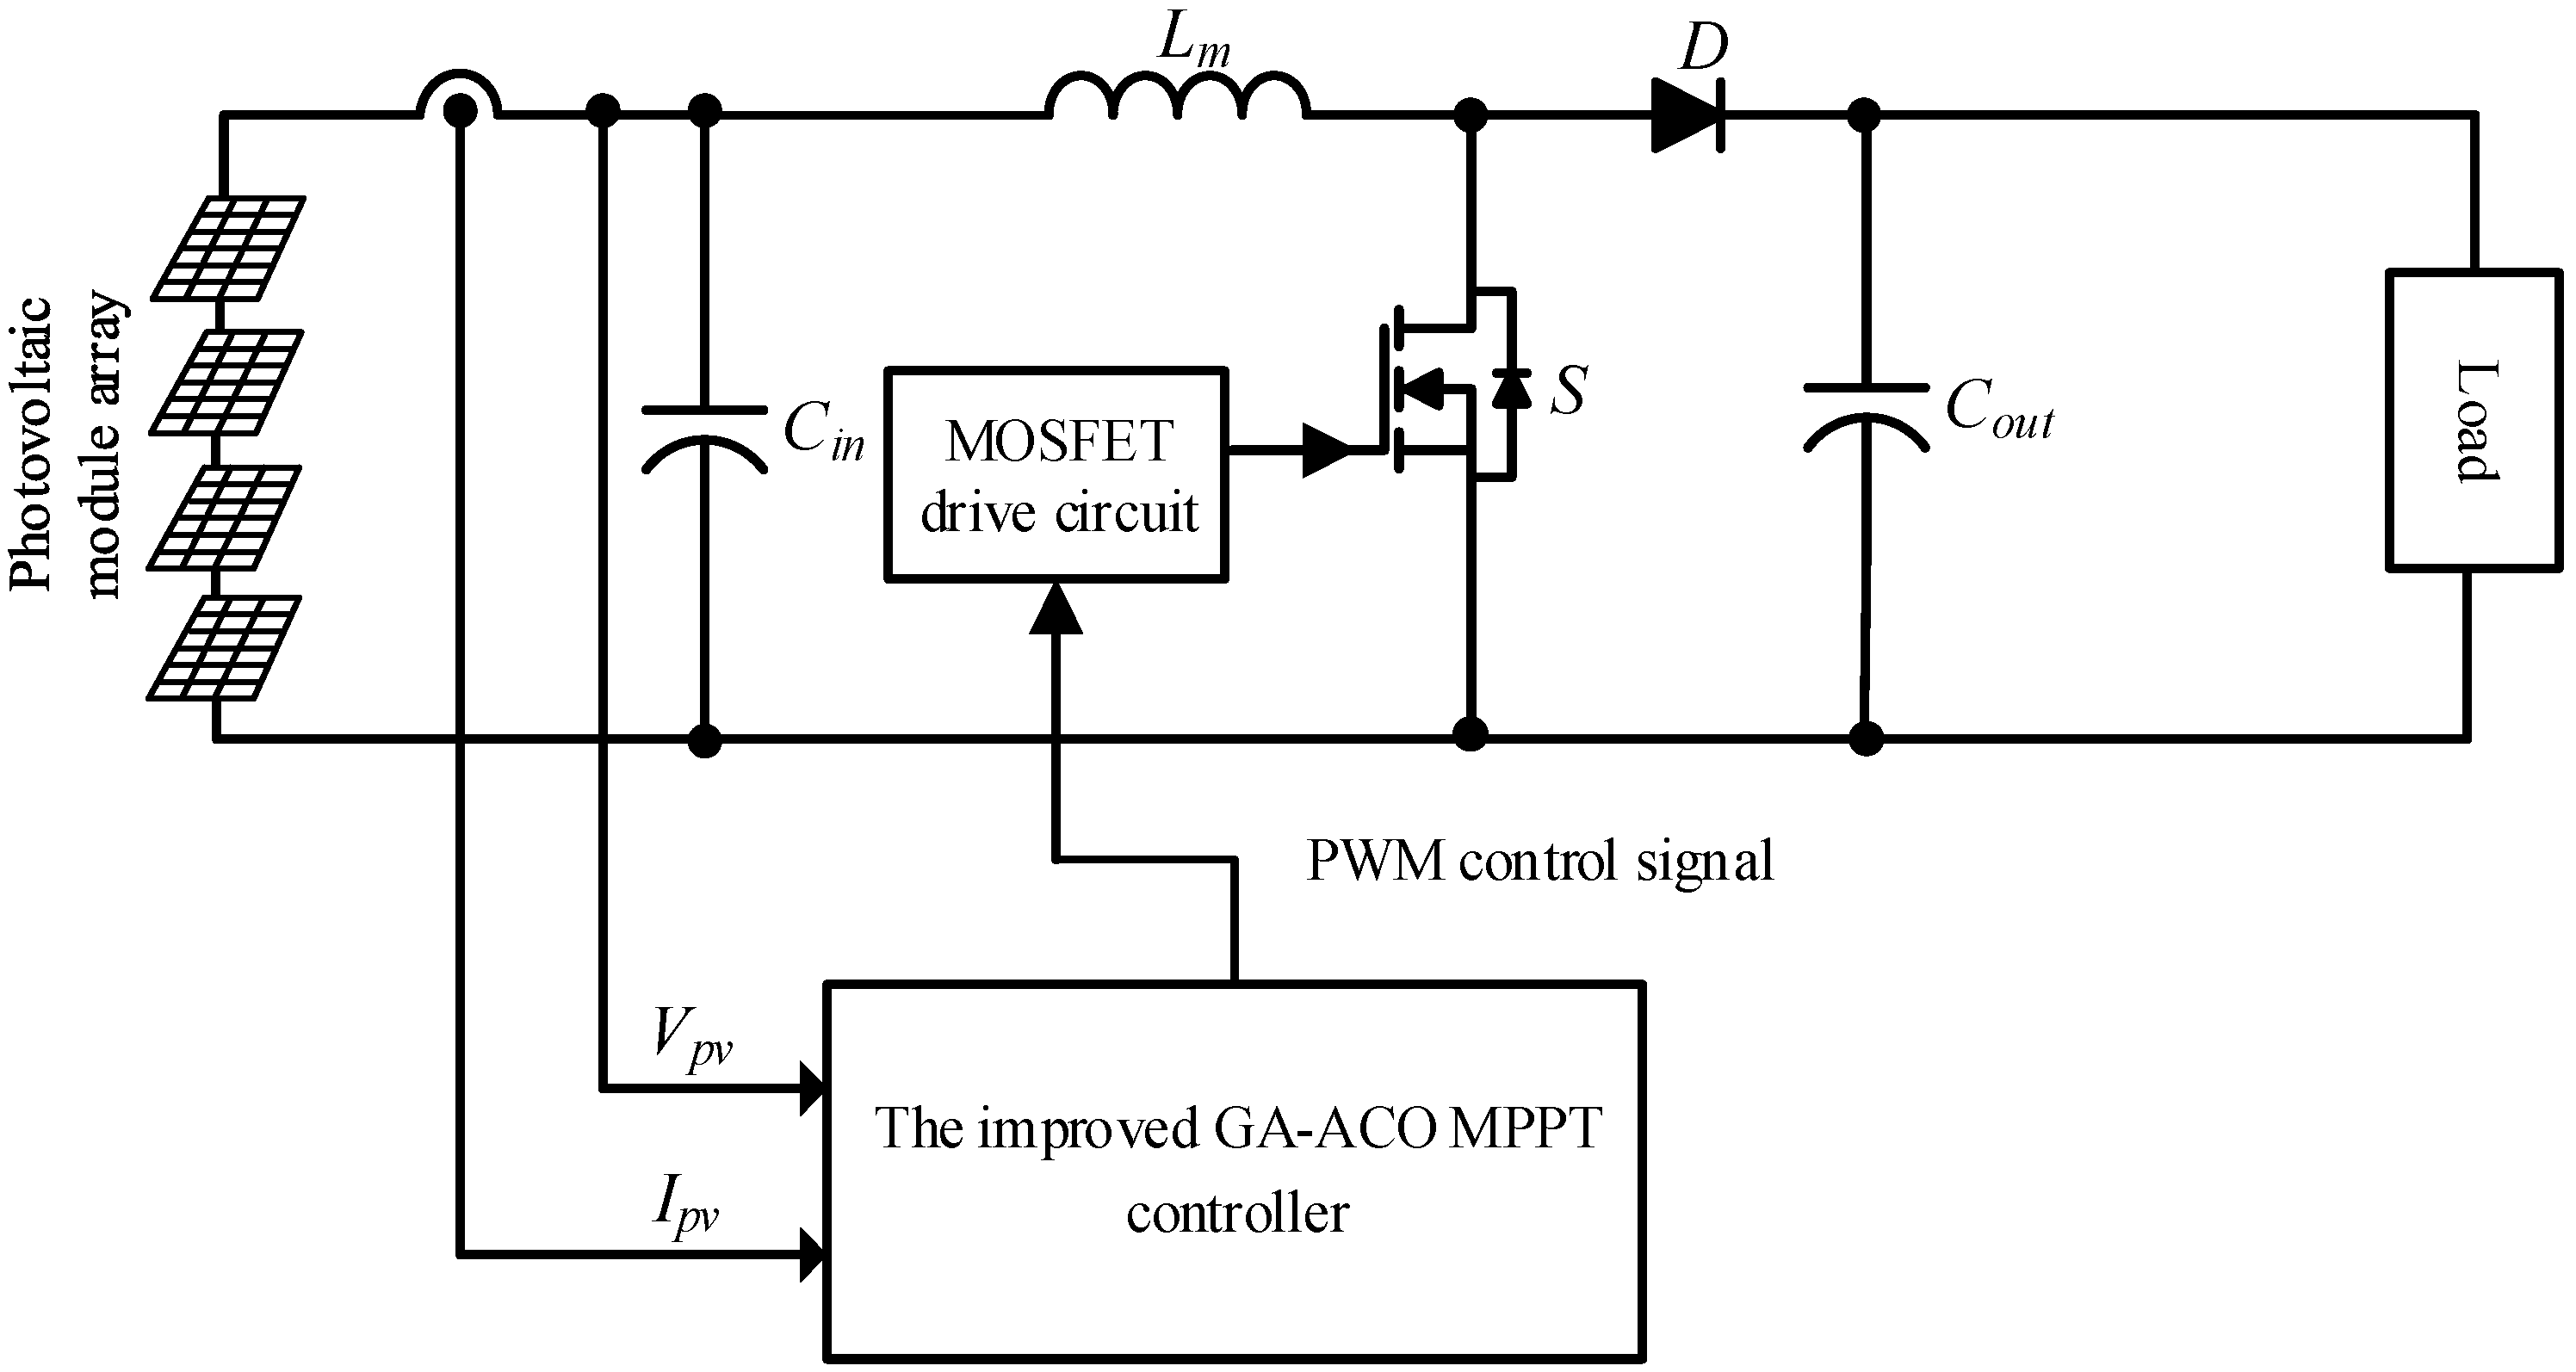
In order to solve the GMPP tracking problem under the condition that the PVMA module is partially shaded, many practical smart maximum power tracking controllers have been proposed and applied to solve the problem [10,11,12,13,14,15,16,17]. This is because the smart maximum power tracking controller can search the GMPP generated in the nonlinear multi-peak P-V characteristic curve under the condition that the PVMA module is partially shaded. The more commonly used smart methods include particle swarm optimization (PSO) [11,12,13], ant colony optimization (ACO) [14,15,16], genetic algorithms (GA) [17,18,19,20], and cuckoo search algorithms (CSA) [21,22], etc. The literature indicates that the smart algorithm-based MPPT controllers have a better steady-state response and tracking response compared with traditional methods. Additionally, when the photovoltaic module is partially shaded, the GMPP can be accurately and quickly tracked, unlike traditional method-based MPPT controllers that can only track the LMPP. However, these smart maximum power tracking controllers adopt fixed parameter values in the iterative formulas adopted, so there is still room for improvement in terms of the speed of dynamic tracking responses and the performance of steady-state tracking.
The improved artificial bee colony (I-ABC algorithm) [23] combining the artificial bee colony algorithm and the perturb and observe (P&O) method has the advantage that the GMPP is searched via the bee colony algorithm, and the correct direction for the next tracking is determined by the P&O method. While this approach reduces the issue of tendency where local optimal solutions are obtained during the solution process and addresses the issue that the P&O method is unable to track the MPPs if the PVMAs are abnormal, the computation is more complex, and the tracking responses are not fast enough. Additionally, the conventional cuckoo search (CS) can be improved by adjusting the step factors of CS depending on the slopes and iterations of the PVMAs’ P-V characteristic curves [24]. While the GMPPs may be tracked faster and more precisely when partial modules are shaded in a PVMA and multiple peak values are generated for the P-V characteristic curve, the improved CS is only applicable in the simulation phase. Practical testing results for PVMAs under different connection configurations and shading ratios may enable the improved CS to track the GMPP in less time and improve the power generation efficiency of the photovoltaic power generation system.
Although Chao and Rizal [25] proposed a MPPT controller with a new GA and ACO hybrid algorithm, the proposed MPPT controller also demonstrates the characteristics of GA and ACO algorithms. In particular, the GA has excellent features when searching for the best solution and enabling the system to slowly converge. When used independently, more computation time is needed, possibly because there are more populations, resulting in the disadvantage of a longer tracking time [19]. On the other hand, ACO features the ability to quickly search the subspace and converge to the best non-global solution in advance. Hence, the incorporation of GA can complement the ACO algorithm, thereby enhancing the speed of maximum power tracking and enabling the PVMA to output the global maximum power. Based on the above reasons, an improved GA-ACO MPPT controller is proposed in this paper. The same circuit structure and tracking steps as [25] were also employed. The optimization of the GA-ACO parameters differs depending on the P-V characteristic curves generated under different shading conditions of PVMAs, and thus, no principle can be found for the parameter optimization. Therefore, it is learnt in tests that when the tracking approaches the MPP and as the slope of the P-V characteristic curve declines, the Pheromone evaporation rate ρ and the Gaussian standard deviation x increase; and the ρ and x parameters are required to be greater as MPP is approached. In contrast, the farther the MPP is, the more ρ and x must decrease as the slope of the P-V characteristic curve increases. Therefore, the optimal adjusted value of the Pheromone evaporation rate, Δρ, and the optimal adjusted value of Gaussian standard deviation, Δx, may be obtained via multiple simulations based on the slope values of P-V characteristic curves of PVMAs. Through the location of the work point, the slope of the P-V characteristic curve was calculated to automatically adjust the Pheromone evaporation rate ρ and the Gaussian standard deviation x in the iterative formula. The global maximum power tracking time was reduced to obtain better steady-state responses.

2. The Shading Characteristics of a PVMA

The output power of a photovoltaic module changes with the environment, weather and temperature. In the PVMA, any shaded module will affect the total output power, because each part of the module in the PVMA is connected in series [26]. Therefore, even if a photovoltaic module is shaded in series, the output current of the entire PVMA is also affected. Using MATLAB software and under the standard test conditions (STC) (solar irradiance: 1000 W/m2, air mass (AM): 1.5 and temperature: 25 °C), the I-V and P-V characteristic curves of the photovoltaic module array were simulated. 
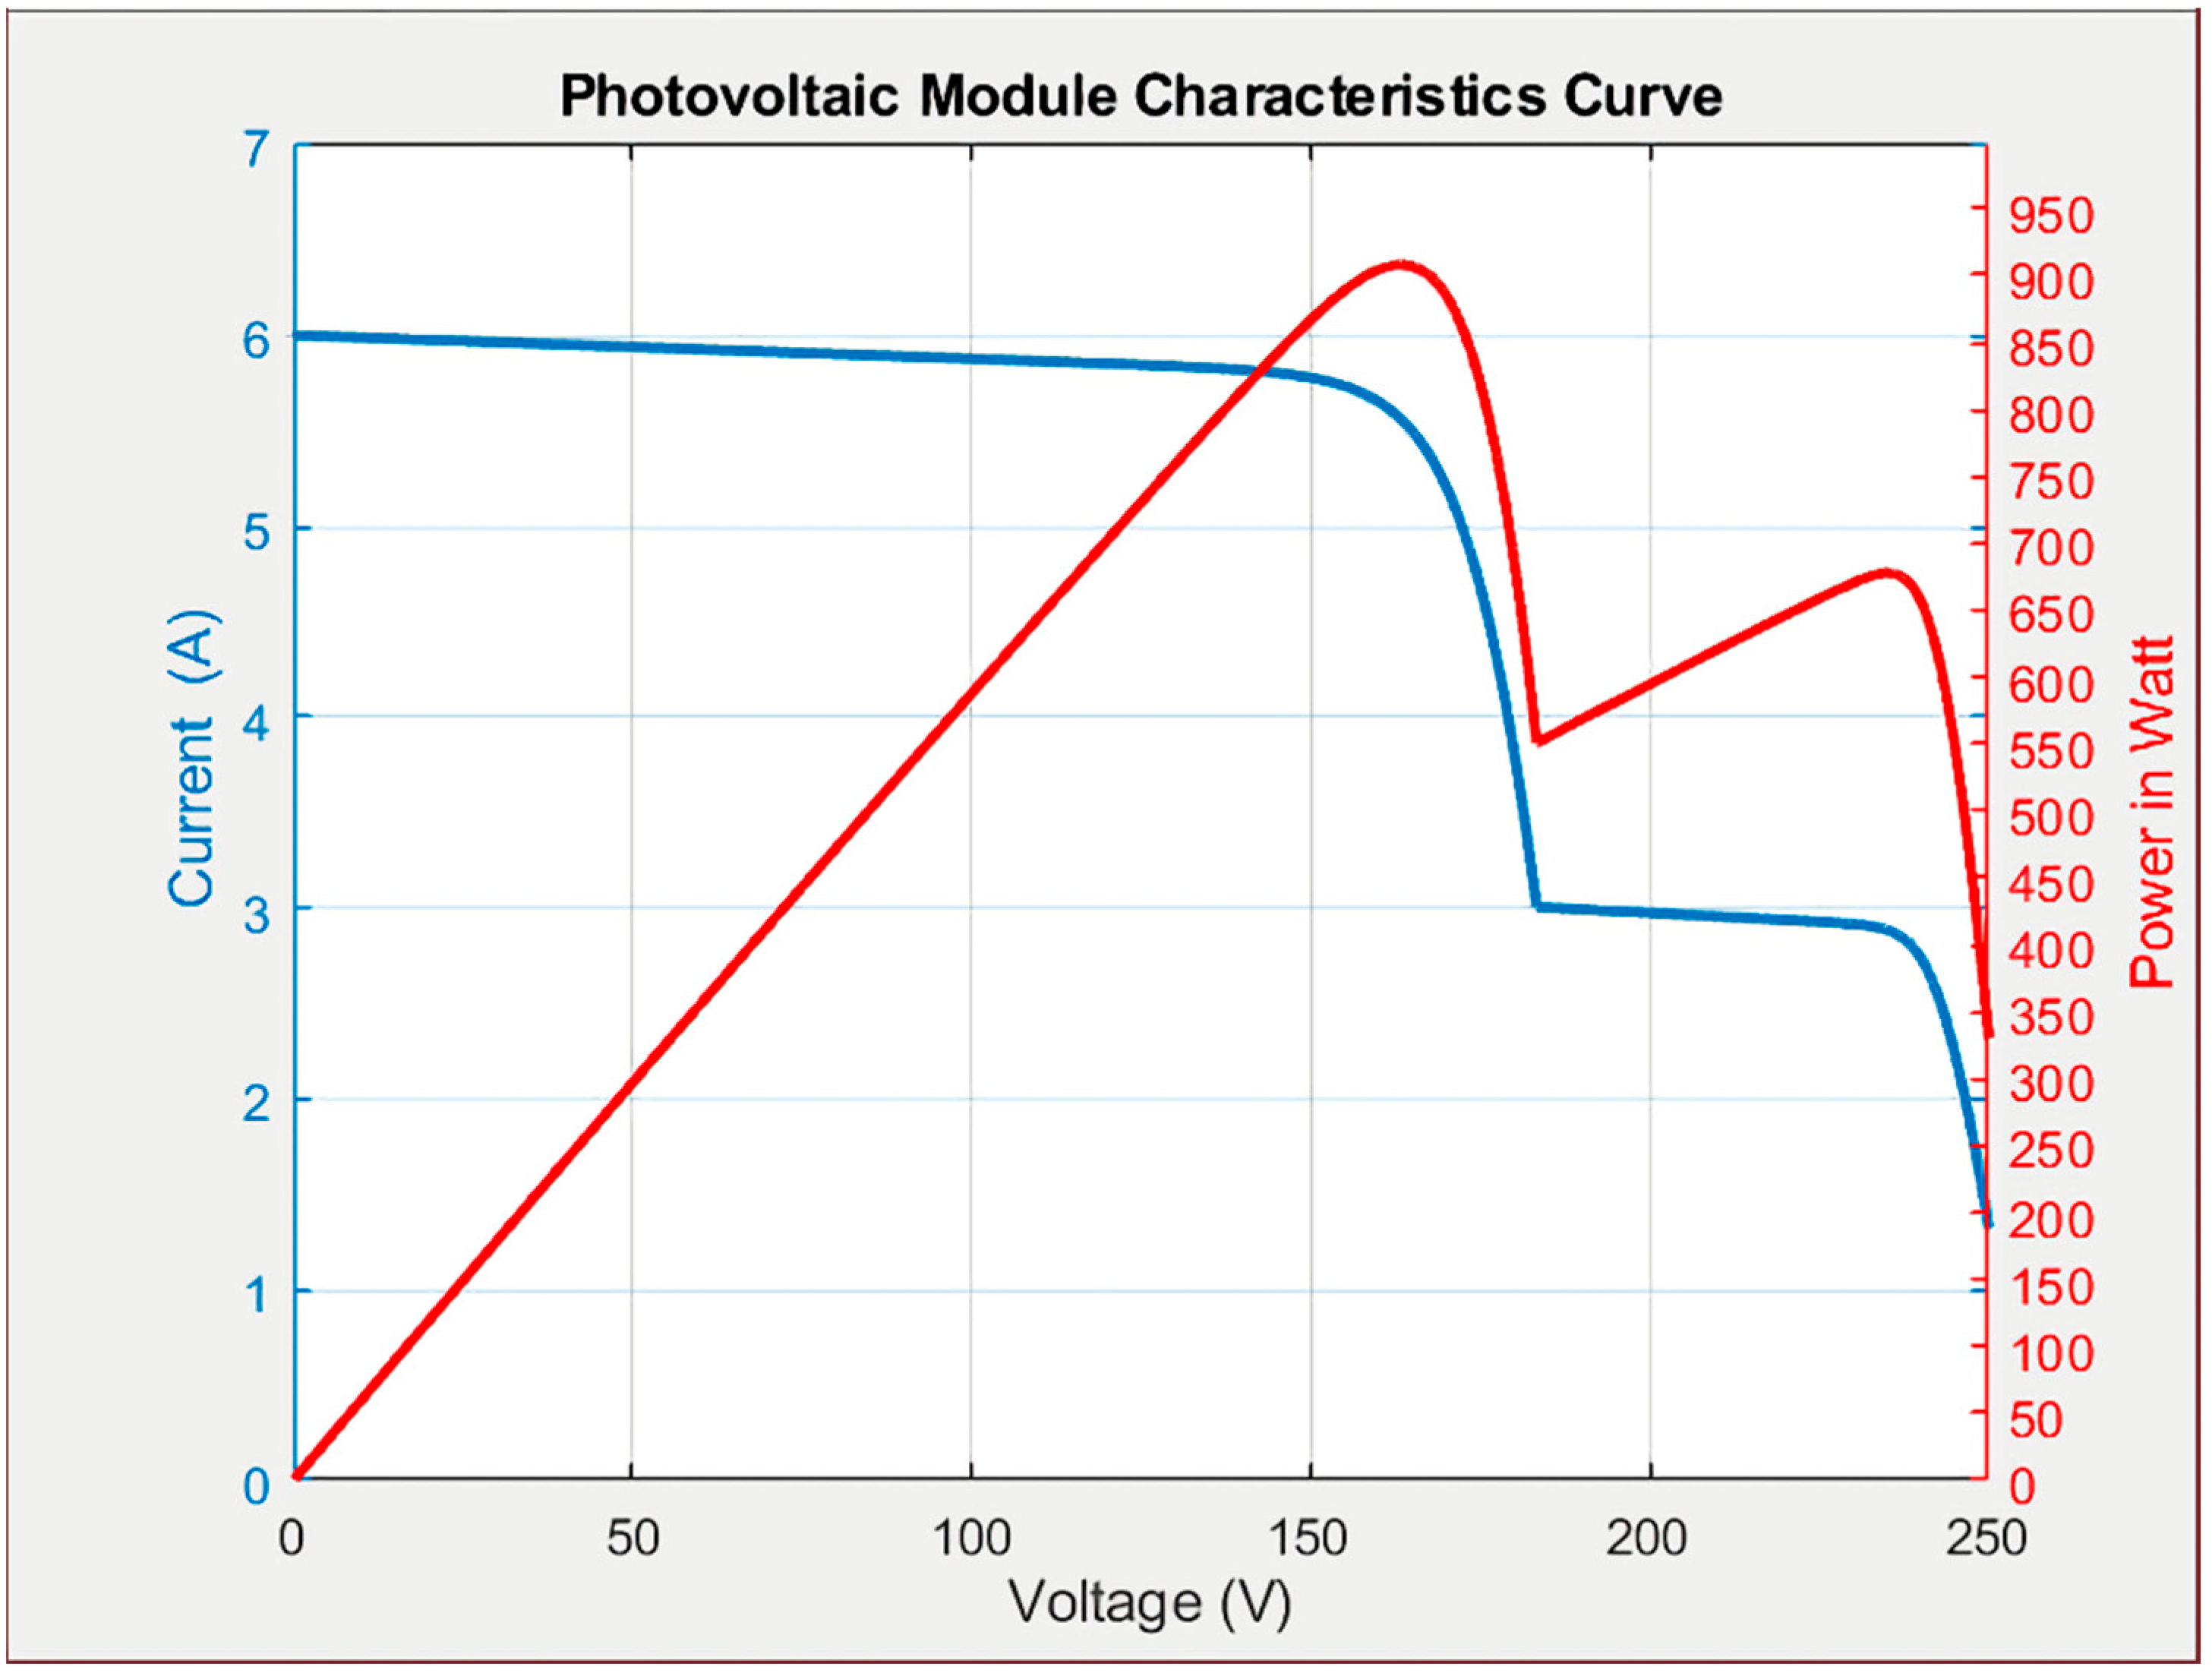
Figure 1 illustrates the P-V and I-V characteristic curves of a four photovoltaic module array with one module under 50% shade [26]. Because the photovoltaic module array consists of four photovoltaic modules in series, one of which is shaded by 50%, with the rest unshaded, two peaks appear in the P-V characteristic curve of the PV module array, and there is a considerable decrease in the maximum power output, as shown in the P-V characteristic curve. A similar pattern is observed in other situations. For any shading occurring on a photovoltaic module array, there will be more than one maximum power point (MPP) observed in the power-voltage (P-V) characteristic curve of the photovoltaic module array. However, only the local maximum power point (LMPP) can be tracked by the traditional maximum power point tracker, but not the global maximum power point (GMPP). Therefore, in this paper, an intelligent maximum power point tracker based on an improved GA-ACO algorithm is presented to overcome this problem.

3. The Proposed Improved MPPT Methods

In order to improve the tracking performance of the MPPT controller in a PVMA, an improved GA-ACO MPPT controller is proposed in this paper. The principle involves automatically adjusting the Pheromone evaporation rate ρ and Gaussian standard deviation x of the traditional GA-ACO MPPT controller, thereby shortening the tracking time. The MATLAB software was used to simulate maximum power tracking of the GA-ACO MPPT controller under different shading ratios in order to verify the excellent performance of the tracking methods proposed.

3.1. Genetic Algorithm

The theoretical basis of genetic algorithms originates from “On the Origin of Species” written by Charles Darwin in 1859. A genetic algorithm is a search-type algorithm based on natural selection and genetic mechanisms in the field of biology. It simulates natural selection among organisms in nature, as well as the phenomena of breeding, crossover, and mutation. Moreover, in each iteration, several candidate populations (solutions) are retained and superior individuals are selected from the candidate populations. Through genetic factors (crossover and mutation), a new generation of candidate populations is produced until the best individuals are found. A genetic algorithm features multi-point search in order to prevent becoming caught in the local best solution. However, if the population quantity is too large, considerable time may be required for calculation, leading to low search efficiency. Thus, when the need to search bulk data arises, a genetic algorithm may take a long time to compute before a search is completed [19].

3.2. Ant Colony Optimization

Ant colony optimization (ACO) is a type of algorithm for searching the best path. It can also mimic ant behaviors [14]. In nature, ants leave behind pheromones secreted along their foraging trails in order to mark their trails. When ants behind reach the location previous ants have reached, they choose trails with higher pheromone values and leave more pheromones to strengthen the likelihood of ants behind taking the trials. Therefore, as long as the trials with the highest pheromone values exist, the trails have a higher chance of attracting ants to move toward foraging. The ACO algorithm has many advantages, including robustness, the ability to search for a better solution, and good feedback, etc. However, the ACO algorithm may cause the search to slow down in the initial phase due to inadequate information obtained.

3.3. Traditional GA-ACO MPPT Controller

First, the traditional GA-ACO algorithm is applied in the PVMA to explain the MPPT steps. The traditional GA-ACO MPPT controller implementation steps are described below [25].
Step 1. 
First initialize the GA and ACO parameters. The GA parameter settings include: number of iterations (Itmax), the number of solution (k), the number of populations (nPop), crossover percentage (pc), factor for crossover (γ), mutation percentage (pm), mutation rate (mu), tournament size (ts), etc. The ACO parameter settings include: number of ants (Ant), Pheromone evaporation rate (ρ), etc. The populations are subsequently initialized. Each population has k solutions. In order to initialize the populations, the solution of each initial population randomly selects the output voltage of PVMA and substitutes it into the iterative formula.
Step 2. 
For all the populations, calculate the fitness of each population through the fitness function.
Step 3. 
In nPop, randomly select several populations (i.e., The tournament size (ts) value). After comparing the randomly selected populations, the best population is selected as the father, and the mother is chosen through the same approach. The parents go through crossover to create offspring. The quantity of offspring produced is determined by the crossover percentage (pc) value. Through the same crossover method, population mutation occurs. The number of mutated populations is determined by the mutation percentage (pm) value. The cost function should be calculated for all the offspring and mutated populations produced. The new populations produced replace inferior populations and the next generation is added. Better populations are retained and selected as the ACO initial conditions.
Step 4. 
In order to initialize ACO, the fitness of all the solutions in the retained populations should be calculated. It can be observed from Step 1 that all the solutions retained are output voltages (Vpv) of the PVMA. The fitness of these solutions refers to the output power (Ppv) corresponding to each voltage (Vpv). Then, all the solutions of better populations retained from the GA undergo pheromone initialization. The initialization steps are as follows:
Step 4.1. 
Calculate the distance Δ Vn (n = 1,…, k) between each voltage value (Vn) and the best solution (Vbest) in the population retained from the GA. In particular, Vbest refers to the voltage solution of the maximum power value in a population.
Δ V n = V n V b e s t
Step 4.2. 
In order to calculate the pheromone value (τn) of each solution, the Gaussian normal distribution in Equation (2) should be used to obtain φn and each solution is computed. Through the Gaussian normal distribution, the normal distribution distance of all the solutions can be calculated. The shortest distance represents the best solution, the Gaussian value approximates zero and the farthest distance is the worst solution, with the Gaussian value approximating 1.
φ n = 1 x 2 π exp ( ( Δ V n ) 2 2 x 2 )
Here, x is the Gaussian standard deviation (usually set as x = 0.5).
Step 4.3. 
Use Equation (3) to calculate the pheromone value (τn) of all the solutions.
τ n = ( 1 ρ ) · φ n i = 1 K φ i
In particular, the ant path is determined by the pheromone value (τn) calculated from each solution in the previously retained population of the GA. The higher the pheromone value of a solution, the more likely it is to attract ants to move toward foraging. The pheromone evaporation rate (ρ) balances the Pheromone value of each solution in a population. Ants not are not only attracted to the solution with the highest pheromone value, but there is also a chance that they are attracted by Pheromone values generated from other computed solutions. However, the trail that attracts the highest number of ants is regarded as the maximum power point, and this solution is selected as the ACO tracking result.
Step 5. 
Repeat Step 3 and Step 4 until the number of iterations has reached the preset maximum iterations (Itmax) at which point the iterations end.

3.4. Improved GA-ACO MPPT Controller

The improved GA-ACO algorithm proposed in this paper implements adjustments, mainly targeting the Pheromone evaporation rate (ρ) in the ACO algorithm and the Gaussian standard deviation (x) and based on the slope in the P-V characteristic curve. Equations (2) and (3) show that when the two parameters of ρ and x are adjusted, the Pheromone value (τn) can be changed. When the Pheromone value increases, the rate of ant colony convergence to the maximum power point can be accelerated, which in turn, enhances the tracking response performance of the algorithm at the maximum power point. Thus, based on the slope (m) of the P-V characteristic curve in the PVMA in this paper, the Pheromone evaporation rate (ρ) and Gaussian standard deviation (x) are adjusted. In particular, slope (m) is defined in Equation (4):
m = P i t P ( i t 1 ) V i t V ( i t 1 )
where it represents the current number of iterations, i t 1 represents the previous number of iterations, and P ( i t ) P ( i t 1 ) represents the difference in the output power of the PVMA in the two iterations.
In this paper, based on the changes in the slope of the P-V characteristic curve, the changed Pheromone evaporation rate (ρ) and the Gaussian standard deviation (x) are as shown in Equations (5) and (6):
ρ = m × ρ + Δ ρ
x = 0.5 m × x + Δ x
where Δρ is the adjustment value of ρ under different m, adjusted as shown in Table 1; and Δx is the adjustment value of x under different m, adjusted as shown in Table 2.
Since the optimized value of the GA-ACO parameter differs due to the P-V characteristic curve generated under different shading conditions, the optimal rules for parameter adjustment cannot be identified. However, we learned from the test that the slope of the P-V characteristic curve reduced when the tracking reached within proximity of the maximum power point. Therefore, the Pheromone evaporation rate ρ and Gaussian standard deviation x should increase; the closer it gets to the MPP, the greater the increase in parameter values ρ and x that are required. Conversely, the further it is away from the MPP, the slope of P-V characteristic curve becomes greater, where ρ and x should reduce. Based on this, Δρ and Δx can apply the slope of the P-V characteristic curve for the PVMA accordingly to derive more optimized experience values for the Δρ and Δx adjustments (as shown in Table 1 and Table 2) through multiple simulations.

3.5. The Maximum Power Tracking Processes and Architecture of the Proposed Improved GA-ACO

Figure 2 shows the flowchart of the maximum power tracking controller based on the improved GA-ACO proposed in this paper. The iterations in the last block of the flowchart in Figure 2 are indeed the set maximum iterations Itmax. Figure 3 shows the system structural diagram of the proposed maximum power controller. It mainly consists of the PVMA, boost DC-DC converter, improved GA-ACO maximum power tracking controller and voltage and current detectors. Table 3 shows the component specifications of a boost DC-DC converter.

4. Simulation Results

First, the MATLAB software was adopted to carry out maximum power tracking simulation by applying the improved GA-ACO algorithm to the photovoltaic module array (PVMA). The simulation results obtained from traditional GA-ACO, ACO and P&O MPPT controllers were compared for performance. The electrical parameter specifications of the photovoltaic module in this paper are shown in Table 4. As shown in Table 4, four photovoltaic modules were configured as four-series/one-parallel arrays and a two-series/two-parallel array. Under the same temperature condition, maximum power tracking simulation under five different shading conditions was carried out. It can be observed in Table 5 that under the five different shading conditions, the P-V characteristic curves obtained from the simulation showed different numbers of peaks. Then, through simulation, the proposed improved GA-ACO MPPT method under five different shading conditions was verified to be superior to the other traditional methods.
The parameter setting values of the improved GA-ACO, traditional GA-ACO, ACO and P&O MPPT methods adopted for the simulations in this paper are shown in Table 6.

4.1. Case 1: 0% Shading + 0% Shading + 0% Shading + 0% Shading

Figure 4 shows the four modules in series adopted to simulate the P-V and I-V characteristic curves of the photovoltaic module array under the condition of no shading through the MATLAB software. Since the photovoltaic module is in series, the voltages and powers are added. Therefore, it can be observed from Figure 4 that the voltage of the maximum power point and the maximum power point value are four times those of a single photovoltaic module. The simulation results in 
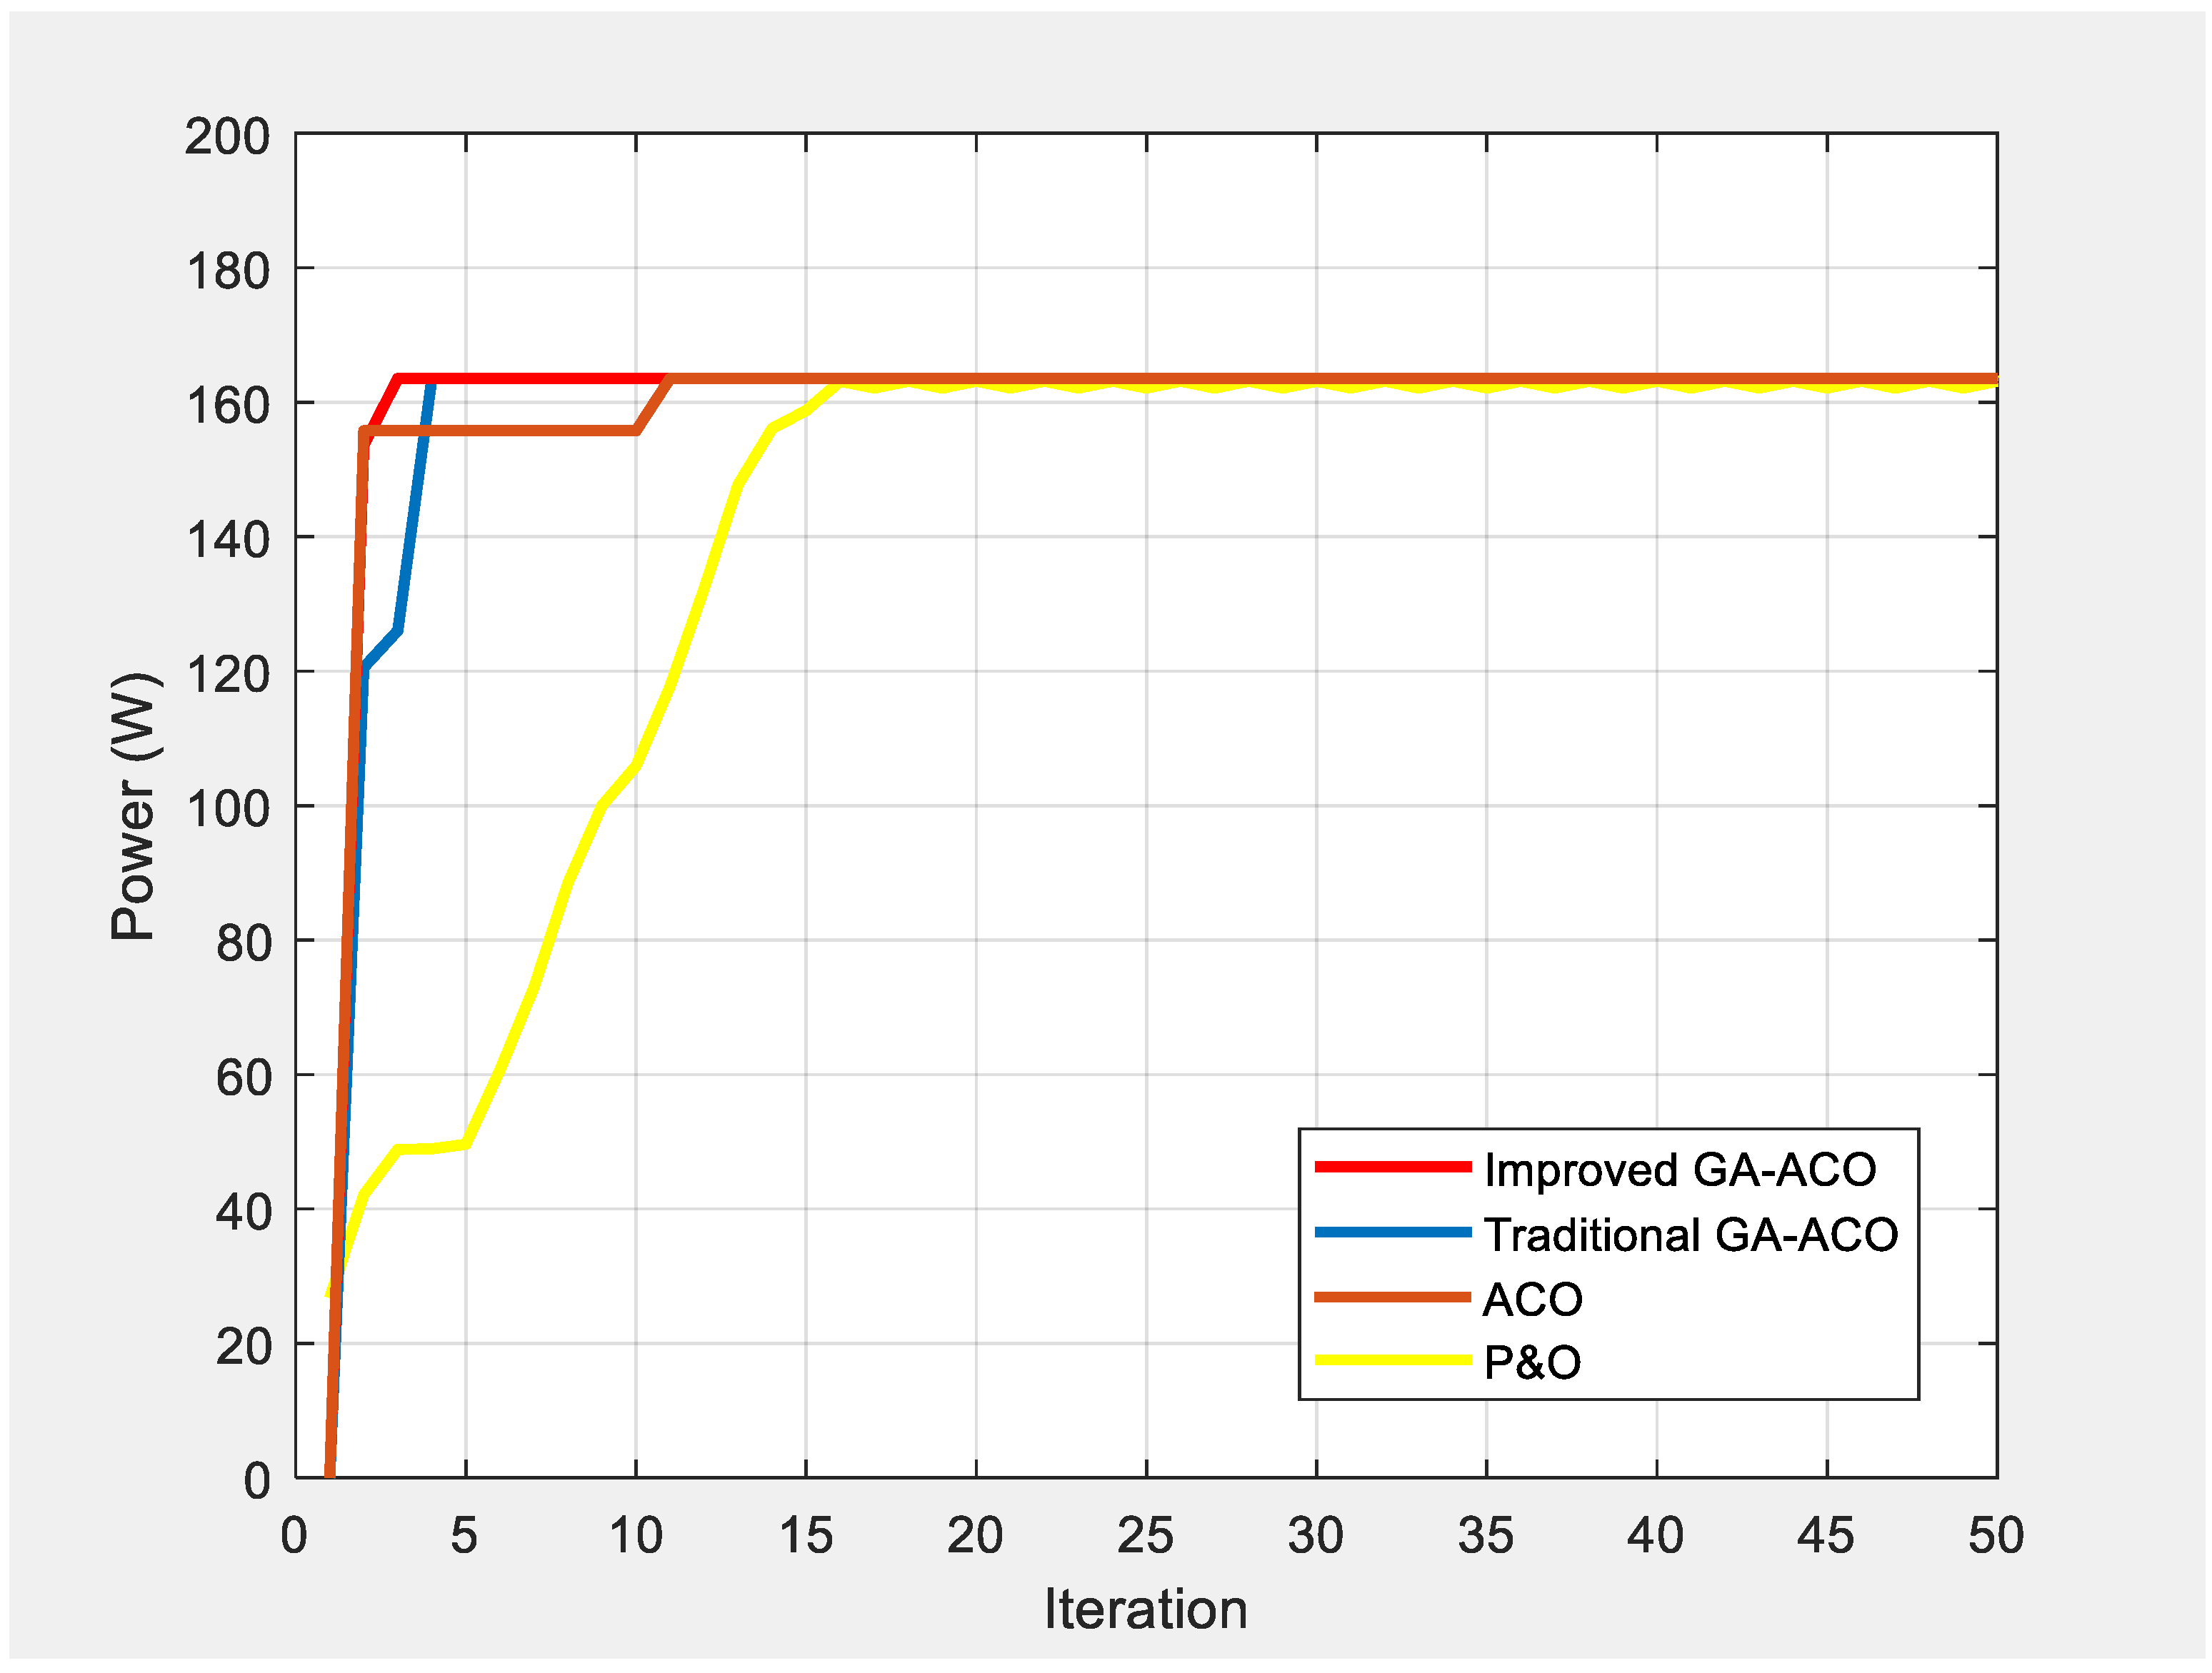
Figure 5 show that the improved GA-ACO managed to track the GMPP through just one iteration. On the other hand, the traditional GA-ACO, ACO, and P&O methods required 3, 10 and 16 iterations to track the GMPP. In addition, the P&O method continued to oscillate near the maximum power point.

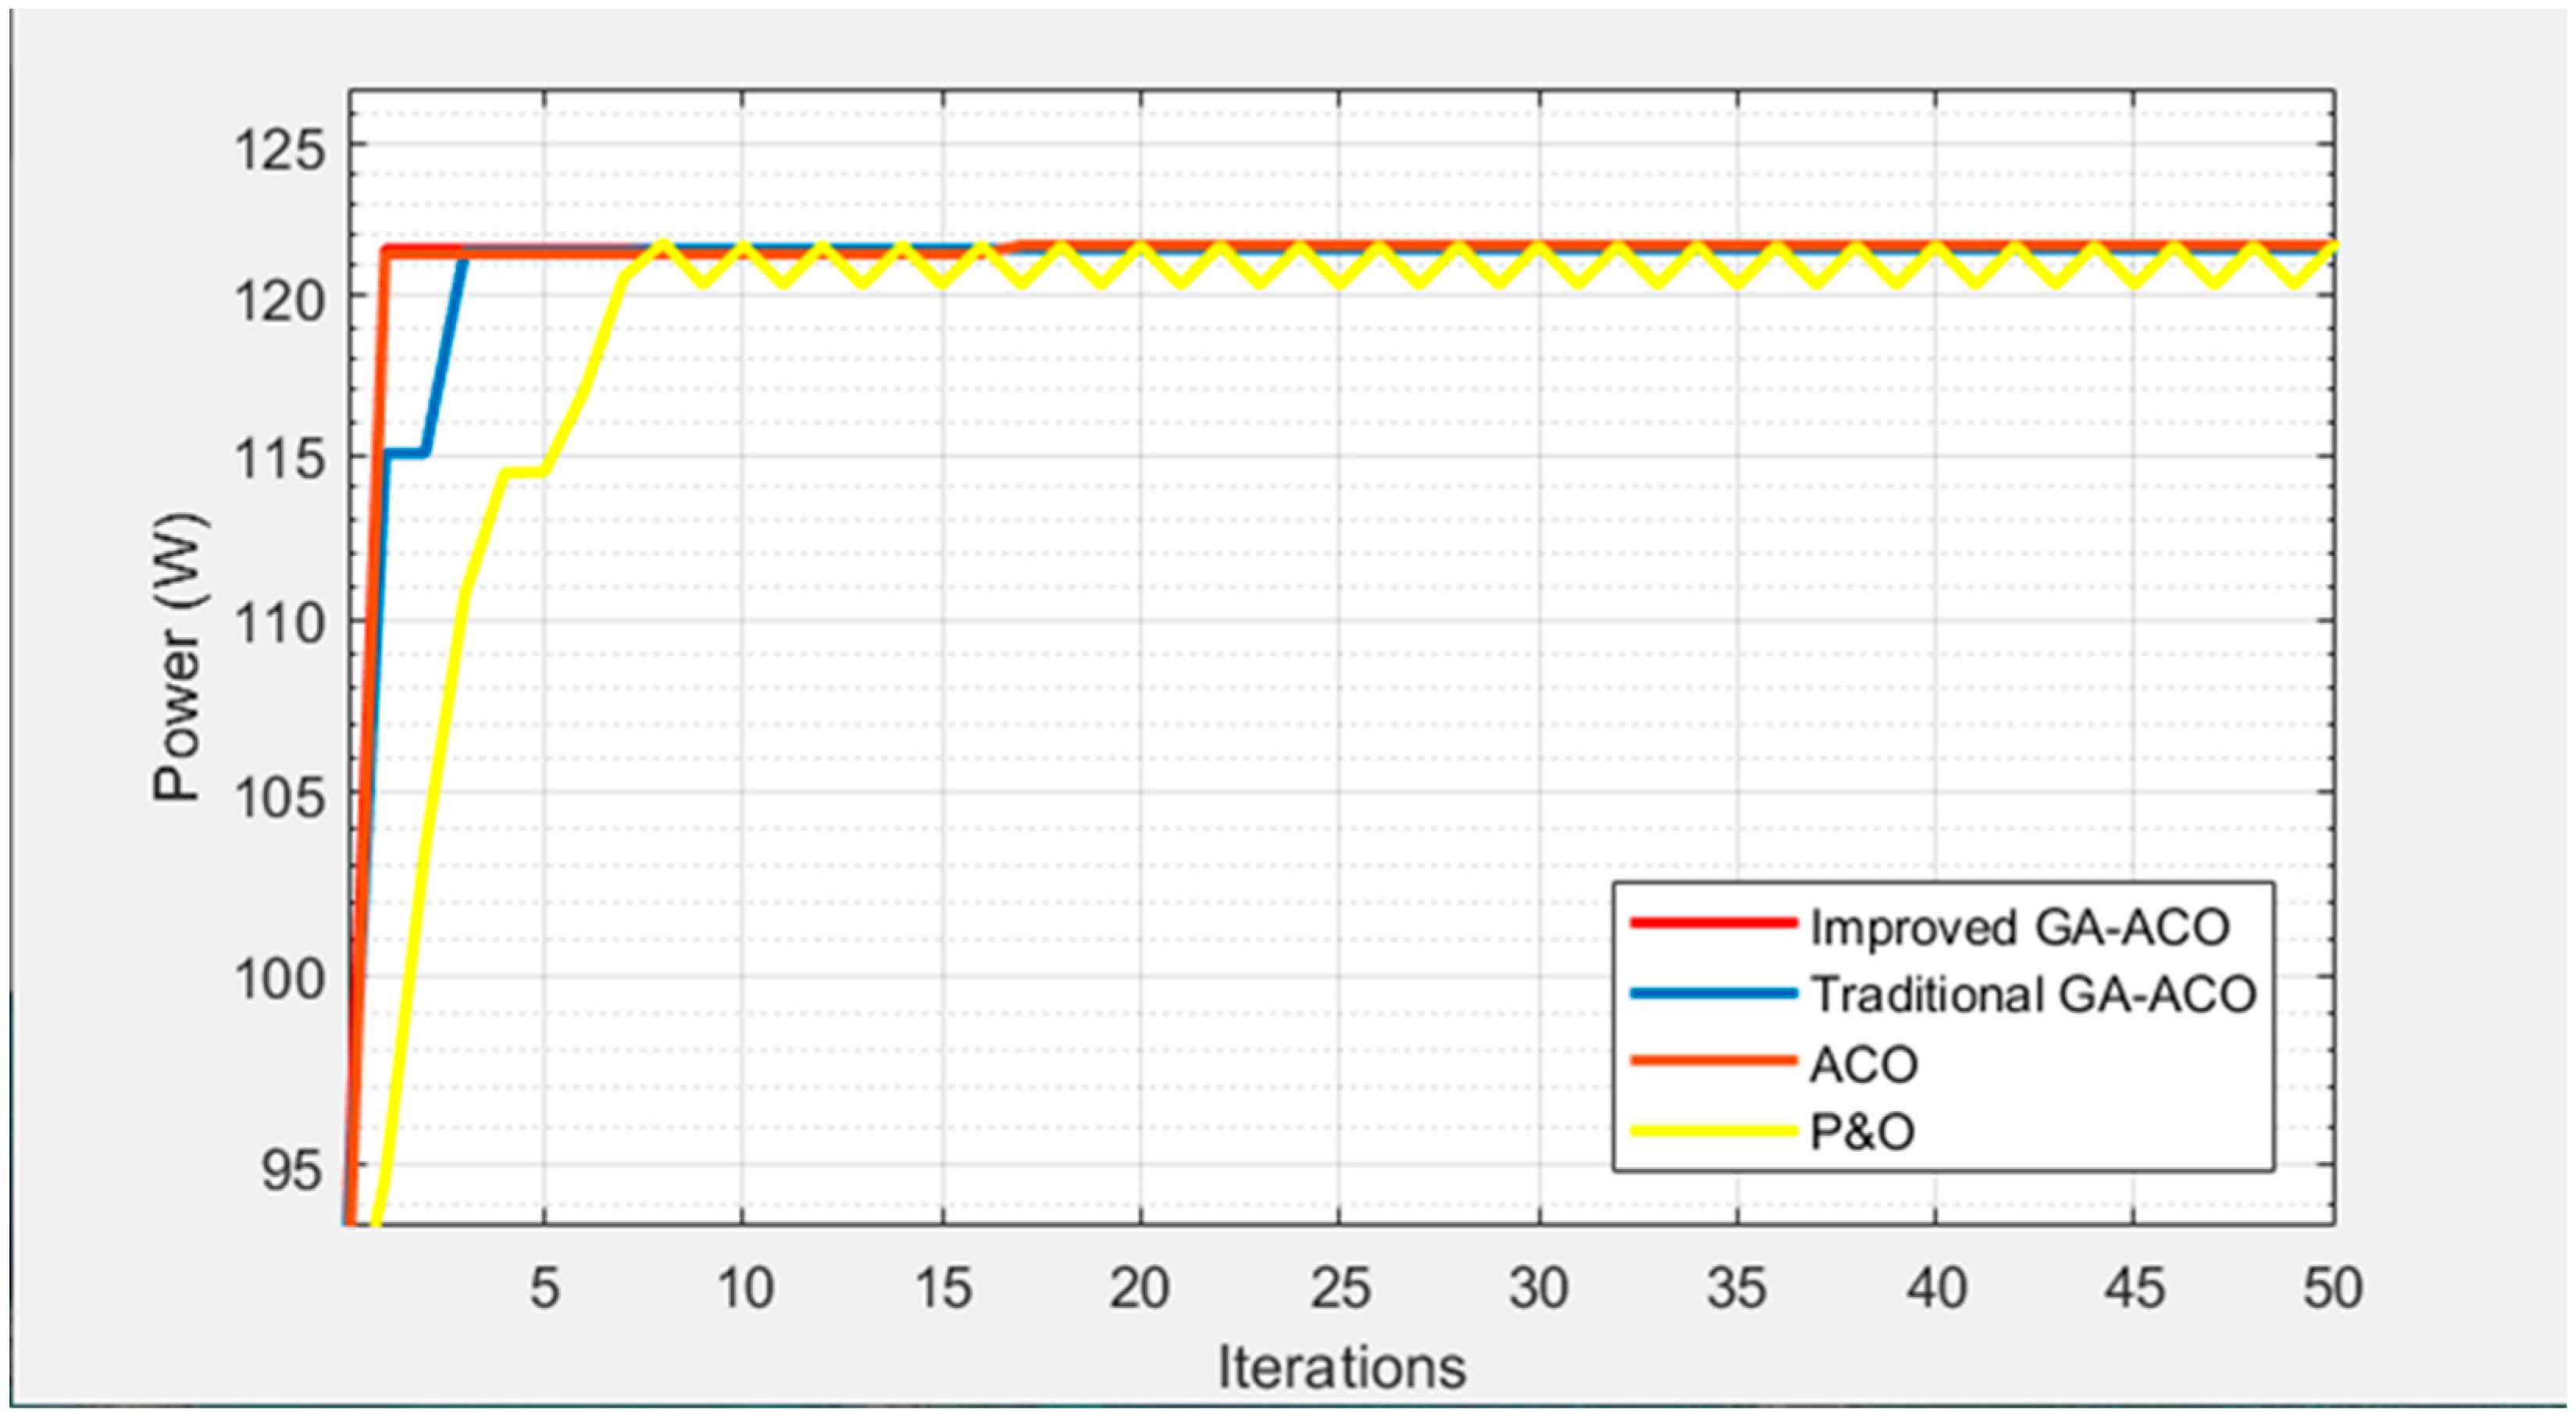
4.2. Case 2: 0% Shading + 35% Shading + 35% Shading + 35% Shading

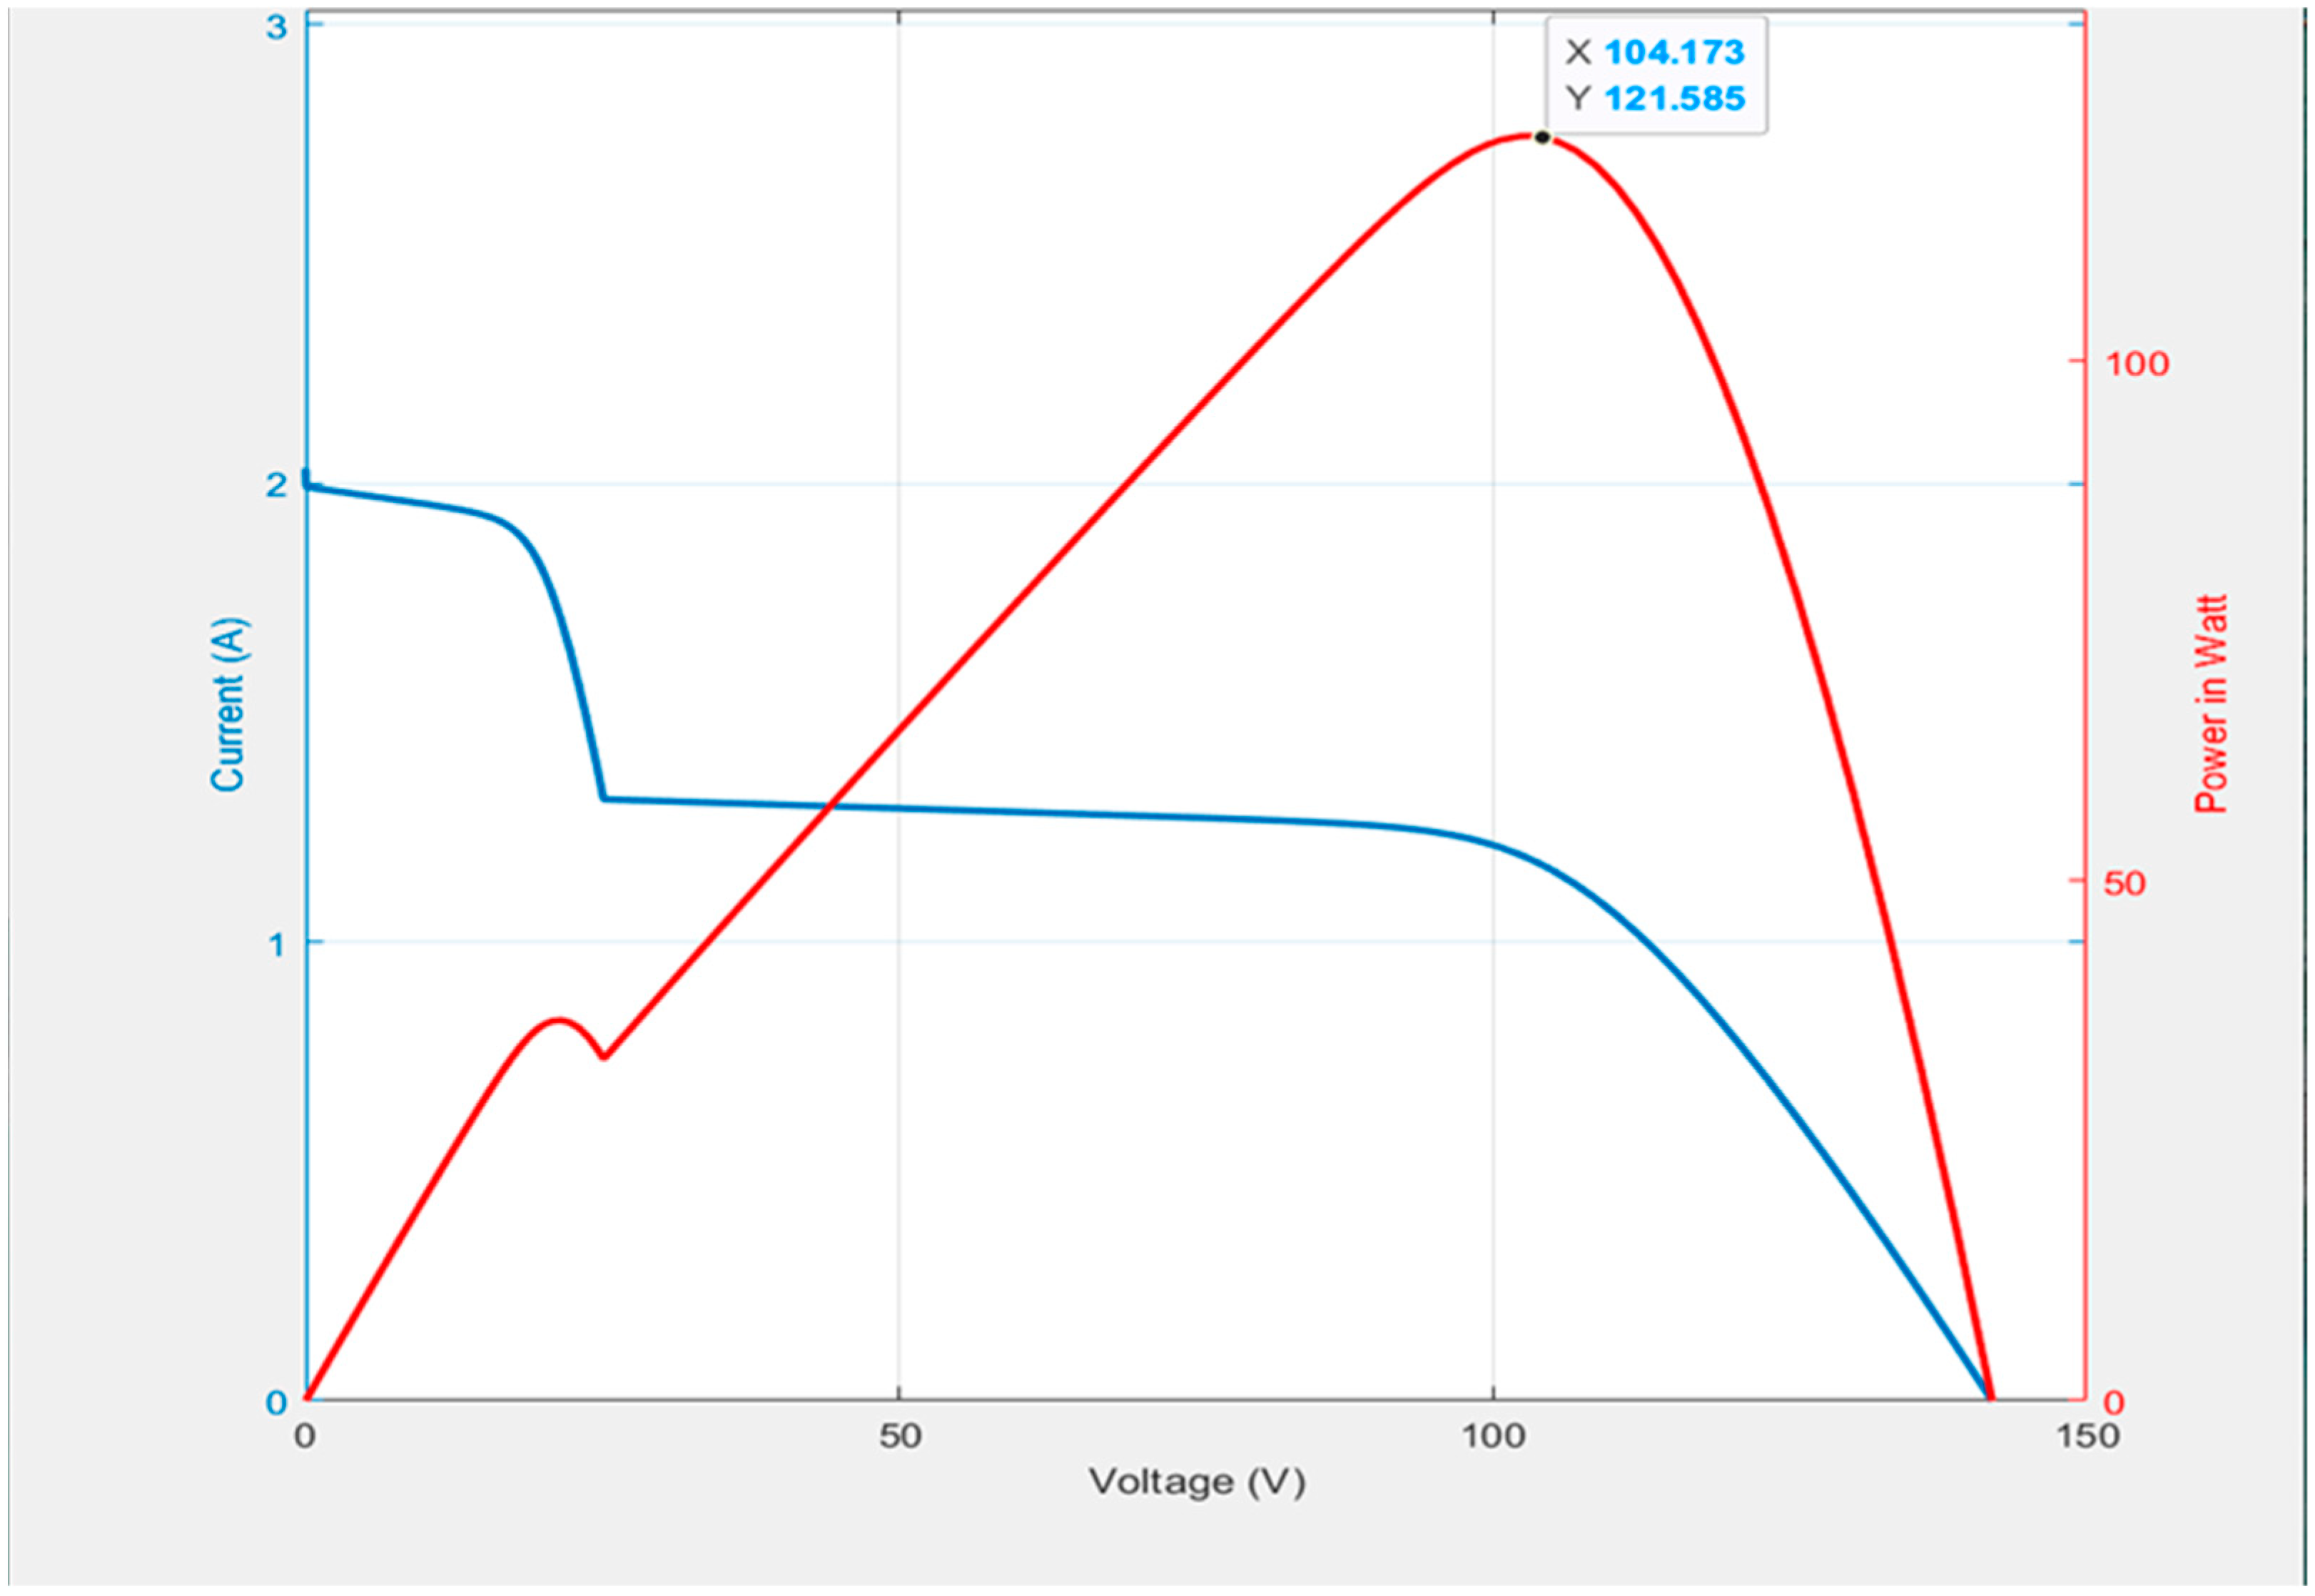
Figure 6 shows the simulation results when four photovoltaic modules in series are adopted and the shading ratio of the three photovoltaic modules is 35%. When one photovoltaic module is completely unshaded, the P-V and I-V characteristic curves are simulated through MATLAB software. It can be observed in Figure 6 that double-peak values appeared with a GMPP of 121.6 W and a GMPP voltage of 104.2 V. It can be observed from the simulation results in Figure 7 that the improved GA-ACO managed to track the GMPP with just one iteration. On the other hand, the traditional GA-ACO and ACO methods required 3 and 17 iterations to track the GMPP. As for the P&O method, the GMPP could not even be tracked.

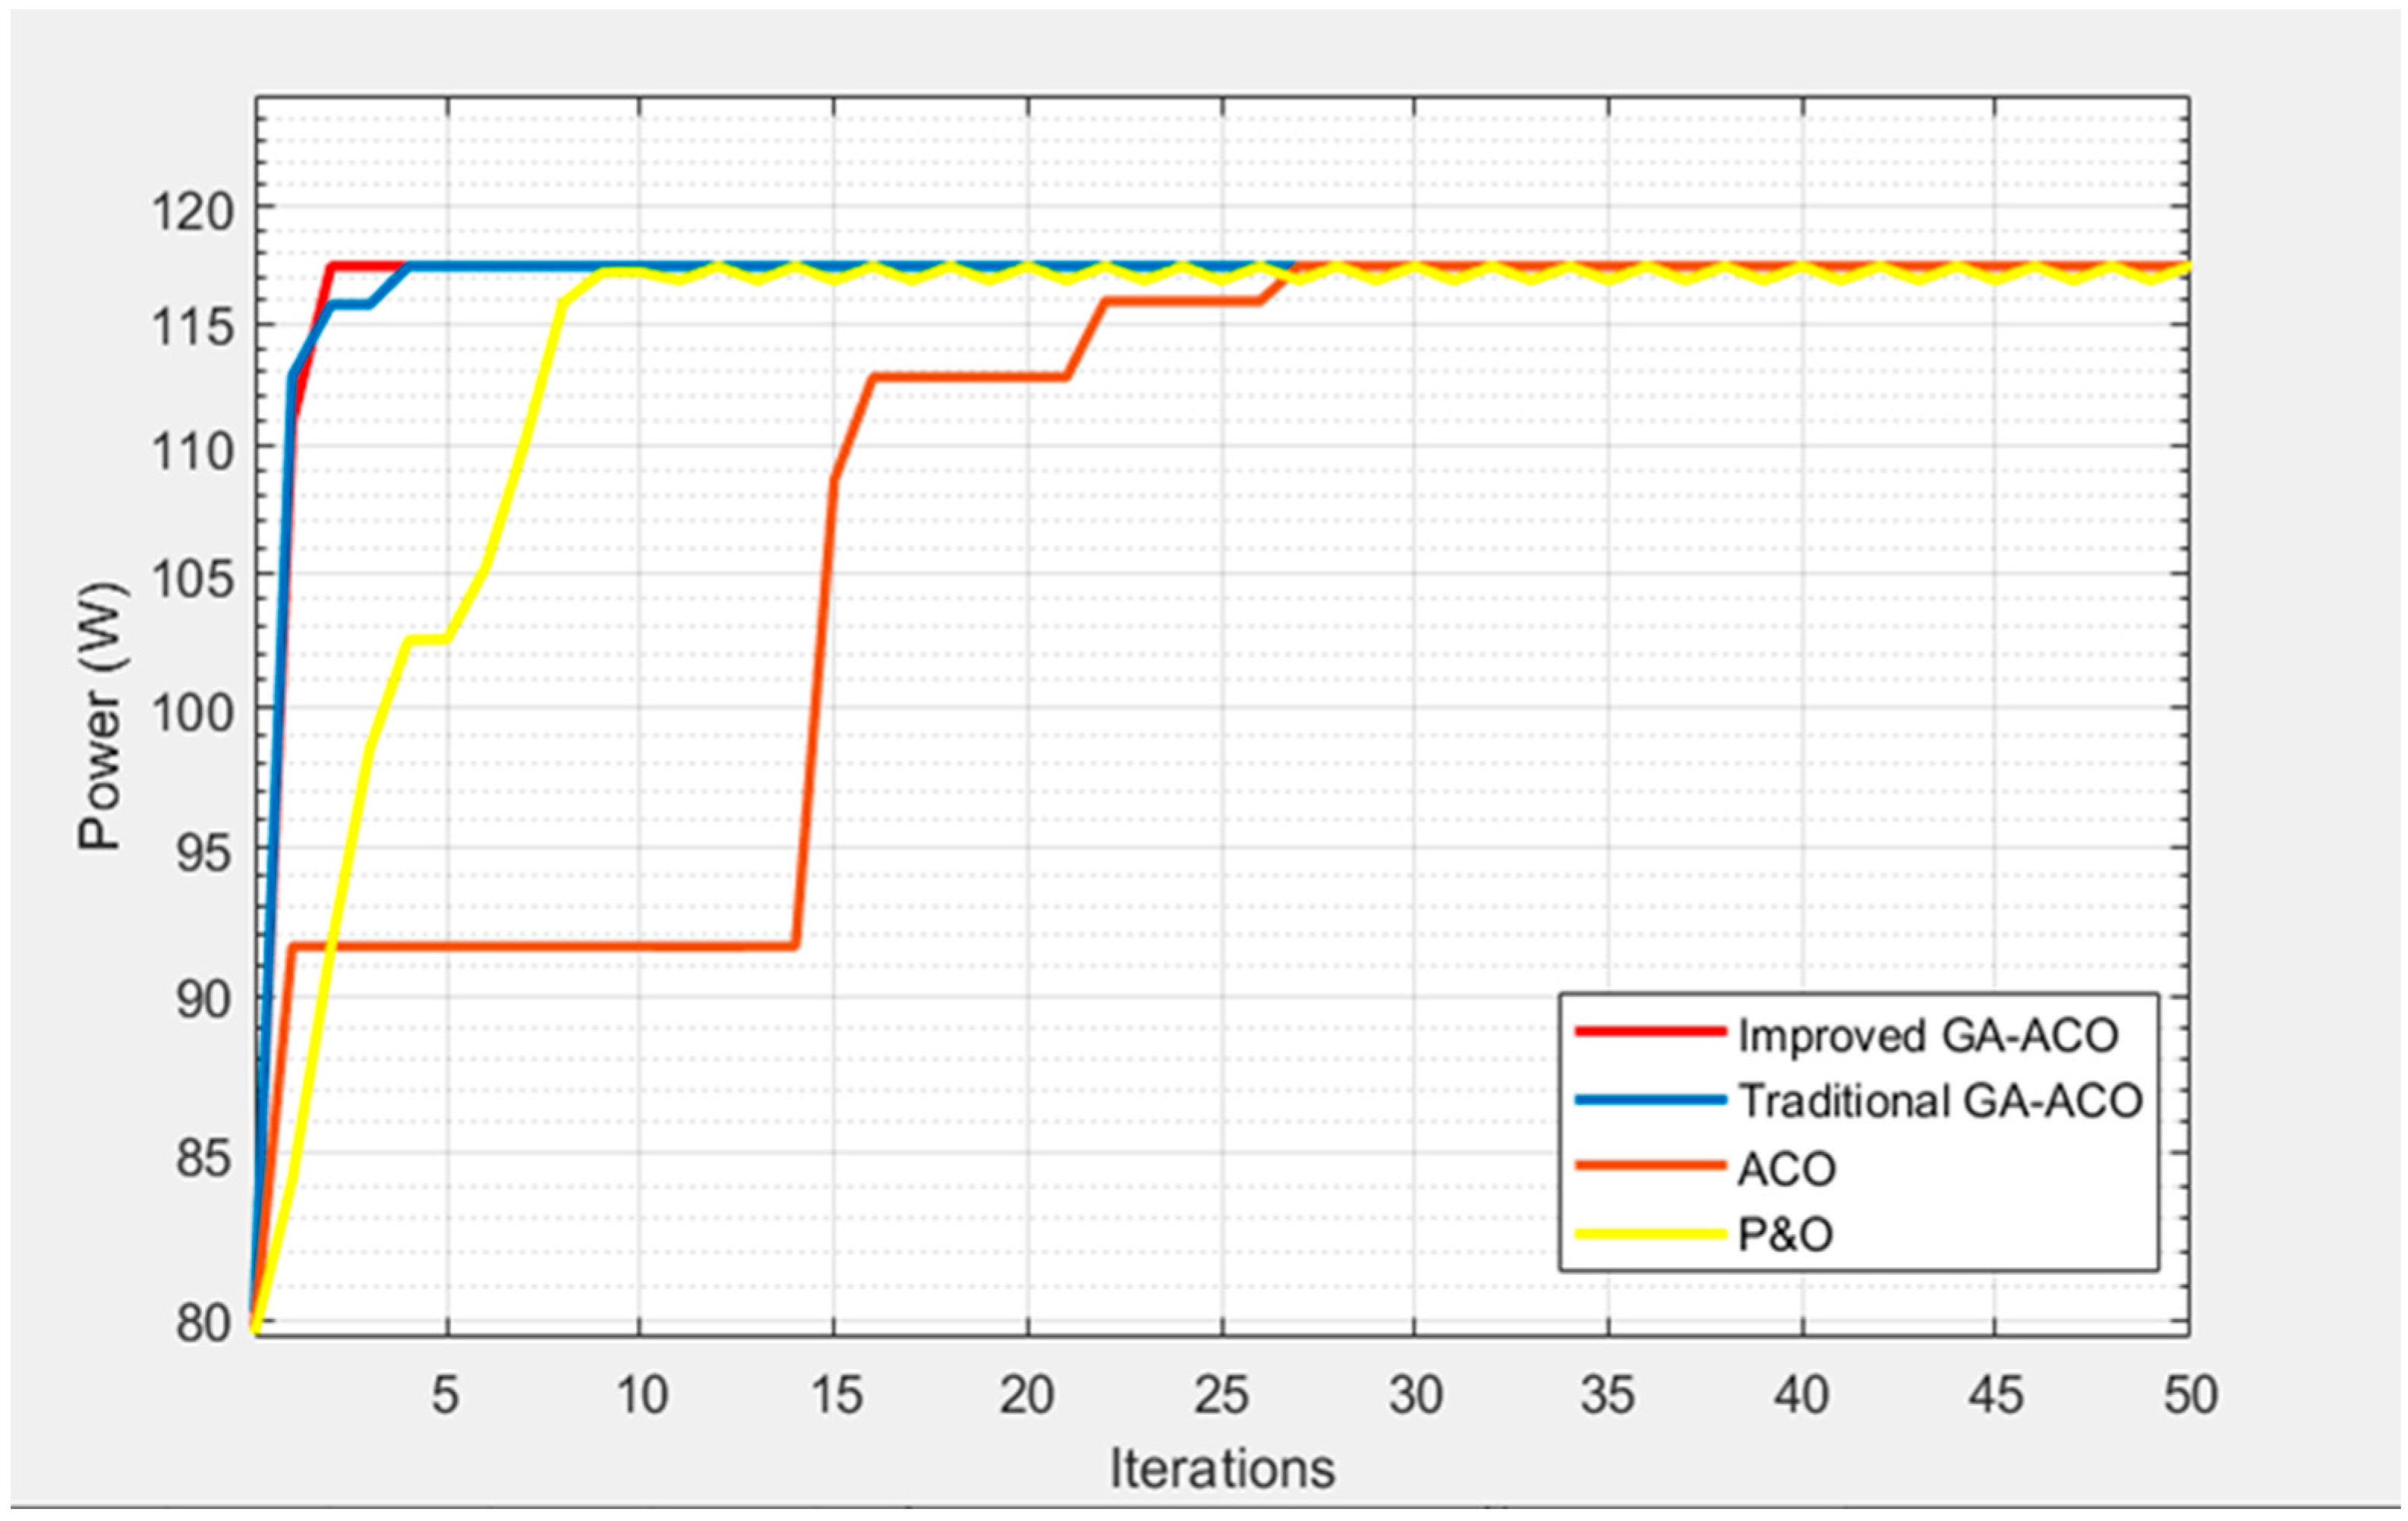
4.3. Case 3: 0% Shading + 25% Shading + 40% Shading + 40% Shading

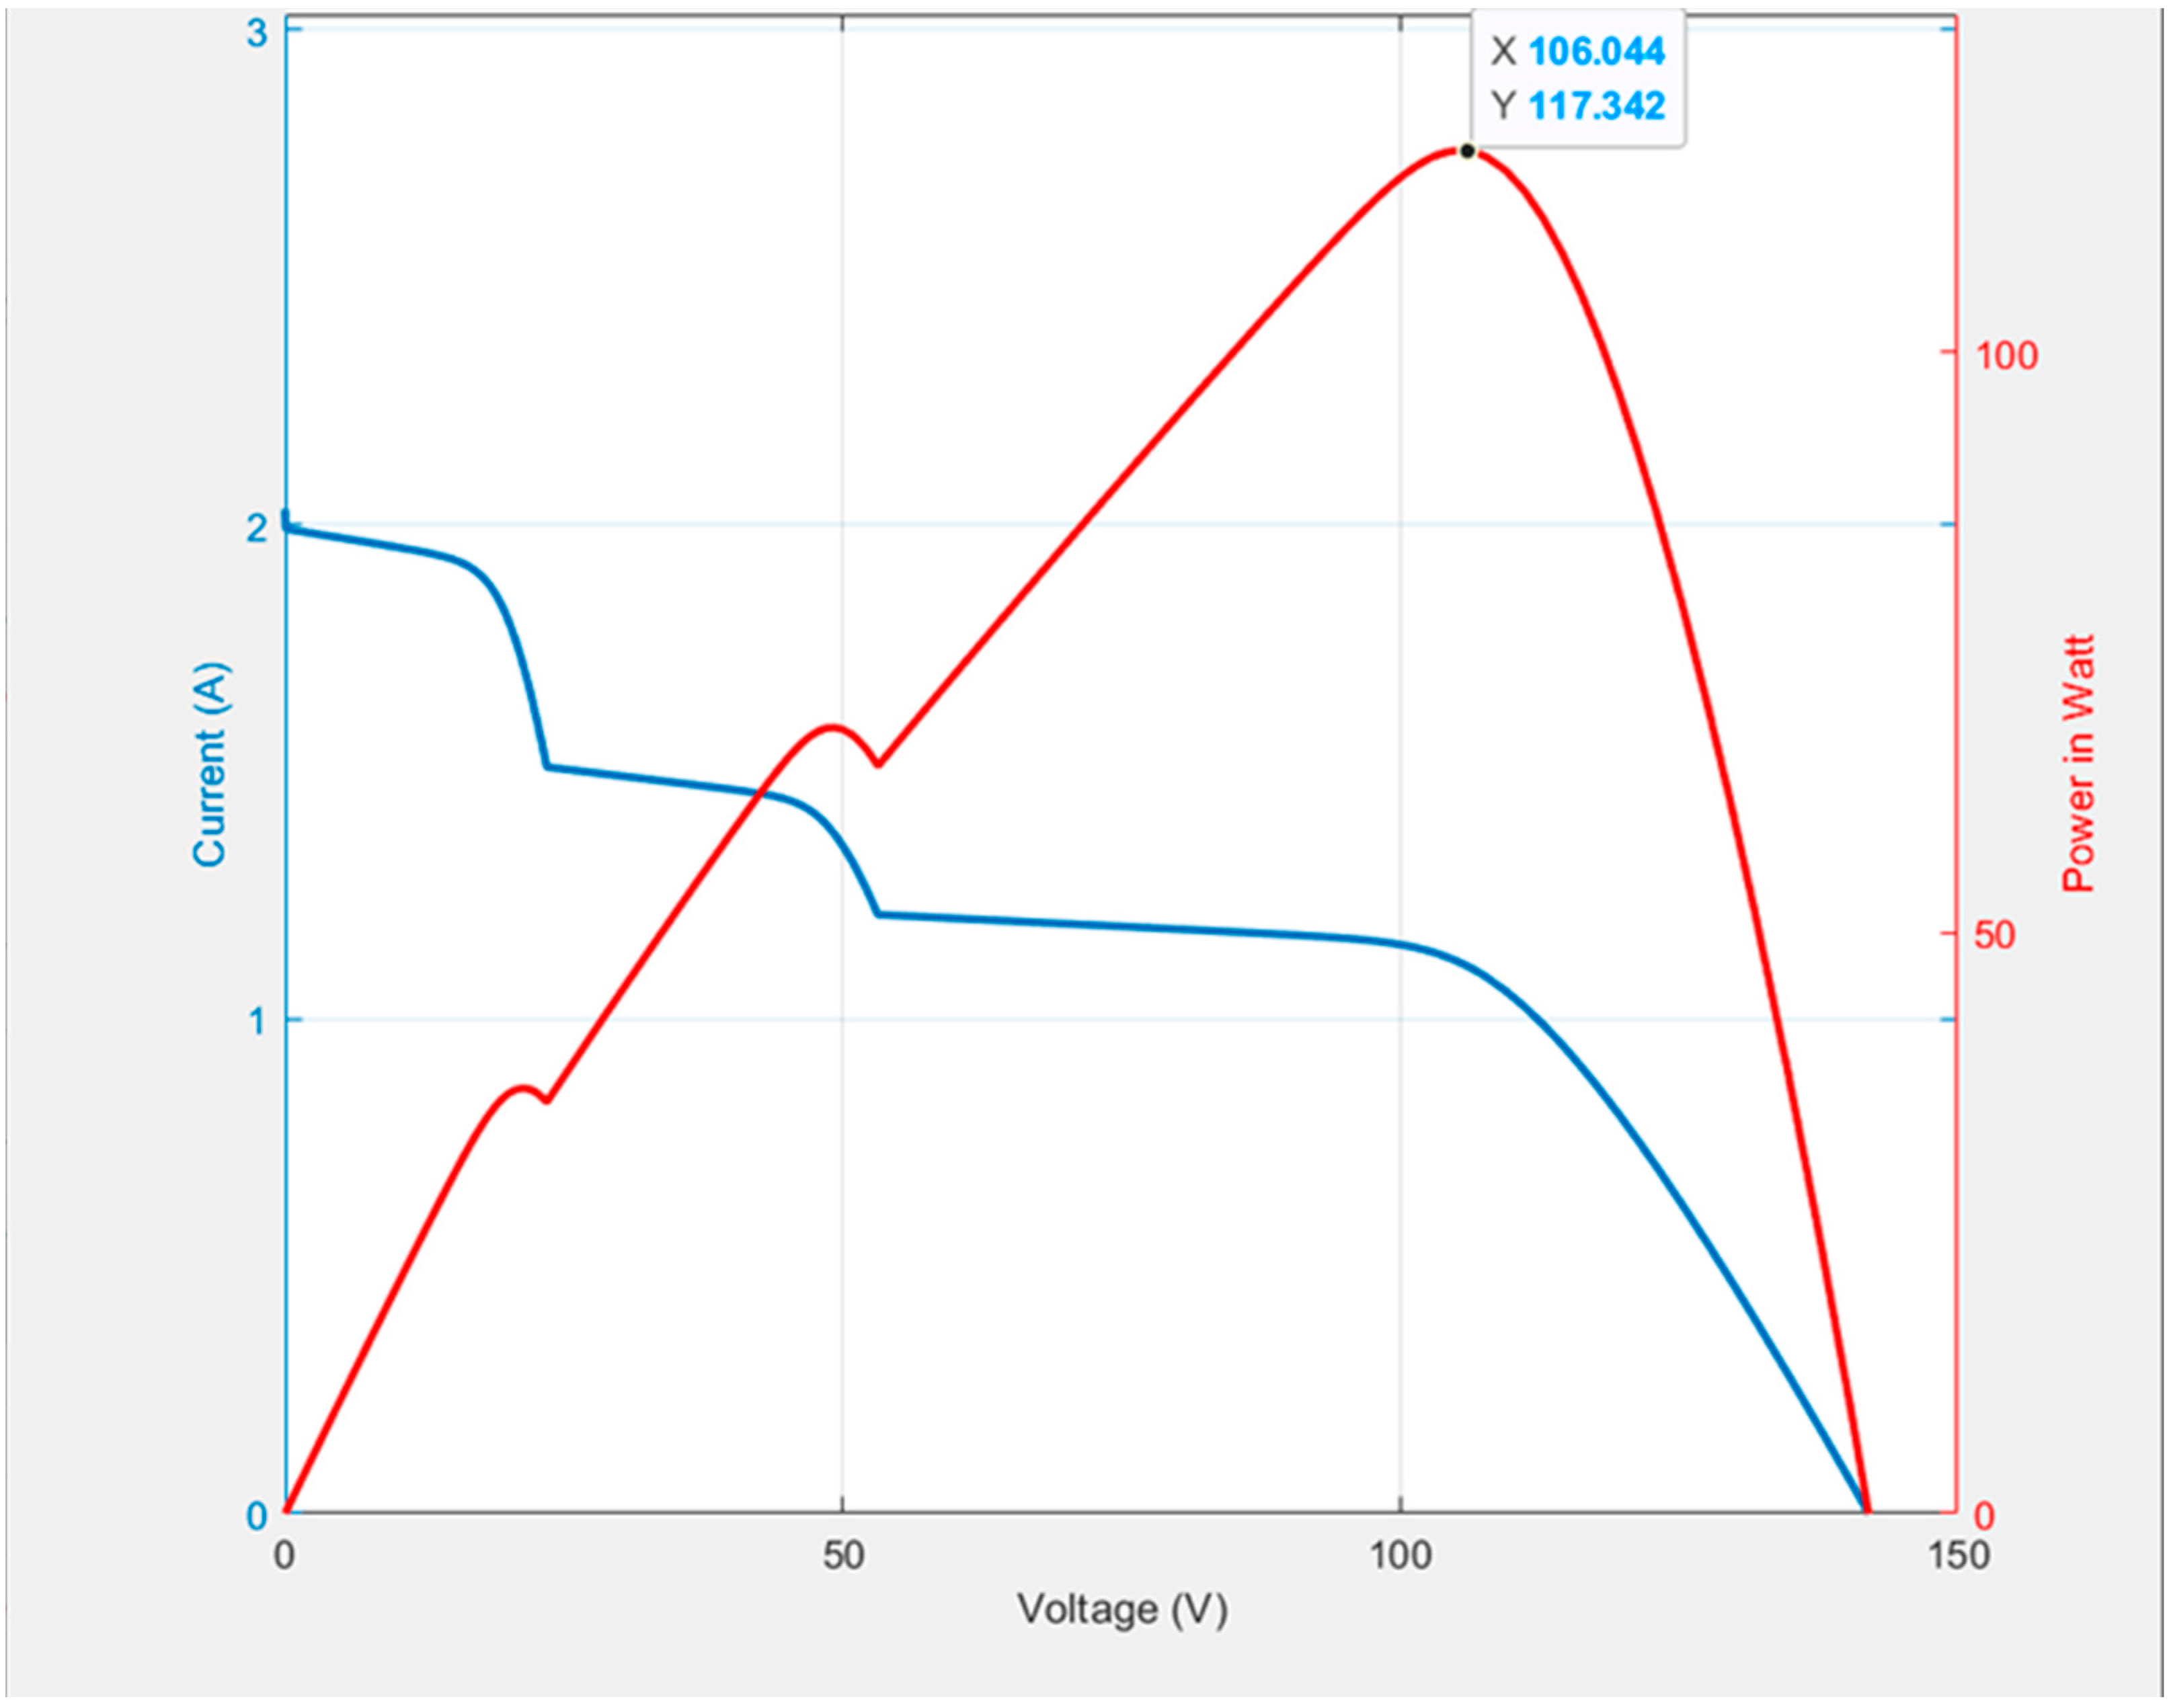
When four photovoltaic modules in series are adopted, the shading ratios of the three photovoltaic modules are 40%, 40% and 25%, respectively. When one photovoltaic module is completely unshaded, the P-V and I-V characteristic curves simulated through MATLAB software are shown in Figure 8. It can be observed from Figure 8 that three-peak values appeared in the P-V characteristic curve, with the GMPP of 117.8 W and the GMPP voltage of 106.1 V. The simulation results in Figure 9 show that the improved GA-ACO method managed to track the GMPP after just two iterations. On the other hand, the traditional GA-ACO and ACO methods required 4 and 27 iterations to track the GMPP. As for the P&O method, the GMPP still failed to be tracked.

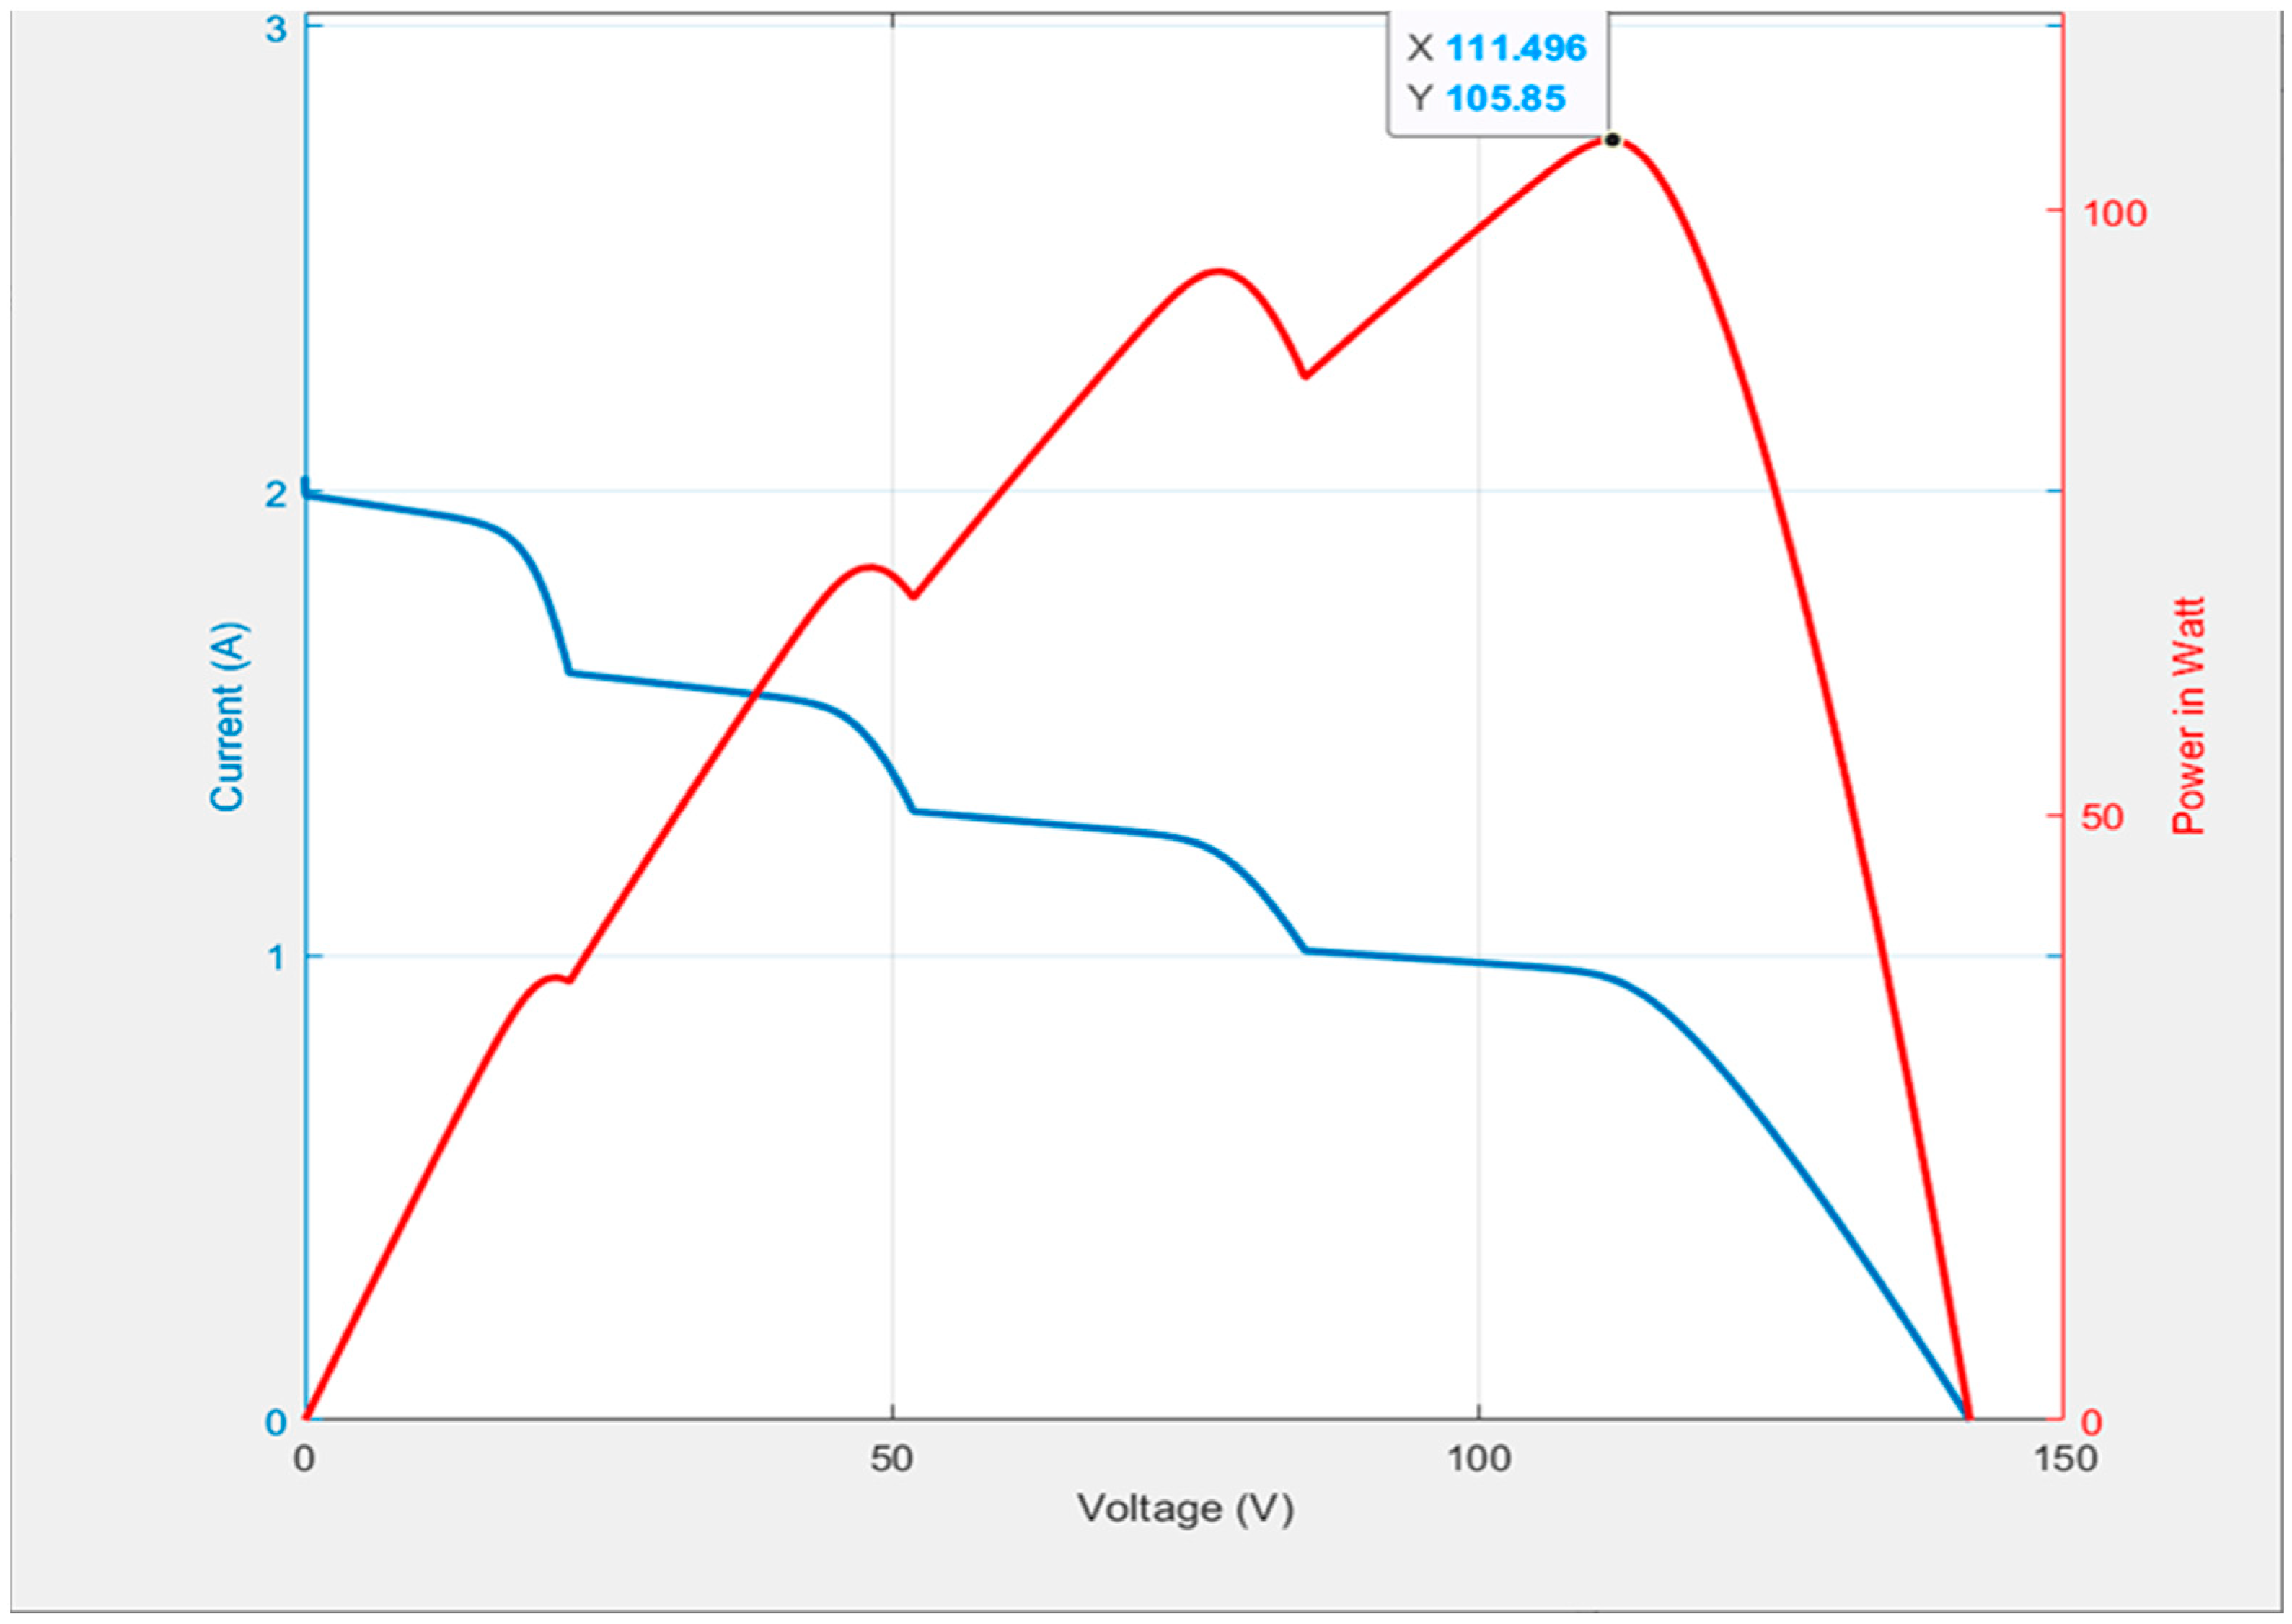
4.4. Case 4: 0% Shading + 20% Shading + 35% Shading + 50% Shading

The shading ratios of the three modules set in this case are 20%, 35% and 50%, respectively. One module is without shading. Figure 10 shows the Case 4 simulation results of the P-V and I-V characteristic curves. It can be observed from the simulation results that four peaks appeared in the P-V characteristic curve, while the GMPP occurred at 105.8 W. 
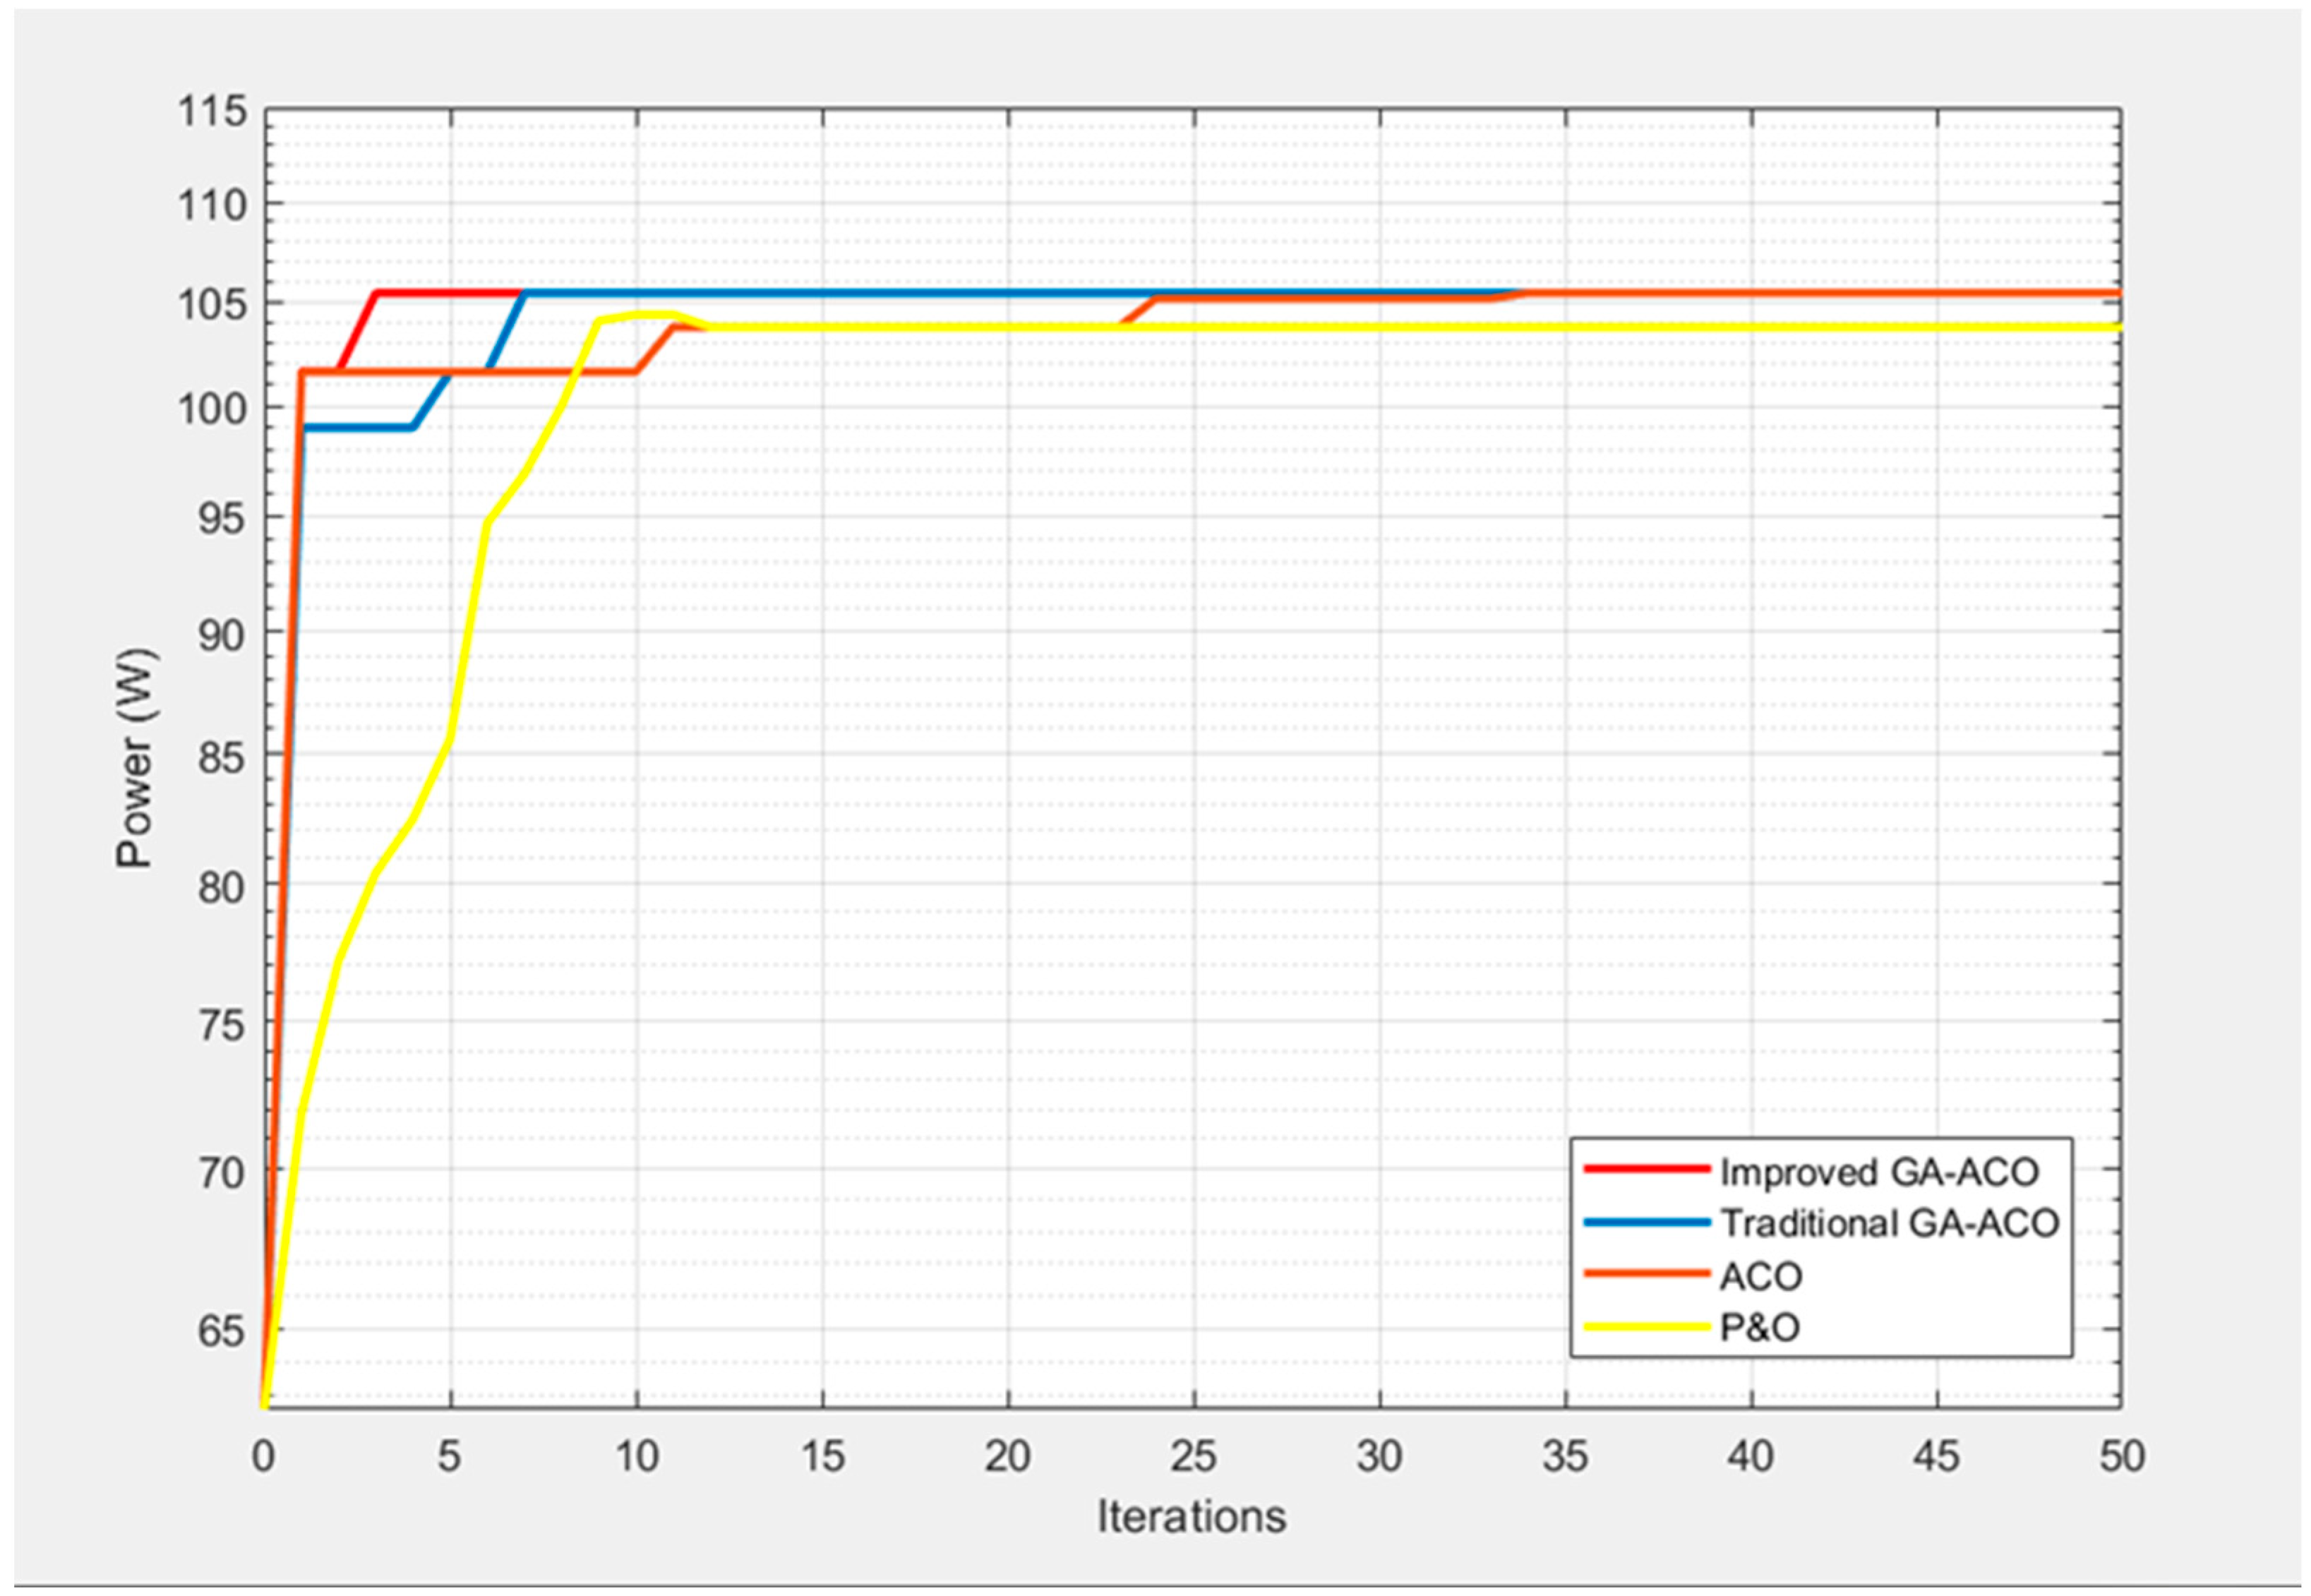
Figure 11 shows the simulation results of the improved GA-ACO, traditional GA-ACO, ACO and P&O MPPT methods. It can be observed from Figure 11 that even though four peaks appeared in the P-V characteristic curve, the improved GA-ACO method managed to track the GMPP with just three iterations. On the other hand, the traditional GA-ACO and ACO methods required 7 and 34 iterations to track the GMPP. As for the P&O method, the GMPP still failed to be tracked with a limited set of iterations.

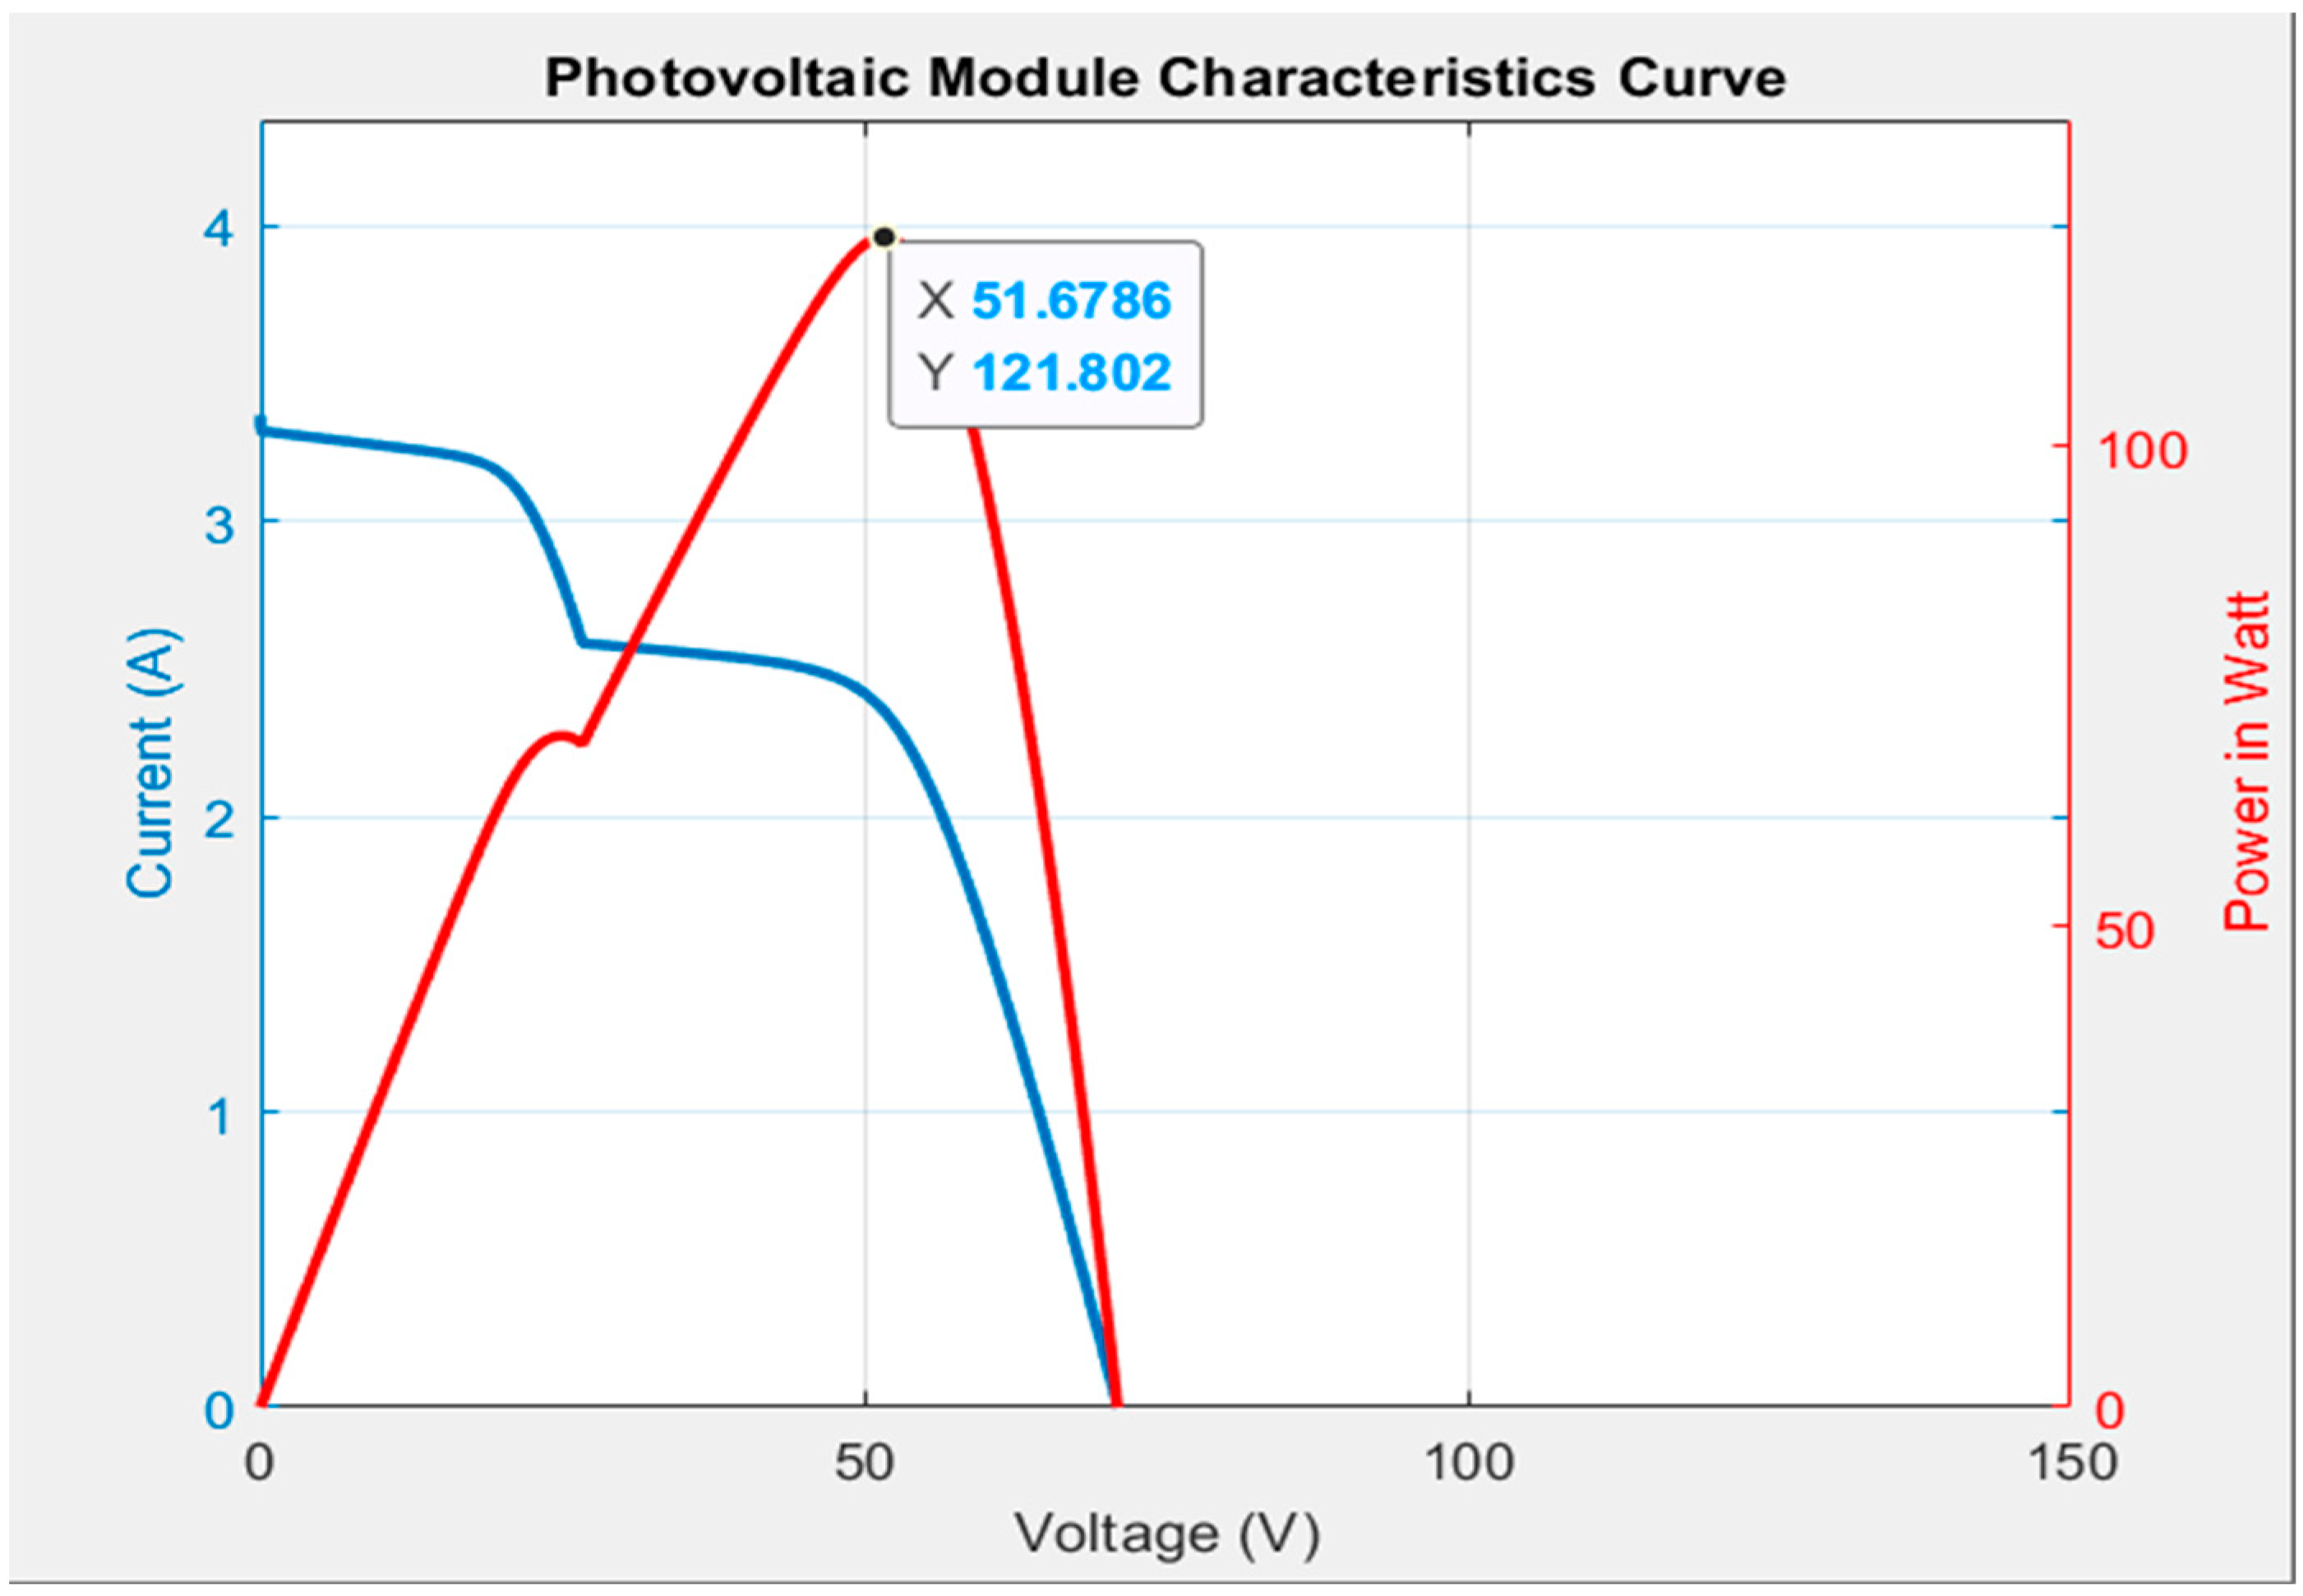
4.5. Case 5: (0% Shading + 35% Shading) // (35% Shading + 35% Shading)

Figure 12 shows Case 5 P-V and I-V characteristic curves obtained from the simulation. The module array is configured as a two-series/two-parallel array. One of the modules is under the condition of 0% shading, while the rest of the modules are under the condition of 35% shading. Since the photovoltaic module is connected as a two-series/two-parallel array, only two peaks are produced in the P-V characteristic curve. The power values of two of the peaks are 69.29 W and 121.75 W, respectively. 
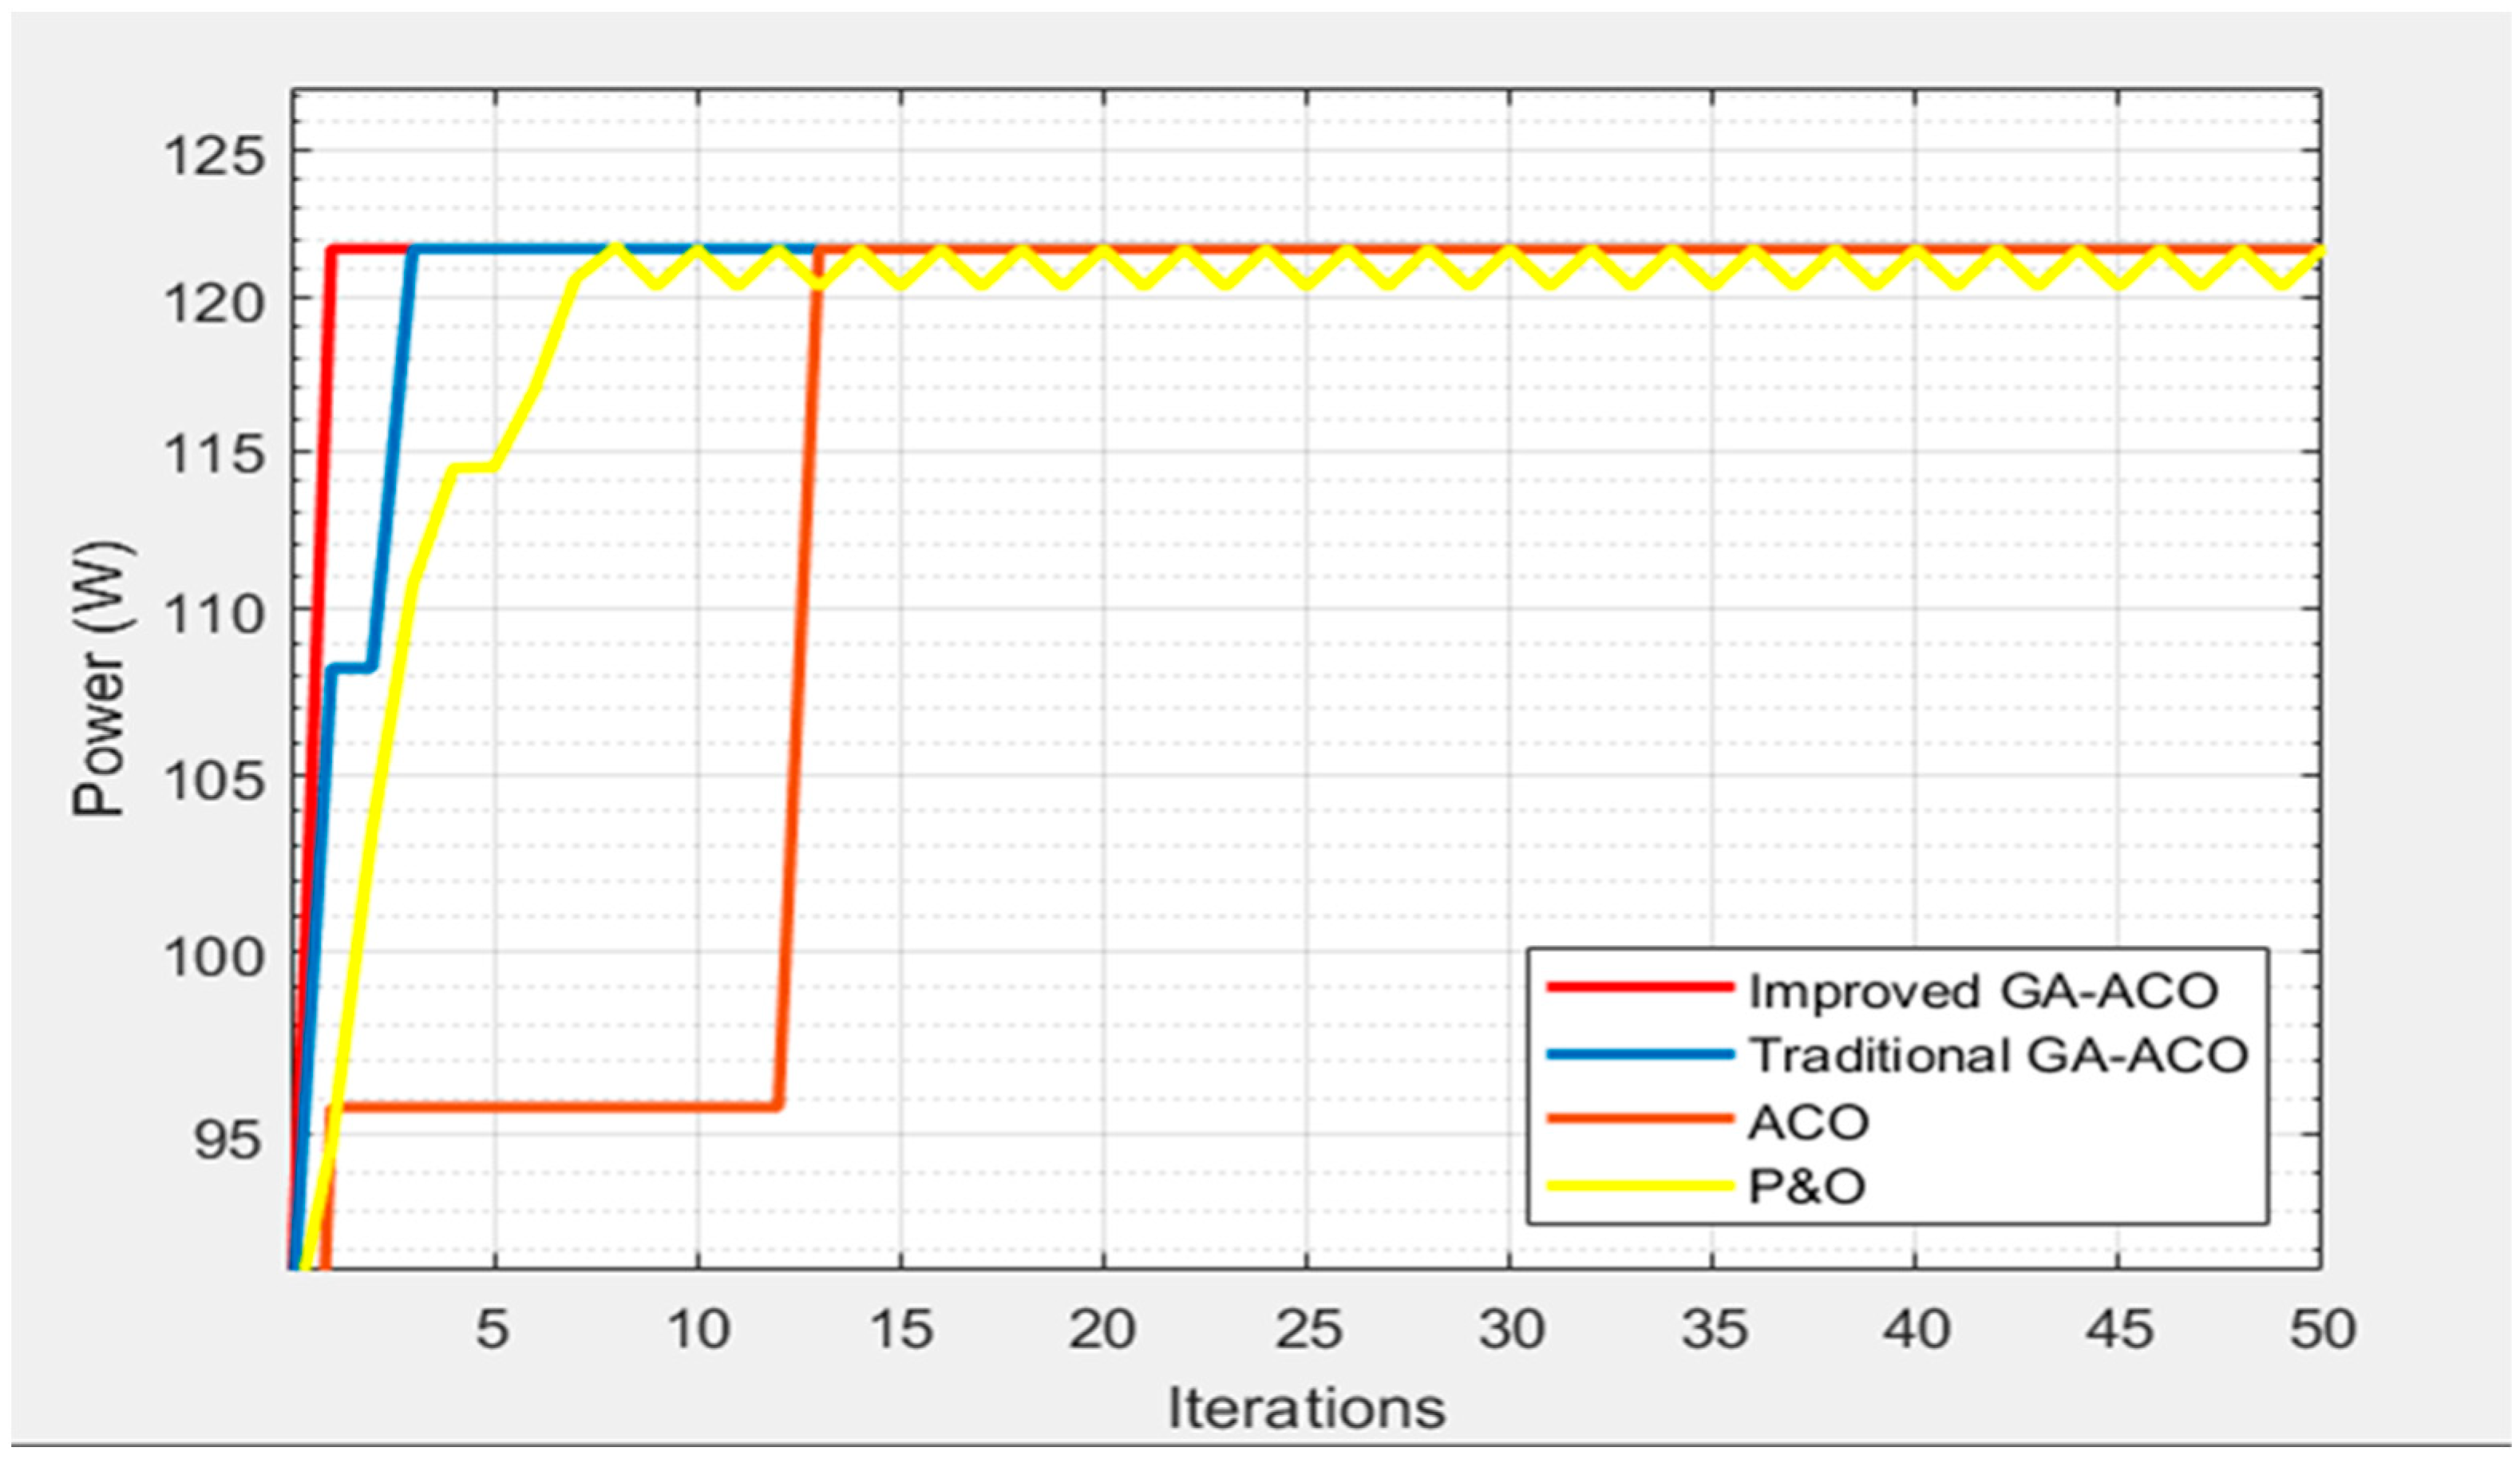
Figure 13 shows that the improved GA-ACO method managed to track the GMPP with just one iteration. On the other hand, the traditional GA-ACO and ACO methods required 3 and 13 iterations, respectively, to track the GMPP. On the other hand, the P&O method still failed to successfully track the GMPP. It can be observed from the simulation results in Figure 13 that even though the PVMA in Case 5 was changed, it was also confirmed that the tracking speed using the improved GA-ACO method proposed in this paper was not affected by changes in the connection method.
The simulation results of the five cases above show that the improved GA-ACO method is superior to the traditional GA-ACO, ACO and P&O methods in terms of performance. In addition, under each case, the improved GA-ACO algorithm managed to track the GMPP with fewer iterations. On the other hand, the traditional GA-ACO and ACO algorithms required more iterations to track the GMPP. As for Cases 1, 2, 3 and 5, although the P&O method managed to track GMPP, it oscillated to and fro near the maximum power point, while in Case 4, it was unable to track GMPP with a limited set of iterations. In addition, based on the five cases selected, maximum power tracking was conducted 50 times using the improved GA-ACO, traditional GA-ACO, ACO and P&O MPPT methods. The numbers of iterations of GMPP tracked each time were added up and averaged, as shown in Table 7. Table 7 shows that although the three algorithms of the improved GA-ACO, traditional GA-ACO and ACO can track the GMPP among the five cases, the improved GA-ACO method required on average fewer iterations compared with those of the traditional GA-ACO and ACO algorithms. This demonstrates that the proposed improved GA-ACO MPPT method has better tracking performance. In particular, the higher the number of peaks in the P-V characteristic curve, the greater the differences in the tracking performance.
In fact, the more complex the algorithm is, the slower the calculation will be. We can conclude from the calculation time comparison that the proposed improved GA-ACO MPPT has the slowest calculation time. Even though the proposed improved GA-ACO MPPT is the slowest to calculate an iteration, this algorithm is the fastest to reach the GMPP because it requires fewer iterations. The iterations of the proposed improved GA-ACO are the least compared with the other three algorithms. The detailed comparison is shown in Table 7 which demonstrates that the proposed GA-ACO MPPT is an improvement on the conventional MPPT algorithm.
In addition, the proposed hybrid method was compared with different hybrid MPPT controllers including the improved artificial bee colony (I-ABC) algorithm [23] and the improved cuckoo search (I-CS) algorithm [24]. The comparison between the proposed hybrid MPPT and existing hybrid MPPTs [23,24] is shown in the Table 8. The partial shading conditions that were tested in [23,24] were one peak, two peaks, three peaks, and four peaks of P-V curve peaks, yet they used different PV specifications and different exact irradiances. Their results are compared with the proposed hybrid MPPT in Table 8. The proposed method is better than the I-ABC and I-CS MPPT methods [23,24] in all cases.
Based on the PVMA in Table 7, the performance was compared in terms of the time response when using different MPPT methods under five different shades for tracking the maximum power point. The results show that the method proposed in this paper indeed provided a better tracking speed response. Therefore, it was verified that the Δρ and Δx adjustment values selected from the slope range for the P-V characteristic curve in Table 1 and Table 2 led to performance of the MPPT response.
For each of the test cases, although the shading conditions for the selected simulation were set at fixed values, they could be seen as the change in equivalent shading ratio since all the shading conditions of the different test cases differed from each other. Furthermore, it can be observed from the simulation results that the proposed MPPT method could obtain better tracking performance under all the changes in shading conditions. Therefore, the five different test conditions listed in Table 5 could be treated as the tests of changing between different shading conditions.
Since the slow change of actual irradiance seemed unable to reveal the superior performance of the MPPT methods proposed, irradiance levels with greater step changes were adopted in this paper for conducting the test and verifying the tracking response of the proposed methods. Under the condition of slow changes in irradiance, the MPPT methods proposed could also produce the same superior tracking performance, only not significant enough.
In this paper, the PVMA went through MPPT tests under five different shading conditions. From Figure 4, Figure 6, Figure 8, Figure 10 and Figure 12, it can be observed that under such different shading conditions, the P-V characteristic curves show different local peak values, and the curve types differ accordingly. Moreover, from the simulation results in Figure 5, Figure 7, Figure 9, Figure 11 and Figure 13, it can also be observed that with the proposed MPPT method, at any point in time during the tracking process, the power value tracked produces a minimum difference between all the compared MPPT methods and the global maximum power point (GMPP). Therefore, it can be determined that the integral of squared error (ISE), integral of time-squared error (ITSE), integral of absolute error (IAE) and integral of time-absolute error (ITAE), which are calculated according to references [27,28,29], would be minimum throughout the simulation.
In this paper, the maximum power tracking test was conducted on the PVMA under five different shading conditions, where each shading condition was equivalent to certain changes in temperature and irradiance parameters. Therefore, the test was the same as the robustness test that considers the MPPT of parametric uncertainties [30,31]. As indicated by the test results in Table 7, all the MPPT methods herein produced better tracking response performances compared with other methods, which demonstrates that the MPPT methods proposed did indeed show robustness.

5. Discussion

The proposed improved GA-ACO algorithm combining the ant colony optimization (ACO) and the genetic algorithm (GA) referred to in reference [25] determine the initial value of the iterative parameters of the ant colony algorithm. To shorten the number of iterations needed to obtain the optimal value, it is necessary to address the issue that the conventional ACO tends to track the local maximum power point (LMPP) when the optimal value is applied to search the global maximum power point (GMPP) if the photovoltaic module arrays (PVMAs) are abnormal. However, the optimization of the GA-ACO parameters differs depending on the P-V characteristic curves generated from different shading conditions. Thus, no principle is to be found for parameter optimization. Provided that it is learned in tests that when the tracking approaches the MPP and as the slope of the P-V characteristic curve declines, the Pheromone evaporation rate ρ and the Gaussian standard deviation x increase, and the ρ and x parameters are required to be greater when approaching the MPP. In contrast, the farther the MPP is, the ρ and x must be decreased as the slope of the P-V characteristic curve increases. Therefore, the optimal adjusted value of the Pheromone evaporation rate, Δρ, and the optimal adjusted value of Gaussian standard deviation, Δx, may be obtained via multiple simulations based on the slope values of the P-V characteristic curves of PVMAs, as indicated in Table 1 and Table 2. Comparing the responses of the time tracking to MPP with different MPPT approaches for the PVMA in Table 7, Section 4, under five different shading levels for their performances, it is observed that the improved GA-ACO algorithm proposed in this paper indeed has better tracking speed response. When five different peak values are found in the P-V characteristic curve in Table 7, the proposed improved GA-ACO algorithm has 19.5~35.9% (average 29.2%) fewer iterations when tracking than the GA-ACO algorithm mentioned in [25]. Compared with the ACO algorithm [15], it has 74.9~79.7% (average 78.2%) fewer, and 75.0~92.5% (average 81.0%) fewer than the conventional P&O method [3].

6. Conclusions

In this paper, an improved GA-ACO algorithm was proposed for application to photovoltaic module arrays to carry out MPPT. The simulation results have validated that its trackability is significantly superior to those of traditional GA-ACO, ACO and P&O MPPT controllers. The MPPT method proposed combines the superior characteristics of GA and ACO. In addition, based on the slope of the P-V characteristic curve in the location of the photovoltaic module array work point, the Pheromone evaporation rate ρ and the Gaussian standard deviation x in the ACO iterative formula are automatically adjusted. The ACO algorithm can then more speedily search the subspace and output the local best solution. The simulation results prove that the improved GA-ACO MPPT controller is superior to traditional GA-ACO, ACO and P&O MPPT controllers in terms of tracking response performance under different connection configurations and shading ratios. The proposed improved GA-ACO MPPT controller even managed to track the global maximum power point during the first iteration. On the other hand, the traditional GA-ACO and ACO MPTT controllers required more iterations to track the GMPP. As for the P&O method, other than in Case 1 (0% shading ratio) when it managed to successfully track the GMPP and generate oscillation near its maximum power point, in the rest of the cases, it was unable to track the GMPP with a limited set of iterations. Therefore, since the improved GA-ACO MPPT required fewer iterations to accurately track the GMPP, the power generation utilization rate of the photovoltaic module array was enhanced.

Author Contributions

The conceptualization was proposed by K.-H.C., who was also responsible for the writing, review and editing of this paper. K.-H.H. completed the formal analysis of the improved GA-ACO algorithm optimization smart algorithm. T.-W.L. was responsible for the data curation, software program, and simulation validation. K.-H.C. was in charge of project administration. All authors have read and agreed to the published version of the manuscript.

Funding

The authors gratefully acknowledge the support and funding of this project by Ministry of Science and Technology, Taiwan, under the Grant Number MOST 110-2221-E-167-007-MY2.

Institutional Review Board Statement

Not applicable.

Informed Consent Statement

Not applicable.

Data Availability Statement

This study did not report any data.

Conflicts of Interest

The authors declare no conflict of interest.

Nomenclature

Acronyms
MPPTmaximum power point tracking
AMair mass
MPPmaximum power point
P-V power-voltage
I-V current-voltage
GAgenetic algorithm
ACOant colony optimization
P&Operturbation and observation
INCincremental conductance
LMPPlocal maximum power point
GMPPglobal maximum power point
PVMAphotovoltaic
STCstandard test condition
ISEintegral of square error
ITSEintegral of time-square error
IAEintegral of absolute error
ITAEintegral of time- absolute error
Symbols
Itmaxnumber of iterations
knumber of solutions
nPopnumber of populations
pccrossover percentage
pmmutation percentage
mslope of the P-V characteristic curve in the PVMA
mumutation
γfactor for crossover
tstournament size
Antnumber of ants
dxlength of a jump
ρpheromone evaporation rate
Δρadjustment value of ρ
Vpvoutput voltage of PVMA
Ppvoutput power of PVMA corresponding to each voltage Vpv
ΔVndistances between each voltage Vn and the best solution (n = 1 …k)
Vnsolution from the archive (n = 1 …k)
Vbestbest solution in the population retained from GA
ΦnGaussian normal distribution value
xGaussian standard deviation
τnPheromone value
Δxadjustment of value of x
Δdduty cycle disturbance
Lmenergy storage inductor
Cininput filter capacitor
Coutoutput filter capacitor

References

  1. Femia, N.; Granozio, D.; Petrone, G.; Spagnuolo, G.; Vitelli, M. Predictive and Adaptive MPPT Perturb and Observe Method. IEEE Trans. Aerosp. Electron. Syst. 2007, 43, 934–950. [Google Scholar] [CrossRef]
  2. Salman, S.; Xin, A.I.; Wu, Z. Design of a P-&-O Algorithm Based MPPT Charge Controller for a Stand-Alone 200W PV System. Prot. Control Mod. Power Syst. 2018, 3, 25. [Google Scholar]
  3. Sahu, R.K.; Ghosh, A. Maximum Power Generation from Solar Panel by Using P&O MPPT. In Proceedings of the International Conference on Intelligent Controller and Computing for Smart Power (ICICCSP), Hyderabad, India, 21–23 July 2022; pp. 21–23. [Google Scholar]
  4. Hang, L.; Guo, H.; Zhu, W. An improved MPPT Control Strategy Based on Incremental Conductance Algorithm. Prot. Control Mod. Power Syst. 2020, 5, 14. [Google Scholar]
  5. Bhattacharyya, S.; Kumar, D.S.; Samanta, S.; Mishra, S. Steady Output and Fast Tracking MPPT (SOFT-MPPT) for P&O and INC Algorithms. IEEE Trans. Sustain. Energy 2021, 12, 293–302. [Google Scholar]
  6. Aquib, M.; Jain, S. A fast global maximum power point tracking technique for partially shaded PV arrays. In Proceedings of the IEEE International Students’ Conference on Electrical, Electronics and Computer Science (SCEECS), Bhopal, India, 24–25 February 2018; pp. 1–5. [Google Scholar]
  7. Hu, G.; Zhong, J.; Wei, G.; Chang, C.T. DTCSMO: An Efficient Hybrid Starling Murmuration Optimizer for Engineering Applications. Comp. Methods Appl. Mech. Eng. 2023, 405, 115878. [Google Scholar] [CrossRef]
  8. Hu, G.; Yang, R.; Qin, X.; Wei, G. MCSA: Multi-strategy Boosted Chameleon-Inspired Optimization Algorithm for Engineering Applications. Comp. Methods Appl. Mech. Eng. 2023, 403, 115676. [Google Scholar] [CrossRef]
  9. Hu, G.; Du, B.; Wei, G. HG-SMA: Hierarchical Guided Slime Mould Algorithm for Smooth Path Planning. Artif. Intell. Rev. 2023, 56, 1–61. [Google Scholar] [CrossRef]
  10. Ma, Y.; Zhou, X.; Gao, Z.; Bai, T. Summary of the novel MPPT (maximum power point tracking) algorithm based on few intelligent algorithms specialized on tracking the GMPP (global maximum power point) for photovoltaic systems under partially shaded conditions. In Proceedings of the IEEE International Conference on Mechatronics and Automation (ICMA), Takamatsu, Japan, 6–9 August 2017; pp. 311–315. [Google Scholar]
  11. Luong, X.T.; Bui, V.H.; Do, D.T.; Quach, T.H.; Truong, V.A. An improvement of maximum power point tracking algorithm based on particle swarm optimization method for photovoltaic system. In Proceedings of the 5th International Conference on Green Technology and Sustainable Development (GTSD), Ho Chi Minh City, Vietnam, 27–28 November 2020; pp. 53–58. [Google Scholar]
  12. Pragallapati, N.; Sen, T.; Agarwal, V. Adaptive Velocity PSO for Global Maximum Power Control of a PV Array under Nonuniform Irradiation Conditions. IEEE J. Photovolt. 2017, 7, 624–639. [Google Scholar] [CrossRef]
  13. Xu, L.; Cheng, R.; Xia, Z.; Shen, Z. Improved particle swarm optimization (PSO)-based MPPT method for PV string under partially shading and uniform irradiance condition. In Proceedings of the Asia Energy and Electrical Engineering Symposium (AEEES), Chengdu, China, 29–31 May 2020; pp. 771–775. [Google Scholar]
  14. Dorigo, M.; Birattari, M.; Stutzle, T. Ant Colony Optimization. IEEE Comput. Intell. Mag. 2006, 1, 28–39. [Google Scholar] [CrossRef]
  15. Jiang, L.L.; Maskell, D. A uniform implementation scheme for evolutionary optimization algorithms and the experimental implementation of an ACO based MPPT for PV systems under partial shading. In Proceedings of the IEEE Symposium on Computational Intelligence Applications in Smart Grid (CIASG), Orlando, FL, USA, 9–12 December 2014; pp. 1–8. [Google Scholar]
  16. Luthfansyah, M.; Eka, P.; Farid, D.M. Performance evaluation of ACO-MPPT and constant voltage method for street lighting charging system. In Proceedings of the International Seminar on Application for Technology of Information and Communication (iSemantic), Semarang, Indonesia, 21–22 September 2019; pp. 411–416. [Google Scholar]
  17. Hadji, S.; Gaubert, J.P.; Krim, F. Real-time Genetic Algorithms-based MPPT: Study and Comparison (theoretical and experimental) with Conventional Methods. Energies 2018, 11, 459. [Google Scholar] [CrossRef]
  18. Daraban, S.; Petreus, D.; Morel, C. A Novel MPPT (Maximum Power Point Tracking) Algorithm Based on a Modified Genetic Algorithm Specialized on Tracking the Global Maximum Power Point in Photovoltaic Systems Affected by Partial Shading. Energy 2014, 74, 374–388. [Google Scholar] [CrossRef]
  19. Megantoro, P.; Nugroho, Y.D.; Anggara, F.; Rusadi, E.Y. Simulation and characterization of genetic algorithm implemented on MPPT for PV system under partial shading condition. In Proceedings of the 3rd International Conference on Information Technology, Information System and Electrical Engineering (ICITISEE), Yogyakarta, Indonesia, 13–14 November 2018; pp. 74–78. [Google Scholar]
  20. Smida, M.; Sakly, A. Genetic based algorithm for maximum power point tracking (MPPT) for grid connected PV systems operating under partial shaded conditions. In Proceedings of the 7th International Conference on Modelling, Identification and Control (ICMIC), Sousse, Tunisia, 18–20 December 2015; pp. 1–6. [Google Scholar]
  21. Halim, A.A.E.; Saad, N.H.; Sattar, A.A.E. A comparative study between perturb and observe and cuckoo search algorithm for maximum power point tracking. In Proceedings of the 21st International Middle East Power Systems Conference (MEPCON), Cairo, Egypt, 17–29 December 2019; pp. 716–723. [Google Scholar]
  22. Anand, R.; Swaroop, D.; Kumar, B. Global maximum power point tracking for PV array under partial shading using cuckoo search. In Proceedings of the 9th IEEE Power India International Conference (PIICON), Sonepat, India, 28 February–1 March 2020; pp. 1–6. [Google Scholar]
  23. Chao, K.H.; Chang, L.Y.; Wang, K.W. Global Maximum Power Point Tracking of Photovoltaic Module Arrays Based on Improved Cuckoo Search Algorithm. Electronics 2022, 11, 1247. [Google Scholar] [CrossRef]
  24. Chao, K.H.; Li, J.Y. Global Maximum Power Point Tracking of Photovoltaic Module Arrays Based on Improved Artificial Bee Colony Algorithm. Electronics 2022, 11, 1572. [Google Scholar] [CrossRef]
  25. Chao, K.H.; Rizal, M.N. A Hybrid MPPT Controller Based on the Genetic Algorithm and Ant Colony Optimization for Photovoltaic Systems under Partially Shaded Conditions. Energies 2021, 14, 2902. [Google Scholar] [CrossRef]
  26. Teo, J.C.; Tan, R.; Mok, V.H.; Ramachandaramurthy, V.K.; Tan, C. Impact of Partial Shading on the P-V Characteristics and the Maximum power of a Photovoltaic String. Energies 2018, 11, 1860. [Google Scholar] [CrossRef]
  27. Zafran, M.; Khan, L.; Khan, Q.; Ullah, S.; Sami, I.; Ro, J.S. Finite-Time Fast Dynamic Terminal Sliding Mode Maximum Power Point Tracking Control Paradigm for Permanent Magnet Synchronous Generator-Based Wind Energy Conversion System. Appl. Sci. 2020, 10, 6361. [Google Scholar] [CrossRef]
  28. Ali, K.; Khan, Q.; Ullah, S.; Khan, I.; Khan, L. Nonlinear Robust Integral Backstepping Based MPPT Control for Stand-alone Photovoltaic System. PLoS ONE 2020, 15, e0231749. [Google Scholar] [CrossRef] [PubMed]
  29. Khan, I.U.; Khan, L.; Khan, Q.; Ullah, S.; Khan, U.; Anmad, S. Neuro-adaptive Backstepping Integral Sliding Mode Control Design for Nonlinear Wind Energy Conversion System. Turk. J. Elec. Eng. Comp. Sci. 2021, 29, 531–547. [Google Scholar] [CrossRef]
  30. Khan, R.; Khan, L.; Ullah, S.; Sami, I.; Ro, J.S. Backstepping Based Super-Twisting Sliding Mode MPPT Control with Differential Flatness Oriented Observer Design for Photovoltaic System. Electronics 2020, 9, 1543. [Google Scholar] [CrossRef]
  31. Ali, K.; Khan, L.; Khan, Q.; Ullah, S.; Ahmad, S.; Mumtaz, S.; Karam, F.W. Naghmash, Robust Integral Backstepping Based Nonlinear MPPT Control for a PV System. Energies 2019, 12, 3180. [Google Scholar] [CrossRef]
Figure 1. P-V and I-V characteristic curves of the photovoltaic module array with four series and one parallel structure and with one module under 50% shade [26].
Technologies 11 00061 g001
Figure 2. The flowchart of the proposed improved GA-ACO maximum power tracking.
Technologies 11 00061 g002
Figure 3. The structural diagram of the proposed improved GA-ACO MPPT controller.
Technologies 11 00061 g003
Figure 4. The P-V characteristic curve simulation (Red represents the P-V characteristic curve; blue represents the I-V characteristic curves) for Case 1.
Technologies 11 00061 g004
Figure 5. Simulation results of performance comparison among the improved GA-ACO, traditional GA-ACO, ACO and P&O MPPT methods for Case 1.
Technologies 11 00061 g005
Figure 6. The P-V and I-V characteristic curves (Red represents the P-V characteristic curve; blue represents the I-V characteristic curve) for Case 2.
Technologies 11 00061 g006
Figure 7. Simulation results of performance comparison among the improved GA-ACO, traditional GA-ACO, ACO and P&O MPPT methods for Case 2.
Technologies 11 00061 g007
Figure 8. The P-V and I-V characteristic curves (Red represents the P-V characteristic curve; blue represents the I-V characteristic curve) for Case 3.
Technologies 11 00061 g008
Figure 9. Simulation results of performance comparison among the improved GA-ACO, traditional GA-ACO, ACO, and P&O MPPT methods for Case 3.
Technologies 11 00061 g009
Figure 10. The P-V and I-V characteristic curves (Red represents the P-V characteristic curve; blue represents the I-V characteristic curve) for Case 4.
Technologies 11 00061 g010
Figure 11. Simulation results of performance comparison among the improved GA-ACO, traditional GA-ACO, ACO and P&O MPPT methods for Case 4.
Technologies 11 00061 g011
Figure 12. The P-V and IV characteristic curves (Red represents the P-V characteristic curve; blue represents the I-V characteristic curve) for Case 5.
Technologies 11 00061 g012
Figure 13. Simulation results of performance comparison among the improved GA-ACO, traditional GA-ACO, ACO and P&O MPPT methods for Case 5.
Technologies 11 00061 g013
Table 1. The adjustment value Δ ρ of ρ under different slopes of the P-V characteristic curve.
m   =   P i t P ( i t 1 ) V i t V ( i t 1 ) Δ ρ
m > 2 −0.2
2 m 1.5 −0.15
1.5 m 1 −0.09
1 m 0.5 +0.07
0.5 m 0 +0.17
m = 0 0
0 m 0.5 +0.17
0.5 m 1 +0.07
1 m 1.5 −0.09
1.5 m 2 −0.15
m < 2 −0.2
Table 2. The adjustment value Δ x of x under different slopes of the P-V characteristic curve.
m   =   P i t P ( i t 1 ) V i t V ( i t 1 ) Δ x
m > 2 −0.285
2 m 1.5 −0.14
1.5 m 1 −0.02
1 m 0.5 +0.1
0.5 m 0 +0.2
m = 0 0
0 m 0.5 +0.2
0.5 m 1 +0.1
1 m 1.5 −0.02
1.5 m 2 −0.14
m < 2 −0.285
Table 3. The specifications of the main components of a boost DC-DC converter.
ItemsSpecifications
Energy storage inductance (Lm)250 uH, 10 A
Filter capacitor (Cin)390 uF, 450 V
Filter capacitor (Cout)330 uF, 450 V
Fast diode (D) IQBD60E60A1withstand voltage VRRM = 600 V, withstand current IFAV = 60 A
Power semiconductor (S) MOSFET IRFP460withstand voltage VDSS = 500 V, withstand current ID = 20 A
Table 4. The electric parameter specifications of the photovoltaic module adopted.
ParametersSpecifications
Rated maximum output power (Pmp)40.75 W
Current at maximum output power point (Imp)1.74 A
Voltage at maximum output power point (Vmp)23.42 V
Short-circuit current (Isc)2 A
Open-circuit voltage (Voc)36 V
Table 5. The test cases of five shading ratios under different parallel series configurations.
CaseSeries-Parallel Configuration and Shading RatioThe Number of Peaks in the P-V Curve
10% shading + 0% shading + 0% shading + 0% shadingSingle-peak
20% shading + 35% shading + 35% shading + 35% shadingDouble-peak
30% shading + 25% shading + 40% shading + 40% shadingTriple-peak
40% shading + 25% shading + 35% shading + 50% shadingQuadruple-peak
5 (0% shading + 35% shading) // (35% shading + 35% shading)Double-peak
Note: 0% shading means no shading; “+” means “series”; “//” means “parallel”.
Table 6. The parameter setting values of the improved GA-ACO, traditional GA-ACO, ACO, and P&O MPPT methods adopted for the simulation.
Parameter NameValue
Maximum number of iterations (Itmax)50
Number of solutions (k)3
Number of populations (nPop)5
Crossover percentage (pc)0.7
Factor for crossover (γ)0.4
Mutation percentage (pm)0.4
Mutation rate (mu)0.3
Tournament size (ts)3
Ant count (Ant)5
Pheromone evaporation rate (ρ)0.37
Gaussian standard deviation (x)0.5
Duty cycle disturbance (Δd)0.02
Table 7. The comparison of the five cases tracking the average number of iterations of GMPP using different algorithms.
CaseACO MPPT [15]P&O MPPT [3]GA-ACO MPPT [25]Proposed GA-ACO MPPT
Iter GMPPTotal Time Iter GMPPTotal TimeIter GMPPTotal TimeIter GMPPTotal Time
115.643.1 ms17.853.0 ms4.851.2 ms3.240.8 ms
218.163.6 ms18.253.1 ms6.741.7 ms4.561.2 ms
330.966.2 ms32.355.5 ms8.422.1 ms6.781.8 ms
436.877.4 msStuck in LMPP--11.682.9 ms7.491.9 ms
525.385.1 ms23.153.9 ms7.141.8 ms5.361.4 ms
Note: Iter GMPP signifies the average number of iterations to obtain GMPP, Total Time signifies the average total time to reach MPP, and LMPP signifies the local maximum power point.
Table 8. The hybrid MPPT comparison.
CaseNumber of Iterations
I-ABC MPPT [23]I-CA MPPT [24]Proposed GA-ACO MPPT
14.564.213.24
26.455.684.56
37.397.216.78
410.188.327.49
510.577.985.36
Disclaimer/Publisher’s Note: The statements, opinions and data contained in all publications are solely those of the individual author(s) and contributor(s) and not of MDPI and/or the editor(s). MDPI and/or the editor(s) disclaim responsibility for any injury to people or property resulting from any ideas, methods, instructions or products referred to in the content.

