Article

Visual Performance and Perceptual–Motor Skills of Late Preterm Children and Healthy Controls Using the TVPS-3rd and VMI-6th Editions

by
Danjela Ibrahimi
1,2,*,†,
Jorge D. Mendiola Santibañez
2,† and
Juvenal Rodríguez-Reséndiz
2,*,†
1
Facultad de Medicina, Universidad Autónoma de Querétaro, Santiago de Querétaro 76176, Mexico
2
Facultad de Ingeniería, Universidad Autónoma de Querétaro, Santiago de Querétaro 76010, Mexico
*
Authors to whom correspondence should be addressed.
These authors contributed equally to this work.
Technologies 2023, 11(2), 53; https://doi.org/10.3390/technologies11020053
Submission received: 10 March 2023 / Revised: 24 March 2023 / Accepted: 3 April 2023 / Published: 4 April 2023
(This article belongs to the Special Issue Smart Systems (SmaSys2022))

Abstract

:
Background: The visual system is key to the learning process, preterm births are commonly followed by visual dysfunctions and other neurological conditions. Objective: to measure, analyze and compare the visual efficacy, visual–perceptual, and visual–motor skills of 20 late preterm children (34–36 weeks) born by caesarean section and appropriate weight for gestational age with 20 healthy controls born at full term by natural birth, age 5 to 12 years, from Querétaro, México. Methods: This was an observational, transverse, and prospective study. Parametric and non-parametric tests were performed using the SPSS 25.0. The visual acuity at distance and near, the phoria state, and the degree of stereopsis were analyzed. The Test of Visual-Perceptual Skills, Third Edition, was used to assess the overall performance, basic, sequencing, and complex processes. Fine motor skills were evaluated using the Visual–Motor Integration Test of Beery, Sixth Edition. Results: Visual acuity at distance and near ( p < 0.001 ), stereopsis ( p < 0.001 ), and the amount of exophoria at distance ( p = 0.01 ) showed statistically significant differences between the groups. The overall performance ( p = 0.006 ), basic processes ( p = 0.001 ), sequencing processes ( p = 0.02 ), and General and Motor VMI ( p < 0.001 and 0.002 , respectively) presented lower values in children born preterm. Conclusion: This research showed that even late preterm children present visual deficiencies and are at risk of delays on perceptual–motor skills. Early evaluation of their visual and motor abilities should be considered in order to help improve their cognitive functioning.

1. Introduction

In the twenty-first century, obstetric care has increased the survival of premature children, even in cases of very low birth weight [1]. The World Health Organization, in November 2022, declared that prematurity is an urgent public health issue, as fifteen million babies are born preterm. Depending on the level of prematurity, these children commonly present abnormal visual and neurological development, which is related to the primary and secondary visual pathway (striate, extrastriate cortex, and visuomotor integration areas) [2]. These areas process the spatial and temporal aspects of visual information, the integration of which enables the motor output. Considering that visual perception, motor skills, and visuomotor integration have been associated with attention, learning, and educational outcomes from kindergarten to highschool, their evaluation, especially in children at risk, becomes necessary [3,4,5]. Sensory impairments are common among preterm children [6], and the visual system, which becomes dominant when the child starts coordinating their eyes, is one of them. Therefore, its analysis becomes essential when taking into consideration that almost 32 different areas process visual information through 300 pathways (most of them bidirectional) [7].
In Mexico, almost 22% of children who are born by Caesarian section are categorized as premature birth. From this sample, 10% are defined as late preterm birth, 3% present strabismus and amblyopia, and the other 10% show other neurological conditions [8,9]. Unfortunately, the later development (visual, motor, social) of these children is not tracked, as they are considered of low risk. Therefore, their needs in terms of evaluation and treatment are often underestimated. Considering the lack of research and the need to sensibilize Mexican society on the topic, a first step is made through our study. Late preterm children were chosen for this purpose because most existing research focuses on early gestational age (less than 34 weeks), as they present a higher degree of developmental dysfunction and have a larger impact on public health [10]. However, analysis of the visual function of premature children has shown that, even in the absence of major neurological signs, they are at risk for abnormal visual development [2] and perceptual–motor difficulties detected even before the age of 4 years [11], as well as deficits in cognitive functioning [12]. Of course, in very preterm children these complications increase, having a larger impact on their school performance and everyday life [13,14]. Full-term birth, which starts at 39 weeks and extends to 40 weeks and 6 days, provides the baby with time to develop normally. The brain and organs such as the liver, lungs, etc., pass through a crucial period of growth between 37 and 39 weeks of pregnancy that is essential for later milestones. Any interruption or complication in pregnancy can be the cause of abnormal child development [15]. Natural birth and Caesarian section were chosen for this study, as research has shown a shift in the baby’s first bacterial community [16], adverse effects on children’s perceptual skills, sensory integration abilities, and a negative impact on the mother–child relationship [17]. Patients with ROP were excluded, as the purpose of the research was to measure the impact of late prematurity on the visual–perceptual and visual–motor performance of these children by controlling any confusing variable that could affect the obtained results. Likewise, children with amblyopia and strabismus were excluded from the analysis, as both conditions have been associated with changes on the white and gray matter at different levels and cortical areas [18,19], affecting the general visual abilities of the individual [20,21]. Preterm birth which occurs at 37 weeks or earlier is divided into four categories: late preterm (34–36 weeks), moderately preterm (32–34 weeks), very preterm (born before 32 weeks), and extremely preterm (born before 25 weeks) [10]. Prematurity has been associated with hearing impairment [22], language difficulties [23], mathematics difficulties [24], attention-deficit/hyperactivity disorder (ADHD), and learning disabilities [25]. However, most of the information found in the literature analyzes the impact of prematurity on the visual–perceptual and visual–motor skills of Caucasian children [13,26]. The literature provides no research on the visual efficacy and perceptual–motor skills of preterm Mexican children, especially, when it comes to a specific sample without obvious neurological conditions, such as late preterm children. This group of children often goes unnoticed, as they do not create major problems in the class. This is despite their struggle to reach higher levels of performance, as confirmed by parents during the medical history of their children. These observations served as our motivation to look more deeply into the consequences of preterm birth in the perceptual–motor development of these children. As the visual system is key to the learning process, our objective was to evaluate, analyze, and compare the visual performance, visual–perceptual skills (VPS), and visual–motor skills (VMS) of late preterm children without retinopathy of prematurity (ROP) who were born between 34–36 weeks by Caesarean section and had appropriate weight for gestational age [27] with healthy controls (HCs) born at full term by natural birth. Both groups of children were aged 5 to 12 years and were from Querétaro, México.
Visual performance was measured through the visual acuity and phoria state at distance and near and the degree of stereopsis at near distance. Visual–perceptual skills were defined by four groups of abilities: overall performance and basic, sequencing, and complex processes. Visual–motor abilities were analyzed by the General and Motor VMI, which are directly related to fine motor skills and are important for academic achievement [28]. Perceptual–motor skills, including visual discrimination, visual memory, figure–ground discrimination, spatial visualization, visual–motor integration, etc., were evaluated using the Test of Visual–Perceptual Skills, Third Edition (TVPS-3) [29] and Visual Motor–Integration Test of Beery, Sixth Edition (VMI-6) [30]. These abilities have been positively correlated with academic achievement and mathematical problem solving skills [13,31]. Our results show that preterm birth affects the overall performance, basic processes, sequencing, and visual–motor integration skills of our participants when compared to control (p < 0.05), while complex processes are not affected. Despite the lower values obtained on the figure–ground and visual closure tests for the preterm group, differences are not statistically significant (p = 0.16). Our results agree with previous studies, in which abilities such as visual memory, figure–ground discrimination, form constancy, visual closure, and motor integration were lower in children born preterm [13]. Similar results have been obtained by neuropsychologists using a battery of tests for movement assessment and a developmental test for visual perception. Preterm children showed increased risk for clinical developmental delays related to visual analysis and motor integration skills [26]. Therefore, considering that vision is the sensory modality that brings together most of the information during academic learning [32], it is essential to incorporate these evaluations of children before the process of writing and reading starts. Our research differs from previous research in that it includes a very specific group of participants without any obvious neurological dysfunction or visual impairment, making prematurity the only variable of interest. Through this study, we aim to raise consciousness about the importance of adequate brain growth for the best visual and motor performance of our children. Therefore, preterm children should be considered for detailed evaluations, as they lack the opportunity to fully develop in the womb. As the brain is the most complex organ of the human body, such professional attention becomes crucial in circumstances involving a lack of necessary time for its complete growth and development. The assessment of these areas is strongly recommended to ensure that diagnosis and possible intervention can take place at early ages in order to enhance the cognitive development of these children.

2. Materials and Methods

2.1. Participants

A total of 40 children from Querétaro, México, aged 5–12 years, participated in this observational, transverse, and prospective study, of whom were 20 late preterm children born between 34–36 weeks by Caesarean section who were of appropriate weight for gestational age without retinopathy of prematurity (ROP) or any other neurological condition that could affect our results and the other 20 were healthy controls (HCs) born at full term by natural birth. Of the total number, 26 were boys and 14 were girls. Participants belonged to a similar socioeconomic status (middle class) and had an average IQ score for their chronological age as reported by their school/parents. Data on medical history and clinical examinations were collected at the Brain Vision and Learning Center, in Querétaro, México, from January to June 2022. All data were collected by the same clinician, Dr. Danjela Ibrahimi, a specialist in vision and child development. The study conformed to the principles of the Declaration of Helsinki. Consent from the participants and parents was obtained before performing any procedure. Patients at least 5 years old were chosen for this study, as recent research on Caesarean delivery suggests that the impact it may have on the brain development of newborns and infants could be transient, as it is not observed in children ages 5 and older [33].

Eligibility

Eligibility was established over a three-day period, which permitted us to perform detailed neuro-optometric evaluations in which both the quantity of sight (amount of visual acuity) and integrity of vision (a more complex process of the visual system) were analyzed. Only participants who met our inclusion criteria were included in the study. Inclusion criteria for control group: Children born at full term and by natural birth with: (i) no history of eye disease, (ii) best-corrected visual acuity (VA) ≥ 0.2 logMAR units, (iii) no history of any neurological condition or psychiatric disease, and (iv) no use of medications that could alter the central nervous system (CNS). Inclusion criteria for preterm children: Premature children born by caesarian section with: (i) only late prematurity (34–36 weeks of pregnancy), (ii) no history of ROP, (iii) no history of strabismus/amblyopia, (iv) best-corrected visual acuity (VA) ≥ 0.3 logMAR units, (v) no previous optometric or ophthalmologic treatment except the use of an optical prescription, and (vi) no history of conditions such as attention-deficit/hyperactivity disorder, epilepsy, dyslexia, or depression.

2.2. Data Collection

Based on these inclusion and exclusion criteria, data collection was divided in three phases. For better results, all visual evaluations took place during morning hours after 8–9 h of sleep. Phase one: on the first day, detailed medical histories regarding the neurological development of the child and their visual system were collected from parents by the neuro-optometrist in charge of the study. Additionally, near and distant visual acuity (the amount of sight), noncycloplegic objective refraction (under normal conditions), cycloplegic objective refraction using two drops of 1% tropicamide [34], and ophthalmoscopy (evaluation of the retina and fixation) were performed. These data were important for corroborating the functionality of the visual system before continuing with the rest of the evaluations. Phase two: subjective refraction for the best optical correction was performed. To determine the impact of the prescription on the visual system, the following tests were then conducted: repetition of the near and distant visual acuity tests with the new prescription, phoria state tests at both distances using the Cover test, which evaluates eye alignment, and the Random Dot-2 test to measure depth perception at 40 cm (this test measures gross and fine stereopsis, and covers 500 to 12.5 s of arc). Phase three: patients who met the inclusion criteria and decided to continue with the evaluation were scheduled for the visual–perceptual and visual–motor skills analyses.

2.3. Evaluation of VPS and VMS Using the TVPS Third Edition and VMI Sixth Edition Tests

The TVPS-3 [29] and VMI-6 [30] were administered and the raw scores were used to determine scaled scores, standard scores, percentiles, and perceptual ages. As is known from the literature, the TVPS-3 evaluates seven areas of visual analysis: visual discrimination, visual memory, spatial relationships, form constancy, sequential memory, figure–ground discrimination, and visual closure. Four groups of abilities emerge from the combination of these seven areas: (i) overall performance, which includes all seven areas; (ii) basic processes, which includes the first four areas; (iii) sequencing, which includes only sequential visual memory; and (iv) complex processes, which includes only the last two areas. The purpose of this research was to analyse all four groups of abilities in order to understand the general performance of our participants using standard scores. Only two of the three areas of the VMI-6 were analyzed, i.e., the General and Motor VMI, which are directly related to gross and fine hand motor coordination. The perceptual part of the VMI-6 was excluded, as it does not include handwriting during the evaluation. For statistical analysis and the purpose of this study, raw scores were then converted into scaled and standard scores.

2.4. Availability of Data and Materials

All data are personal and strictly confidential to each patient and cannot be shared; however, details about materials and methods can be found in the Appendix A. This research is part of our clinical research line of study as members of the National Research System.

3. Statistical Analysis

To detect statistically significant differences between the groups, non-parametric and parametric tests were performed using the SPSS Statistics Base 25.0 program. The normality of data distribution was checked with the Shapiro–Wilk (SW) test. The confidence level (CI) used in this study was 95%, with α = 0.05 . The Independent t-test was used when n = 20 and the normality of data distribution was confirmed by the SW test. The Mann–Whitney test was used when n < 20 and the normality of data distribution could not be confirmed by the SW test. The Mann–Whitney test is a test of both location and shape, as it can detect differences in shape and spread as well as differences in medians, and is an alternative to the t-test when the data are not normally distributed. Regression analysis was performed when the relationship between one dependent and more than two independent variables was analyzed. Pearson and Spearman Correlation tests were used based on the normality of data distribution and the number of participants on each group.

4. Results

4.1. Descriptive Statistics

A total of 40 patients were included in this study. Of this total, 14 were female (35%) and 26 were male (65%), with a mean age of 7.92 ± 1.71. Additionally, 29 patients had exophoria (72.5%) for at least one distance (mean 2.34 ± 2.33 and 8.83 ± 3.32 for distant and near, respectively), while 11 patients presented esophoria (27.5%) for least at one distance (mean 3.45 ± 0.9 and 9.27 ± 2.05 for distant and near, respectively).
Table 1 presents the demographic and descriptive statistic of all participants. The independent t-test was used to compare means between the two groups when n = 20 and the normal data distribution was confirmed by Shapiro–Wilk test. The Mann–Whitney test was used to analyze differences in the stereopsis and exophoria values, as data were not normally distributed and n < 20 for patients with exophoria in one of the groups.

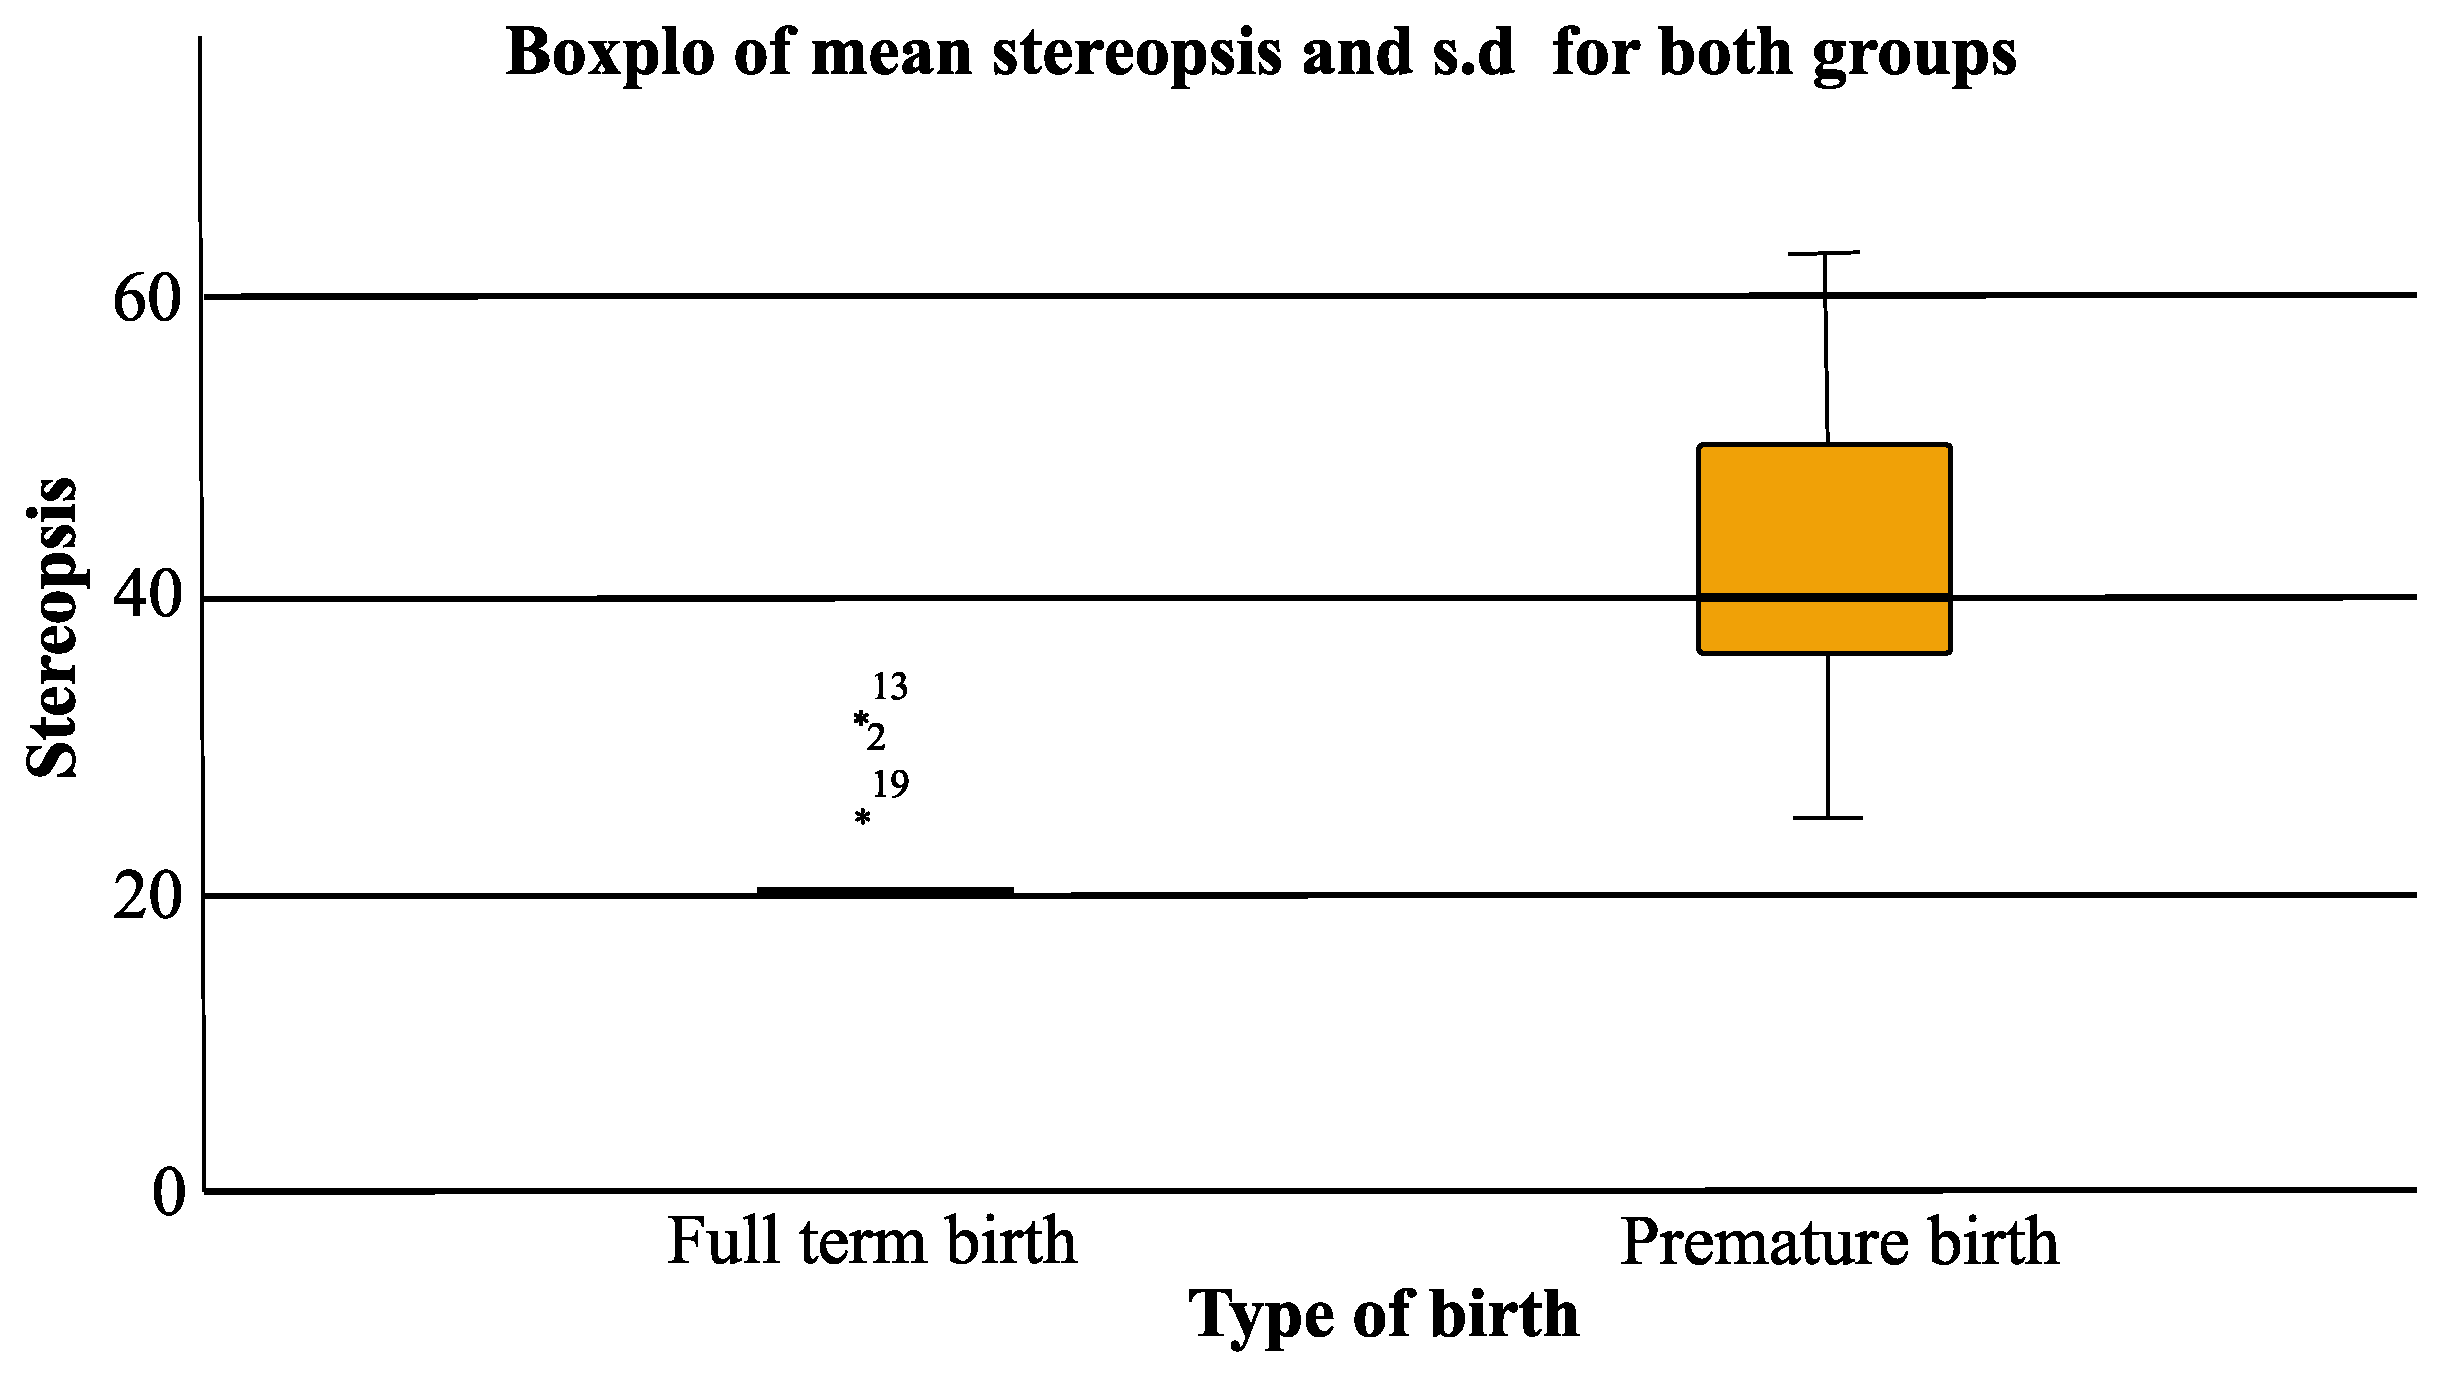
4.2. Visual Efficacy Findings

A significant finding was the presence of esophoria only in premature children, which leads us to hypothesize that prematurity is related to the esophoric state of the visual system. All full term birth children were exophoric for at least one distance. Likewise, the degree of stereopsis and visual acuity at distance and near were statistically different between the groups. Visual acuity at both distances was significantly higher in the healthy controls as compared to late preterm children, even when the latter were wearing the best prescription. The best prescription was the one which provided the best visual acuity at distance and near, flat fusion at both distances, and the highest stereopsis degree as measured with the Random Dot-2 Test.
Stereopsis is considered one of the most important variables related to the functionality of the visual system at cortical level and is illustrated in Figure 1. VA at distance and near, stereopsis, and phoria state were analyzed based on gender as well; no statistically significant data were obtained, indicating that gender was not related to the visual efficiency of these patients.

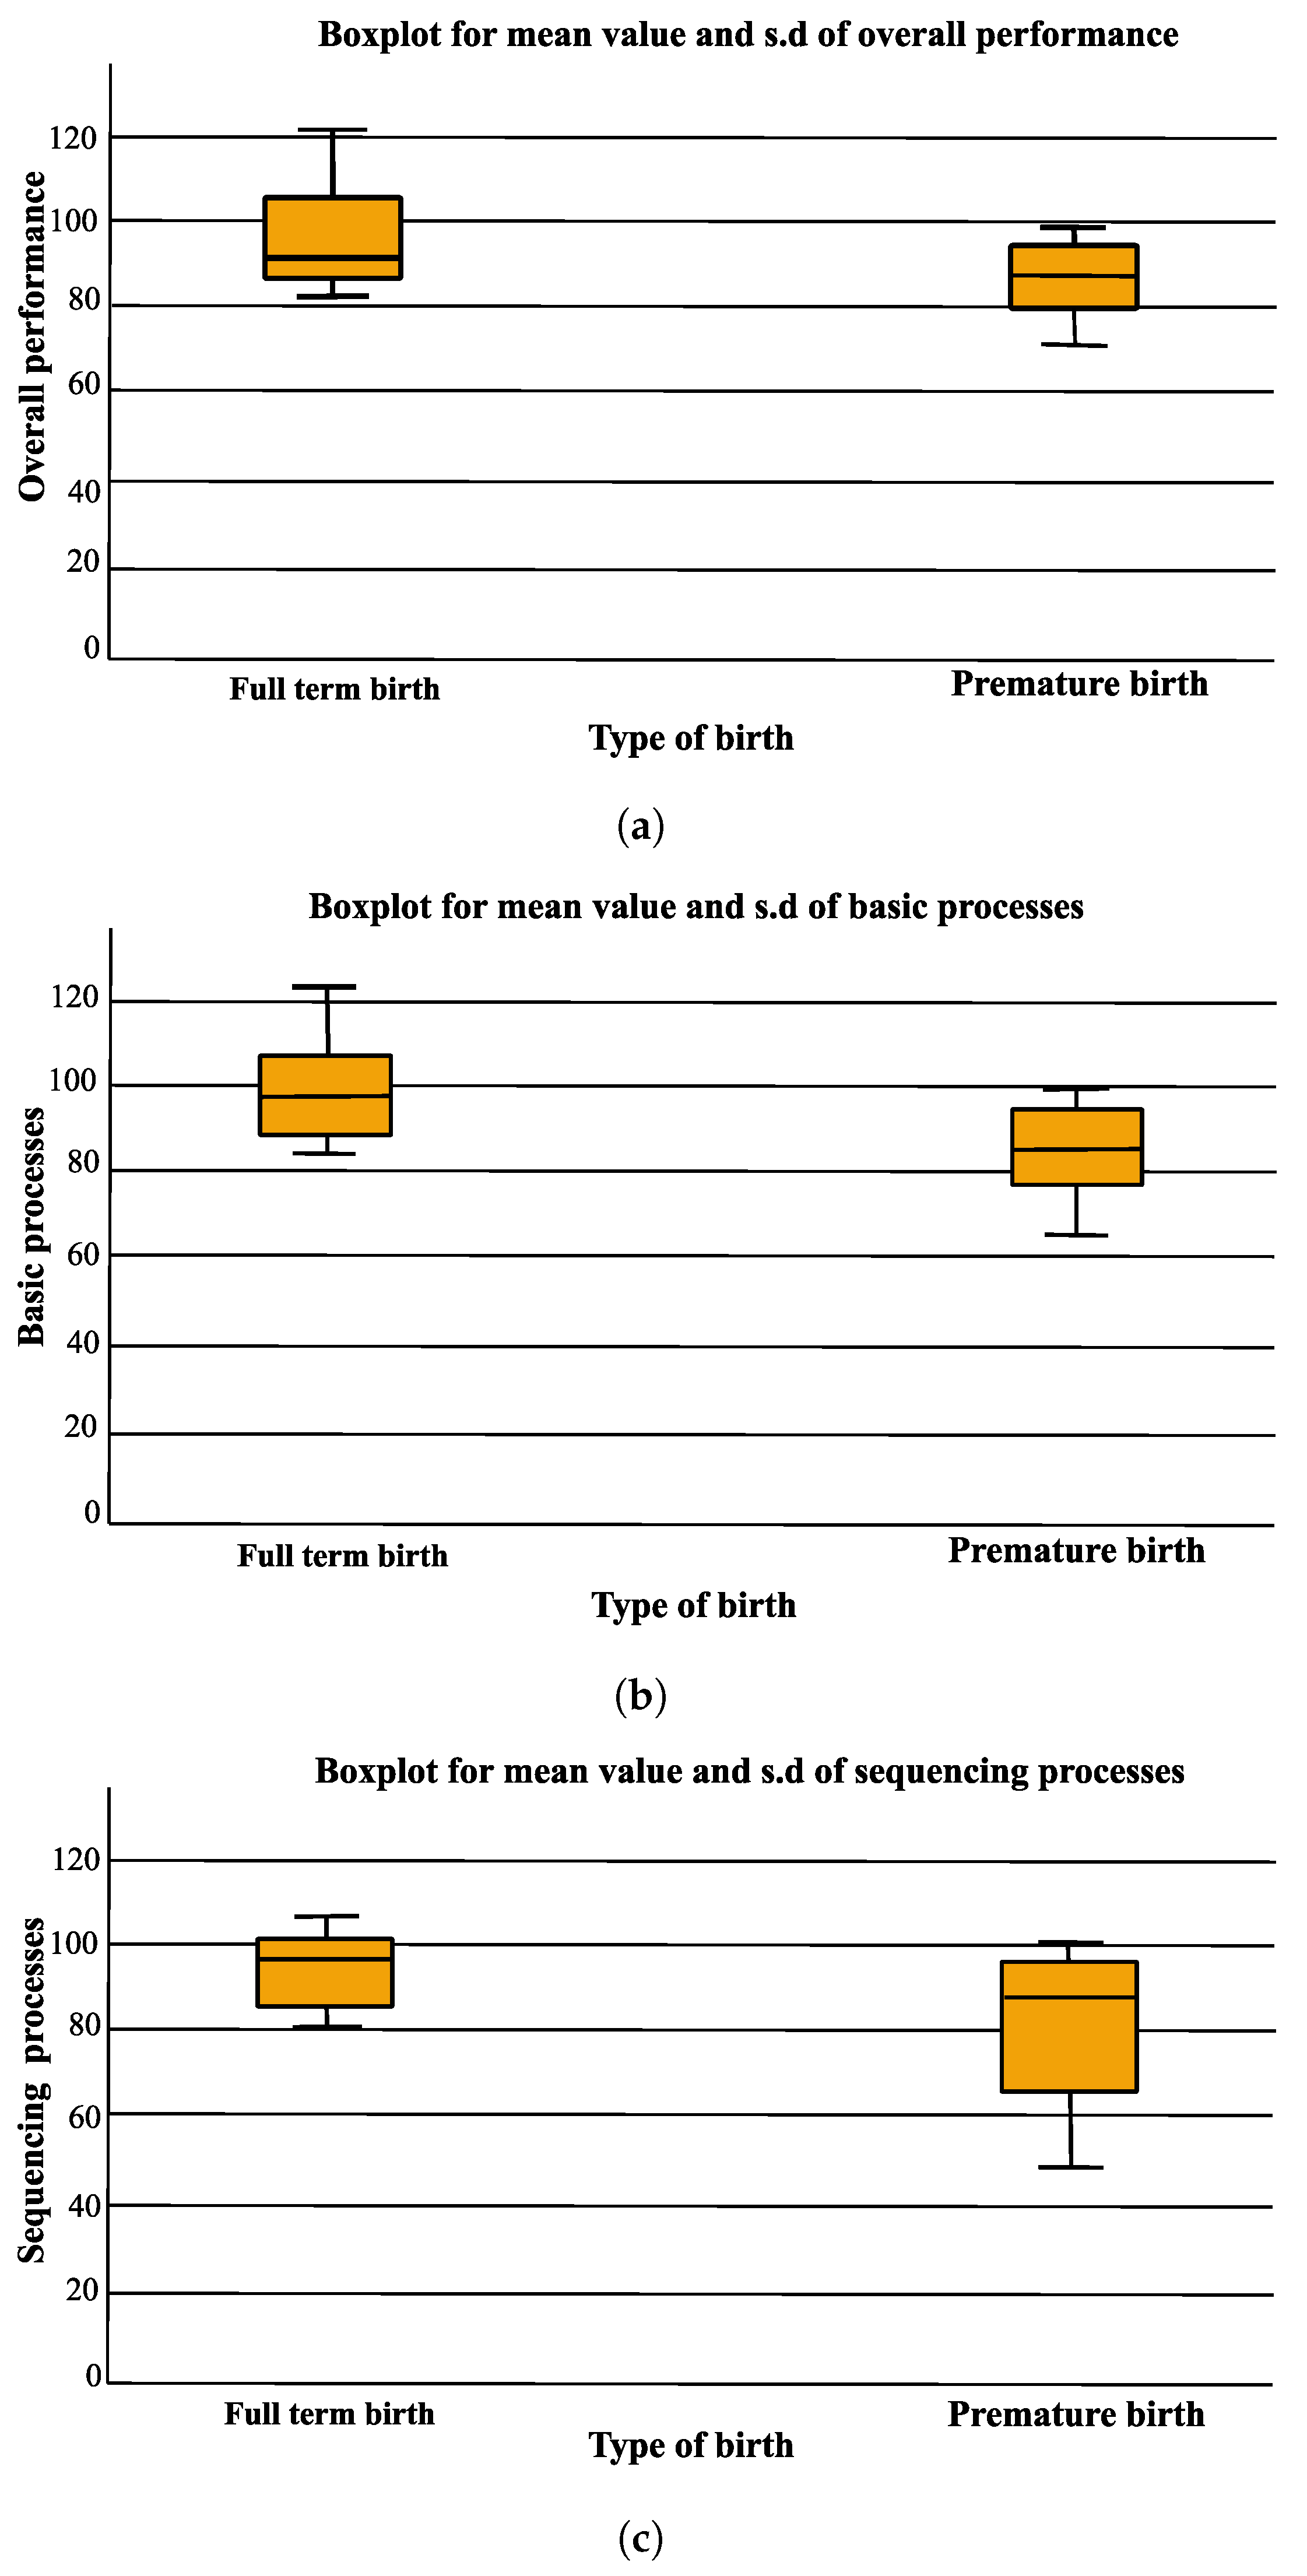
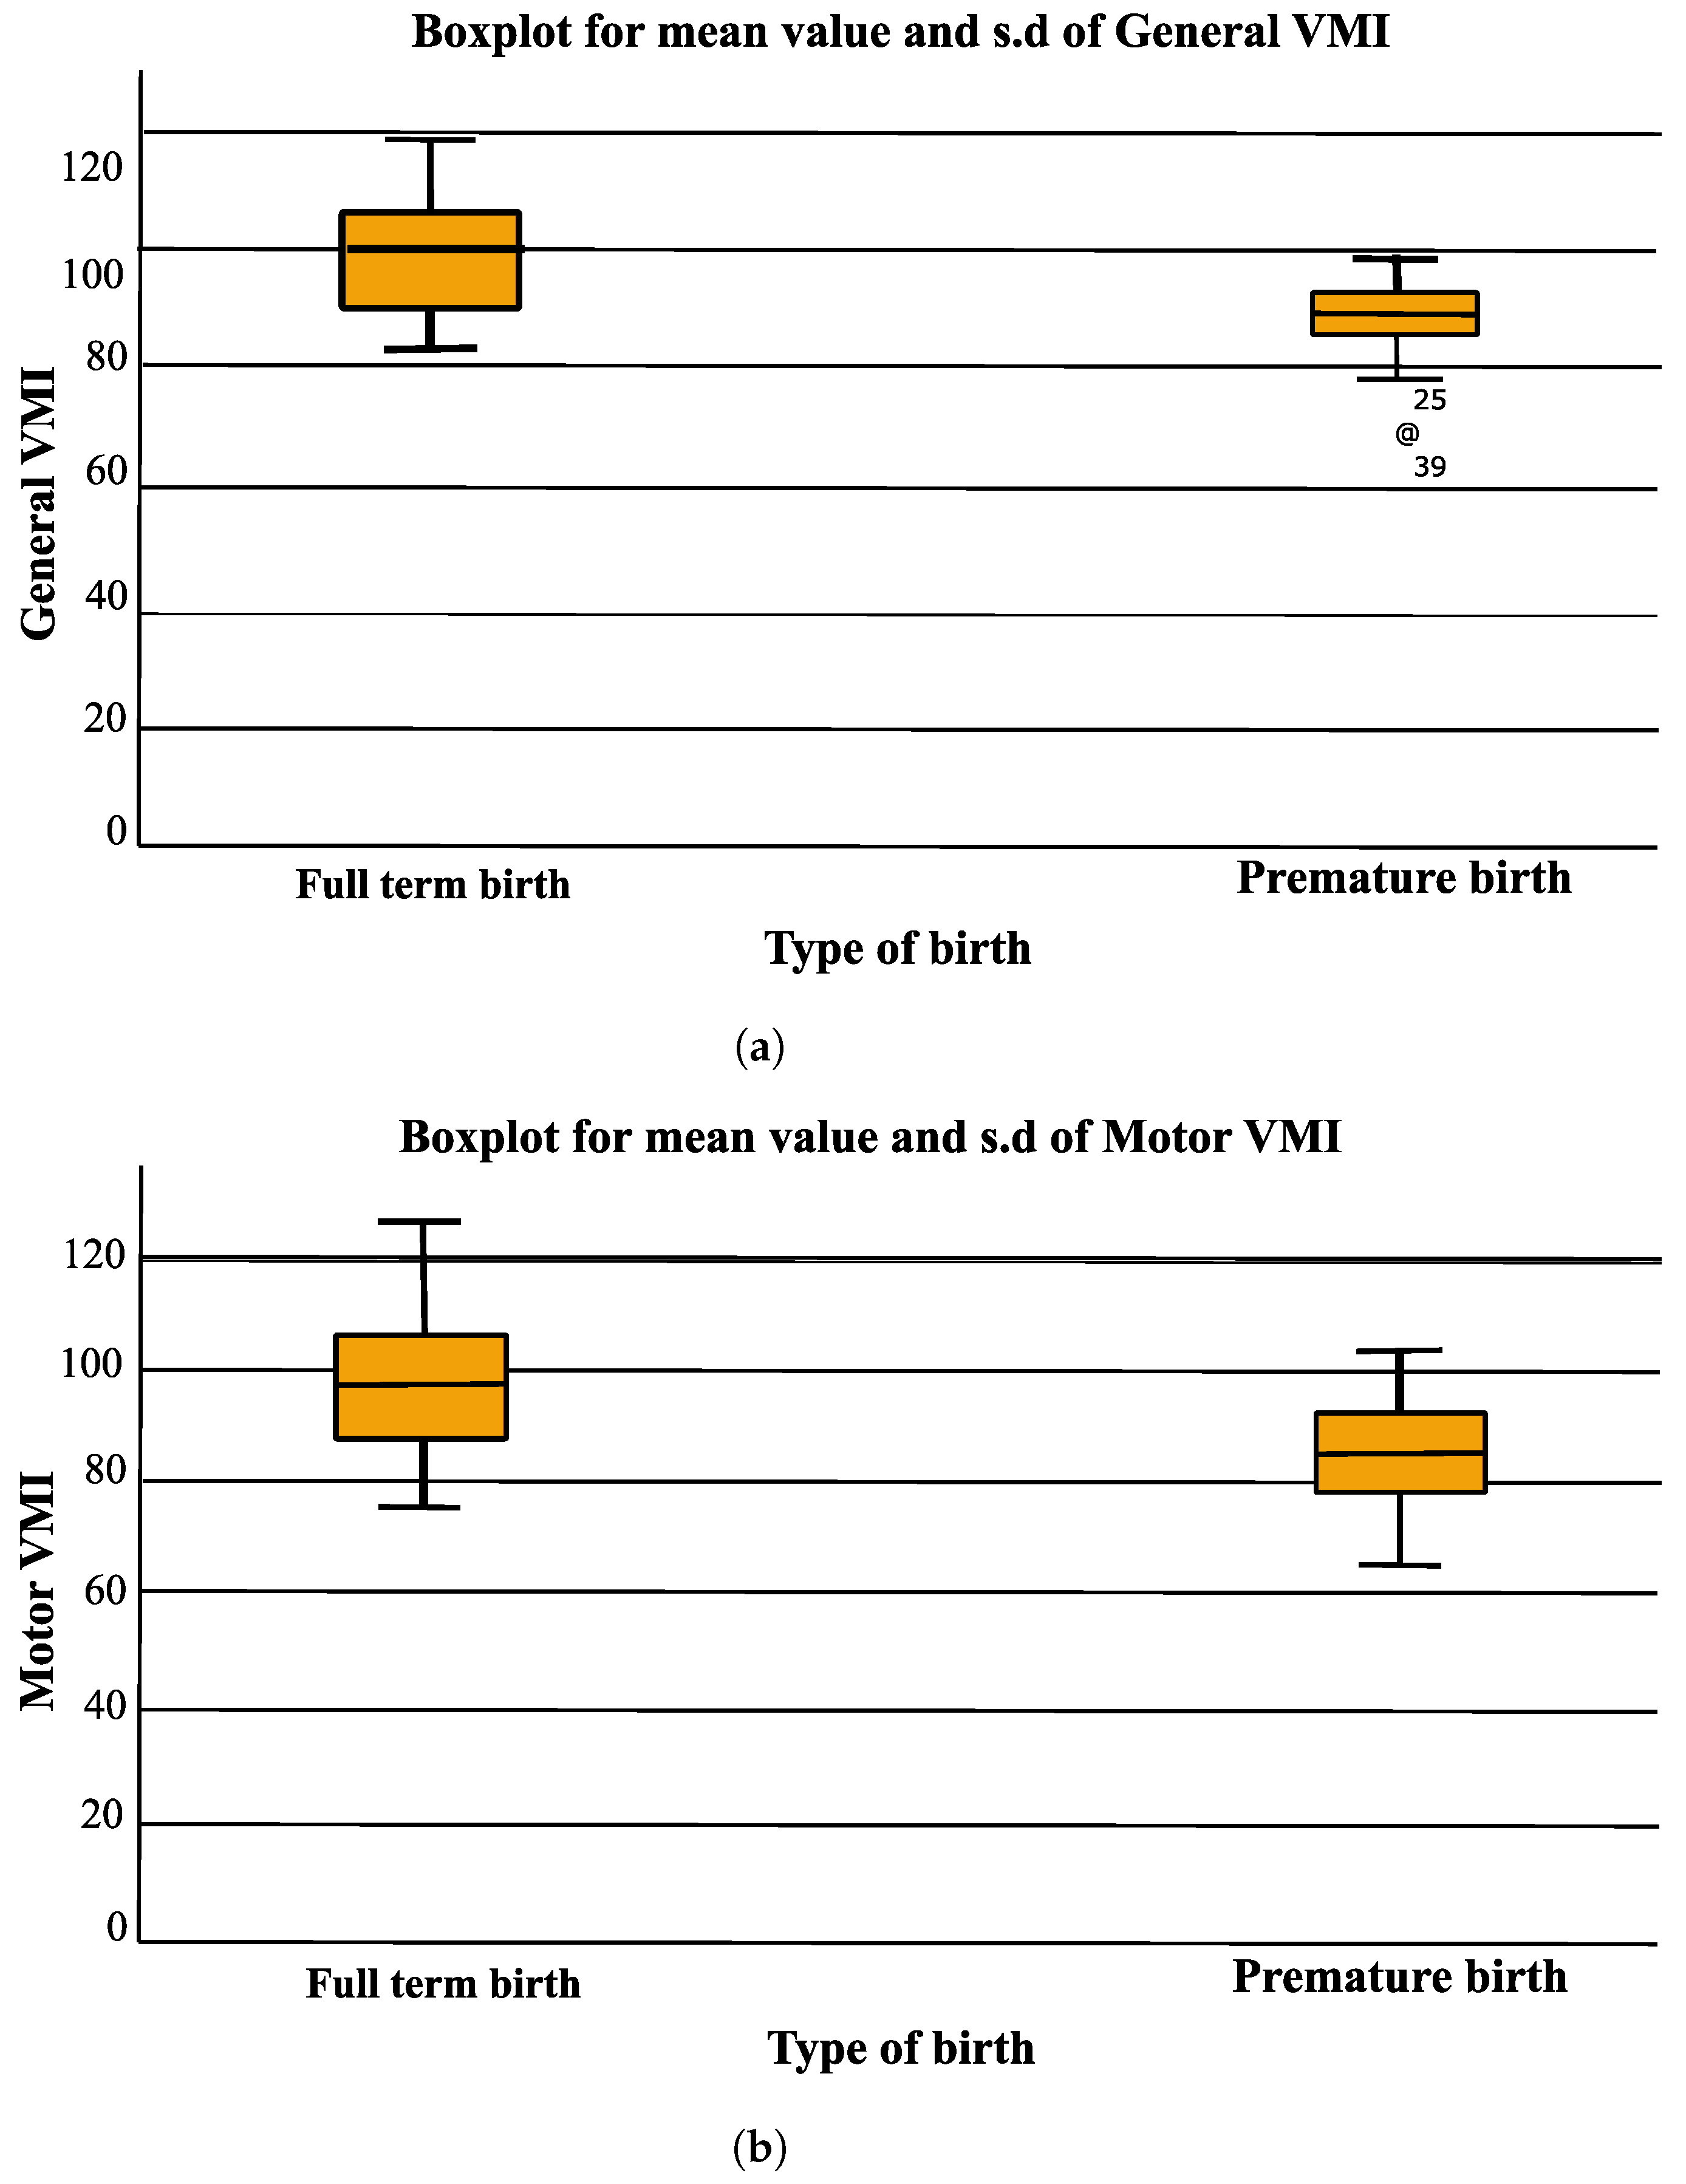
4.3. TVPS-3 and VMI-6 Findings

Next, visual–perceptual and visual–motor skills were evaluated using the TVPS-3 and VMI-6. Four categories of visual analysis were considered for the purpose of this study: overall performance, basic processes, sequencing, and complex processes. General and Motor VMI were used to define the visual–motor integration skills of the participants.
The Independent t-test was applied to statistically analyze differences between both groups (refer to Table 2). The Mann–Whitney test was only used to analyze the sequencing process between groups, as in this instance the data were not normally distributed.
As shown by Table 2, differences between the groups were statistically important for overall performance and for basic and sequencing processes. No differences were found for the complex processes of the visual analysis. Based on these results, only basic abilities of the visual system can be associated with prematurity. Regarding motor abilities, all values obtained from the motor integration analysis were significantly lower for preterm children when compared to children born full term. As derived from our results, a deficiency in the motor representation of the visual information is present. It can be hypothesized that if the entrance of information through the visual system is affected, its motor representation could be deficient as well. Figure 2a–c and Figure 3a,b illustrate the differences found in the visual–perceptual and visual–motor skills of both groups.

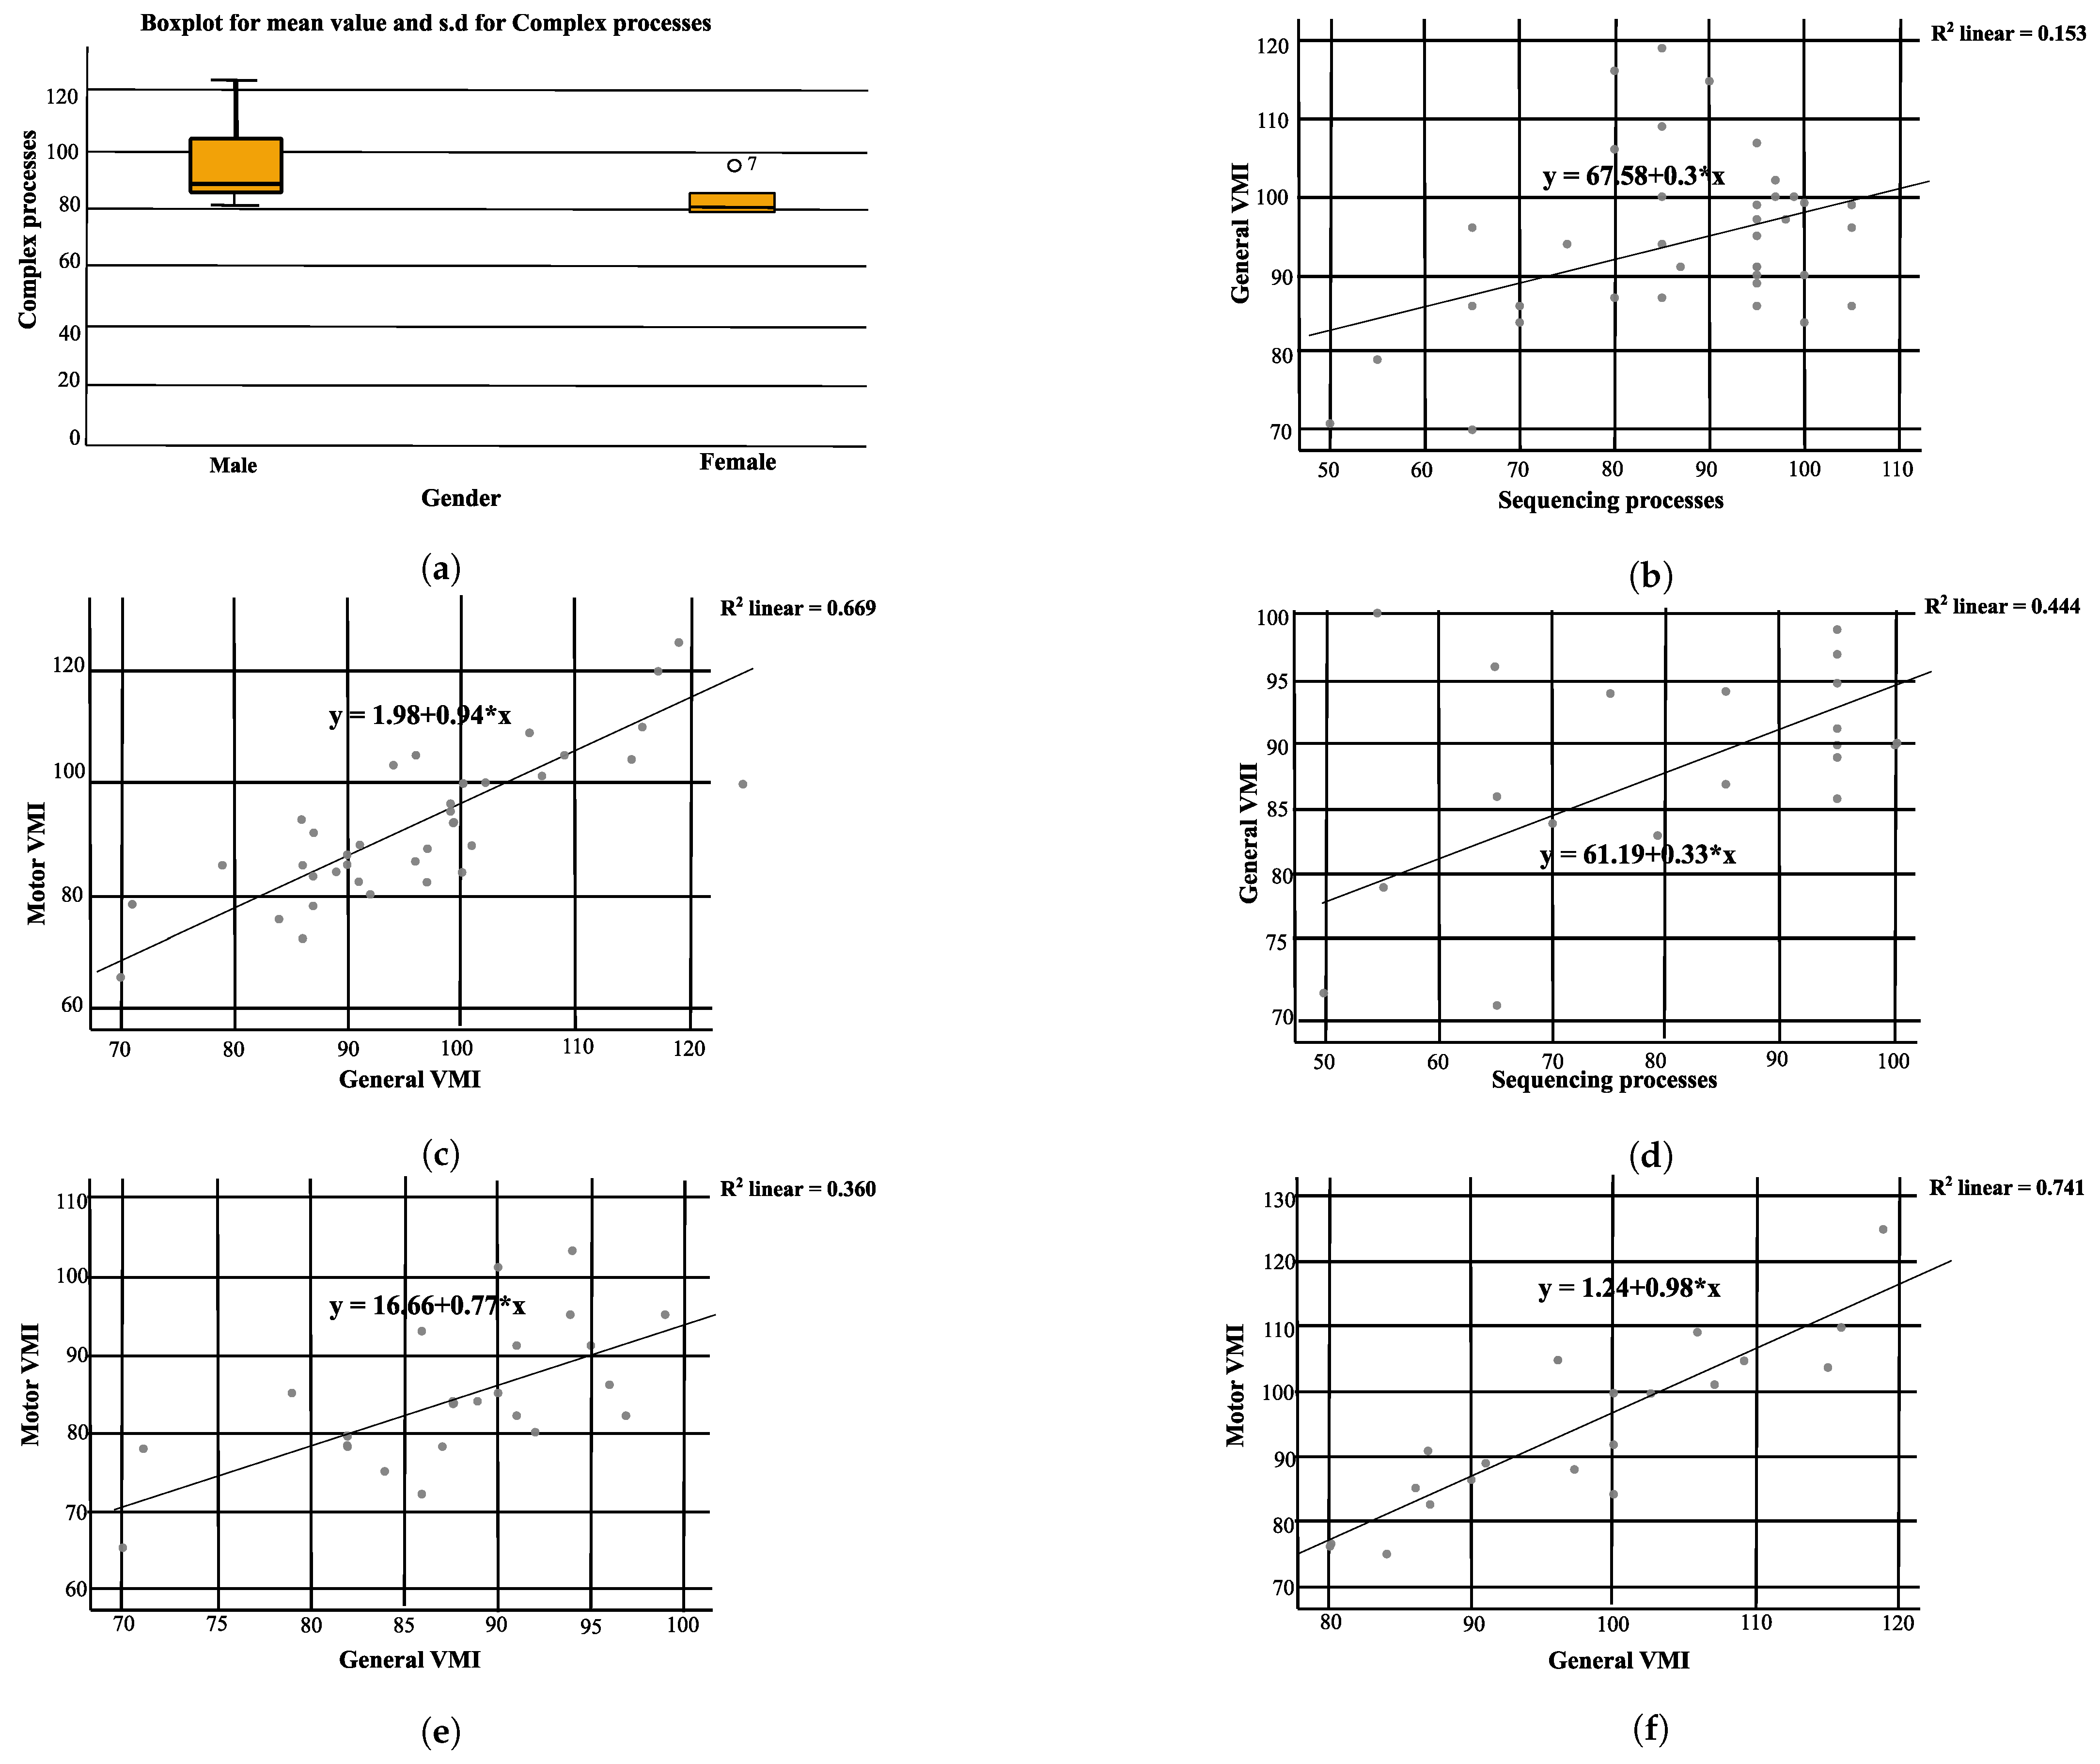
4.4. Findings Based on Gender

The visual–perceptual and visual–motor skills of all participants were then analyzed based on gender using the Mann–Whitney test. No statistically significant results were obtained. Gender did not affect the perceptual–motor abilities of the participants. The same analysis was performed to analyze data for each group separately. For preterm children, gender did not affect the TVPS and VMI results. This was not the case for children born at full term by natural birth, where p = 0.01 and Z = 2.56 for complex processes, as presented in Figure 4a. General and Motor VMI were not related to gender for this group.

4.5. Relationship between TVPS-3 and VMI-6 Results

In phase one, we analysed the VMI performance as a dependent variable of the TVPS performance for all participants. Our goal was to determine how perception impacts motor skills, considering that the image is seen first, and only after analyzing and processing it can it then be drawn and copied. Regression analysis was used for this purpose, with the four areas of the TVPS considered the independent variables (overall performance, basic, sequencing, and complex processes, respectively) and the General and Motor VMI the dependent variables. The only correlation established was between the sequencing processes and General VMI, where ( p = 0.02 , b = 0.47 and t = 2.43 ). To determine the strength of the correlation established between these variables, the Pearson Correlation test was used, where p = 0.01 , R 2 = 0.15 , and the correlation coefficient was 0.39 (see Figure 4b). Correlations between the General and Motor VMI were then checked by performing the same statistical analysis. A positive correlation was found between the General and Motor VMI performance, where p < 0.001 , R 2 = 0.67 , and the correlation coefficient was = 0.82 , which means that if a patient scores low on the General VMI, the same results can be expected for Motor VMI (see Figure 4c for more details). In phase two, data for each group were analysed separately. For children born at full term and by natural birth, no such relationships were found; however, for preterm children p = 0.05 for the sequencing process and General VMI performance, where b = 0.53 and t = 2.1 . To determine the strength of the relationship between these variables, the Spearman’s correlation test was performed, where p = 0.02 , R 2 = 0.44 , and correlation coefficient ρ = 0.52 . No other statistically significant relationships were found (refer to Figure 4d).
Regarding the General and Motor VMI correlation, we used the Pearson Correlation test. Positive correlations were found for both groups. For preterm children born by Caesarian section, p = 0.005 , R 2 = 0.36 , and the correlation coefficient = 0.60 , as shown by Figure 4e. For children born at full term by natural birth, p < 0.001 , R 2 = 0.74 , and the correlation coefficient = 0.86 , as shown by Figure 4f.

5. Discussion

This is the first study in Mexico to evaluate, analyze, and compare visual efficacy, visual–perceptual skills, and visual–motor skills using the TVPS-3 and VMI-6. A total of 40 children, age 5 to 12 years, participated in this research, of whom 20 were late preterm children (34–36 weeks) with appropriate weight for gestational age born by Caesarian section and 20 were healthy controls born at full term by natural birth. Parametric and non-parametric tests were used for statistical analysis. The correlations between different parameters were checked in order to determine the interactions among them. The results showed that the visual acuity both at distance and near was significantly higher in healthy controls, which means that even in the absence of ROP or other visual deficiencies such as amblyopia and strabismus late preterm children do not reach the same quantity of vision as healthy controls. Likewise, the degree of stereopsis was significantly lower and with more heterogeneity among values in late preterm children, though no relationship could be established between these two variables. Participants obtained results ranging between 40 and 20 s of arc. Depending on the test used to measure the degree of stereopsis, data ranging from 40 and 12.5 s of arc are considered normal. However, stereopsis refers to the appreciation of depth based on binocular disparity, as these are interrelated and affect each other. Knowing that vision is a cortical process, the obtained results point to the impact of the complete neurological growth of the brain on the visual efficacy of individuals, with stronger binocularity representing a stronger connection between both occipital areas. Our results are in concordance with those of previous studies [13,26], with the only difference being that late preterm children (34–36 weeks) born by Caesarian section were compared to healthy controls born by natural birth. Another interesting result was the phoria state of participants. While all HCs presented XF for at least one distance, 11 preterm children had EF (27.5%). The normal phoria state in human beings is that of orthophoria at distance and 4–6 dpt of XF at near [35]. On the other hand, the esophoric state could indicate a bigger cortical imbalance reflected in the visual system. These results show that the imbalance in the development of the central nervous system cannot be compensated by the brain, and is reflected in the visual efficacy of preterm children. The TVPS-3 was used to evaluate, analyze, and compare results between children born at full term by natural birth and late preterm children born by Caesarian section. Our statistical analysis found significant differences in three of the four analyzed areas, namely, overall performance, basic processes, and sequencing processes; values for complex processes were similar in both groups.
The obtained results indicate that basic visual skills such as discrimination, visual memory, spatial relationship, and form constancy, which make up the basic visual performance of a child, are the most affected in late preterm children, while complex skills such as figure–ground discrimination and visual closure are similar in both groups. In previous studies, visual abilities were analyzed individually [26] and neuropsychological tests were used [13], obtaining similar results to ours; on this basis, it can be hypothesized that the first visual analysis of the information related to the occipital cortex and associated areas is the most affected in preterm children. Analysis of the information related to the prefrontal areas of the brain, maintain better performance. This kind of information could help visual health professionals during the treatment process of patients with perceptual–motor difficulties, where professionals must ask whether treatment should be directed bottom-up or top-down. For HCs, complex process values were related to gender. Even though boys scored higher than girls, more heterogeneity in the obtained results was observed. Previous research has found structural and functional gender differences in the human brain [36]. Boys are better at visual–space perception, mental rotation, and manual skills, while girls perform better at memory tasks, writing, and reading [37].
In our previous study [21], similar performance differences between boys and girls with strabismus and amblyopia were found. Analogous results should have been obtained in preterm children considering changes in the cortical network presented in both groups. However, our results suggest differences in cortical organization and performance. Positive correlations were found between sequencing processes and General VMI for all participants, as well as between sequencing processes and General VMI for preterm children. Sequencing processes are part of the executive functions (EF) of the brain, and previous studies have shown that EF and manual dexterity are interrelated [38]. This is an interesting result, as it relates the sensory entrance of visual information with its motor output. The visual system captures an image, then the brain processes it, and finally it can be reproduced manually. As optometrists, we observe our patients during evaluations. When a child performs higher on sequencing processes, we can predict analogous results on the General VMI (copying of images). Therefore, in our therapy sessions we should introduce working memory skills in order to help improve visual–motor abilities. Statistically significant differences between groups were found for the General and Motor VMI performance as well. HCs scored higher than late preterm children in both areas of the visual integration motor analysis, as seen in previous papers [13,26]. These results may indicate a deficiency in the motor representation of visual information. As a result, when the entrance of information through the visual system is affected, its motor representation follows the same path. Positive correlations were found between the General and Motor VMI performance for both groups as well. Based on these results, evaluators should expect that a specific scoring in General VMI will be reflected on the Motor VMI part. Drawing, copying, and writing abilities have previously been associated with poor visual–motor skills in children [39], which should lead visual health professionals to evaluate these areas before the learning process of a child begins in order to prepare them for this major step. The small population size could be a limitation of the study; however, it should be considered that the inclusion and exclusion criteria had a specific function, namely, to find late preterm children with no neurodevelopment disorders. This pure sample can help to clarify the differences in brain response to visual stimuli between the two groups.
The results obtained with late preterm children show that they present clinically relevant developmental delays in motor and perceptual abilities, as is seen in very preterm and low weight children [13,26]. Taking into consideration that the brain development during last weeks of gestation involves major changes, in preterm children a delay in the functionality of motor and/or sensory modality is expected [27]. The level of dysfunction and complications depend on the gestational age, followed by a general development which could be different from that of a full-term birth child [40]. Moreover, recent studies on Caesarian delivery suggest that the impact it may have on the brain development of newborn and infants could be transient, as it is not observed in children aged 5 and older [33]. Having access to this information, no distinction should be made when analyzing preterm children. As seen in this research, late preterm births can be followed by imbalances in the visual efficacy and the perceptual–motor abilities of the child. Early evaluation for detection and treatment is necessary in order to help these children pass through predetermined milestones and reach the same level of development as their peers.

6. Conclusions

This research evaluated, analyzed, and compared the visual efficacy, visual–perceptual skills, and visual–motor skills of 20 late preterm children (34–36 weeks) without ROP and of appropriate weight for gestational age born by Caesarian section with 20 healthy control children age 5 to 12 years born at full term by natural birth; all participants were from Querétaro, México. Parametric and non-parametric tests were used for statistical analysis. The correlations between parameters were chercked to determine the interaction among variables. Visual performance was measured through visual acuity and the phoria state both at distance and near and the degree of stereopsis at near. Visual–perceptual skills were defined by four groups of abilities: overall performance and basic, sequencing, and complex processes. Visual–motor skills were evaluated using the General and Motor VMI, which are directly related to the fine motor skills and are important for the writing process. Statistically significant differences were found in visual acuity at distance and near ( p < 0.001 ), stereopsis ( p < 0.001 ), and the amount of exophoria at far ( p = 0.01 ), where healthy controls obtained higher values than late preterm children. Additionally, all HCs had exophoria for least at one distance, while esophoria was a characteristic of late preterm children. The TVPS Third Edition was used to analyze the visual–perceptual skills of participants, with HCs scoring higher in three of the four evaluated areas: overall performance ( p = 0.006 ), basic processes ( p = 0.001 ), and sequencing processes ( p = 0.02 ). Similar performance between the two groups was obtained for complex processes. The VMI Sixth Edition was used to evaluate the visual–motor abilities of the participants, with HCs scoring higher than late preterm children in both the General and Motor VMI subsections ( p < 0.001 and 0.002 , respectively). Positive correlations were found between the General and Motor VMI for both groups, Sequencing and General VMI for all 40 participants, and Sequencing and General VMI for the preterm group. For HCs, complex process values were related to gender, with boys performing better than girls, though with more heterogeneity among values. To summarize, the sequencing process can have an impact on the motor representation of visual information, General and Motor VMI are interrelated, HC boys have better sequencing abilities than girls, and the visual system of HCs is better than that of preterm children.
This paper shows that late preterm children present visual efficacy difficulties and are at risk of delays in perceptual–motor abilities, as are all groups of preterm children. Early evaluation of visual efficacy, visual–perceptual skills, and visual–motor skills should be considered for accurate diagnosis and treatment in order to help these children improve their cognitive functioning.

Author Contributions

Conceptualization, D.I. and J.R.-R.; Methodology, J.D.M.S. and J.R.-R.; Software, D.I.; Validation, D.I. and J.D.M.S.; Formal analysis, J.R.-R.; Investigation, D.I.; Resources, J.R.-R. and J.D.M.S.; Data curation, D.I. and J.R.-R.; Writing—original draft preparation, review, and editing, D.I., J.R.-R. and J.D.M.S. All authors have read and agreed to the published version of the manuscript.

Funding

This paper did not receive any specific funding; it is a genuine and personal research initiative of the authors.

Institutional Review Board Statement

The study was conducted according to the guidelines of the Declaration of Helsinki.

Informed Consent Statement

Patients came to the Brain Vision and Learning Center accompanied by their parents to have a detailed evaluation of their visual efficacy and perceptual–motor skills. These evaluations were non-invasive and no experiments were conducted on patients. Each patient was identified by a code number, and no personal data were exposed. Parents were asked whether they were willing to help in data gathering and analysis to provide scientific knowledge about the visual system and visual processing information. Consent from parents was obtained before using the data from their child’s evaluation. The Consent Form is attached with the submission.

Data Availability Statement

The data presented in this study are available on request from the corresponding author. The data are not publicly available due to confidentiality.

Acknowledgments

Danjela Ibrahimi; design, performance, analysis, and reporting of the work. Jorge Domingo Mendiola-Santibañez; analysis and reporting of the work. Juvenal Rodríguez-Reséndiz; analysis and reporting of the work. M.D.I Carlos Villareal Sosa participated in the final grammatical review of the English language version.

Conflicts of Interest

The authors declare no conflict of interest.

Abbreviations

The following abbreviations are used in this manuscript:
HCshealthy controls
VAvisual acuity
ODoculus dexter
OIoculus sinister
CIconfidence level
TVPS-3Test of Visual–Perceptual Skills, 3rd Ed.
VMI-6Visual Motor-Integration Test of Beery, 6th Ed.
VPSvisual–perceptual skills
VMSvisual–motor skills
S-WShapiro–Wilk test
XFexophoria
EFesophoria
ROPretinopathy of prematurity

Appendix A

Motor clinical testing: cover–uncover test using a translucent occluder was performed to detect any strabismus, which was an exclusion criterion. The alternating cover test was used to measure the phoria state of the participants and neutralize it with the Berens prism bar.
Additionally, the Maples Oculomotor Test (NSUCO) helped to evaluate saccades and pursuit movements in order to discard paresias or oculomotor dysfunctions which could compromise our results [41].
Sensorial clinical testing: distant and near VA was measured using logMAR charts at distances of 3 m and 40 cm, respectively. A difference of 0.20 logMAR (BCVA) between the two eyes was defined as unilateral amblyopia, while a BCVA lower by <0.30 logMAR than that according to the developmental norm at a given age was considered bilateral amblyopia. Participants with amblyopia were excluded from the study [42].
The Random Dot test was used to evaluate depth perception using contour (local) and global stimuli to measure stereopsis. The test was applied only at close distances with polarized glasses over the optical correction of the patient. The test detects disparities ranging from gross to fine stereopsis (500–12.5 s of arc).

References

  1. Varga, P.; Berecz, B.; Gasparics, Á.; Dombi, Z.; Varga, Z.; Jeager, J.; Magyar, Z.; Rigó, J.; Joó, J.G.; Kornya, L. Morbidity and mortality trends in very–very low birth weight premature infants in light of recent changes in obstetric care. Eur. J. Obstet. Gynecol. Reprod. Biol. 2017, 211, 134–139. [Google Scholar] [CrossRef] [PubMed] [Green Version]
  2. Leung, M.P.; Thompson, B.; Black, J.; Dai, S.; Alsweiler, J.M. The effects of preterm birth on visual development. Clin. Exp. Optom. 2018, 101, 4–12. [Google Scholar] [CrossRef] [Green Version]
  3. Johnson, S.; Wolke, D.; Hennessy, E.; Marlow, N. Educational Outcomes in Extremely Preterm Children: Neuropsychological Correlates and Predictors of Attainment. Dev. Neuropsychol. 2011, 36, 74–95. [Google Scholar] [CrossRef] [PubMed] [Green Version]
  4. Marlow, N.; Hennessy, E.M.; Bracewell, M.A.; Wolke, D.; for the EPICure Study Group. Motor and Executive Function at 6 Years of Age After Extremely Preterm Birth. Pediatrics 2007, 120, 793–804. [Google Scholar] [CrossRef] [PubMed] [Green Version]
  5. de Kieviet, J.F.; van Elburg, R.M.; Lafeber, H.N.; Oosterlaan, J. Attention problems of very preterm children compared with age-matched term controls at school-age. J. Pediatr. 2012, 161, 824–829. [Google Scholar] [CrossRef] [PubMed]
  6. Ream, M.A.; Lehwald, L. Neurologic Consequences of Preterm Birth. Curr. Neurol. Neurosci. Rep. 2018, 18, 48. [Google Scholar] [CrossRef]
  7. Suter, P.; Harvey, L. Vision Rehabilitation: Multidisciplinary Care of the Patient Following Brain Injury; Taylor & Francis: Abingdon, UK, 2011. [Google Scholar]
  8. López-Almaral, B.S.; de la Fuente-Torres, M.A. Ophthalmic findings in patients between 2 and 7 years of age born prematurely. Rev. Mex. Oftalmol. 2011, 3, 130–135. [Google Scholar]
  9. Islas-Domínguez, L.P.; González-Torres, P.; Cruz-Díaz, J.; Verduzco-Gutiérrez, M. Morbidity and mortality of the late premature at The Neonatal Intensive Care Unit. Rev. Méd. Hosp. Gen. México 2013, 29, 76. [Google Scholar]
  10. McCormick, M.; Litt, J.; Smith, V.; Zupancic, J. Prematurity: An overview and public health implications. Annu. Rev. Public Health 2011, 32, 367–379. [Google Scholar] [CrossRef]
  11. Rose, P.D.; Albamonte, E.; Laganà, V.; Sivo, S.; Pisoni, S.; Gallini, F.; Serrao, F.; Tinelli, F.; Purpura, G.; Ometto, A.; et al. Perceptual-motor abilities in pre-school preterm children. Early Hum. Dev. 2013, 89, 809–814. [Google Scholar] [CrossRef] [Green Version]
  12. Nepomnyaschy, L.; Hegyi, T.; Ostfeld, B.M.; Reichman, N.E. Developmental outcomes of late-preterm infants at 2 and 4 years. Matern. Child Health J. 2012, 16, 1612–1624. [Google Scholar] [CrossRef] [PubMed]
  13. Dathe, A.K.; Jaekel, J.; Franzel, J.; Hoehn, T.; Felderhoff-Mueser, U.; Huening, B.M. Visual Perception, Fine Motor, and Visual-Motor Skills in Very Preterm and Term-Born Children before School Entry-Observational Cohort Study. Children 2020, 7, 276. [Google Scholar] [CrossRef] [PubMed]
  14. Lind, A.; Parkkola, R.; Laasonen, M.; Vorobyev, V.; Haataja, L.; PIPARI Study Group. Visual Perceptual Skills in Very Preterm Children: Developmental Course and Associations with Neural Activation. Pediatr. Neurol. 2020, 109, 72–78. [Google Scholar] [CrossRef]
  15. Salkind, N.J. Child Development; Macmillan Reference US: New York, NY, USA, 2002. [Google Scholar]
  16. Neu, J.; Rushing, J. Cesarean Versus Vaginal Delivery: Long-term Infant Outcomes and the Hygiene Hypothesis. Clin. Perinatol. 2011, 38, 321–331. [Google Scholar] [CrossRef] [Green Version]
  17. Chen, H.; Tan, D. Cesarean Section or Natural Childbirth? Cesarean Birth May Damage Your Health. Front. Psychol. 2019, 10, 351. [Google Scholar] [CrossRef]
  18. Crewther, D.; Crewther, S. A new model of strabismic amblyopia: Loss of spatial acuity due to increased temporal dispersion of geniculate X-cell afferents on to cortical neurons. Vis. Res. 2015, 114, 79–86. [Google Scholar] [CrossRef] [PubMed]
  19. Wang, T.; Li, Q.; Guo, M.; Peng, Y.; Li, Q.; Qin, W.; Yu, C. Abnormal functional connectivity density in children with anisometropic amblyopia at resting-state. Brain Res. 2014, 1563, 41–51. [Google Scholar] [CrossRef] [PubMed]
  20. Birch, E.; Kelly, K. Amblyopia and the whole child. Prog. Retin. Eye Res. 2023, 93, 101168. [Google Scholar] [CrossRef] [PubMed]
  21. Ibrahimi, D.; Mendiola-Santibañez, J.; Gkaros, A.P. Analysis of the potential impact of strabismus with and without amblyopia on visual-perceptual and visual-motor skills evaluated using TVPS-3 and VMI-6 tests [Análisis del impacto potencial del estrabismo con y sin ambliopía en las habilidades visuales-perceptuales y visuales-motoras evaluadas mediante las pruebas TVPS-3 y VMI-6]. J. Optom. 2021, 14, 166–175. [Google Scholar] [CrossRef]
  22. Ho, H.J.; Eun, S.J.; Min, L.S.; Seon, E.H.; Soo, P.M.; In, P.K. Hearing Impairments in Preterm Infants: Factors Associated with Discrepancies between Screening and Confirmatory Test Results. Neonatal. Med. 2020, 27, 126–132. [Google Scholar] [CrossRef]
  23. Pérez-Pereira, M.; Fernández, P.; Gómez-Taibo, M.L.; Resches, M. Language development of low risk preterm infants up to the age of 30 months. Early Hum. Dev. 2014, 90, 649–656. [Google Scholar] [CrossRef] [PubMed]
  24. Simms, V.; Gilmore, C.; Cragg, L.; Clayton, S.; Marlow, N.; Johnson, S. Nature and origins of mathematics difficulties in very preterm children: A different etiology than developmental dyscalculia. Pediatr. Res. 2015, 77, 389–395. [Google Scholar] [CrossRef] [PubMed]
  25. Harris, M.N.; Voigt, R.G.; Barbaresi, W.J.; Voge, G.A.; Killian, J.M.; Weaver, A.L.; Colby, C.E.; Carey, W.A.; Katusic, S.K. ADHD and learning disabilities in former late preterm infants: A population-based birth cohort. Pediatrics 2013, 132, e630–e636. [Google Scholar] [CrossRef] [Green Version]
  26. Perez-Roche, T.; Altemir, I.; Giménez, G.; Prieto, E.; González, I.; Peña-Segura, J.L.; Castillo, O.; Pueyo, V. Effect of prematurity and low birth weight in visual abilities and school performance. Res. Dev. Disabil. 2016, 59, 451–457. [Google Scholar] [CrossRef]
  27. Tsimis, M.E.; Abu Al-Hamayel, N.; Germaine, H.; Burd, I. Prematurity: Present and future. Minerva Ginecol. 2015, 67, 35–46. [Google Scholar] [PubMed]
  28. Carlson, A.; Rowe, E.; Curby, T. Disentangling fine motor skills relations to academic achievement: The relative contributions of visual-spatial integration and visual-motor coordination. J. Genet. Psychol. 2013, 174, 514–533. [Google Scholar] [CrossRef]
  29. Martin, N.A.; Gardner, M.F. Test of Visual Perceptual Skills, 3rd ed.; Academic Therapy Publications: Novato, CA, USA, 2006. [Google Scholar]
  30. Beery, K.E.; Buktenica, N.A.; Beery, N.A. Developmental Test of Visual-Motor Integration, Pearson, Sixth Edition. 2010. Available online: https://www.pearsonassessments.com/store/usassessments/en/Store/Professional-Assessments/Academic-Learning/Brief/Beery-Buktenica-Developmental-Test-of-Visual-Motor-Integration-%7C-Sixth-Edition/p/100000663.html (accessed on 10 February 2023).
  31. Van Garderen, D. Spatial Visualization, Visual Imagery, and Mathematical Problem Solving of Students With Varying Abilities. J. Learn. Disabil. 2006, 39, 496–506. [Google Scholar] [CrossRef] [PubMed]
  32. Press, L.J. Applied Concepts in Vision Therapy; Optometric Extension Program Foundation: Chicago, IL, USA, 2013. [Google Scholar]
  33. Deoni, S.C.; Adams, S.H.; Li, X.; Badger, T.M.; Pivik, R.T.; Glasier, C.M.; Ramakrishnaiah, R.H.; Rowell, A.C.; Ou, X. Cesarean Delivery Impacts Infant Brain Development. AJNR Am. J. Neuroradiol. 2018, 40, 169–177. [Google Scholar] [CrossRef] [Green Version]
  34. Yoo, S.G.; Cho, M.J.; Kim, U.S.; Baek, S.H. Cycloplegic Refraction in Hyperopic Children: Effectiveness of a 0.5% Tropicamide and 0.5% Phenylephrine Addition to 1% Cyclopentolate Regimen. Korean J. Ophthalmol. 2017, 31, 249–256. [Google Scholar] [CrossRef] [Green Version]
  35. Borsting, E. Clinical Management of Binocular Vision: Heterophoric, Accommodative, and Eye Movement Disorders, 4th ed.; Scheiman, M., Wick, B., Eds.; Wolters Kluwer: Philadelphia, PA, USA, 2014; Volume 91. [Google Scholar]
  36. Asano, K.; Taki, Y.; Hashizume, H.; Sassa, Y.; Thyreau, B.; Asano, M.; Takeuchi, H.; Kawashima, R. Healthy children show gender differences in correlations between nonverbal cognitive ability and brain activation during visual perception. Neurosci. Lett. 2014, 577, 66–71. [Google Scholar] [CrossRef]
  37. Keith, T.Z.; Reynolds, M.R.; Roberts, L.G.; Winter, A.L.; Austin, C.A. Sex Differences in Latent Cognitive Abilities Ages 5 to 17: Evidence from the Differential Ability Scales–Second Edition. Intelligence 2011, 39, 389–404. [Google Scholar] [CrossRef]
  38. Maurer, M.N.; Roebers, C.M. New insights into visual-motor integration exploring process measures during copying shapes. Psychol. Sport Exerc. 2021, 55, 101954. [Google Scholar] [CrossRef]
  39. Cameron, C.E.; Cottone, E.A.; Murrah, W.M.; Grissmer, D.W. How Are Motor Skills Linked to Children’s School Performance and Academic Achievement? Child Dev. Perspect. 2016, 10, 93–98. [Google Scholar] [CrossRef]
  40. Martha, E.; Arterberry, M.H.B. Development in Infancy, 6th ed.; Routledge: New York, NY, USA, 2023; p. 520. [Google Scholar]
  41. Maples, W.C. Northeastern state university college of optometry’s oculomotor norms. J. Behav. Optom. 1992, 3, 143–150. [Google Scholar]
  42. Tailor, V.; Bossi, M.; Greenwood, J.A.; Dahlmann-Noor, A. Childhood amblyopia: Current management and new trends. Br. Med. Bull. 2016, 119, 75–86. [Google Scholar] [CrossRef] [PubMed] [Green Version]
Figure 1. Mean values and standard deviations of stereopsis degree for both groups. Preterm children had lower stereopsis than children born at full term, where its value was twice that of the other except for three patients, as shown by the boxplots.
Technologies 11 00053 g001
Figure 2. (a) Results for overall performance of full term and preterm children. As can be seen from the image, participants born at full term obtain higher results than children born preterm. Additionally, based on the standard deviation, it can be seen that only children born full term obtain values above the average for their age (>100). (b) Results for basic processes related to the type of birth. Again, children born full term score higher than those born preterm. Likewise, based on the standard deviation, it can be seen that children born at full term achieve values above the average for their age (>100). (c) Sequencing processes as a dependent variable of birth type. The boxplots indicate that children born at full term perform better than those born preterm. Based on the standard deviation, it can be seen that children born at full term score higher than the average for their age (>100), whereas those born preterm obtain values even lower than the standard deviation of −3.
Technologies 11 00053 g002
Figure 3. (a) The General VMI illustrates that the first group performed better than the second. Motor abilities in children born at full term can exceed the average values for their age (>100), whereas preterm children stay inside these values. (b) The Motor VMI shows that the performance of the first group is higher than that of the second. Even though values >100 are achieved in both groups, the highest values are obtained by children born at full term, while the lowest ones are always obtained by children born preterm.
Technologies 11 00053 g003
Figure 4. (a) Mean values and standard deviations of the results obtained for complex processes as defined by gender for children born at full term and natural birth. It can be seen that the male group scores higher than the female group, while the standard deviation reflects more heterogeneity among the obtained values in the male group. (b) The positive relationship between the sequencing processes of the TVPS-3 and the General VMI response of all participants, as defined using the Pearson Correlation test. As can be seen from the image, good performance on the sequencing subsection is followed by good performance on the General VMI. (c) The positive correlation between General and Motor VMI of all participants, as defined by the Pearson Correlation test; as shown by the linear correlation, the performance of the Motor VMI can be predicted by the performance on the General VMI. (d) The positive (though weak) relationship between the sequencing processes and the General VMI results for preterm children born by Caesarian section. The higher scores for sequencing processes could be related to better results on the General VMI section. (e) General and Motor VMI correlation in preterm children born by Caesarian section, as defined by Pearson Correlation. An important correlation is observed between these two variables, and can inform the results to be expected on the Motor VMI section. (f) General and Motor VMI correlation for children born at full term by natural birth, as measured by the Pearson Correlation test. A stronger relationship between these two variables can be observed, which fulfills the expectations.
Technologies 11 00053 g004
Table 1. Demographic and descriptive statistics of children born at full term by natural birth and preterm children born by Caesarean section.
ParametersFull Term BirthPreterm Birthp (p-Value)t-Value/Z-Value
Mean ± s.dMean ± s.d
Age 7.7 ± 1.7 8.1 ± 1.73 0.4 t = 0.85
Male/Female 14 / 6 12 / 8 N/AN/A
VA OD/OS at far 0.05 ± 0.05 0.15 ± 0.06 <0.001 t = 5.6
0.06 ± 0.05 0.16 ± 0.06 <0.001 t = 5.4
VA OD/OS at near 0.05 ± 0.05 0.19 ± 0.06 <0.001 t = 7.6
0.06 ± 0.05 0.2 ± 0.07 <0.001 t = 7.1
Stereopsis 21.45 ± 3.78 42.90 ± 11.97 <0.001Z = 5.4
XF at far 1.70 ± 2.27 3.78 ± 1.86 0.01 Z = 2.5
XF at near 8.10 ± 3.7 10.44 ± 1.33 0.09 Z = 1.7
EF at nearN/A 9.27 ± 2.05 N/AN/A
Independent t-test (t-value) and Mann–Whitney test (Z-value) comparing the two groups ( p < 0.05 represents statistically significant differences). Data shown as mean standard deviation or n.
Table 2. Visual–perceptual and visual–motor abilities of children born at full term by natural birth and children born preterm by Caesarean section, as evaluated through the TVPS-3 and VMI-6.
ParametersFull Term BirthPreterm Birthp (p-Value)t-Value/Z-Value
Mean ± s.dMean ± s.d
Overall    Performance 96.9 ± 11.97 87.6 ± 8.05 0.006 t = 2.9
Basic       Processes 98.85 ± 12.25 85.95 ± 9.8 0.001 t = 3.7
Sequencing Processes 92.4 ± 8.99 81.5 ± 15.57 0.02 Z = 2.4
Complex Processes 92.25 ± 11.76 87.35 ± 9.88 0.16 t = 1.4
General VMI 99.5 ± 10.27 88.35 ± 7.78 <0.001 t = 3.9
Motor VMI 96.25 ± 11.69 84.65 ± 9.99 0.002 t = 3.4
Disclaimer/Publisher’s Note: The statements, opinions and data contained in all publications are solely those of the individual author(s) and contributor(s) and not of MDPI and/or the editor(s). MDPI and/or the editor(s) disclaim responsibility for any injury to people or property resulting from any ideas, methods, instructions or products referred to in the content.

