
PHB/PEG Nanofiber Mat Obtained by Electrospinning and Their Performances

 , , , and
Abstract
:1. Introduction
2. Materials and Methods
2.1. Materials
2.2. Sample Preparation (Fabrication of PHB/PEG Nanofiber Mat)
2.3. Characterization of PHB/PEG Nanofibers Mat
2.3.1. Morphology of Electrospun PHB Fibers
2.3.2. Fourier Transform Infrared Spectroscopy (FTIR)
2.3.3. Thermal Properties
2.3.4. XRD Analysis
2.3.5. The Porosity of the PHB/PEG Nanofiber Mat
2.3.6. Mechanical Properties
2.3.7. Water Contact Angle Measurement
3. Results
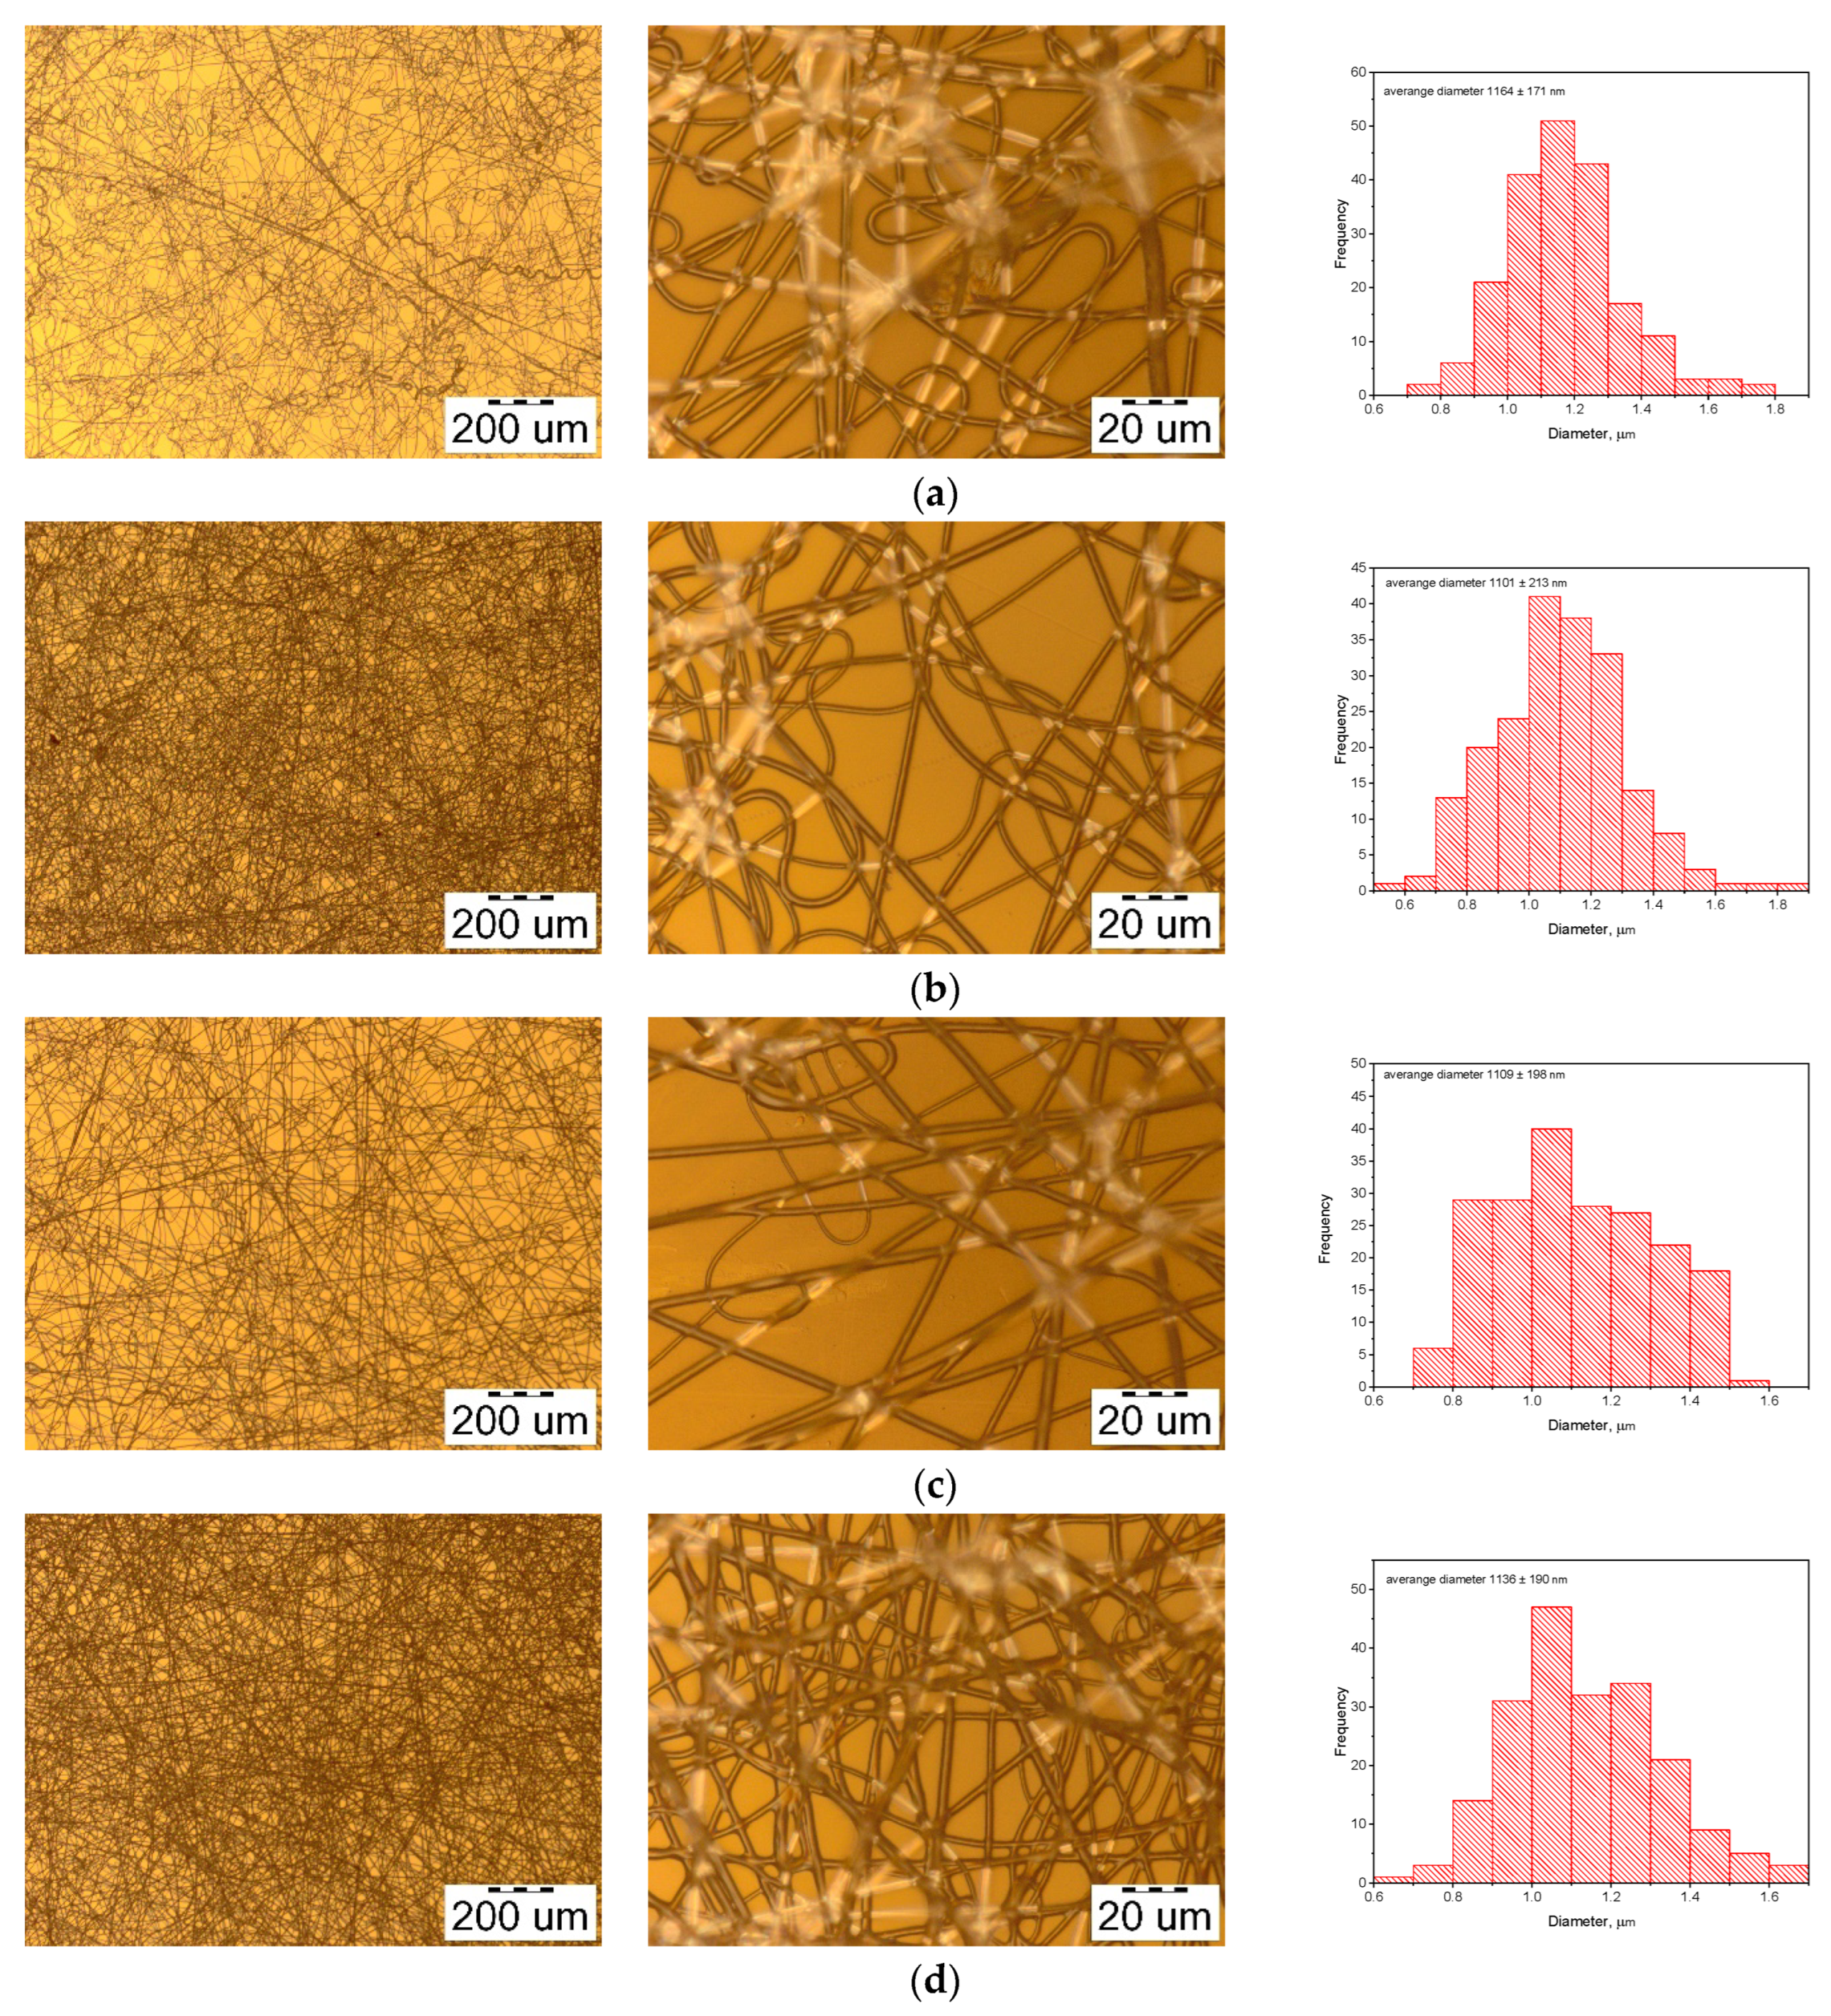
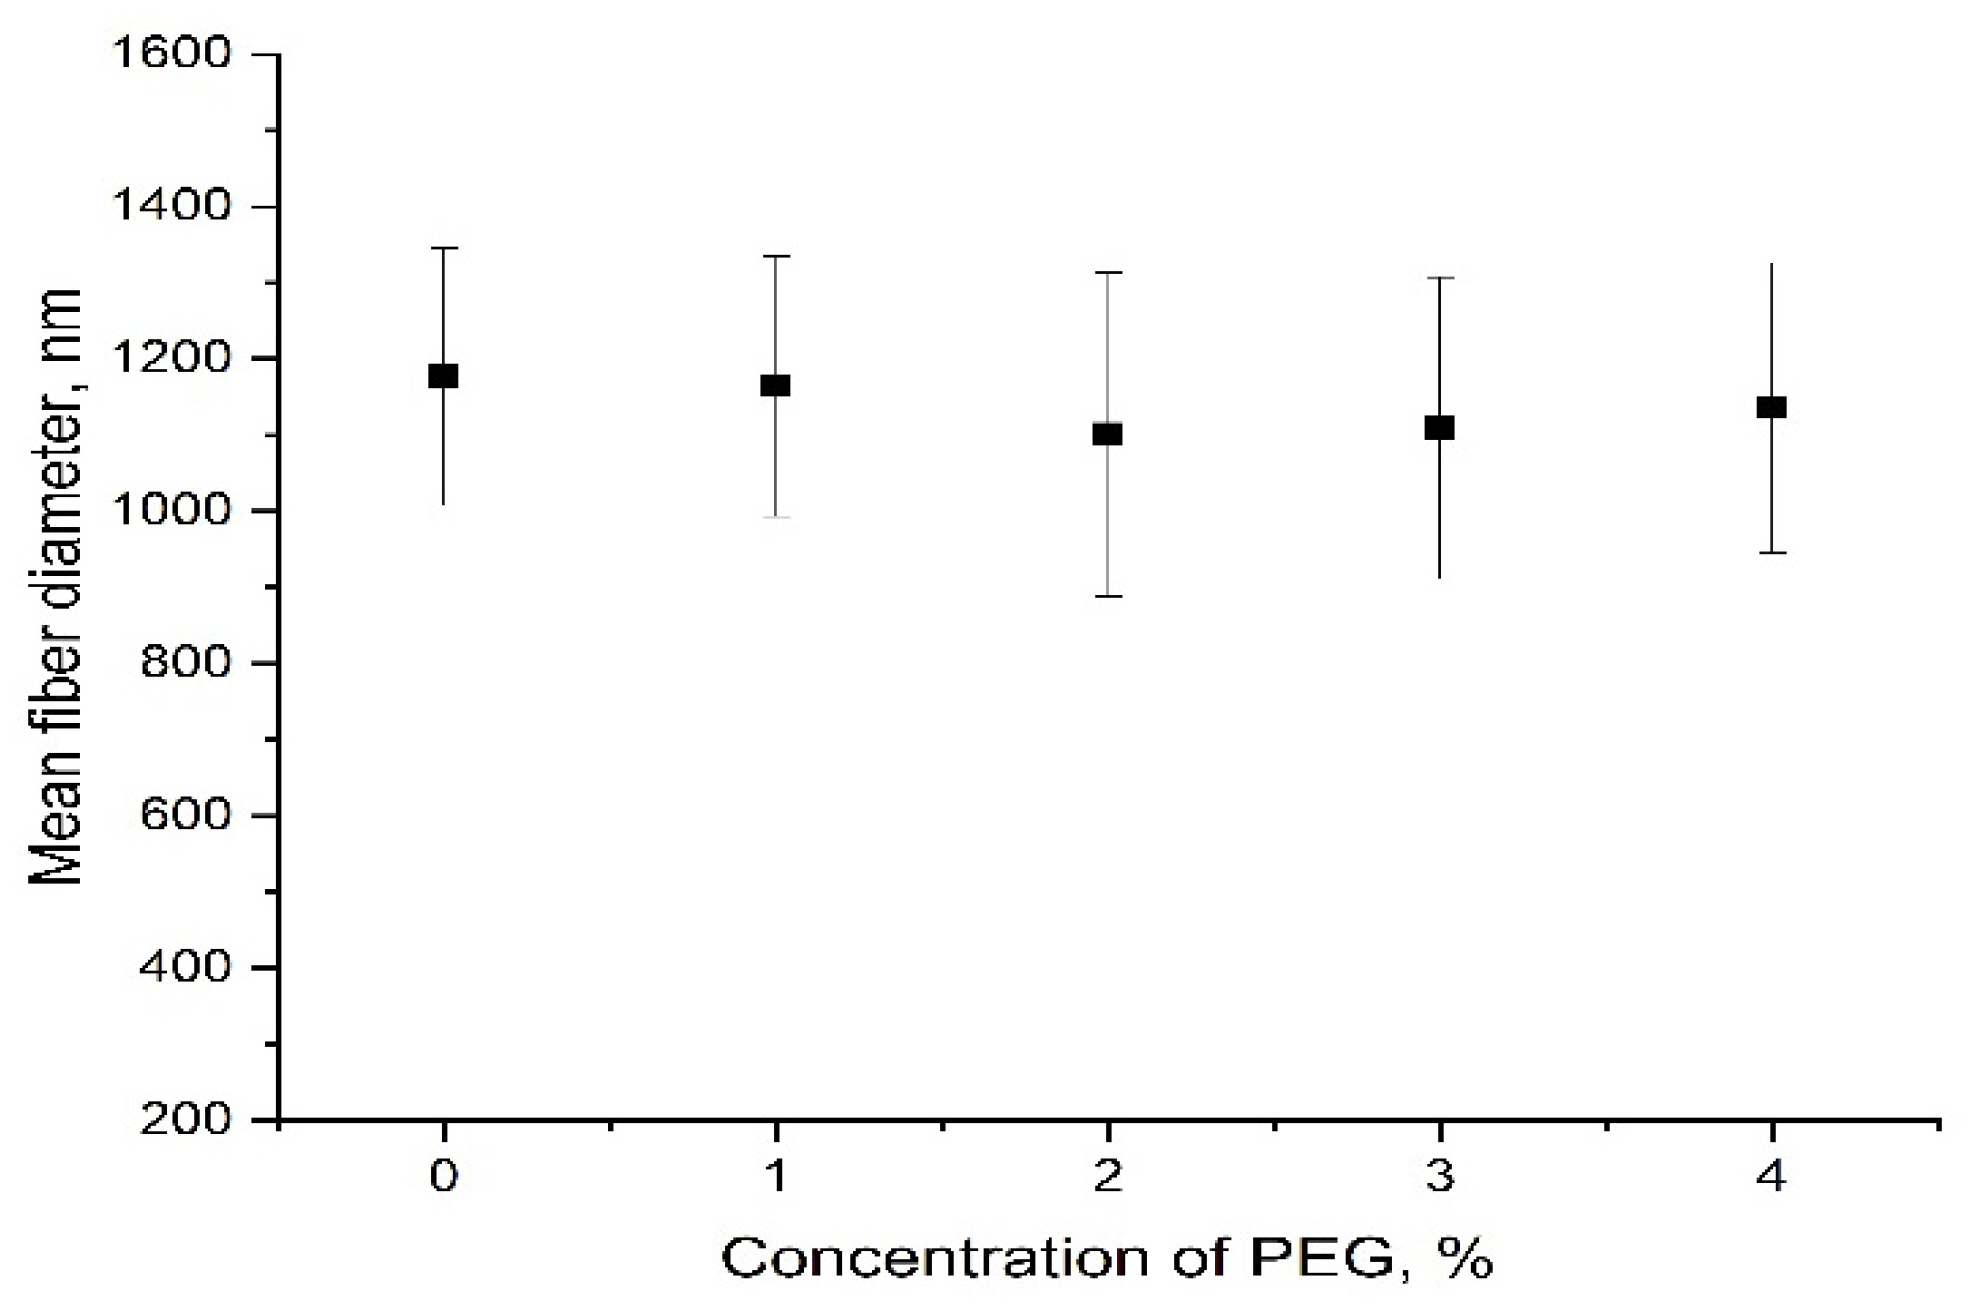
3.1. Morphology of Electrospun PHB Fibers
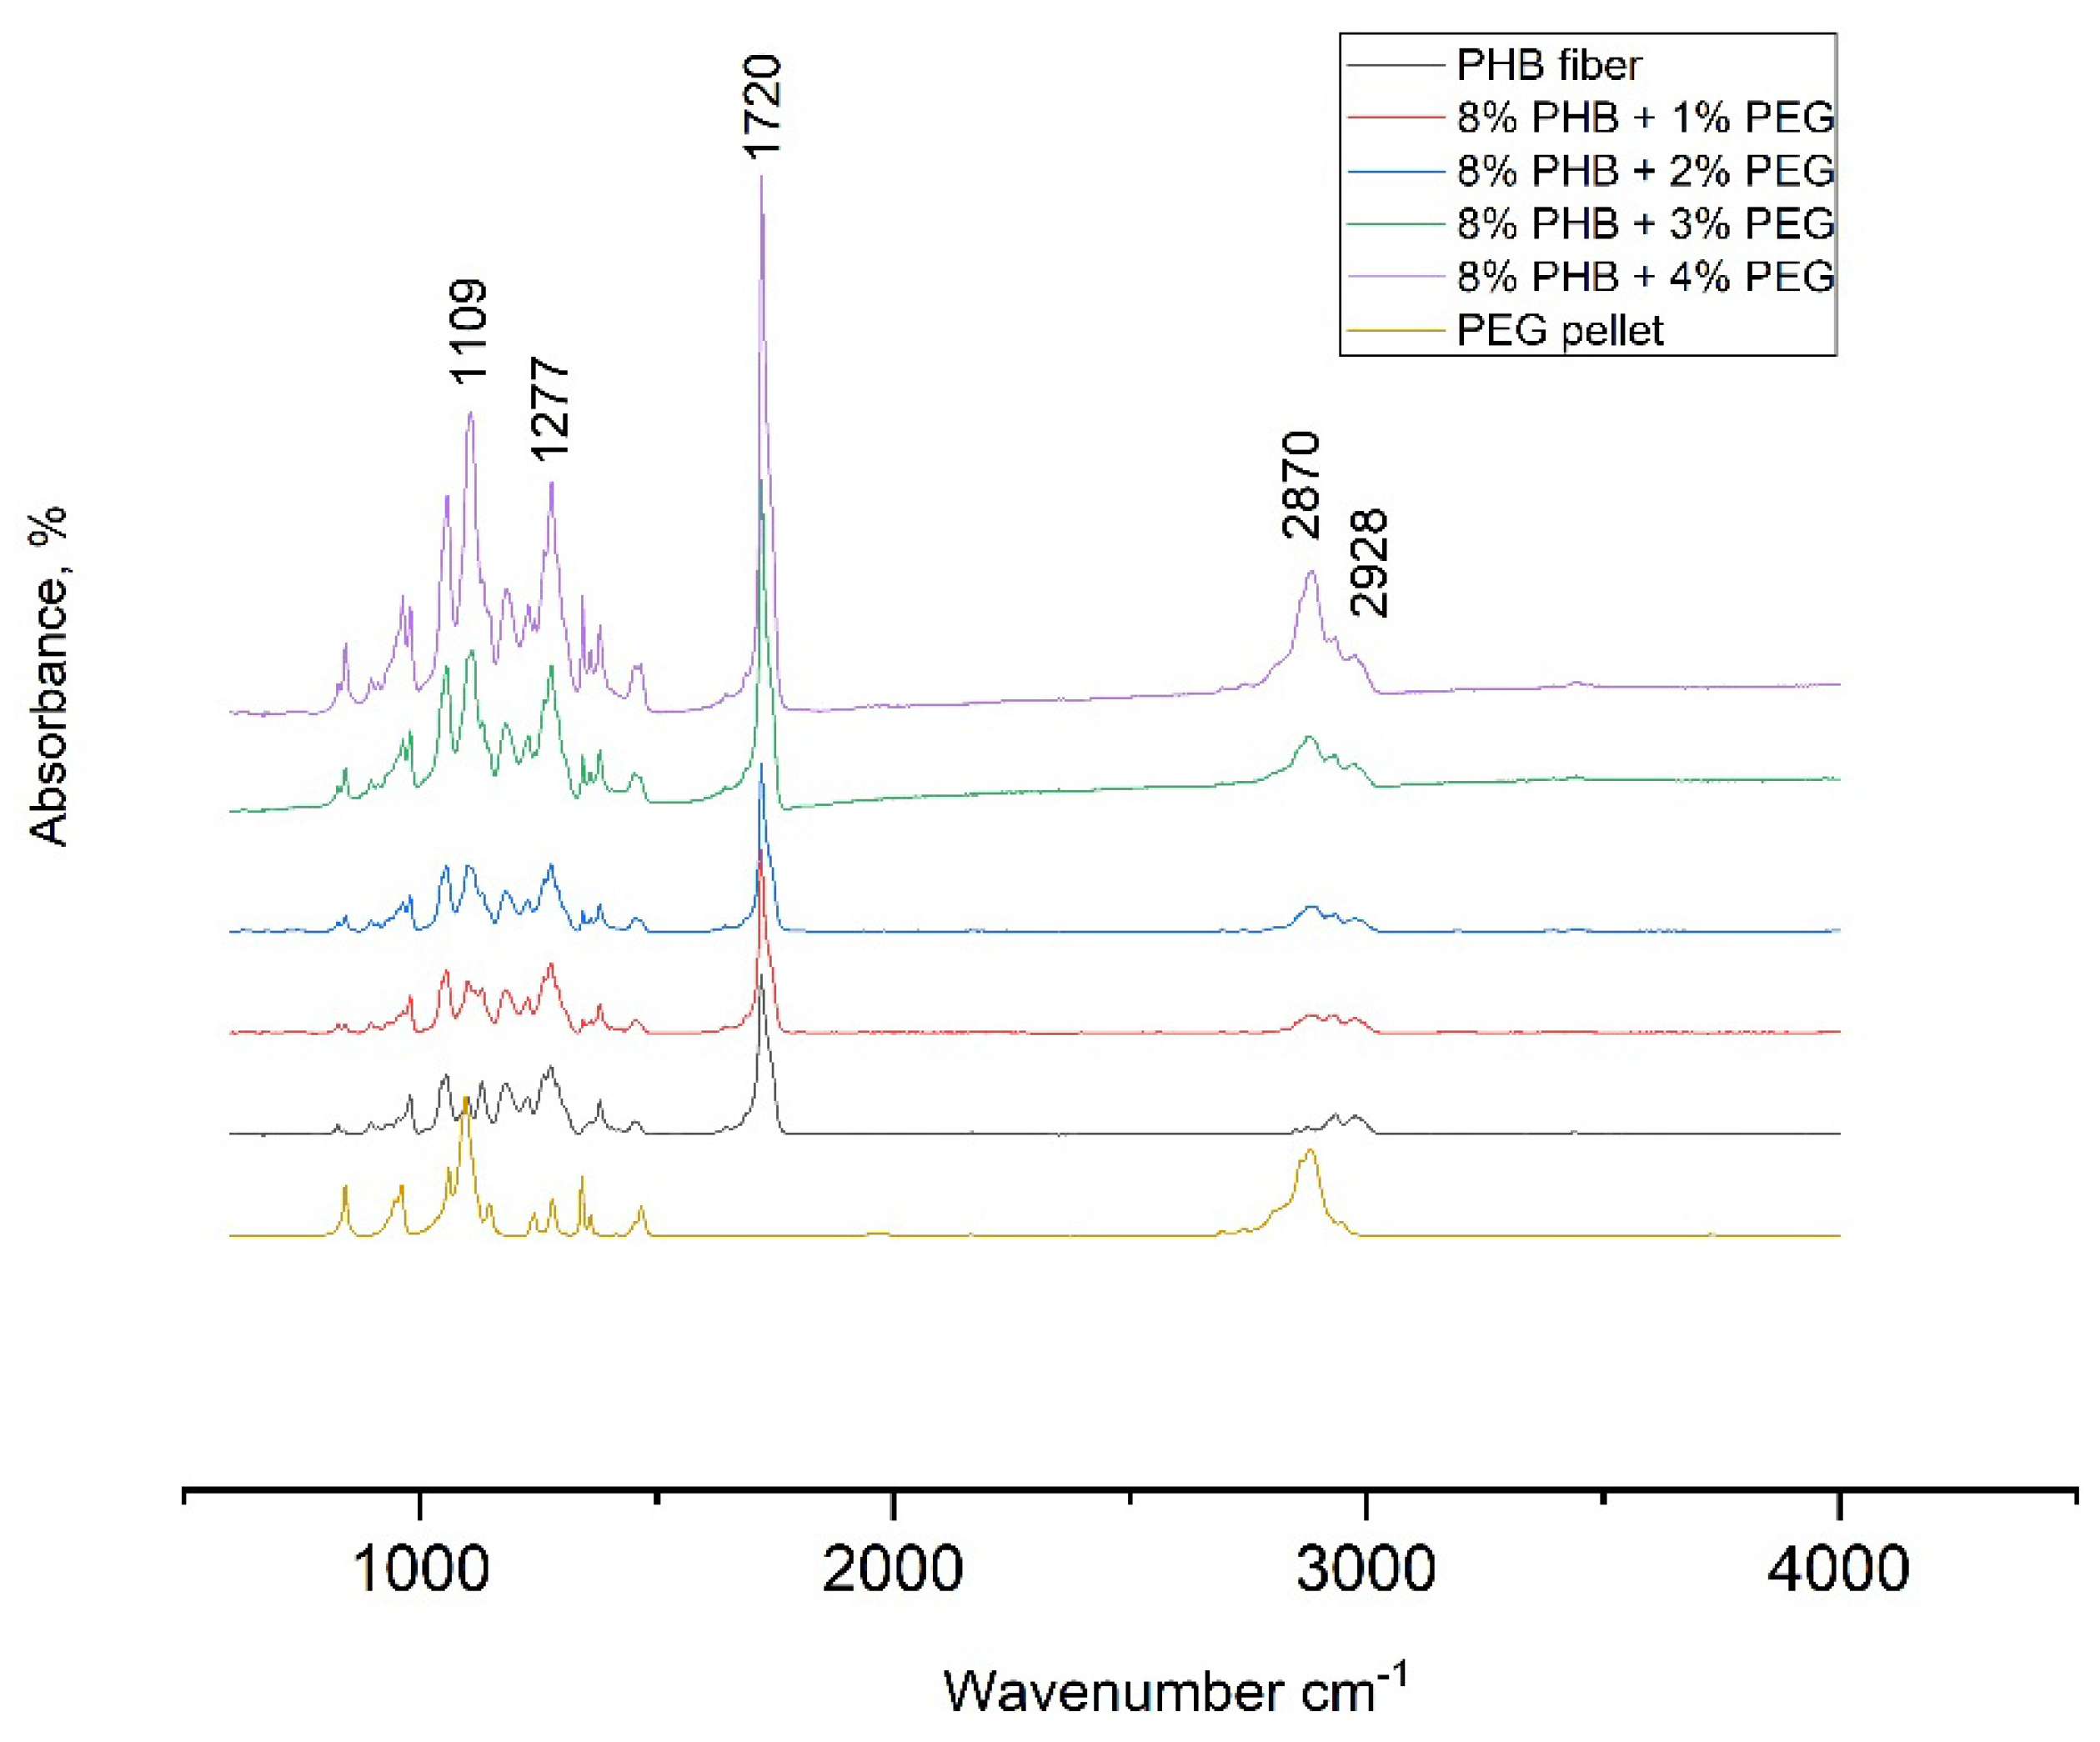
3.2. Fourier Transform Infrared Spectroscopy (FTIR)
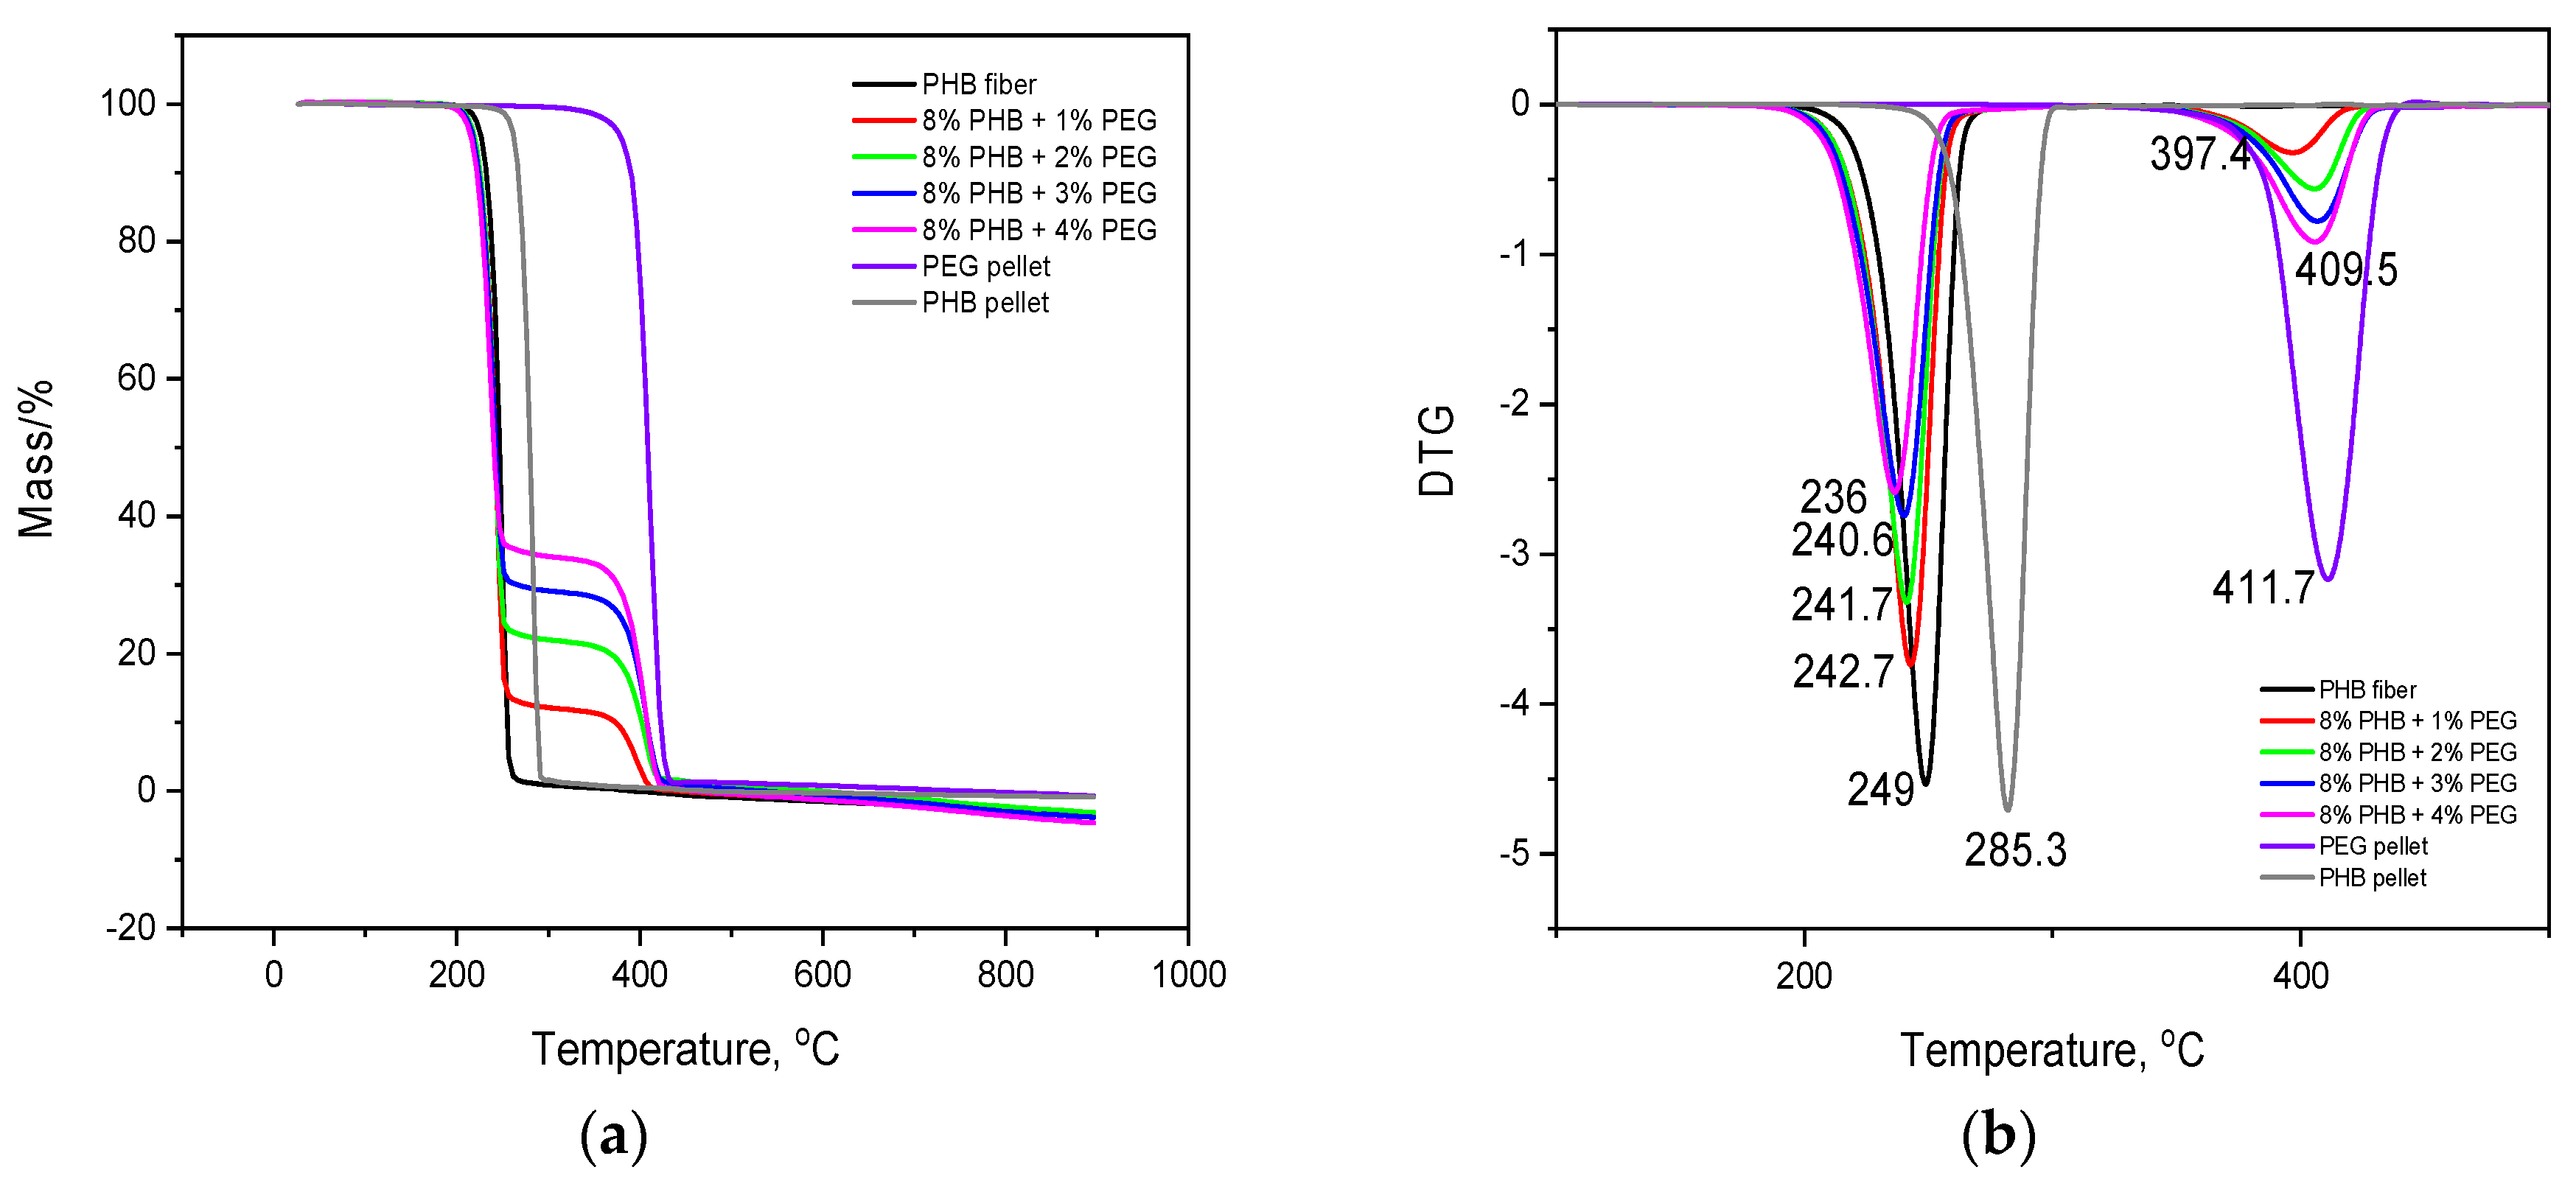
3.3. Thermal Properties
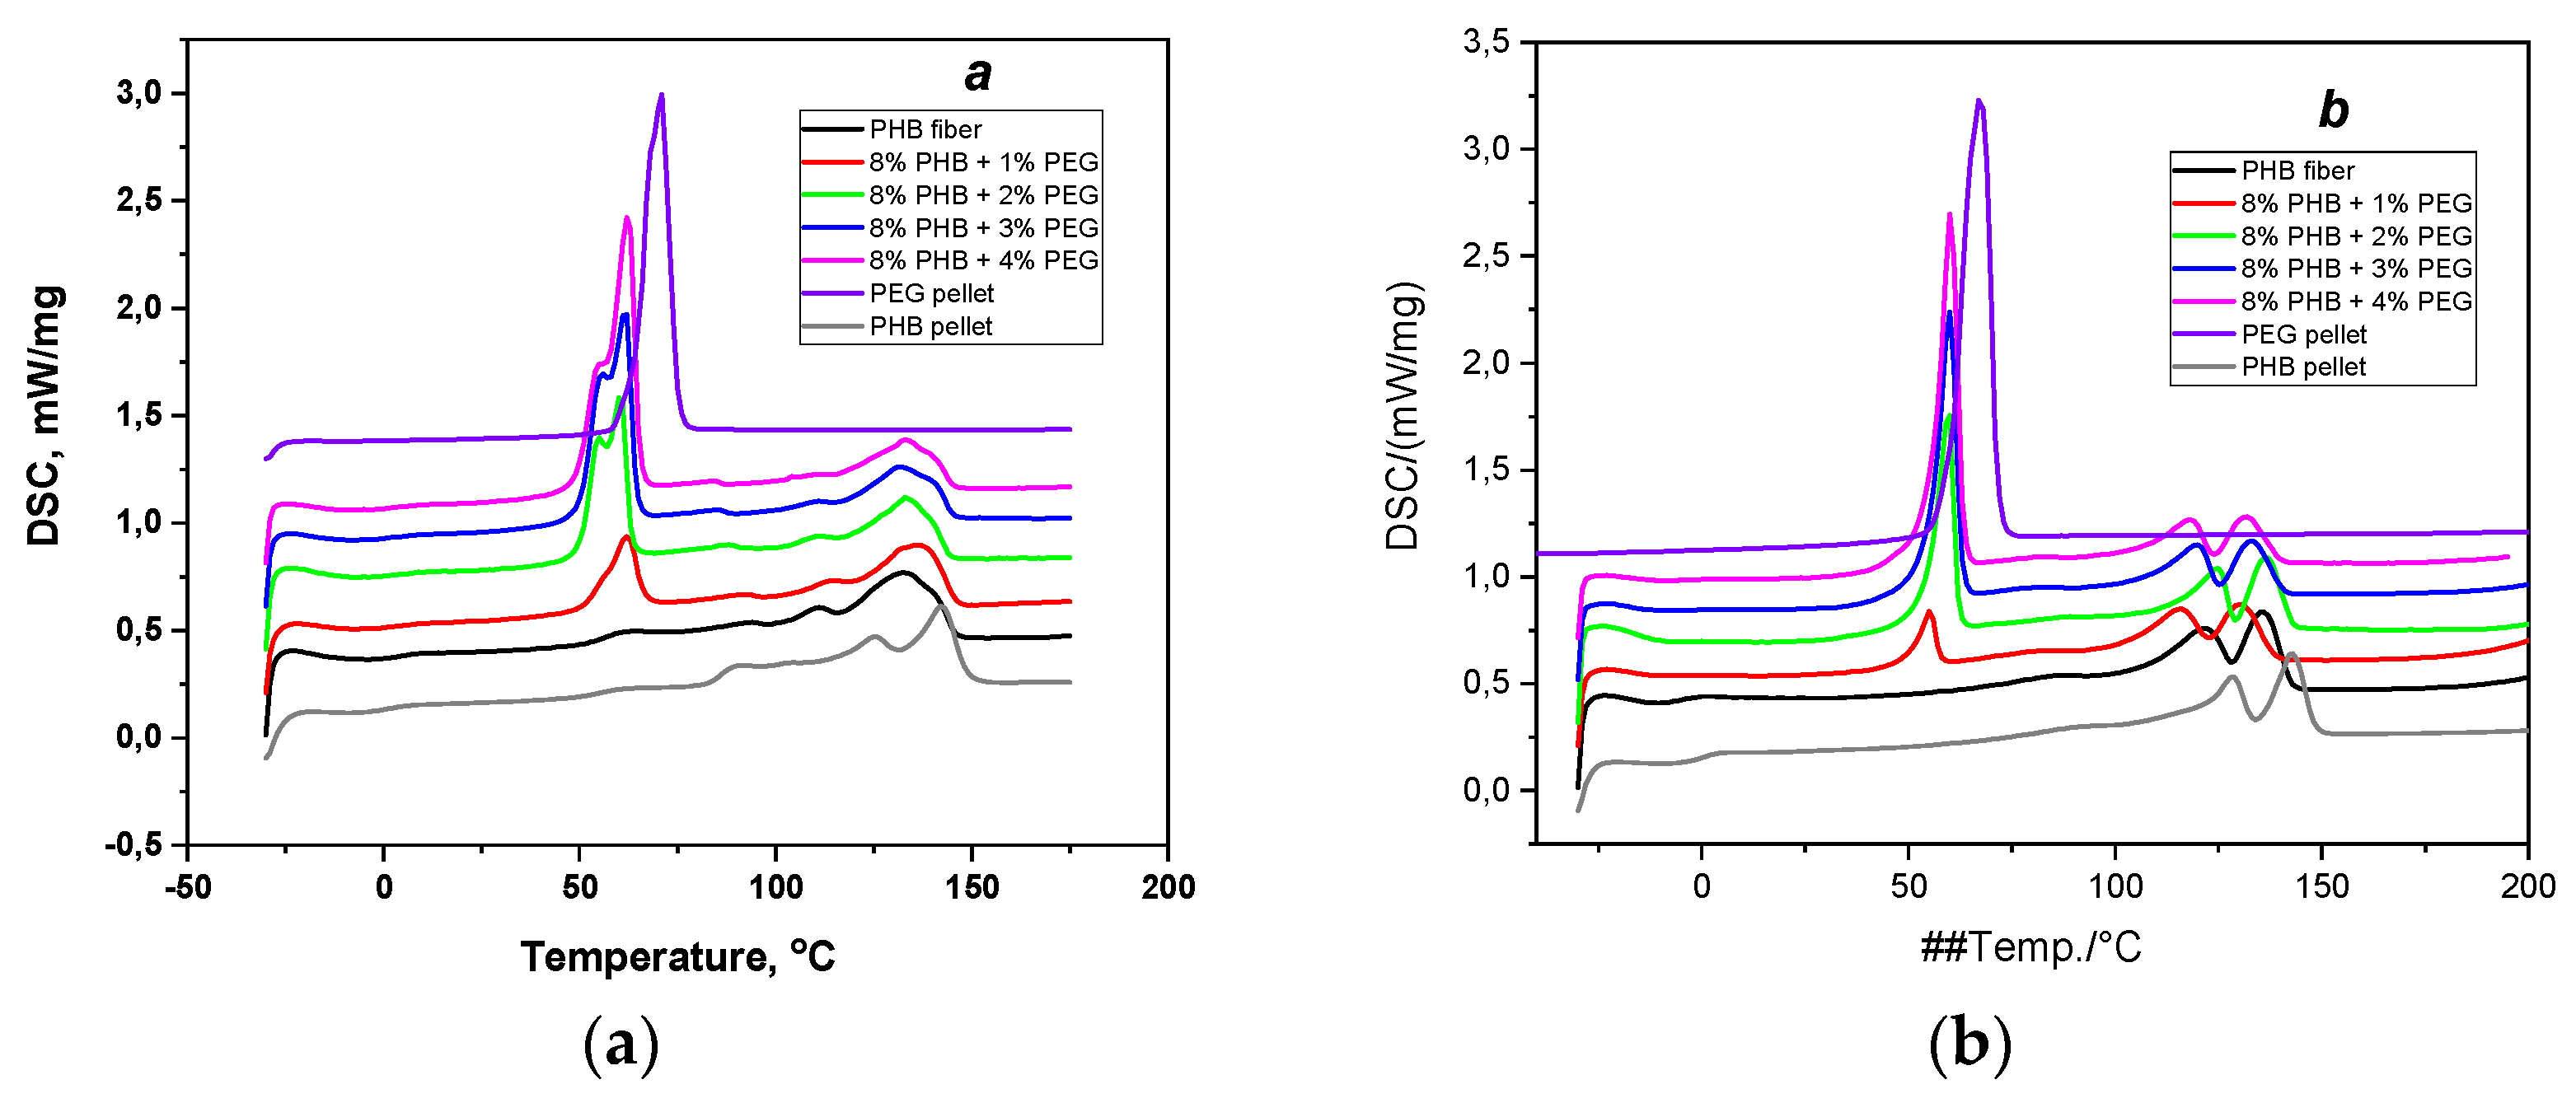
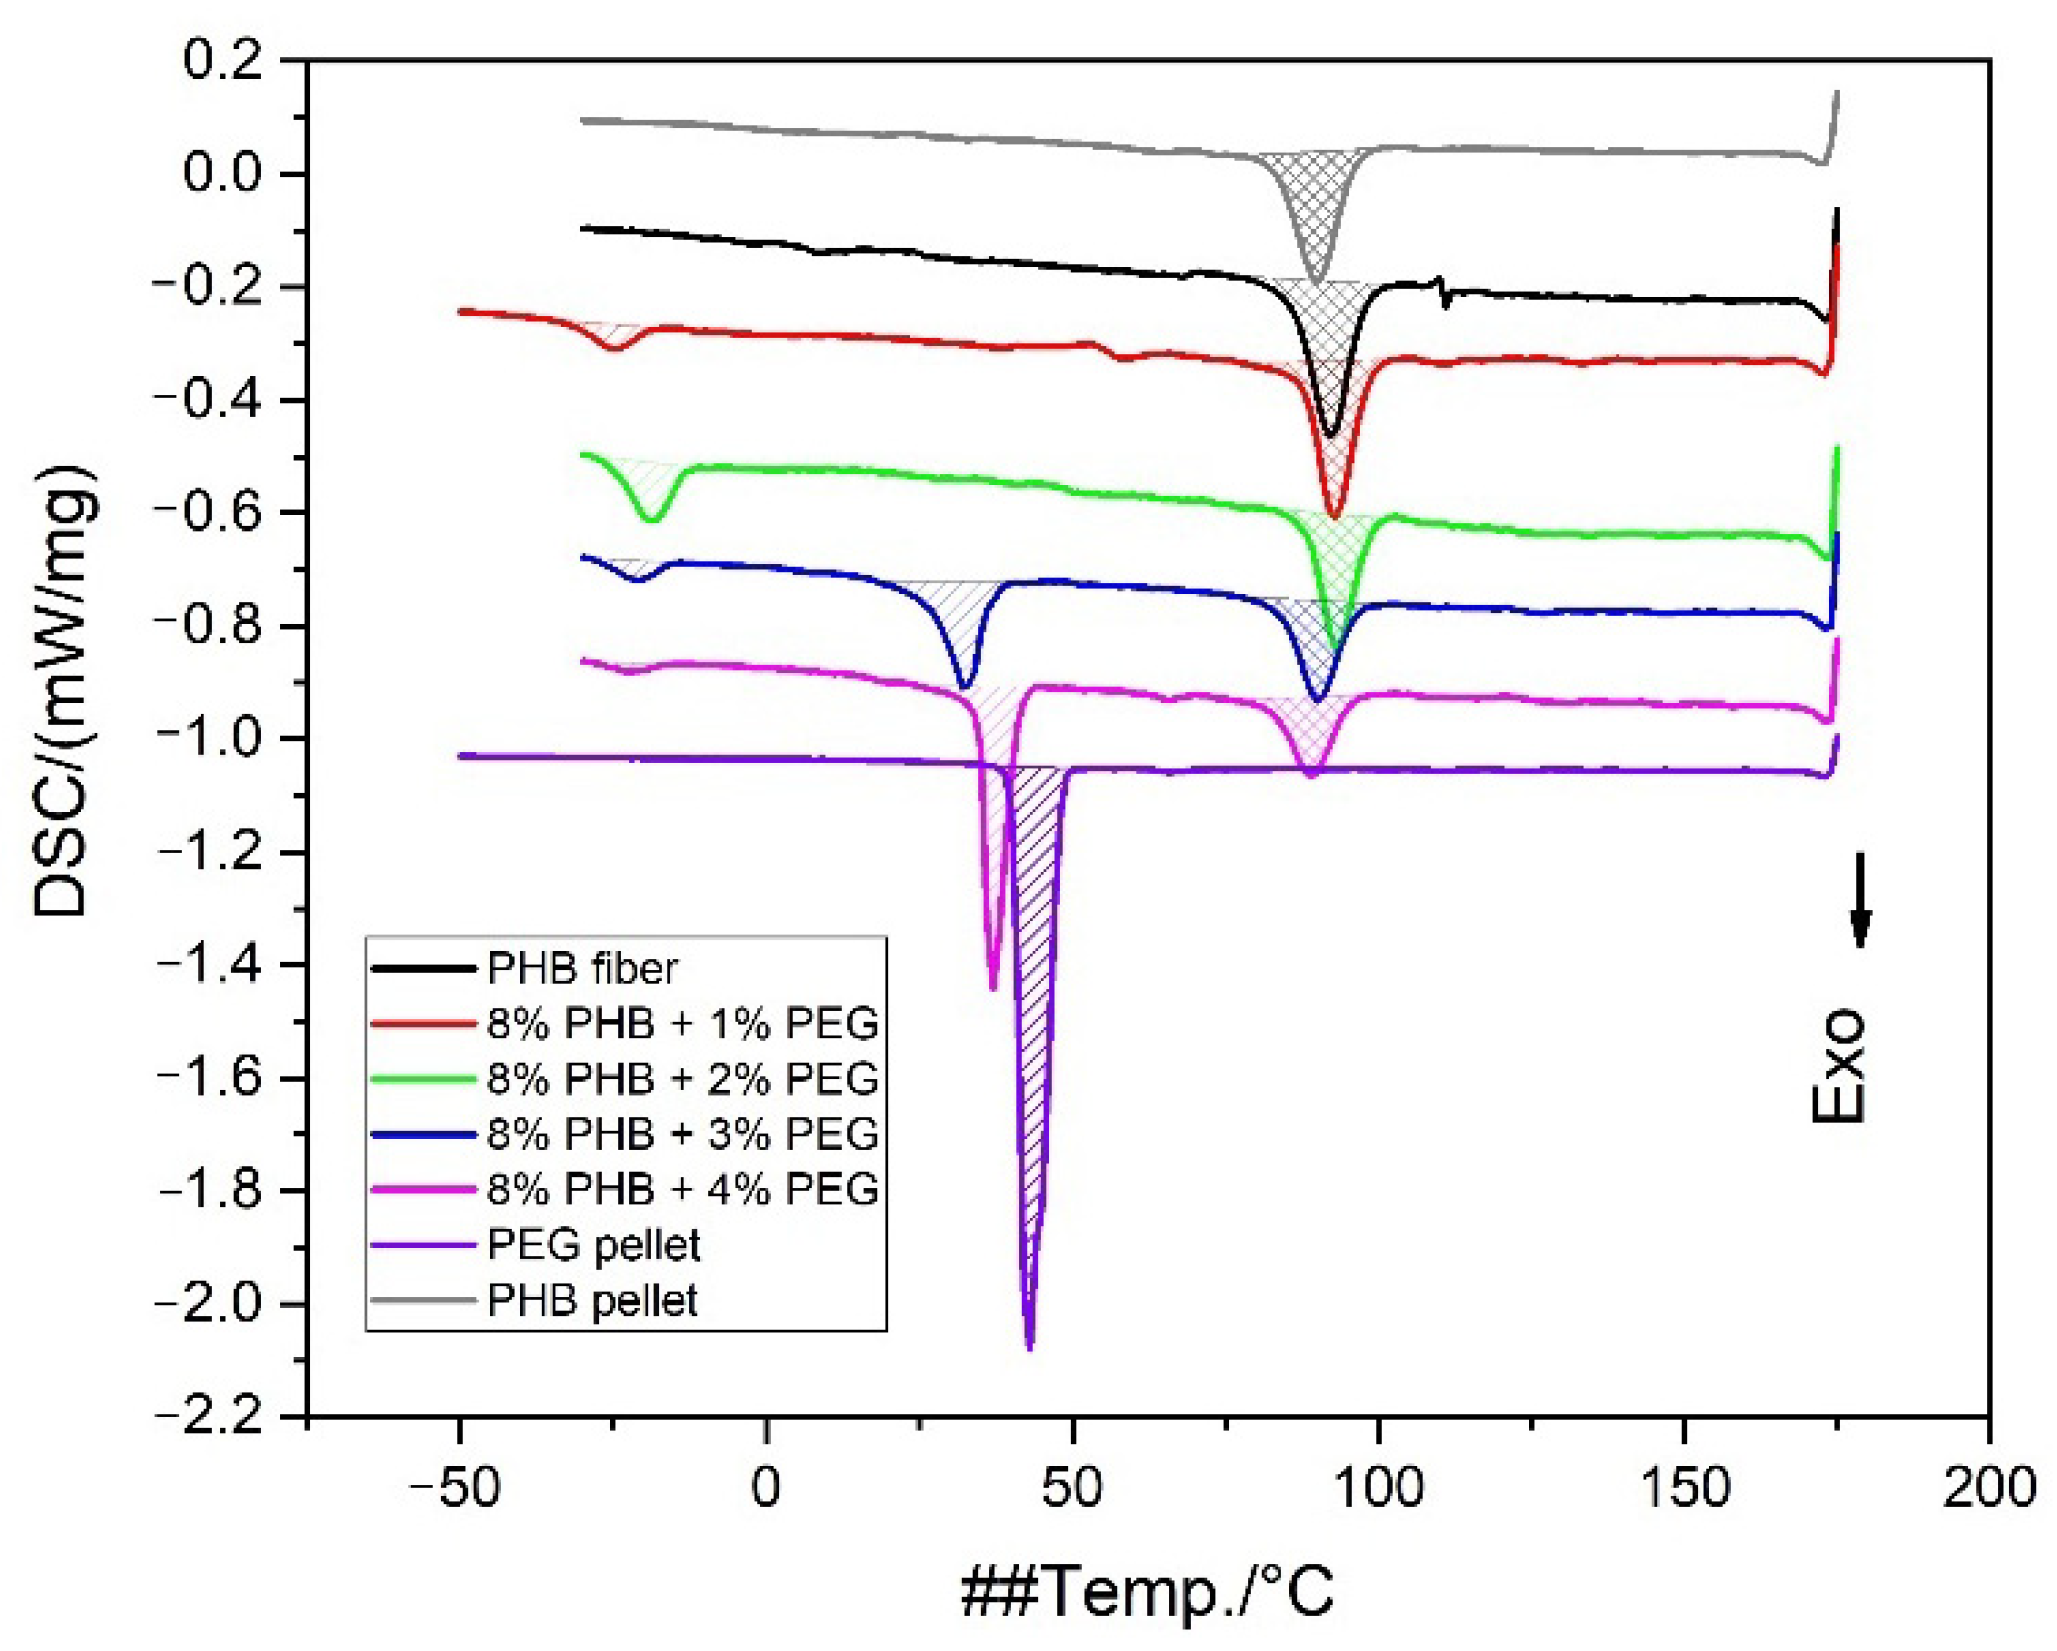
3.4. Differential Scanning Calorimetry (DSC) Analysis
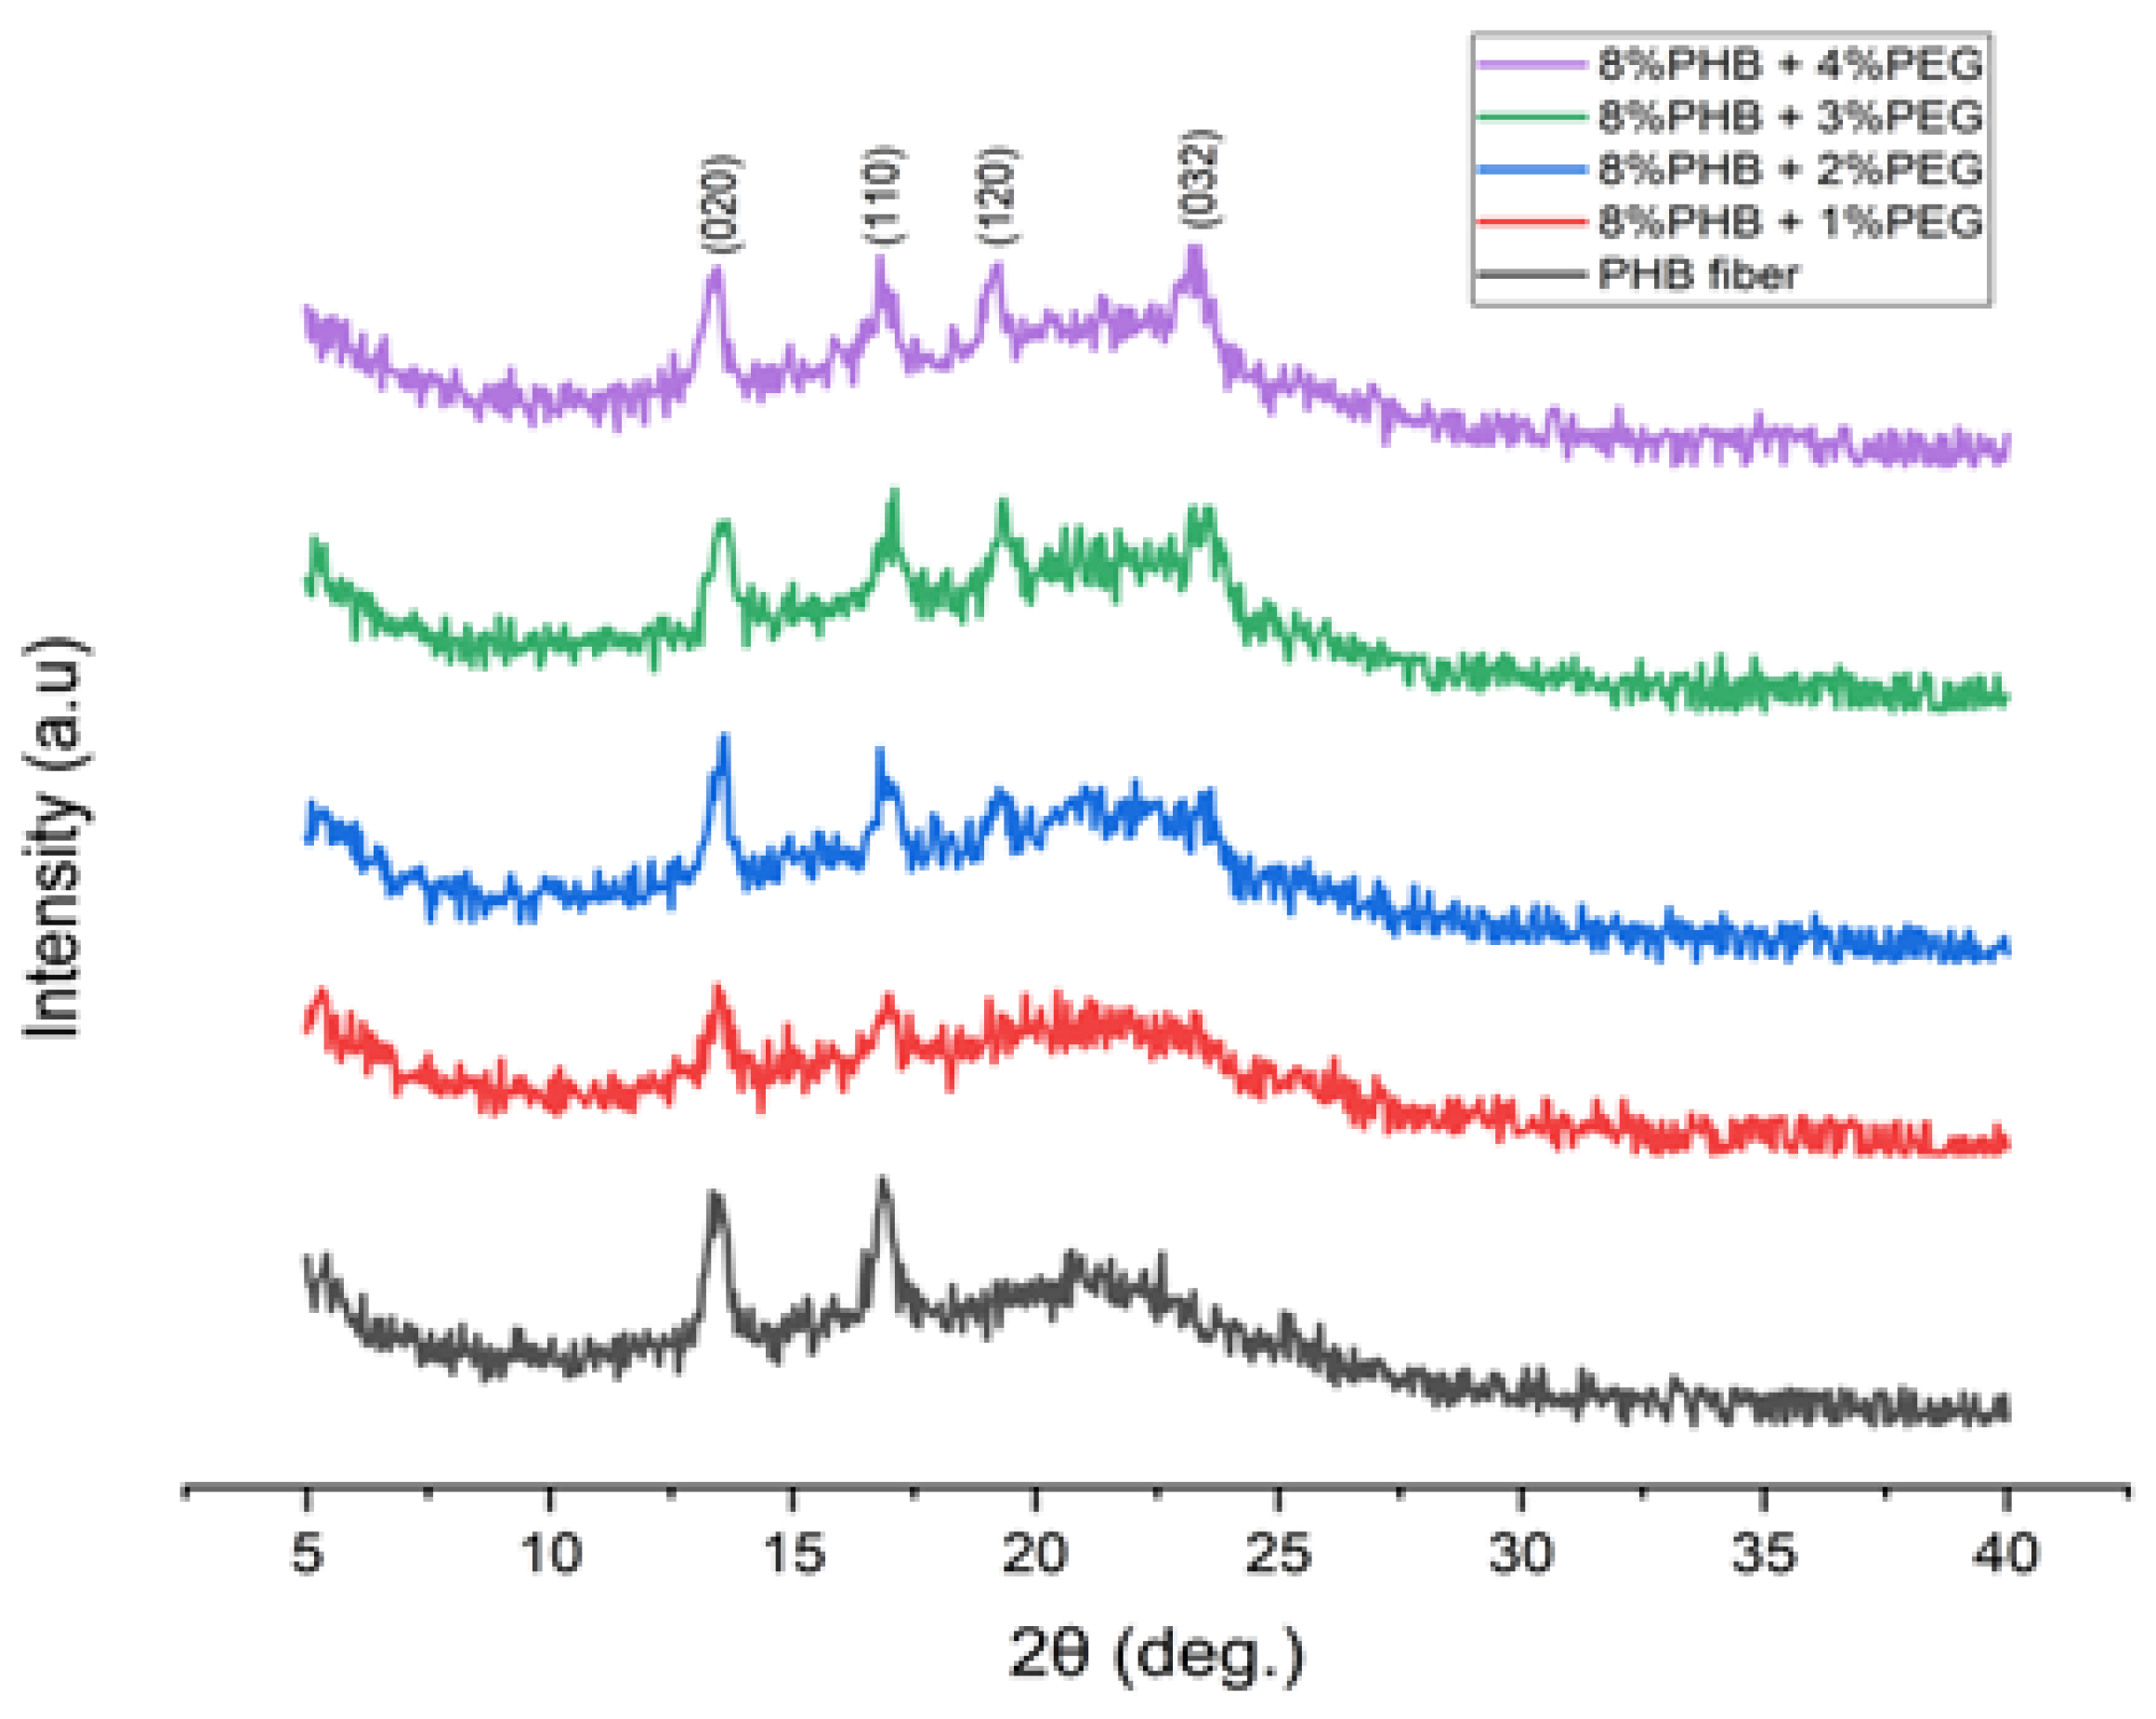
3.5. Crystalline Structure
3.6. The Porosity of the PHB/PEG Nanofiber Mat
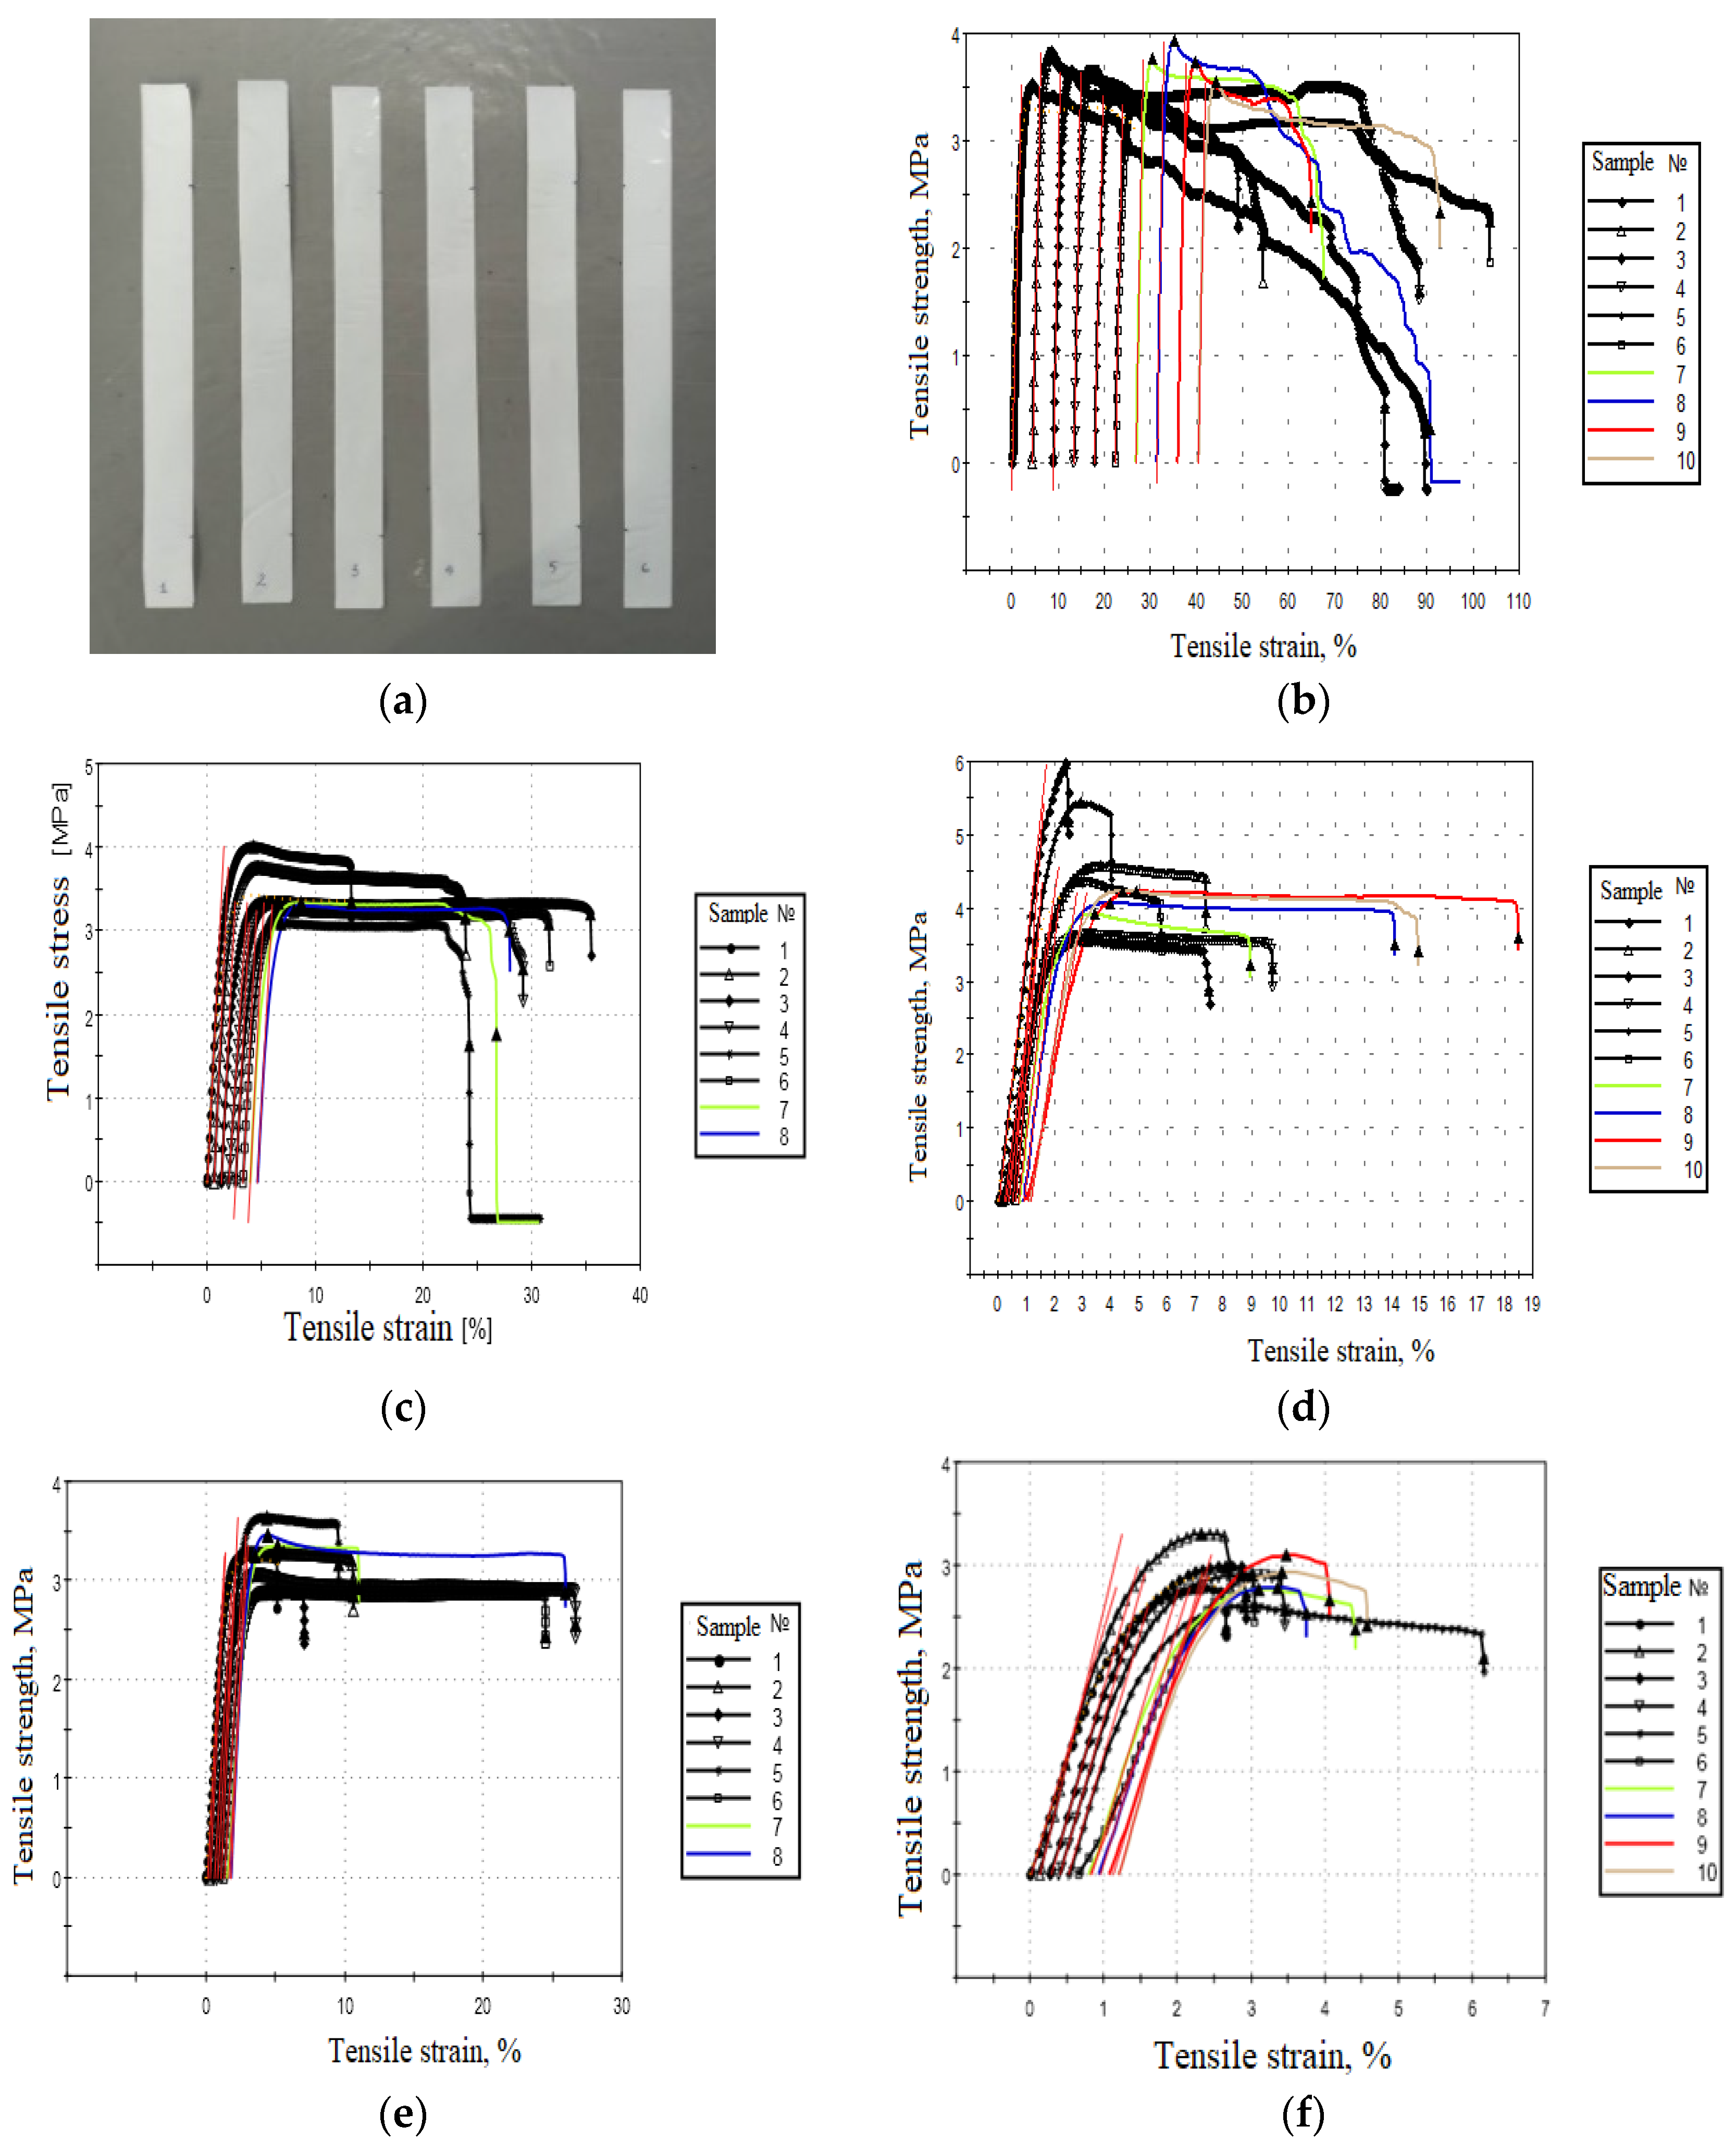
3.7. The Mechanical Properties of the PHB/PEG Nanofiber Mat
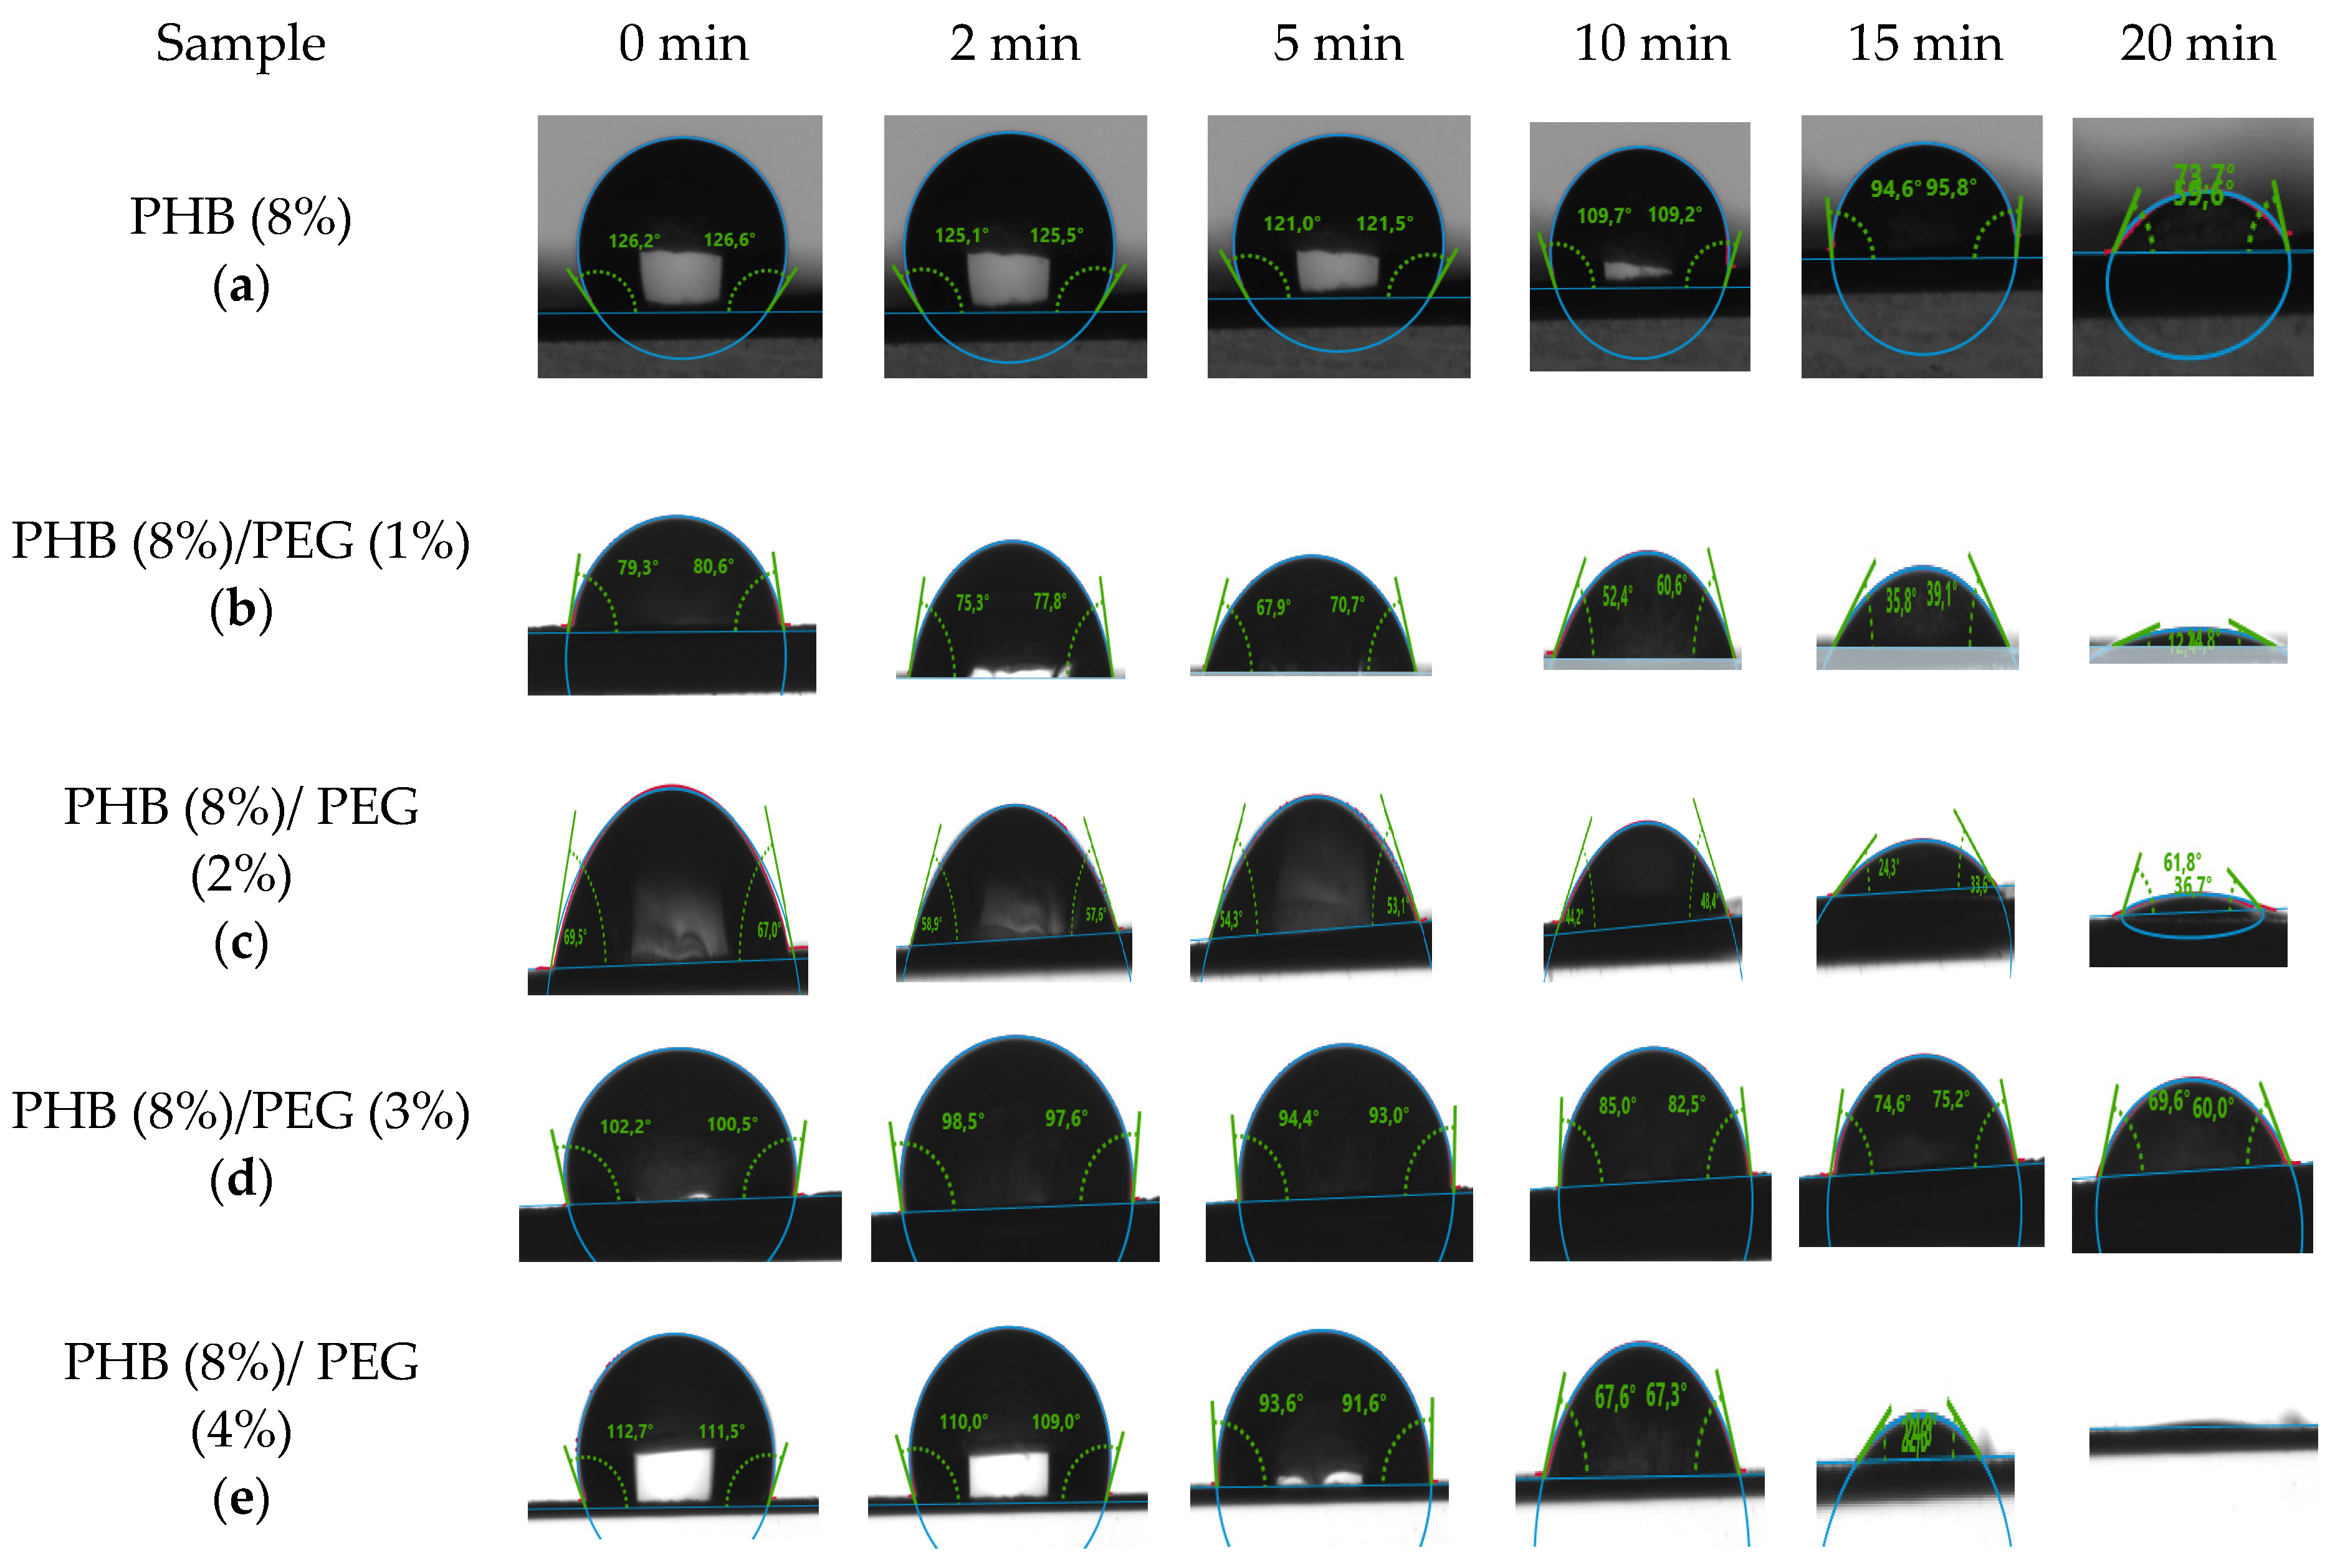
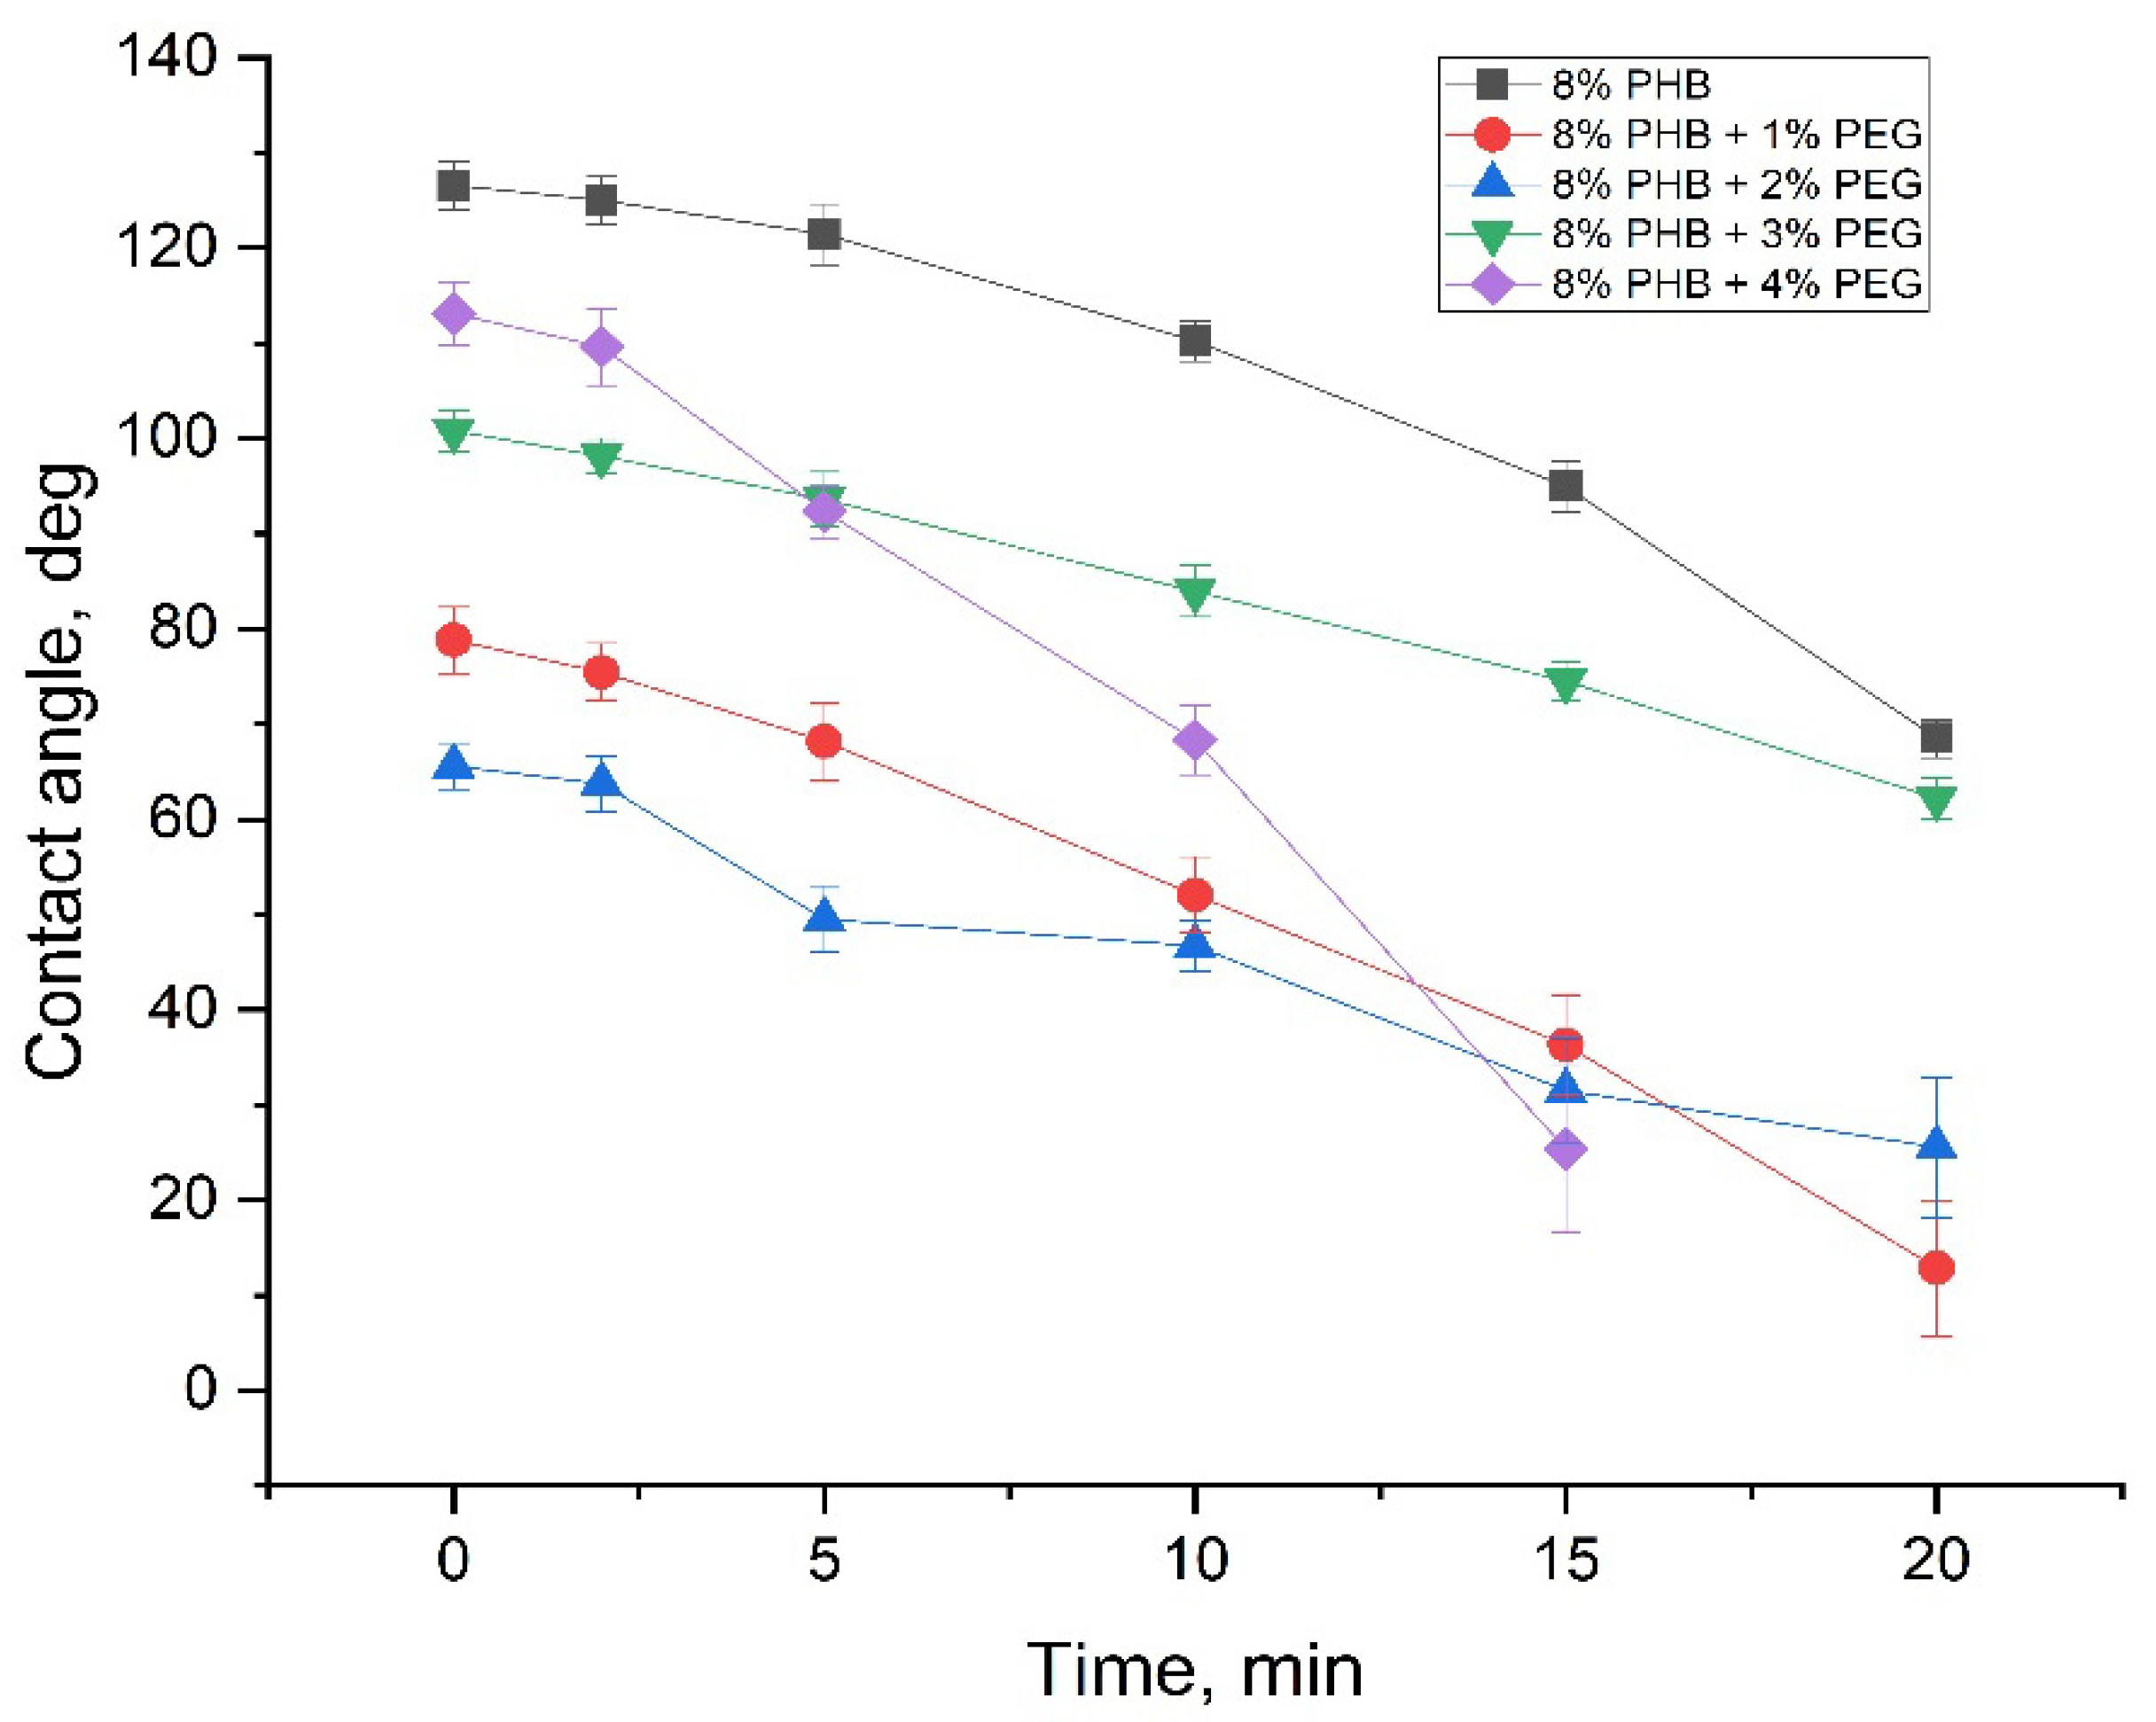
3.8. Water Contact Angle
4. Conclusions
Author Contributions
Funding
Institutional Review Board Statement
Informed Consent Statement
Data Availability Statement
Conflicts of Interest
References
- Leena, M.M.; Yoha, K.S.; Moses, J.A.; Anandharamakrishnan, C. Nanofibers in Food Applications. In Innovative Food Processing Technologies: A Comprehensive Review; Elsevier: Amsterdam, The Netherlands, 2021; pp. 634–650. [Google Scholar] [CrossRef]
- Nunes, C.S.; Philipps-Wiemann, P. Formulation of enzymes. In Enzymes in Human and Animal Nutrition; Academic Press: London, UK, 2018; pp. 429–440. [Google Scholar] [CrossRef]
- Alghoraibi, I.; Alomari, S. Different Methods for Nanofiber Design and Fabrication. In Handbook of Nanofibers; Springer International Publishing: Cham, Switzerland, 2018; pp. 1–46. [Google Scholar] [CrossRef]
- Zhao, Y.; Qiu, Y.; Wang, H.; Chen, Y.; Jin, S.; Chen, S. Preparation of Nanofibers with Renewable Polymers and Their Application in Wound Dressing. Int. J. Polym. Sci. 2016, 2016, 4672839. [Google Scholar] [CrossRef] [Green Version]
- Sundarrajan, S.; Tan, K.L.; Lim, S.H.; Ramakrishna, S. Electrospun nanofibers for air filtration applications. Procedia Eng. 2014, 75, 159–163. [Google Scholar] [CrossRef] [Green Version]
- Maliszewska, I.; Czapka, T. Electrospun Polymer Nanofibers with Antimicrobial Activity. Polymers 2022, 14, 1661. [Google Scholar] [CrossRef]
- Ma, W.; Zhang, Q.; Hua, D.; Xiong, R.; Zhao, J.; Rao, W.; Huang, S.; Zhan, X.; Chen, F.; Huang, C. Electrospun fibers for oil-water separation. RSC Adv. 2016, 6, 12868–12884. [Google Scholar] [CrossRef]
- Yoo, H.S.; Kim, T.G.; Park, T.G. Surface-functionalized electrospun nanofibers for tissue engineering and drug delivery. Adv. Drug Deliv. Rev. 2009, 61, 1033–1042. [Google Scholar] [CrossRef]
- Deng, Z.; Mu, H.; Jiang, L.; Xi, W.; Xu, X.; Zheng, W. Preparation and characterization of electrospun PLGA-SF nanofibers as a potential drug delivery system. Mater. Chem. Phys. 2022, 289, 126452. [Google Scholar] [CrossRef]
- Yang, X.; Chen, Y.; Zhang, C.; Duan, G.; Jiang, S. Electrospun carbon nanofibers and their reinforced composites: Preparation, modification, applications, and perspectives. Compos. Part B Eng. 2023, 249, 110386. [Google Scholar] [CrossRef]
- Guo, Y.; Qiao, Y.; Cui, T.; Wu, F.; Ji, S.; Yang, Y.; Tian, H.; Ren, T. Electrospun Nanofibers for Integrated Sensing, Storage, and Computing Applications. Appl. Sci. 2022, 12, 4370. [Google Scholar] [CrossRef]
- Li, M.; Qiu, W.; Wang, Q.; Li, N.; Liu, L.; Wang, X.; Yu, J.; Li, X.; Li, F.; Wu, D. Nitric Oxide-Releasing Tryptophan-Based Poly(ester urea)s Electrospun Composite Nanofiber Mats with Antibacterial and Antibiofilm Activities for Infected Wound Healing. ACS Appl. Mater. Interfaces 2022, 14, 15911–15926. [Google Scholar] [CrossRef]
- Qi, Y.; Wang, C.; Wang, Q.; Zhou, F.; Li, T.; Wang, B.; Su, W.; Shang, D.; Wu, S. A simple, quick, and cost-effective strategy to fabricate polycaprolactone/silk fibroin nanofiber yarns for biotextile-based tissue scaffold application. Eur. Polym. J. 2023, 186, 111863. [Google Scholar] [CrossRef]
- Choy, S.; Moon, H.; Park, Y.; Jung, Y.M.; Koo, J.M.; Oh, D.X.; Hwang, D.S. Mechanical properties and thermal stability of intermolecular-fitted poly(vinyl alcohol)/α-chitin nanofibrous mat. Carbohydr. Polym. 2020, 244, 116476. [Google Scholar] [CrossRef]
- Zhu, M.; Han, J.; Wang, F.; Shao, W.; Xiong, R.; Zhang, Q.; Pan, H.; Yang, Y.; Samal, S.K.; Zhang, F.; et al. Electrospun Nanofibers Membranes for Effective Air Filtration. Macromol. Mater. Eng. 2017, 302, 1600353. [Google Scholar] [CrossRef]
- Lee, S.J.; Oh, S.H.; Liu, J.; Soker, S.; Atala, A.; Yoo, J.J. The use of thermal treatments to enhance the mechanical properties of electrospun poly(ɛ-caprolactone) scaffolds. Biomaterials 2008, 29, 1422–1430. [Google Scholar] [CrossRef]
- Wang, W.; Jin, X.; Zhu, Y.; Zhu, C.; Yang, J.; Wang, H.; Lin, T. Effect of vapor-phase glutaraldehyde crosslinking on electrospun starch fibers. Carbohydr. Polym. 2016, 140, 356–361. [Google Scholar] [CrossRef]
- Mas, A.; Jaaba, H.; Sledz, J.; Schue, F. Membranes en PHB, P(HB-co-9% HV), P(HB-co-22% HV) pour la microfiltration ou la pervaporation proprietes filtrantes et etat de surface. Eur. Polym. J. 1996, 32, 435–450. [Google Scholar] [CrossRef]
- Marova, I.; Kundrat, V.; Benesova, P.; Matouskova, P.; Obruca, S. Use of biodegradable PHA-based nanofibers to removing microorganisms from water. In Proceedings of the 2015 IEEE 15th International Conference on Nanotechnology (IEEE-NANO), Rome, Italy, 27–30 July 2015; pp. 204–206. [Google Scholar] [CrossRef]
- Parra, D.F.; Fusaro, J.; Gaboardi, F.; Rosa, D.S. Influence of poly (ethylene glycol) on the thermal, mechanical, morphological, physical-chemical and biodegradation properties of poly (3-hydroxybutyrate). Polym. Degrad. Stab. 2006, 91, 1954–1959. [Google Scholar] [CrossRef]
- Tomietto, P.; Loulergue, P.; Paugam, L.; Audic, J.L. Biobased polyhydroxyalkanoate (PHA) membranes: Structure/performances relationship. Sep. Purif. Technol. 2020, 252, 117419. [Google Scholar] [CrossRef]
- Chan, R.T.H.; Marçal, H.; Russell, R.A.; Holden, P.J.; Foster, L.J.R. Application of polyethylene glycol to promote cellular biocompatibility of polyhydroxybutyrate films. Int. J. Polym. Sci. 2011, 2011, 473045. [Google Scholar] [CrossRef]
- Pham, L.Q.; Uspenskaya, M.V.; Olekhnovich, R.O.; Baranov, M.A. The Mechanical Properties of PVC Nanofiber Mats Obtained by Electrospinning. Fibers 2021, 9, 2. [Google Scholar] [CrossRef]
- Vu, T.H.N.; Morozkina, S.N.; Uspenskaya, M.V. Study of the Nanofibers Fabrication Conditions from the Mixture of Poly(vinyl alcohol) and Chitosan by Electrospinning Method. Polymers 2022, 14, 811. [Google Scholar] [CrossRef]
- Jia, S.; Yu, D.; Zhu, Y.; Wang, Z.; Chen, L.; Fu, L. Morphology, crystallization and thermal behaviors of PLA-based composites: Wonderful effects of hybrid GO/PEG via dynamic impregnating. Polymers 2017, 9, 528. [Google Scholar] [CrossRef] [Green Version]
- Singh, T.J.; Bhat, S. V Morphology and conductivity studies of a new solid polymer electrolyte: (PEG) × LiClO 4. Bull. Mater. Sci 2003, 26, 707–714. [Google Scholar] [CrossRef]
- Nagahama, K.; Aoki, R.; Saito, T.; Ouchi, T.; Ohya, Y.; Yui, N.; Yui, N. Enhanced stereocomplex formation of enantiomeric polylactides grafted on a polyrotaxane platform. Polym. Chem. 2013, 4, 1769–1773. [Google Scholar] [CrossRef]
- Barham, P.J.; Keller, A.; Otun, E.L.; Holmes, P.A. Crystallization and morphology of a bacterial thermoplastic: Poly-3-hydroxybutyrate. J. Mater. Sci. 1984, 19, 2781–2794. [Google Scholar] [CrossRef]
- Wei, L.; McDonald, A.G. Peroxide induced cross-linking by reactive melt processing of two biopolyesters: Poly(3-hydroxybutyrate) and poly(l -lactic acid) to improve their melting processability. J. Appl. Polym. Sci. 2015, 132, 13. [Google Scholar] [CrossRef]
- Bikiaris, D.; Fombuena Borràs, V.; Fernando, M.; Carrasco, A.; Karpova, S.G.; Varyan, I.A.; Olkhov, A.A.; Popov, A.A. A Feature of the Crystalline and Amorphous Structure of Ultra Thin Fibers Based on Poly(3-hydroxybutyrate) (PHB) Containing Minor Concentrations of Hemin and a Complex of Tetraphenylporphyrin with Iron. Polymers 2022, 14, 4055. [Google Scholar] [CrossRef]
- Wang, Z.; Sahadevan, R.; Crandall, C.; Menkhaus, T.J.; Fong, H. Hot-pressed PAN/PVDF hybrid electrospun nanofiber membranes for ultrafiltration. J. Membr. Sci. 2020, 611, 118327. [Google Scholar] [CrossRef]
- Ramakrishna, S.; Fujihara, K.; Teo, W.E.; Lim, T.C.; Ma, Z. An Introduction to Electrospinning and Nanofibers; World Scientific Publishing Co.: Singapore, 2005; pp. 1–382. [Google Scholar] [CrossRef]
- Bae, H.S.; Haider, A.; Selim, K.M.K.; Kang, D.Y.; Kim, E.J.; Kang, I.K. Fabrication of highly porous PMMA electrospun fibers and their application in the removal of phenol and iodine. J. Polym. Res. 2013, 20, 158. [Google Scholar] [CrossRef]
- Zhao, Y.; Zhu, J.; Zhang, J.; Chen, Z.; Li, W.; Deng, L.; Chen, K.; Wan, H.; Li, J.; Li, R. Optimization of biodegradable PEG/PLGA nanofiber mats electrospinning process for anti-adhesion application. J. Appl. Polym. Sci. 2018, 135, 46282. [Google Scholar] [CrossRef]
- Ol’khov, A.A.; Gol’dshtrakh, M.A.; Ishchenko, A.A.; Iordanskii, A.L. Formation of complexes in polyhydroxybutyrate–polyethylene glycol mixtures. Russ. J. Phys. Chem. B 2015, 9, 961–970. [Google Scholar] [CrossRef]
- Falqi, F.H.; Bin-Dahman, O.A.; Hussain, M.; Al-Harthi, M.A. Preparation of Miscible PVA/PEG Blends and Effect of Graphene Concentration on Thermal, Crystallization, Morphological, and Mechanical Properties of PVA/PEG (10wt%) Blend. Int. J. Polym. Sci. 2018, 2018, 8527693. [Google Scholar] [CrossRef] [Green Version]
- Feldstein, M.M.; Roos, A.; Chevallier, C.; Creton, C.; Dormidontova, E.E. Relation of glass transition temperature to the hydrogen bonding degree and energy in poly(N-vinyl pyrrolidone) blends with hydroxyl-containing plasticizers: 3. Analysis of two glass transition temperatures featured for PVP solutions in liquid poly(ethylene glycol). Polymer 2003, 44, 1819–1834. [Google Scholar] [CrossRef]
- Mottina, A.C. What Changes in Poly(3-Hydroxybutyrate) (PHB) When Processed as Electrospun Nanofibers or Thermo-Compression Molded Film? Mater. Res. 2016, 19, 57–66. [Google Scholar] [CrossRef] [Green Version]
- Tiwari, A.; Hihara, L.H. Thermal stability and thermokinetics studies on silicone ceramer coatings: Part 1—Inert atmosphere parameters. Polym. Degrad. Stab. 2009, 94, 1754–1771. [Google Scholar] [CrossRef]
- Abdallah, H.; El-Gendi, A. Preparation of Polyvinylchloride (PVC) Membranes, Characterization, Modification, Applications, and Mathematical Model. In Polyvinylchloride-Based Blends: Preparation, Characterization and Applications; Springer: Cham, Switzerland, 2022; pp. 175–210. [Google Scholar] [CrossRef]
- Parra, D.F.; Rosa, D.S.; Rezende, J.; Ponce, P.; Lugão, A.B. Biodegradation of γ Irradiated Poly 3-hydroxybutyrate (PHB) Films Blended with Poly(Ethyleneglycol). J. Polym. Environ. 2011, 19, 918–925. [Google Scholar] [CrossRef]
- Zhao, S.; Wu, X.; Wang, L.; Huang, Y. Electrospinning of ethyl–cyanoethyl cellulose/tetrahydrofuran solutions. J. Appl. Polym. Sci. 2004, 91, 242–246. [Google Scholar] [CrossRef]
- Jarusuwannapoom, T.; Hongrojjanawiwat, W.; Jitjaicham, S.; Wannatong, L.; Nithitanakul, M.; Pattamaprom, C.; Koombhongse, P.; Rangkupan, R.; Supaphol, P. Effect of solvents on electro-spinnability of polystyrene solutions and morphological appearance of resulting electrospun polystyrene fibers. Eur. Polym. J. 2005, 41, 409–421. [Google Scholar] [CrossRef]
- Kozlowska, M.; Goclon, J.; Rodziewicz, P. Intramolecular Hydrogen Bonds in Low-Molecular-Weight Polyethylene Glycol. ChemPhysChem 2016, 17, 1143–1153. [Google Scholar] [CrossRef]
- Zhijiang, C.; Chengwei, H.; Guang, Y. Crystallization behavior, thermal property and biodegradation of poly(3-hydroxybutyrate)/poly(ethylene glycol) grafting copolymer. Polym. Degrad. Stab. 2011, 96, 1602–1609. [Google Scholar] [CrossRef]
- Andrade, K.L.; Ramlow, H.; Floriano, J.F.; Acosta, E.D.; Faita, F.L.; Machado, R.A.F. Latex and natural rubber: Recent advances for biomedical applications. Polimeros 2022, 32, e2022015. [Google Scholar] [CrossRef]
- Wang, H.; Feng, Y.; Fang, Z.; Yuan, W.; Khan, M. Co-electrospun blends of PU and PEG as potential biocompatible scaffolds for small-diameter vascular tissue engineering. Mater. Sci. Eng. C 2012, 32, 2306–2315. [Google Scholar] [CrossRef]
- Llorens, E.; Bellmunt, S.; del Valle, L.J.; Puiggalí, J. Scaffolds constituted by mixed polylactide and poly(ethylene glycol) electrospun microfibers. J. Polym. Res. 2014, 21, 603. [Google Scholar] [CrossRef]
- Kiani, S.; Mousavi, S.M.; Shahtahmassebi, N.; Saljoughi, E. Hydrophilicity improvement in polyphenylsulfone nanofibrous filtration membranes through addition of polyethylene glycol. Appl. Surf. Sci. 2015, 359, 252–258. [Google Scholar] [CrossRef]
- Ma, G.; Yang, D.; Wang, K.; Han, J.; Ding, S.; Song, G.; Nie, J. Organic-soluble chitosan/polyhydroxybutyrate ultrafine fibers as skin regeneration prepared by electrospinning. J. Appl. Polym. Sci. 2010, 118, 3619–3624. [Google Scholar] [CrossRef]


| Sample | Tonset 1, °C | Td,1, °C | Weight Loss Rate, %/°C | Tonset 2, °C | Td,2, °C | Weight Loss Rate, %/°C |
|---|---|---|---|---|---|---|
| PHB pellet | 265.3 | 285.3 | 6.1 | |||
| PHB fiber (8%) | 228.9 | 251.4 | 5.6 | |||
| PHB 8% + PEG 1% | 224.3 | 244.7 | 4.5 | 377.0 | 396.6 | 0.3 |
| PHB 8% + PEG 2% | 224.2 | 243.3 | 4.0 | 381.7 | 408.6 | 0.6 |
| PHB 8% + PEG 3% | 222.3 | 241.8 | 3.1 | 383.0 | 408.7 | 0.8 |
| PHB 8% + PEG 4% | 219.8 | 237.3 | 3.0 | 381.9 | 409.5 | 1.0 |
| PEG pellet | - | - | - | 388.8 | 411.7 | 3.5 |
| Sample | Tg, °C | Tm,PEG, °C | ΔHm,PEG, J/g | Tm,PHB, °C | ΔHm,PHB, J/g | ΧDSC, % | |||
|---|---|---|---|---|---|---|---|---|---|
| PEG | PHB | ||||||||
| First heating | |||||||||
| PHB pellet | 1.4 | - | - | 125.4 | 142.3 | 56.0 | - | 38.3 | |
| PHB fiber (8%) | 3.8 | - | - | 110.8 | 133.0 | 39.0 | - | 26.7 | |
| PHB (8%) + PEG (1%) | −1.0 | - | 62.2 | 17.0 | 115.1 | 136.3 | 35.1 | 72.4 | 27.1 |
| PHB (8%) + PEG (2%) | −0.1 | 55.1 | 60.4 | 38.4 | 112.2 | 133.0 | 31.5 | 90.8 | 26.9 |
| PHB (8%) + PEG (3%) | −1.1 | 55.7 | 61.6 | 53.0 | 111.0 | 131.5 | 29.1 | 92.0 | 27.4 |
| PHB (8%) + PEG (4%) | 3.5 | 55.5 | 62.3 | 65.0 | 112.8 | 133.0 | 26.2 | 92.2 | 26.9 |
| PEG pellet | - | 70.5 | 211.4 | - | - | 100 | - | ||
| Second heating | |||||||||
| Pellet PHB | 0.1 | - | - | - | 128.4 | 142.5 | 43.5 | - | 29.8 |
| PHB fiber (8%) | −2.7 | - | - | - | 121.7 | 135.3 | 44.1 | - | 28.2 |
| PHB (8%)/PEG (1%) | −5.0 | 53.8 | 60.4 | 8.0 | 121.8 | 134.7 | 34.4 | 33.9 | 29.9 |
| PHB (8%)/PEG (2%) | −3.9 | 54.3 | 61.8 | 35.5 | 124.6 | 136.7 | 34.3 | 83.9 | 28.4 |
| PHB (8%)/PEG (3%) | −3.1 | 54.8 | 61.9 | 49.3 | 119.7 | 133.0 | 30.4 | 85.5 | 28.5 |
| PHB (8%)/PEG (4%) | −1.3 | 55.5 | 62.7 | 60.4 | 118.1 | 131.8 | 27.0 | 85.7 | 28.5 |
| Pellet PEG | - | 67.3 | 200.7 | - | 100 | - | |||
| Sample Code | Tc,PEG, °C | ΔHc,PEG, J/g | Tc,PHB, °C | ΔHc,PHB, J/g |
|---|---|---|---|---|
| Pellet PHB | - | - | 89.8 | 40.1 |
| PHB (8%) | - | - | 92.2 | 44.6 |
| PHB (8%)/PEG (1%) | −24.7 | 7.4 | 92.9 | 44.7 |
| PHB (8%)/PEG (2%) | −19.1 | 16.2 | 93.0 | 32.1 |
| PHB (8%)/PEG (3%) | −21.6 | 5.4 | 90.2 | 28.3 |
| 32.2 | 28.7 | |||
| PHB (8%)/PEG (4%) | −21.6 | 2.7 | 88.8 | 23.3 |
| 37.0 | 44.0 | |||
| Pellet PEG | 42.6 | 196.7 | - | - |
| Sample Code | XXRD, % | XDSC, % |
|---|---|---|
| PHB (8%) | 28.9 | 26.7 |
| PHB (8%)/PEG (1%) | 17.5 | 27.1 |
| PHB (8%)/PEG (2%) | 18.1 | 26.9 |
| PHB (8%)/PEG (3%) | 26.8 | 27.4 |
| PHB (8%)/PEG (4%) | 29.0 | 26.9 |
| Sample Code | Average Density, g/cm3 | Porosity, % |
|---|---|---|
| PHB (8%) | 1.190 | 62.91 |
| PHB (8%)/PEG (1%) | 1.192 | 63.95 |
| PHB (8%)/PEG (2%) | 1.194 | 55.73 |
| PHB (8%)/PEG (3%) | 1.195 | 70.24 |
| PHB (8%)/PEG (4%) | 1.197 | 70.33 |
| Sample Code | Tensile Strength (σ), MPa | Young’s Modulus, E (MPa) | Elongation at Break (%) |
|---|---|---|---|
| PHB (8%) | 3.6 ± 0.2 | 232.3 ± 28.7 | 58 ± 21 |
| PHB (8%)/PEG (1%) | 3.4 ± 0.3 | 254.4 ± 26.7 | 24 ± 6 |
| PHB (8%)/PEG (2%) | 4.4 ± 0.8 | 332.2 ± 89.3 | 9 ± 5 |
| PHB (8%)/PEG (3%) | 3.2 ± 0.3 | 267.7 ± 33.8 | 14 ± 9 |
| PHB (8%)/PEG (4%) | 2.9 ± 0.2 | 242.3 ± 29.4 | 3 ± 1 |
Disclaimer/Publisher’s Note: The statements, opinions and data contained in all publications are solely those of the individual author(s) and contributor(s) and not of MDPI and/or the editor(s). MDPI and/or the editor(s) disclaim responsibility for any injury to people or property resulting from any ideas, methods, instructions or products referred to in the content. |
© 2023 by the authors. Licensee MDPI, Basel, Switzerland. This article is an open access article distributed under the terms and conditions of the Creative Commons Attribution (CC BY) license (https://creativecommons.org/licenses/by/4.0/).
Share and Cite
Thanh, N.H.; Olekhnovich, R.; Sitnikova, V.; Kremleva, A.; Snetkov, P.; Uspenskaya, M. PHB/PEG Nanofiber Mat Obtained by Electrospinning and Their Performances. Technologies 2023, 11, 48. https://doi.org/10.3390/technologies11020048
Thanh NH, Olekhnovich R, Sitnikova V, Kremleva A, Snetkov P, Uspenskaya M. PHB/PEG Nanofiber Mat Obtained by Electrospinning and Their Performances. Technologies. 2023; 11(2):48. https://doi.org/10.3390/technologies11020048
Chicago/Turabian StyleThanh, Nguyen Hong, Roman Olekhnovich, Vera Sitnikova, Arina Kremleva, Petr Snetkov, and Mayya Uspenskaya. 2023. "PHB/PEG Nanofiber Mat Obtained by Electrospinning and Their Performances" Technologies 11, no. 2: 48. https://doi.org/10.3390/technologies11020048