
Increasing System Reliability by Applying Conceptual Modeling and Data Analysis—A Case Study: An Automated Parking System


Abstract
:1. Introduction
1.1. Reliability Engineering
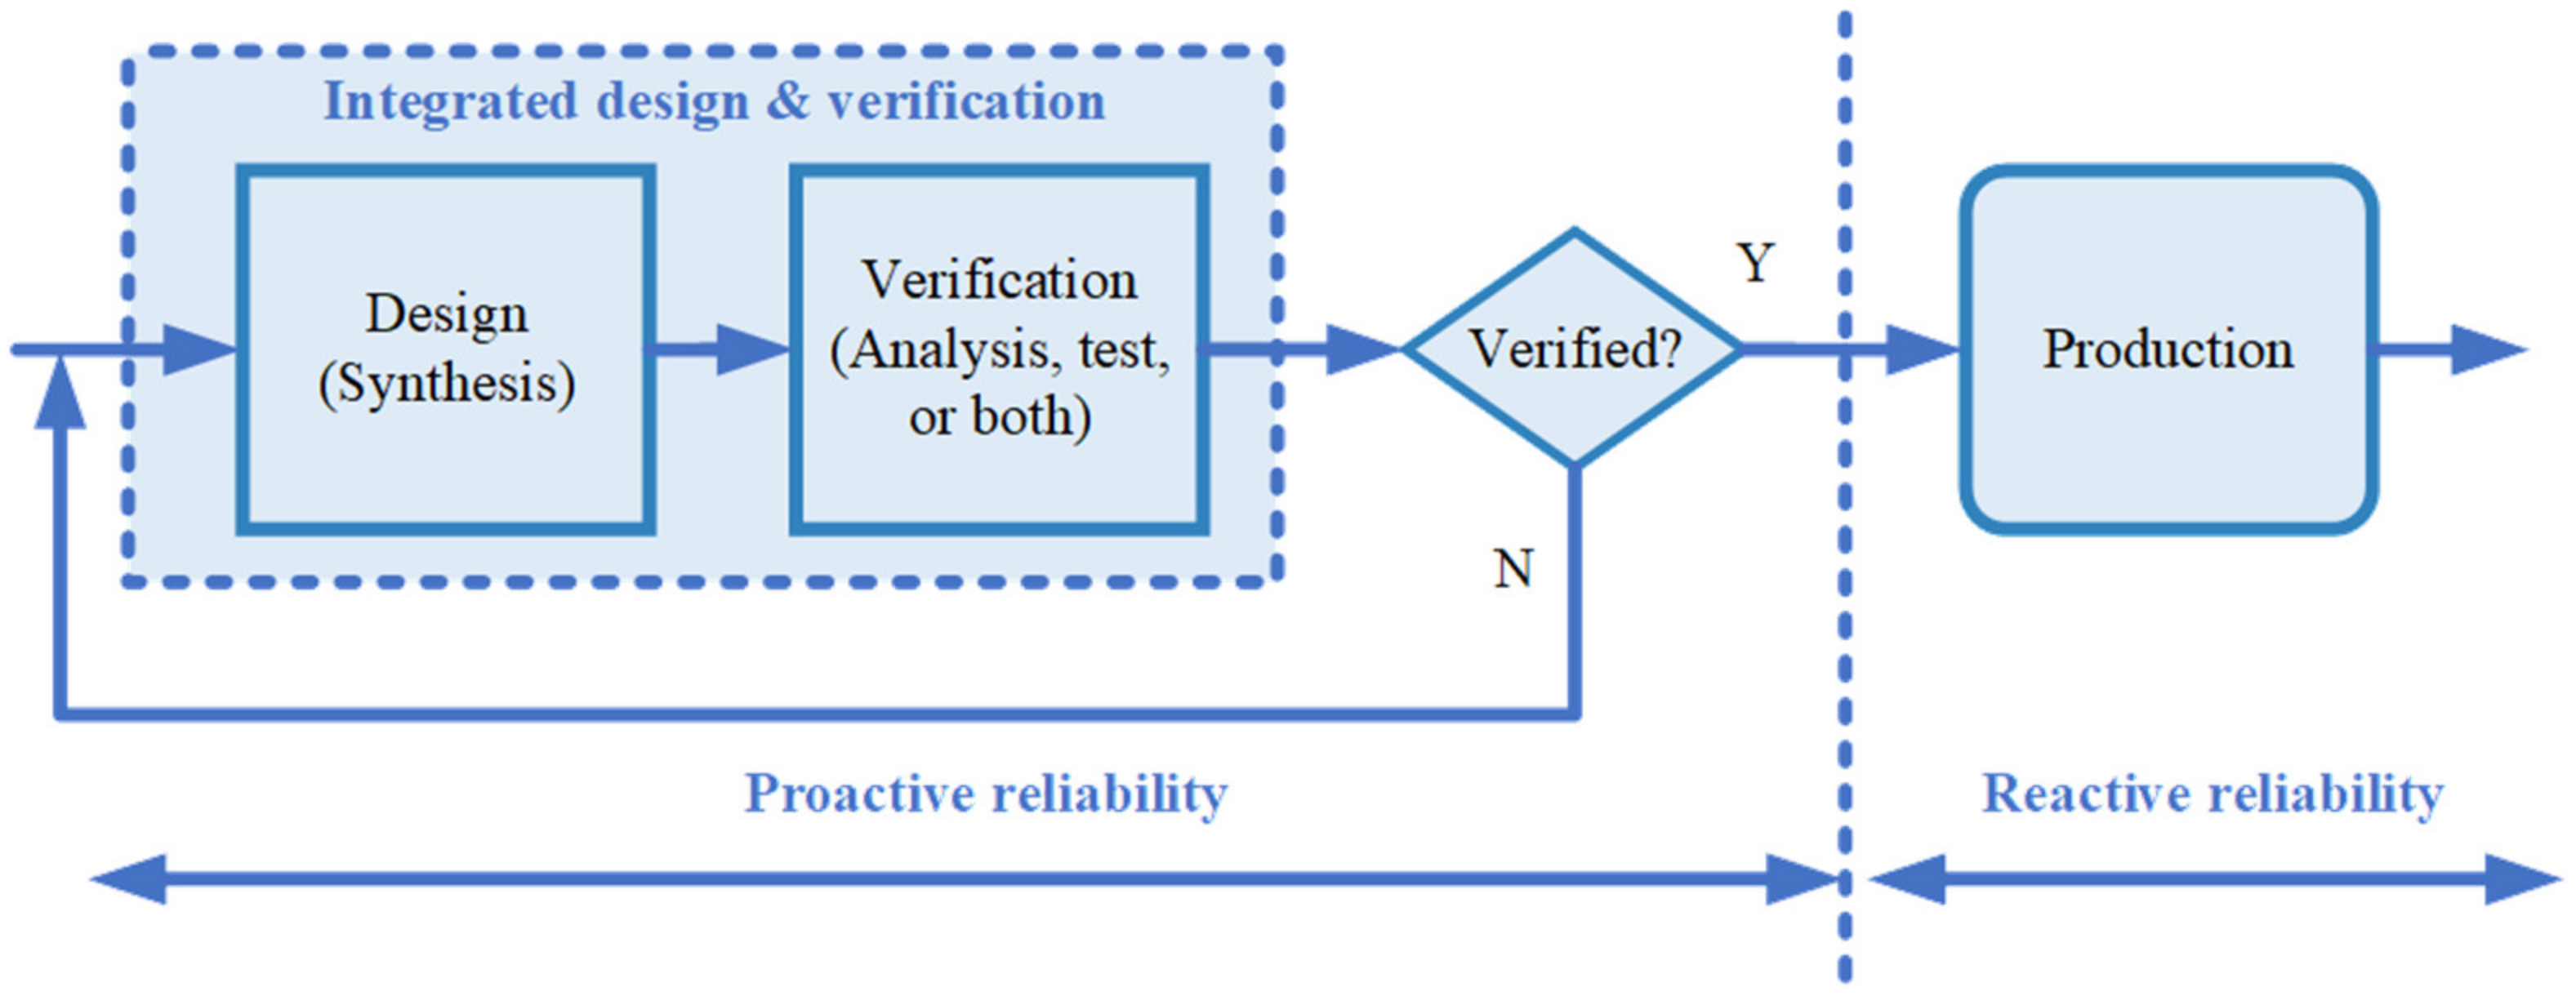
- Data from the design synthesis;
- Testing and analysis from the verification process;
- Published information (literature);
- Expert opinion;
- System operation data;
- Failure data.
1.2. Failure Data
- Increases knowledge regarding a system’s design and manufacturing deficiencies;
- Supports the estimation of the reliability, availability, system failure rate, and Mean Time between Failures (MTBF);
- Improves reliability by implementing design change recommendations;
- Aids data-driven decision making using design reviews;
- Supports determining systems’ maintenance needs and their parts;
- Assist in conducting reliability and life cycle cost trade-off studies.
1.3. Environmental Data
1.4. Data Sensemaking Using Data Analysis
1.5. Conceptual Modeling
1.6. Introduction to the Company: Where Research Takes Place
- RQ1: How can conceptual modeling and data analysis enhance product developers’ understanding of the system?
- RQ2: How conceptual modeling facilitate data identification to increase a system’s reliability?
- RQ3: What are effective conceptual models for facilitating product developers’ understanding of an APS?
2. Literature Review
2.1. Reliability Engineering
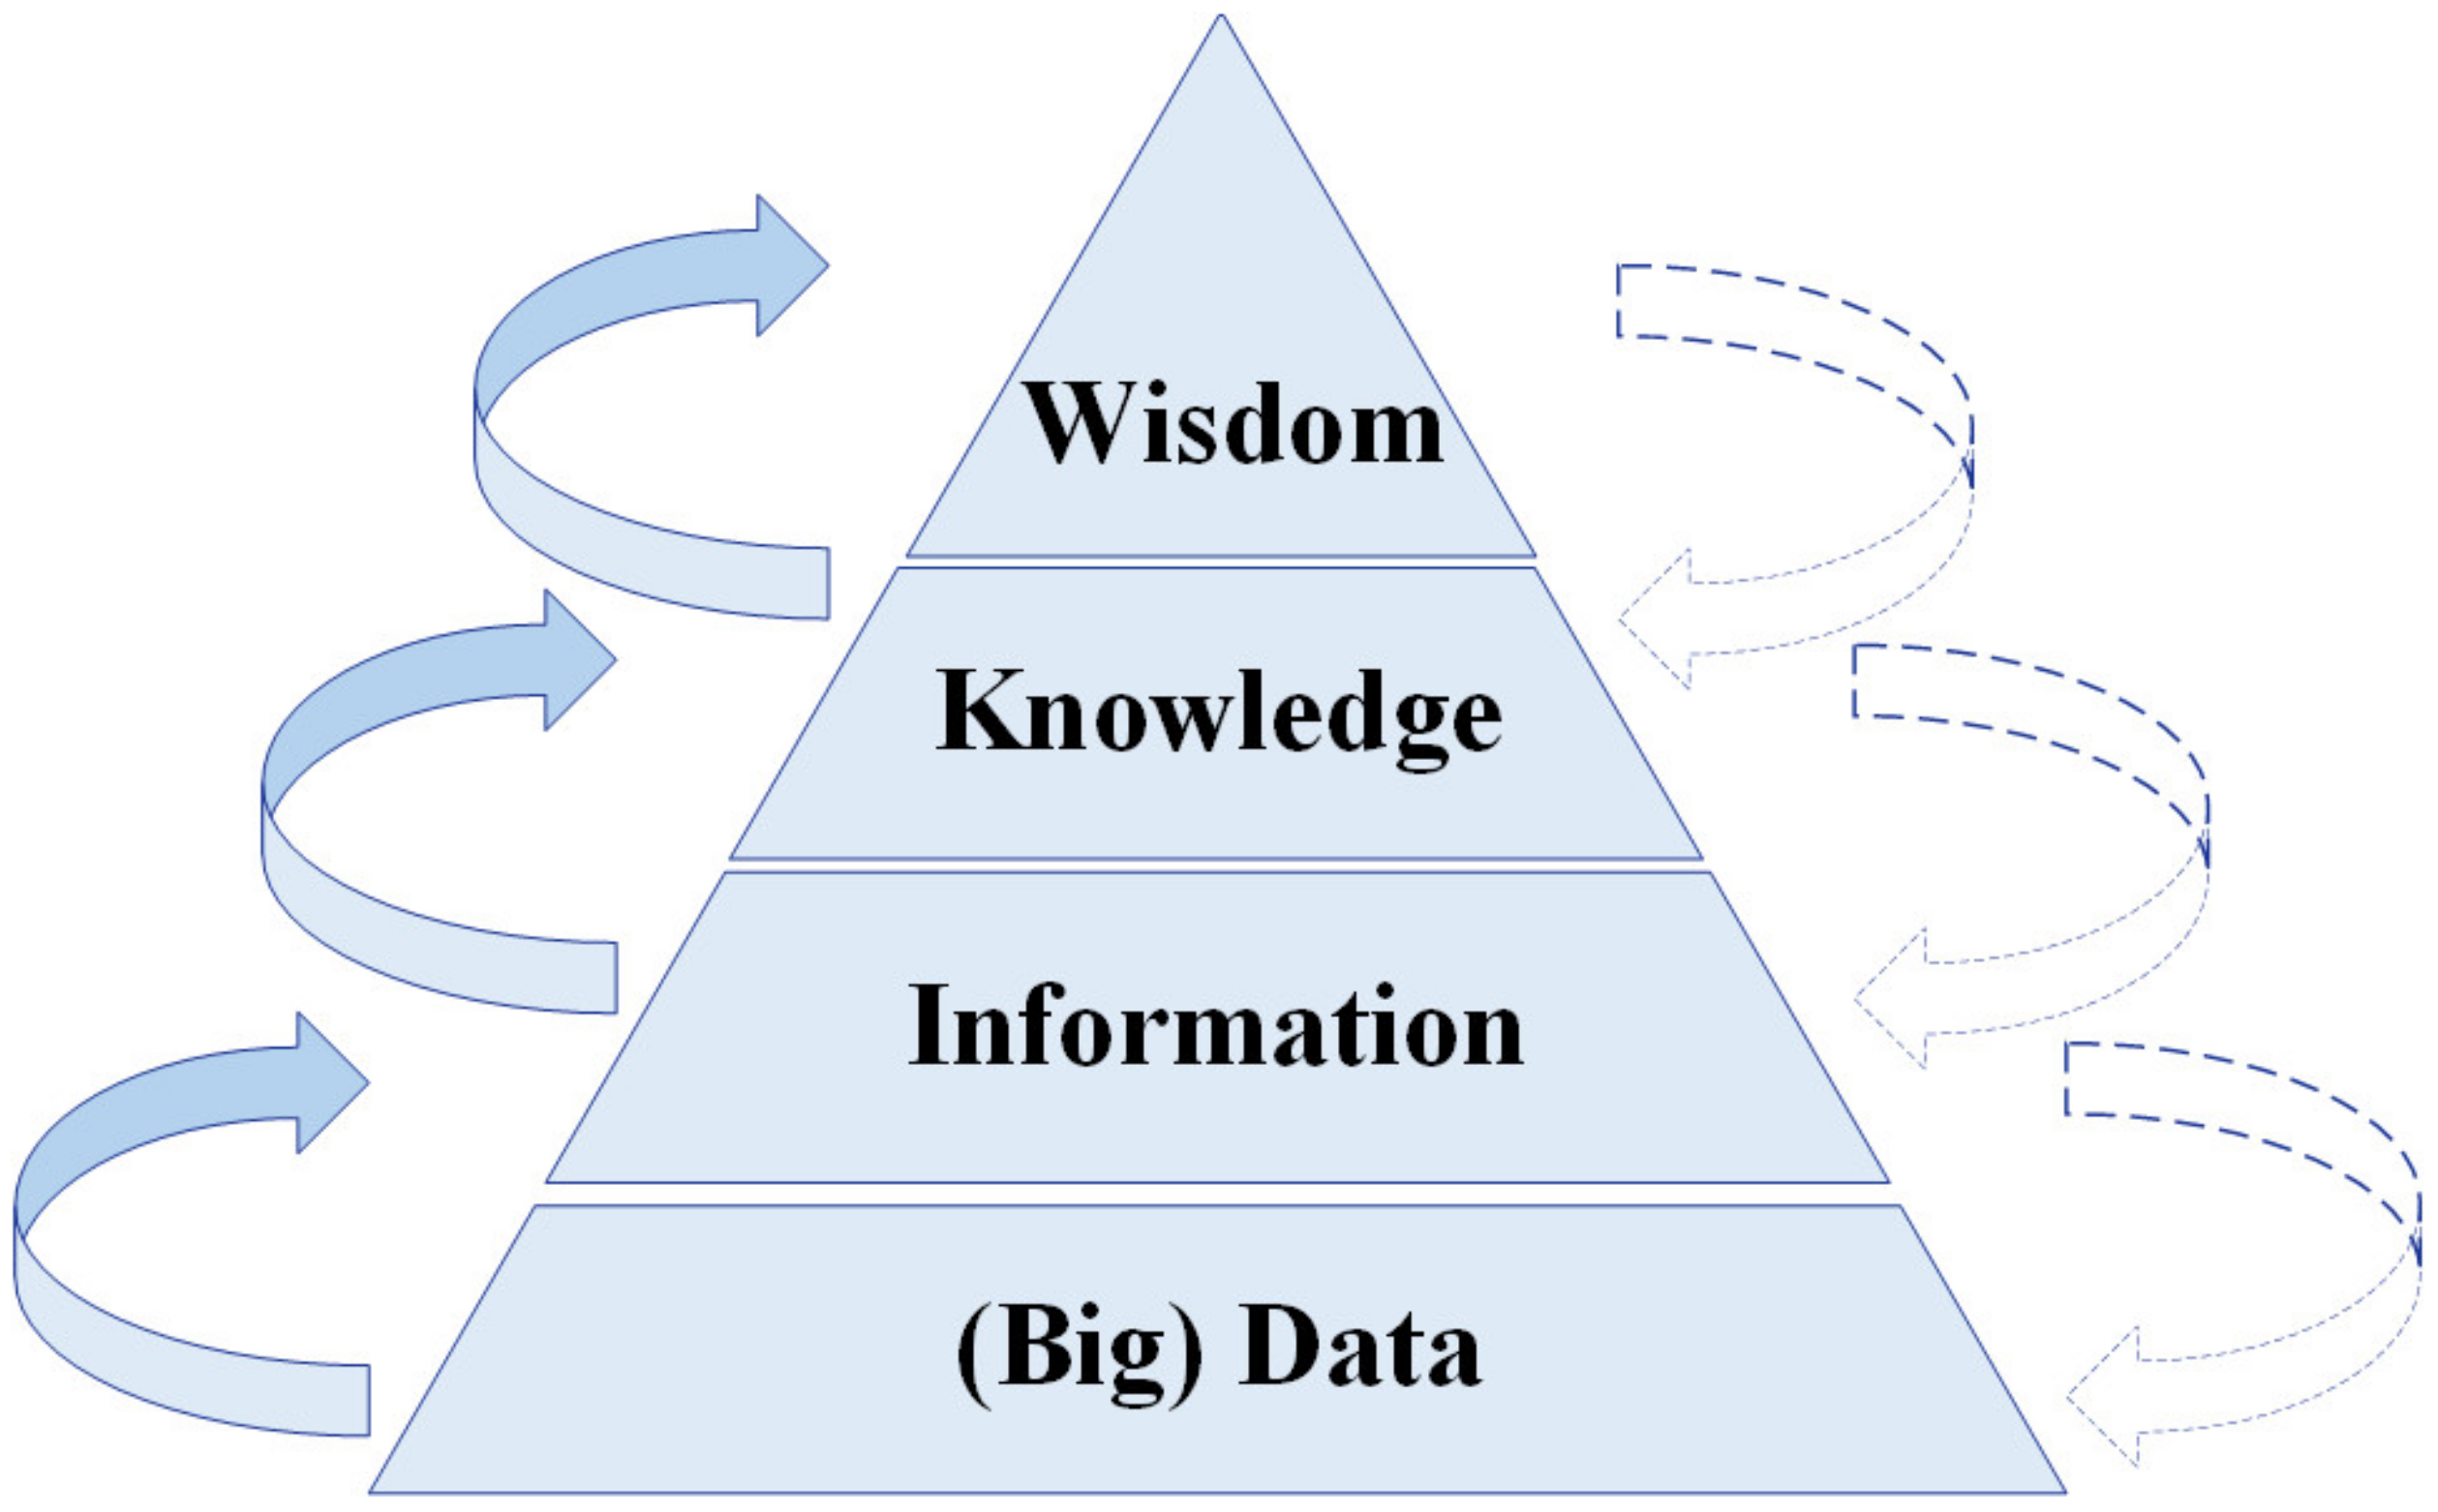
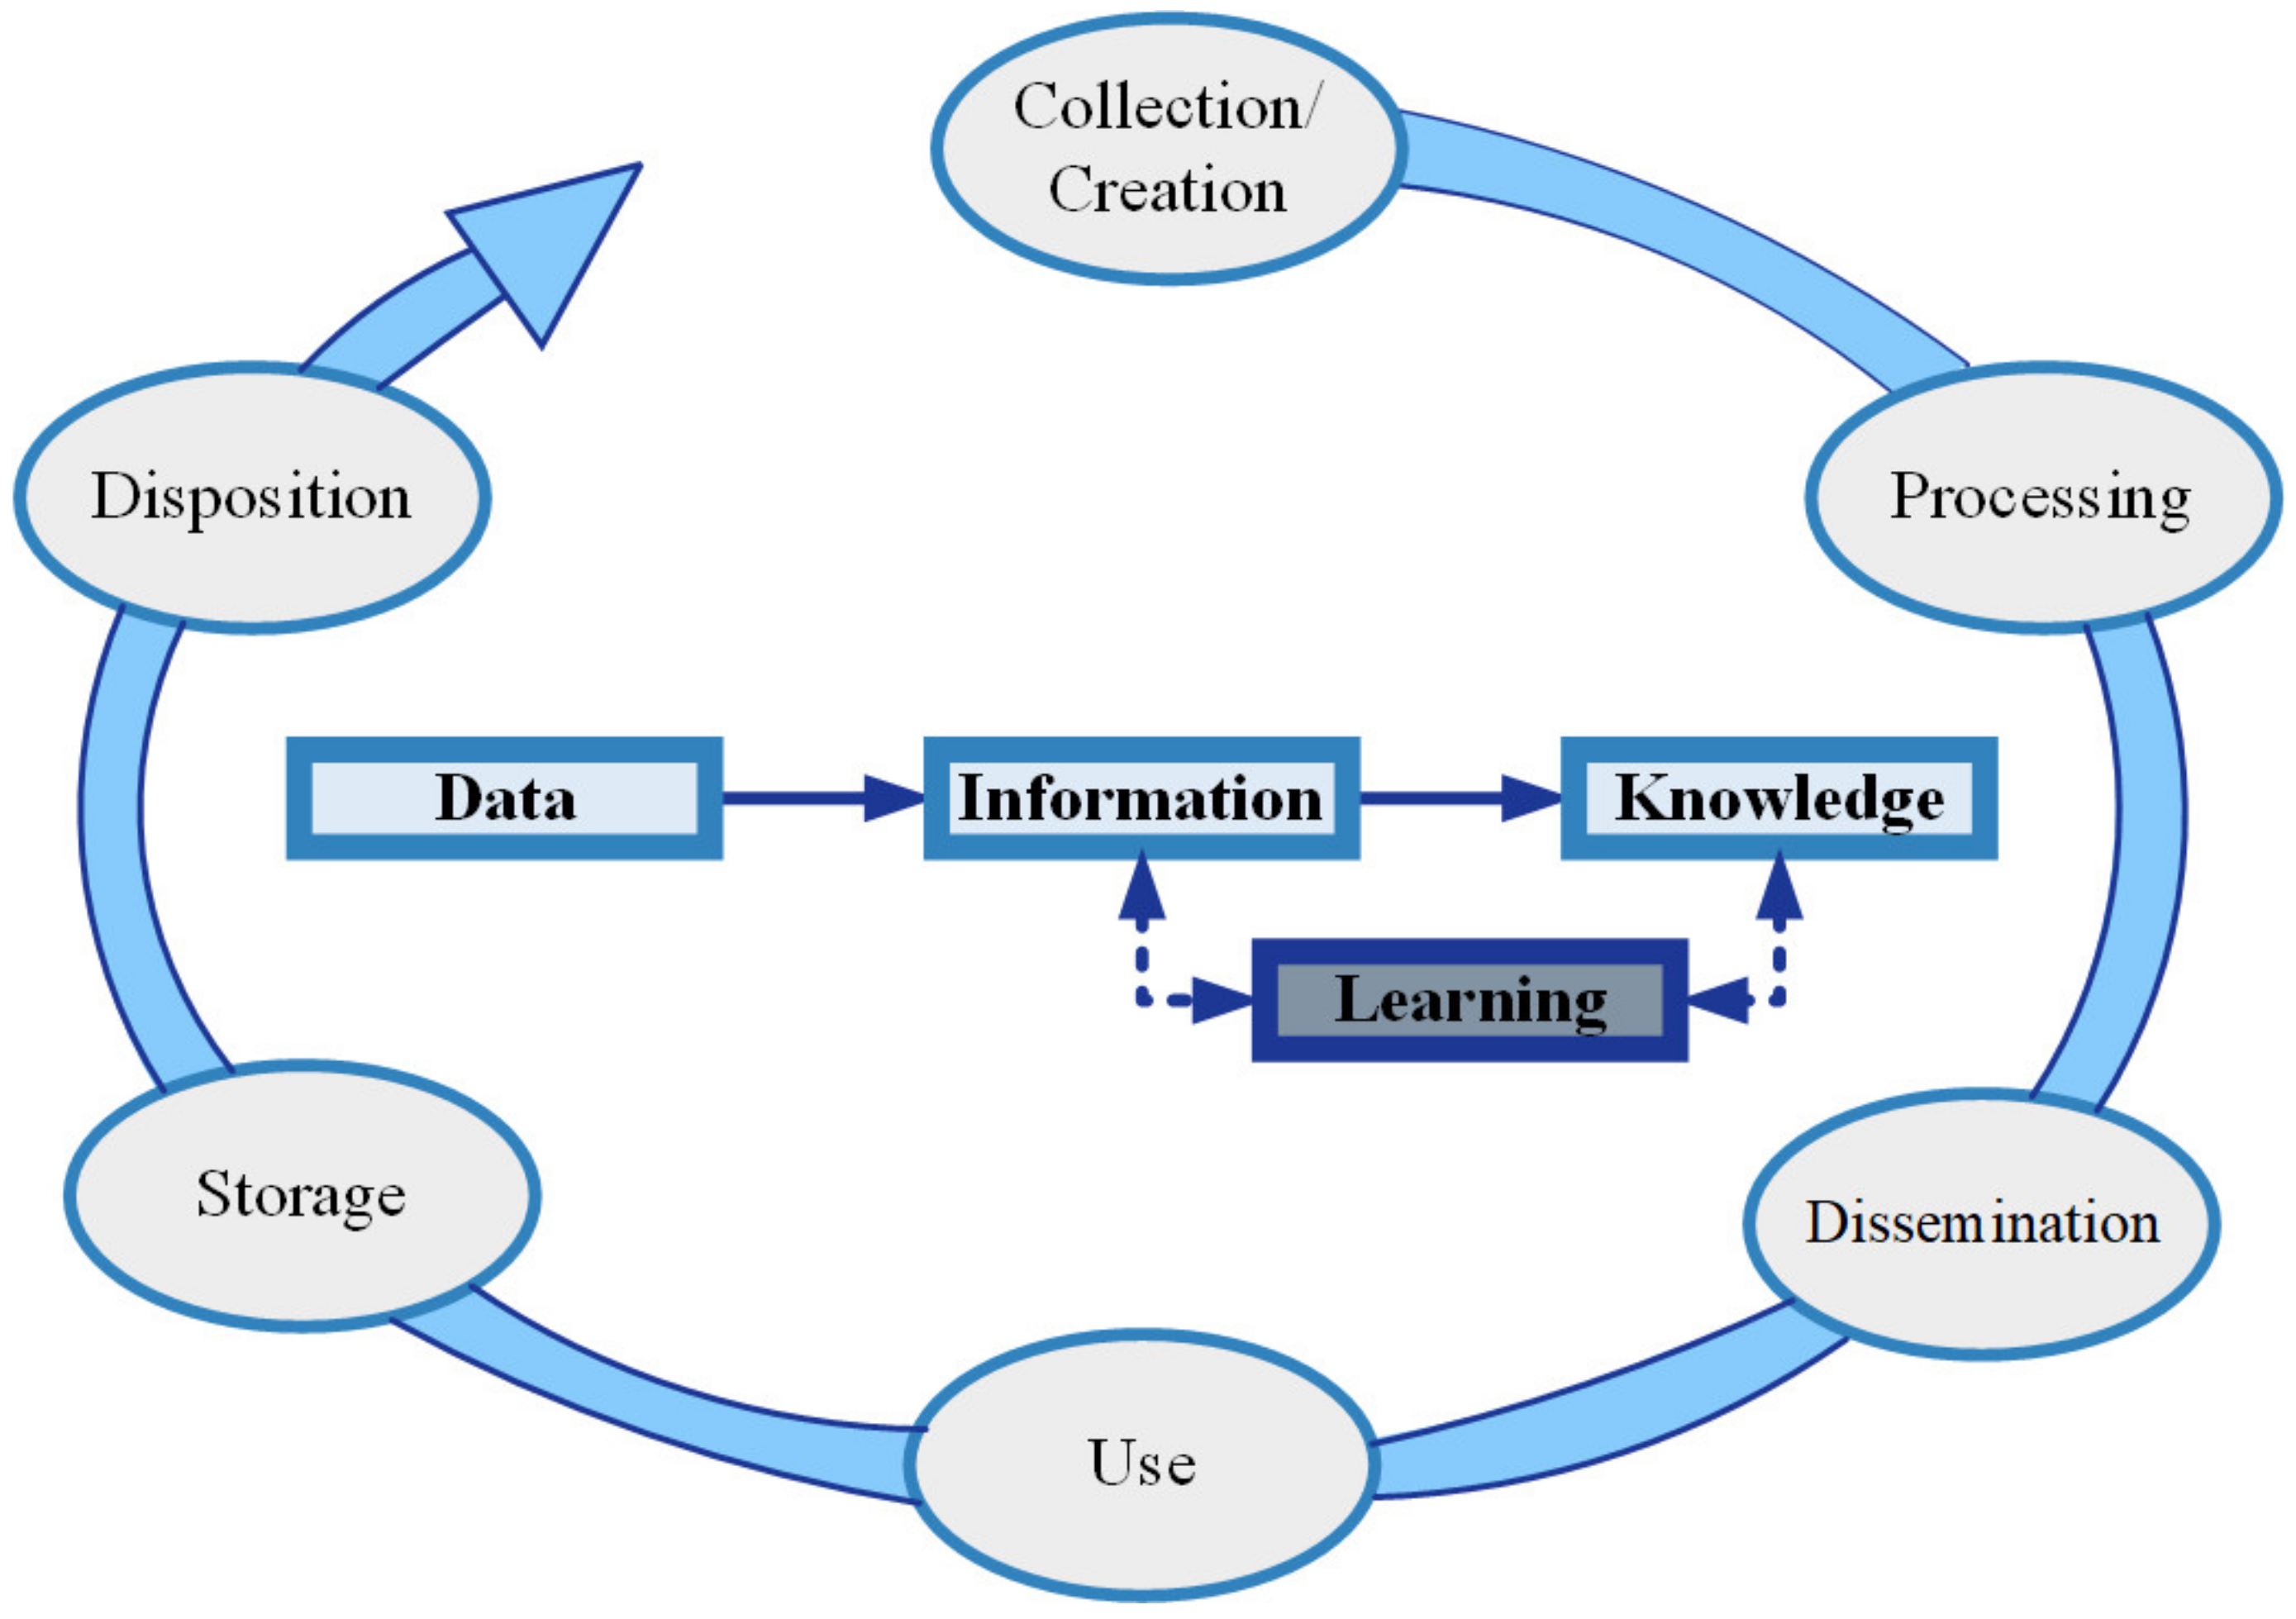
2.2. The Knowledge Framework: Data, Information, Knowledge, and Wisdom
2.3. Conceptual Modelling
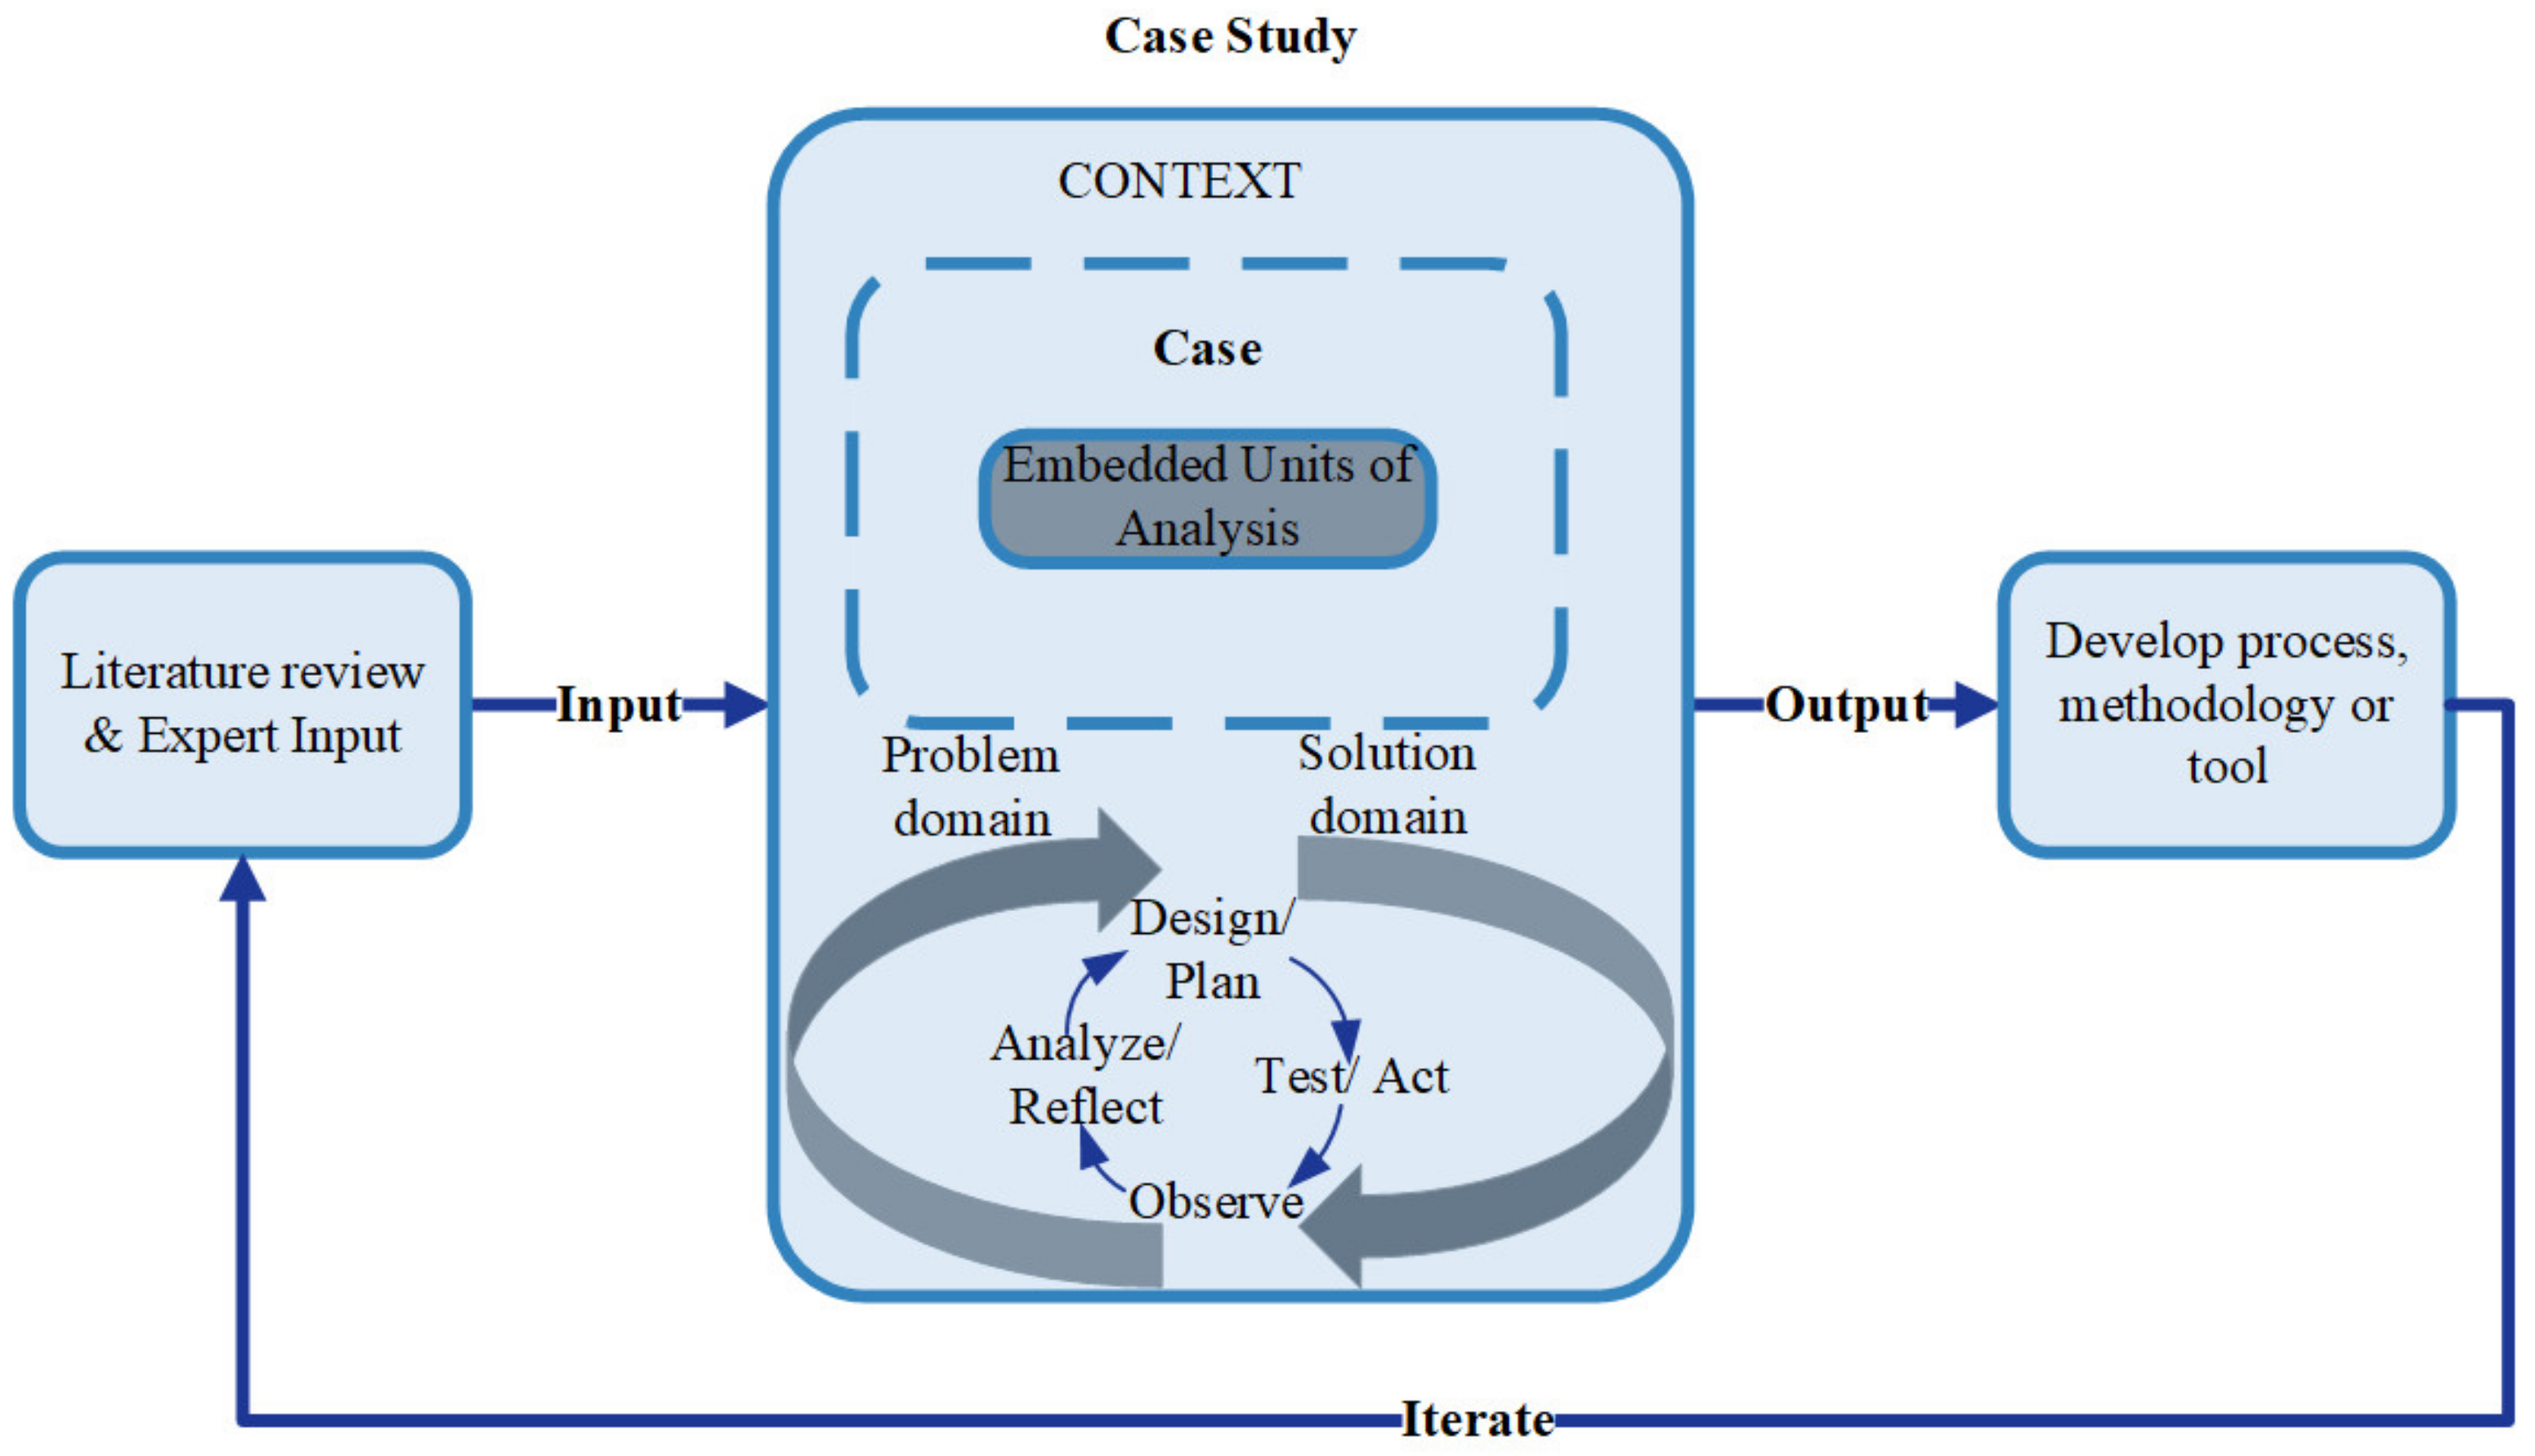
3. Methods
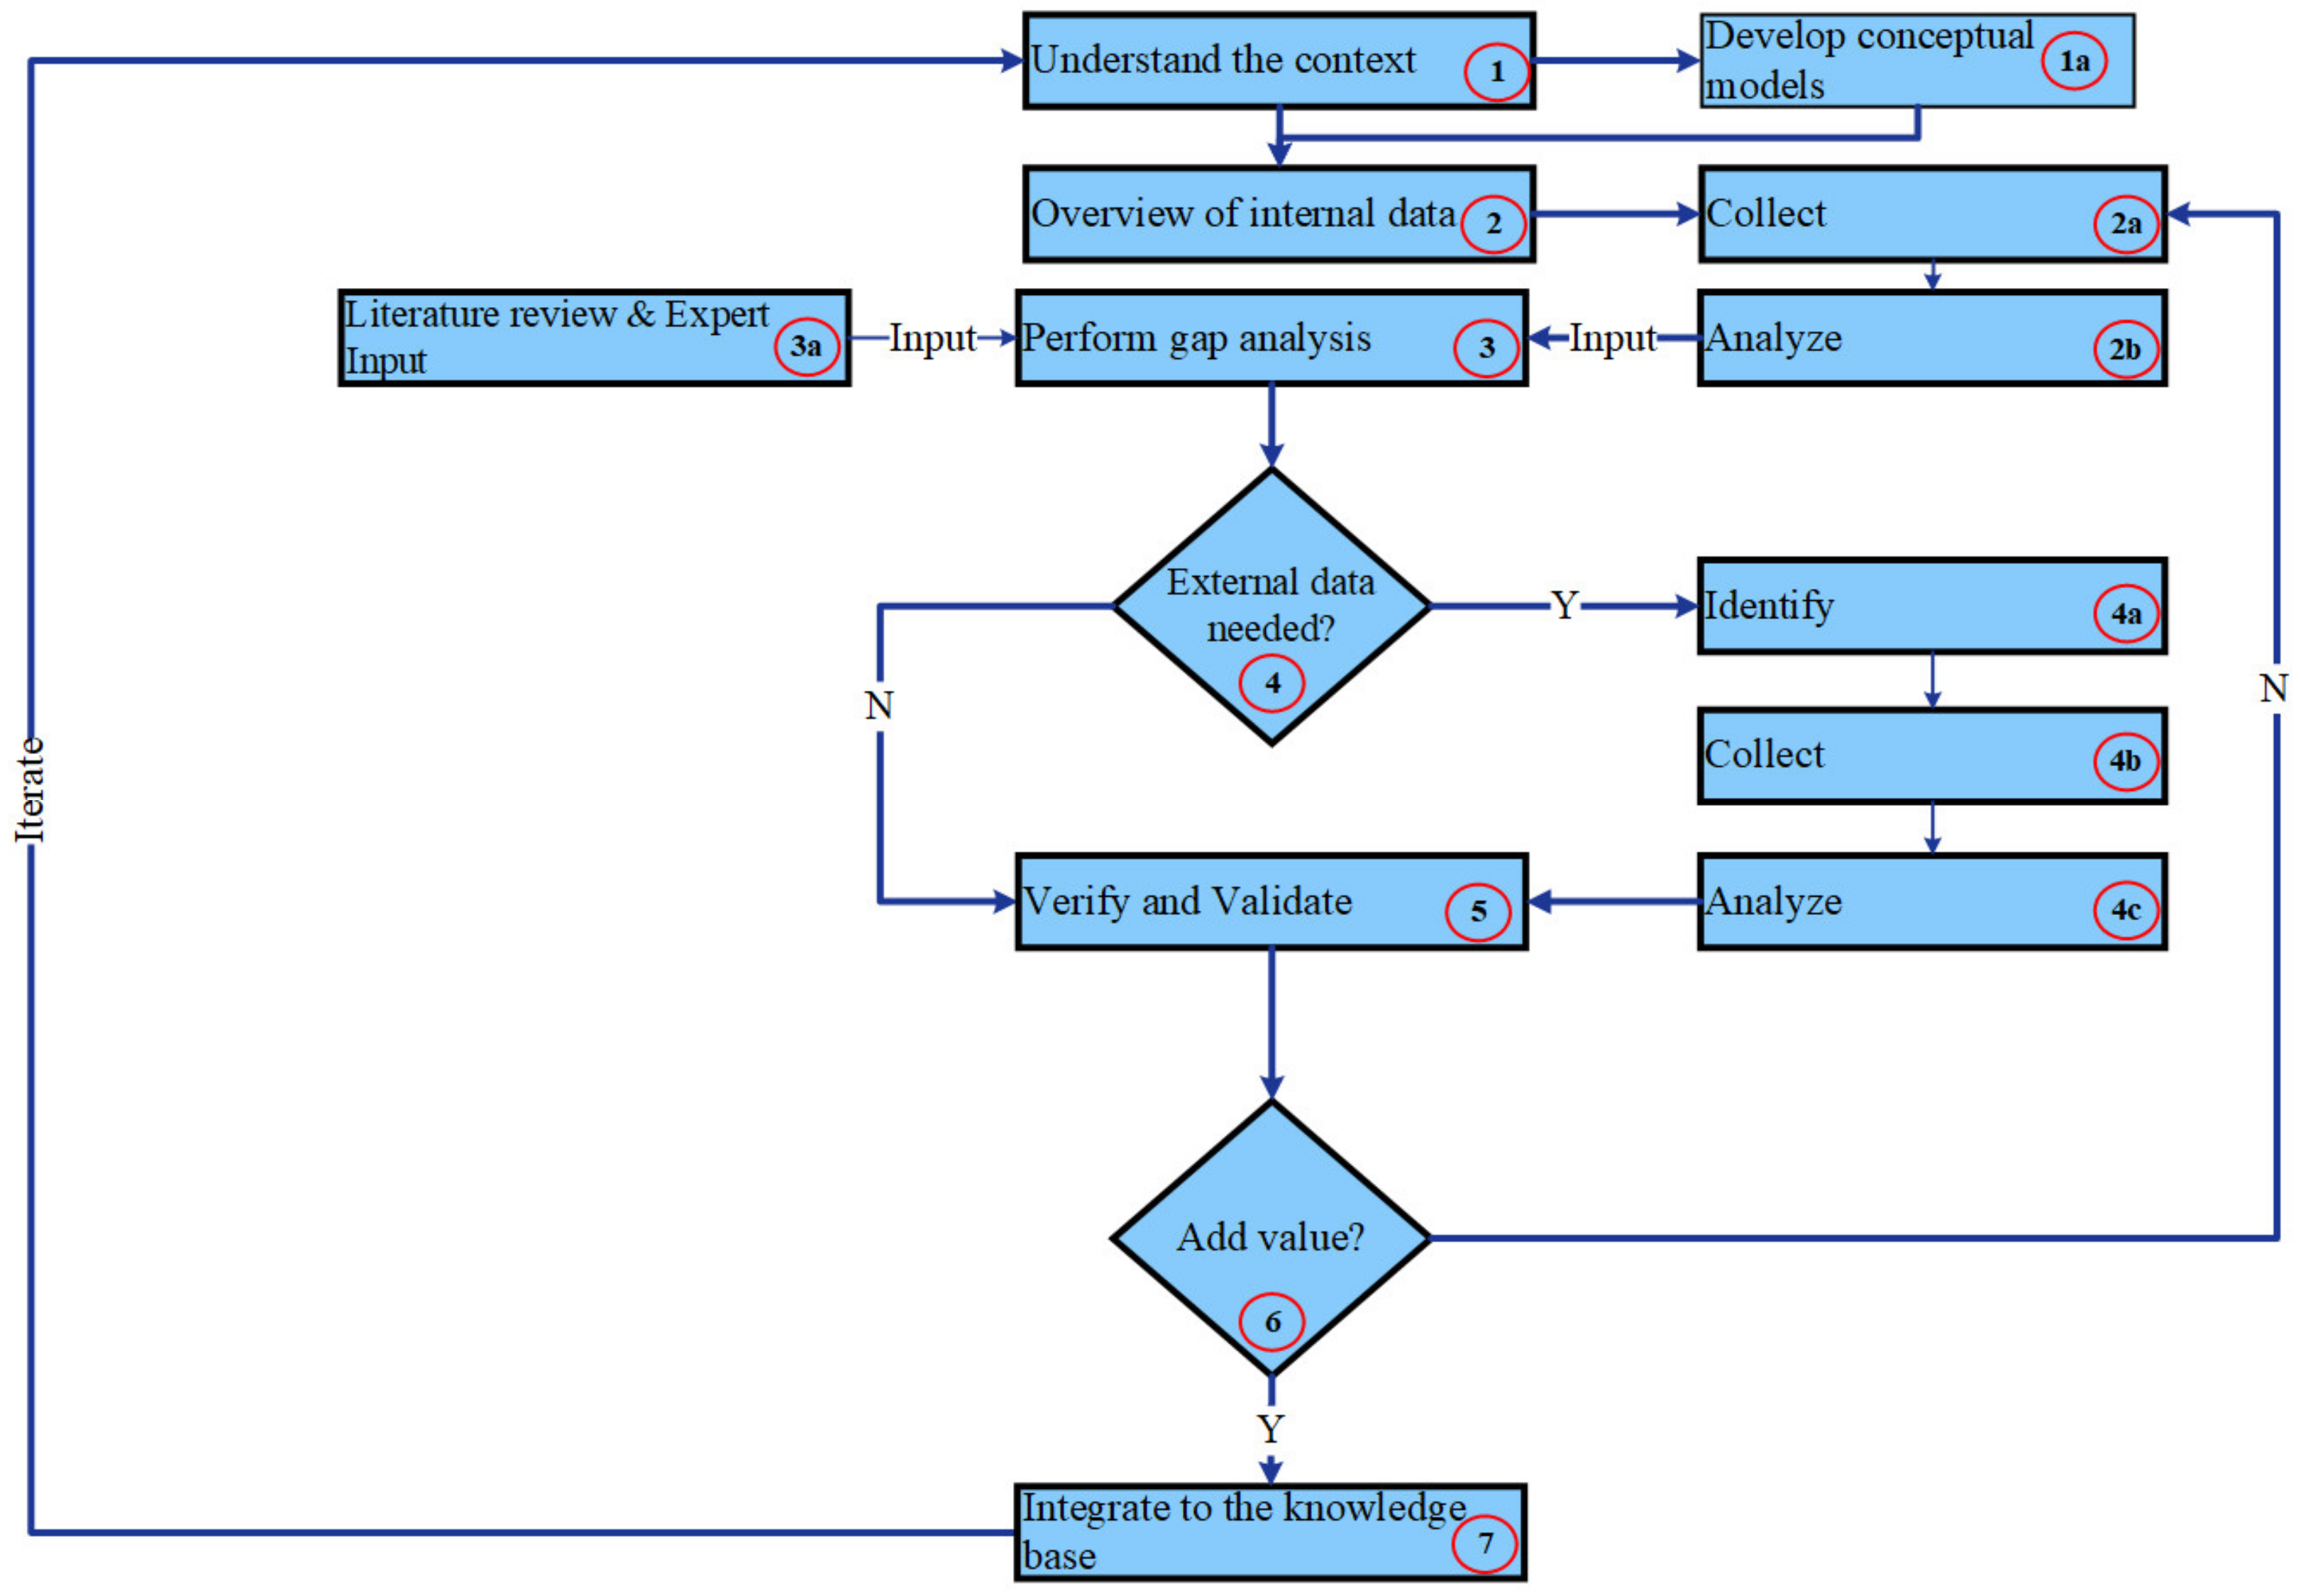
- Understand the context. We started by understanding the context. This understanding includes an understanding of the SOI and its life cycle, including the PD process, focusing on the early phase. This step includes the following sub-step:
- Develop conceptual models. In this step (1a), we developed conceptual models to communicate the context understanding and validate it at the first iteration using interviews and workshops. We developed other conceptual models in successive iterations based on the results of the data analysis. These conceptual models also guided the data analysis in an iterative and recursive manner. In other words, we used conceptual modeling as an input for the data analysis and vice versa. We conducted all processes in several iterations until conceptual modeling and data analysis were harmonized. For instance, we developed conceptual modeling such as end-user’s workflow and maintenance process functional analyses to achieve a shared understanding of the context, including a system’s reliability and its consequences in terms of time and cost. The focus on systems’ reliability is a result of the data analysis, which explored inferior system reliability.
- Overview of internal data. In this step, we aimed to have an overview of the stored internal data (physical artifacts) within the company. We identified all possible data sources within the PD process. This identification results from developing conceptual models alongside the research data collection. The data sources we identified include failure data, design data, and in-system data. This step includes the following sub-steps:
- Collect. In this step (2a), we collected the available stored internal data. In this context, we collected the failure data as feedback data.
- Analyze. In this step (2b), we analyzed the collected internal data, mainly failure. The data analysis’s results are inputs for the gap analysis.
- Perform gap analysis. In this step, we performed a gap analysis. The gap we identified is the need for feedback data in the early phase of the PD process, such as failure data. This step includes the following sup-step:
- Literature review and expert input. The failure data analysis results, alongside the input from the literature review and subject-matter expert are the inputs for the gap analysis. The experts include practitioners from the industry and domain scholars from academia.
- Decision gate: External data needed? After analyzing failure data (internal data), we have a decision gate to decide if we need external data to investigate patterns and trends or form an explanation with failure events. The decision was yes at this step. Thus, we performed the following sup-steps:
- Identify. In this step (4a), we identified a need for weather data based on internal data analysis’s results and subject-matter experts from the company and domain scholars.
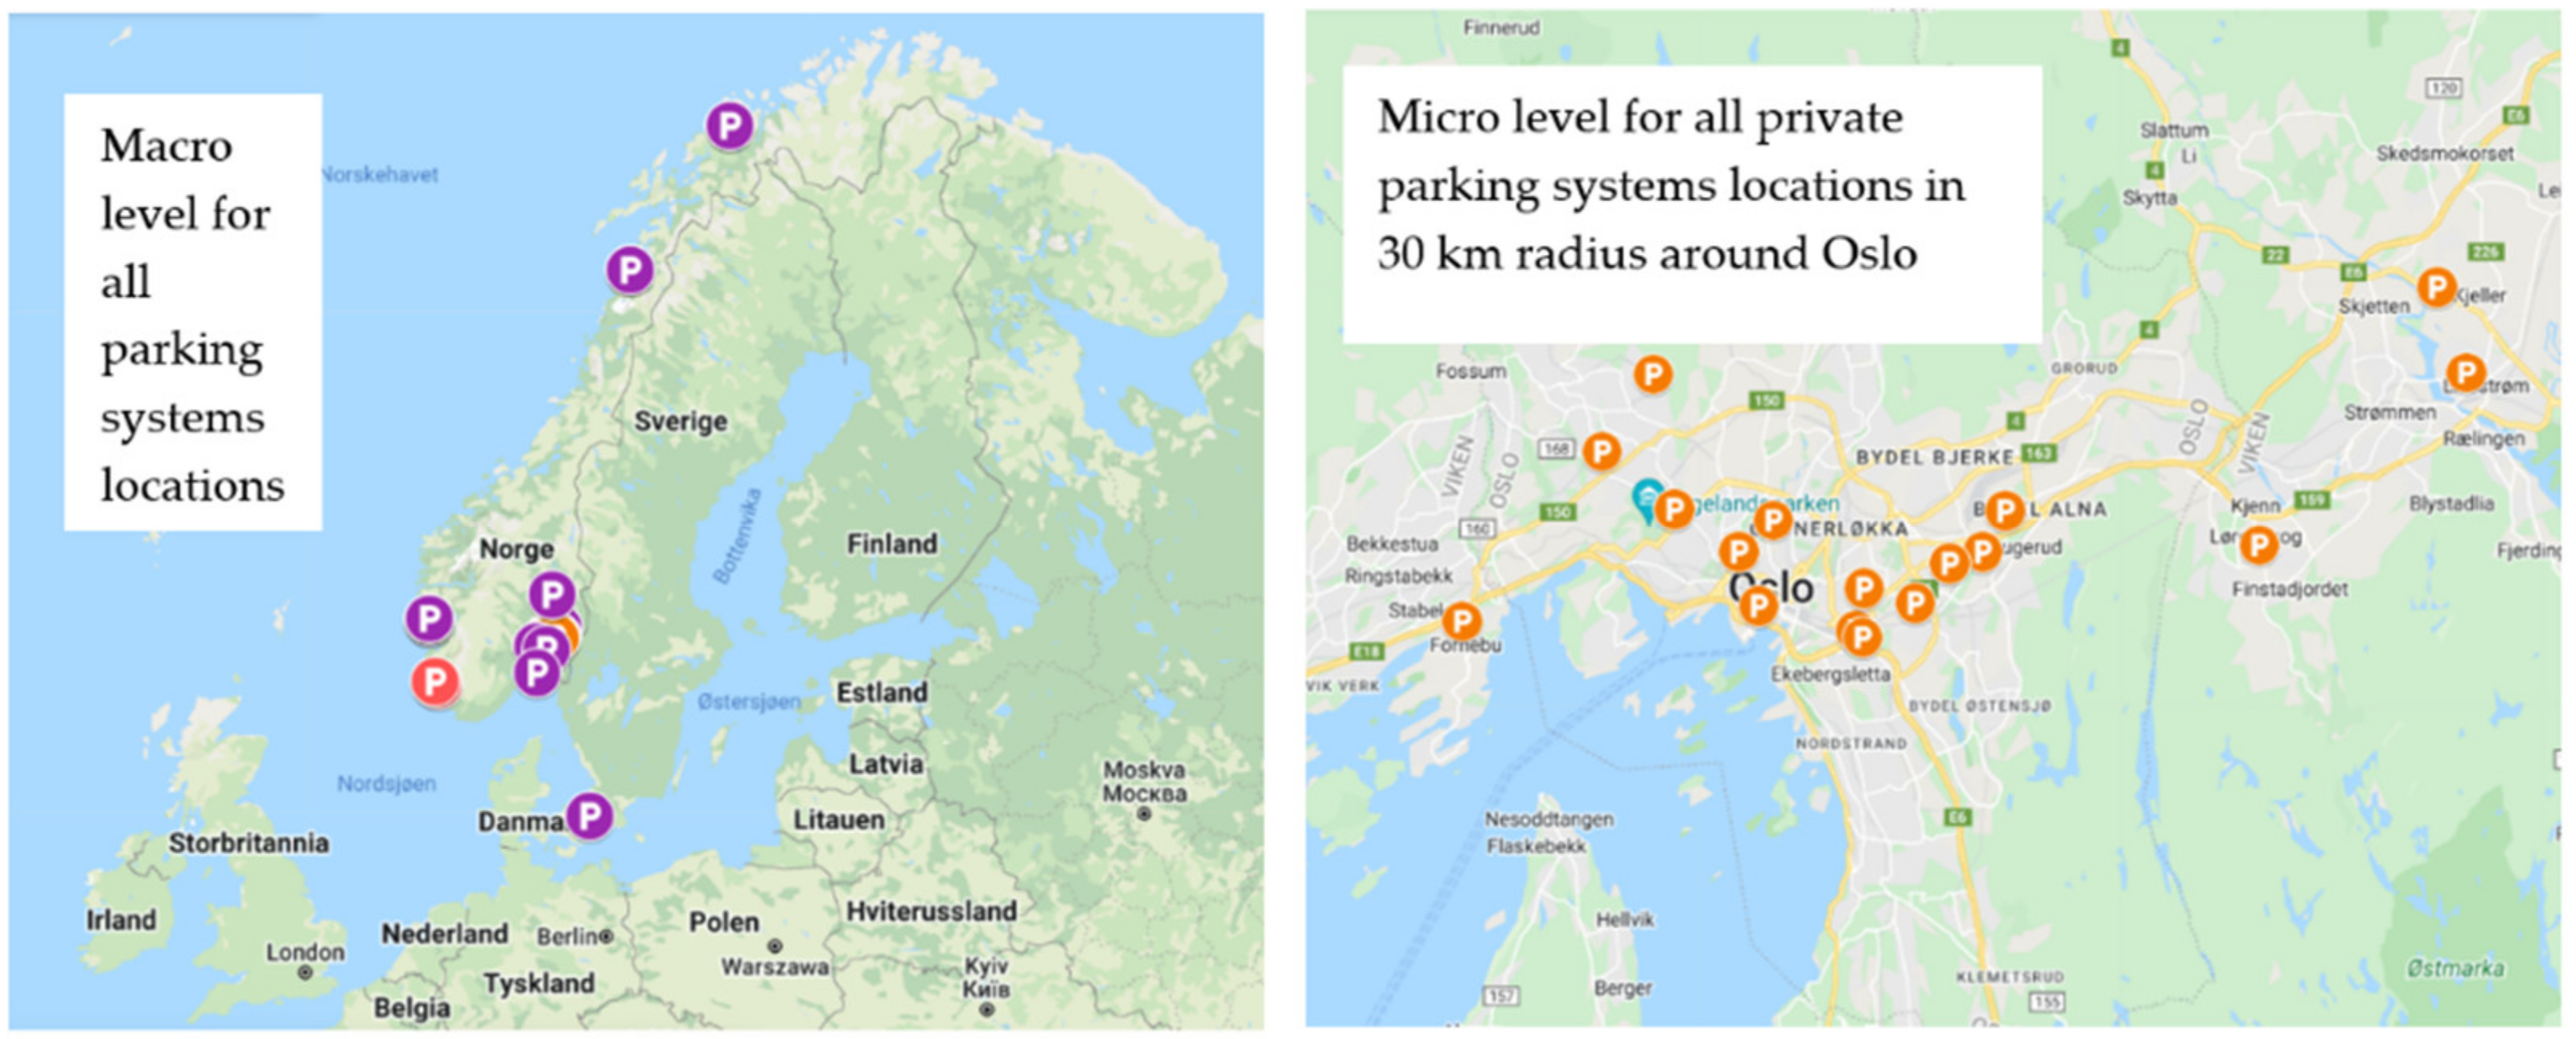
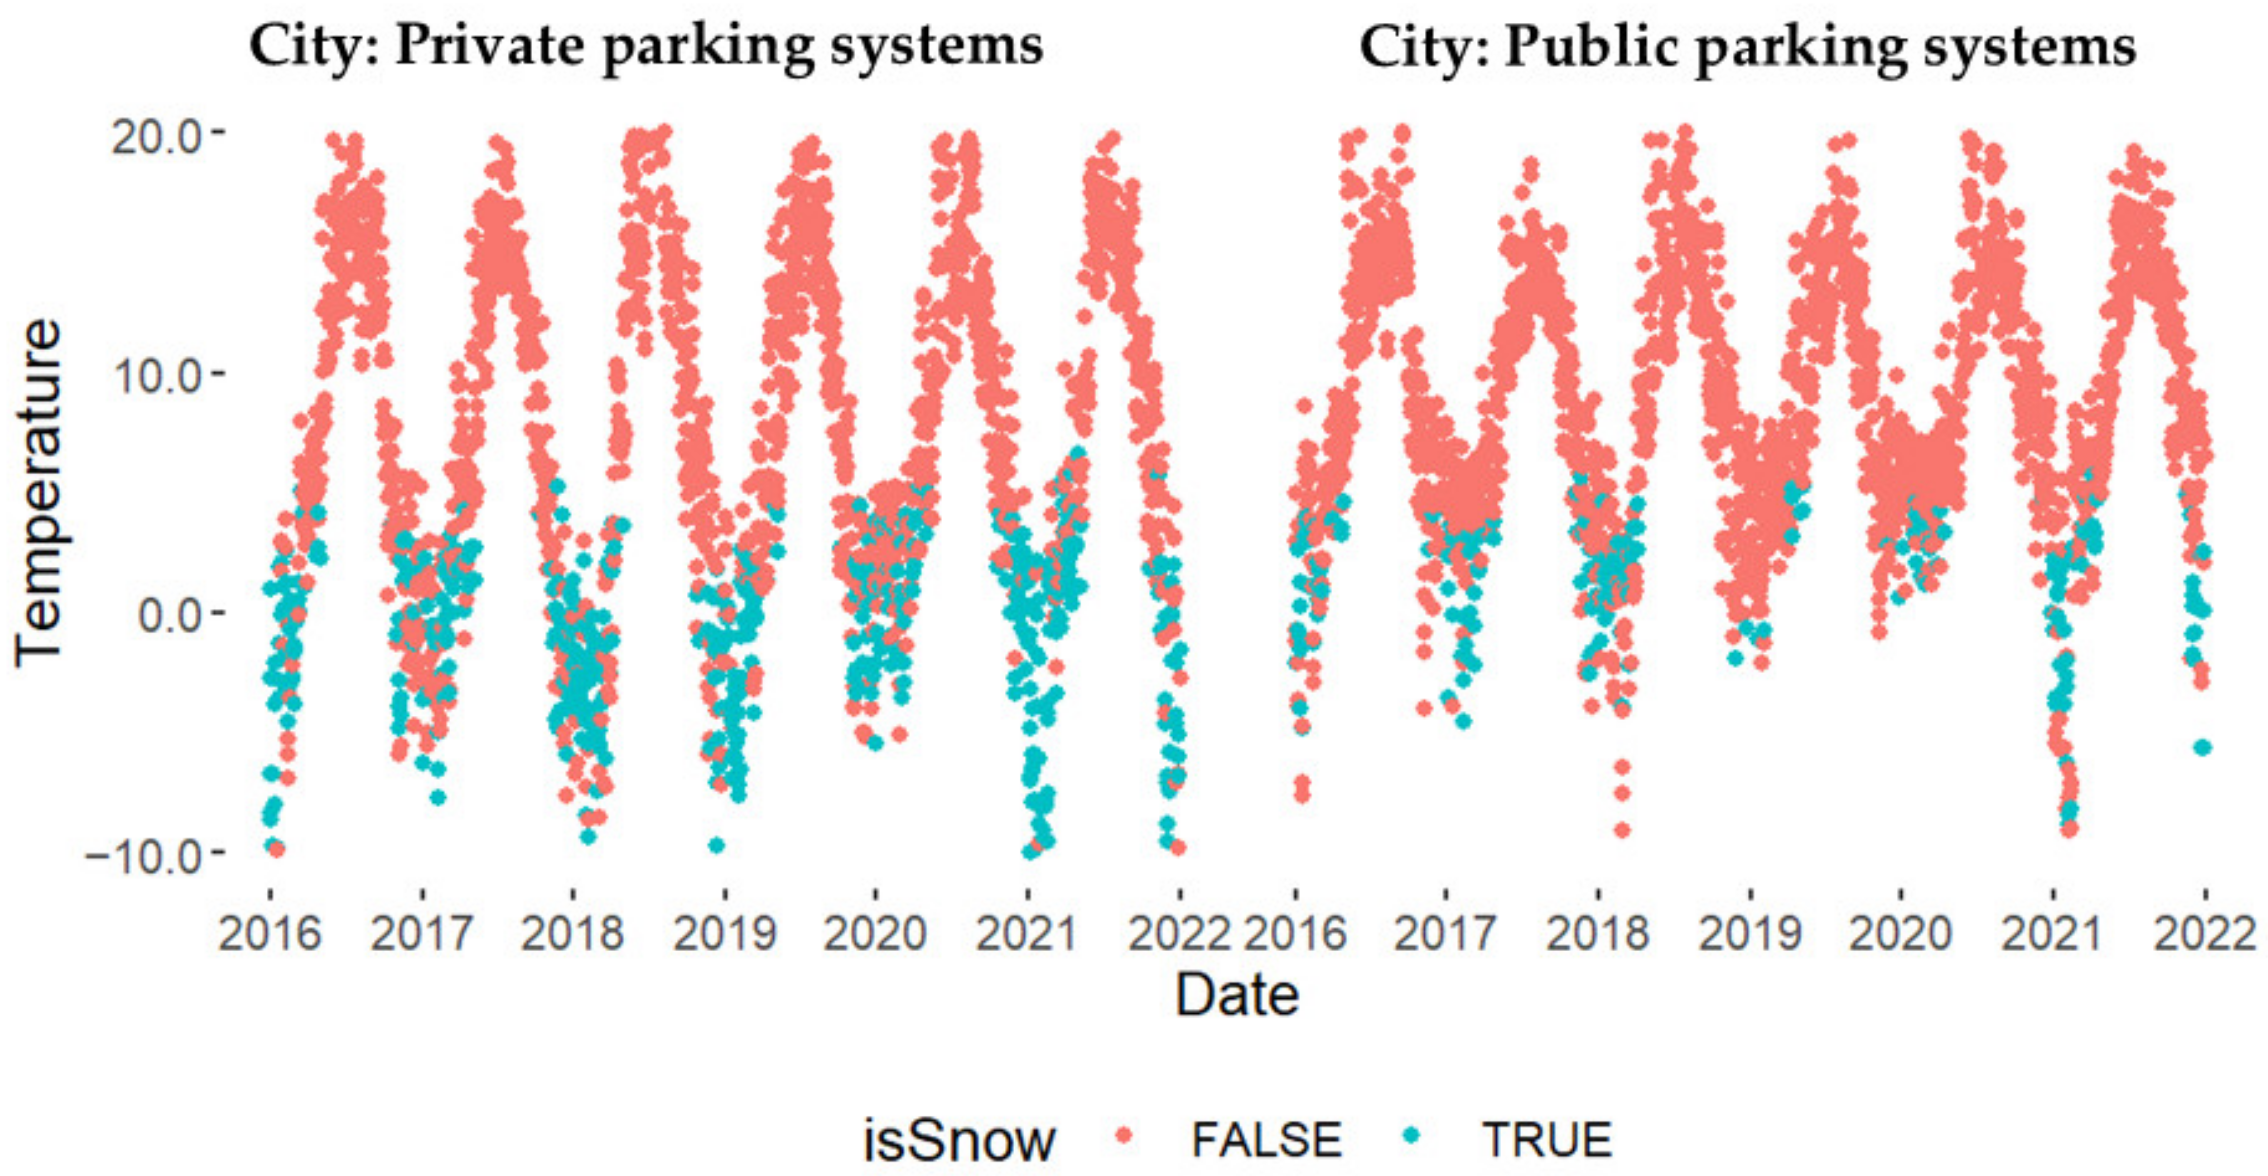
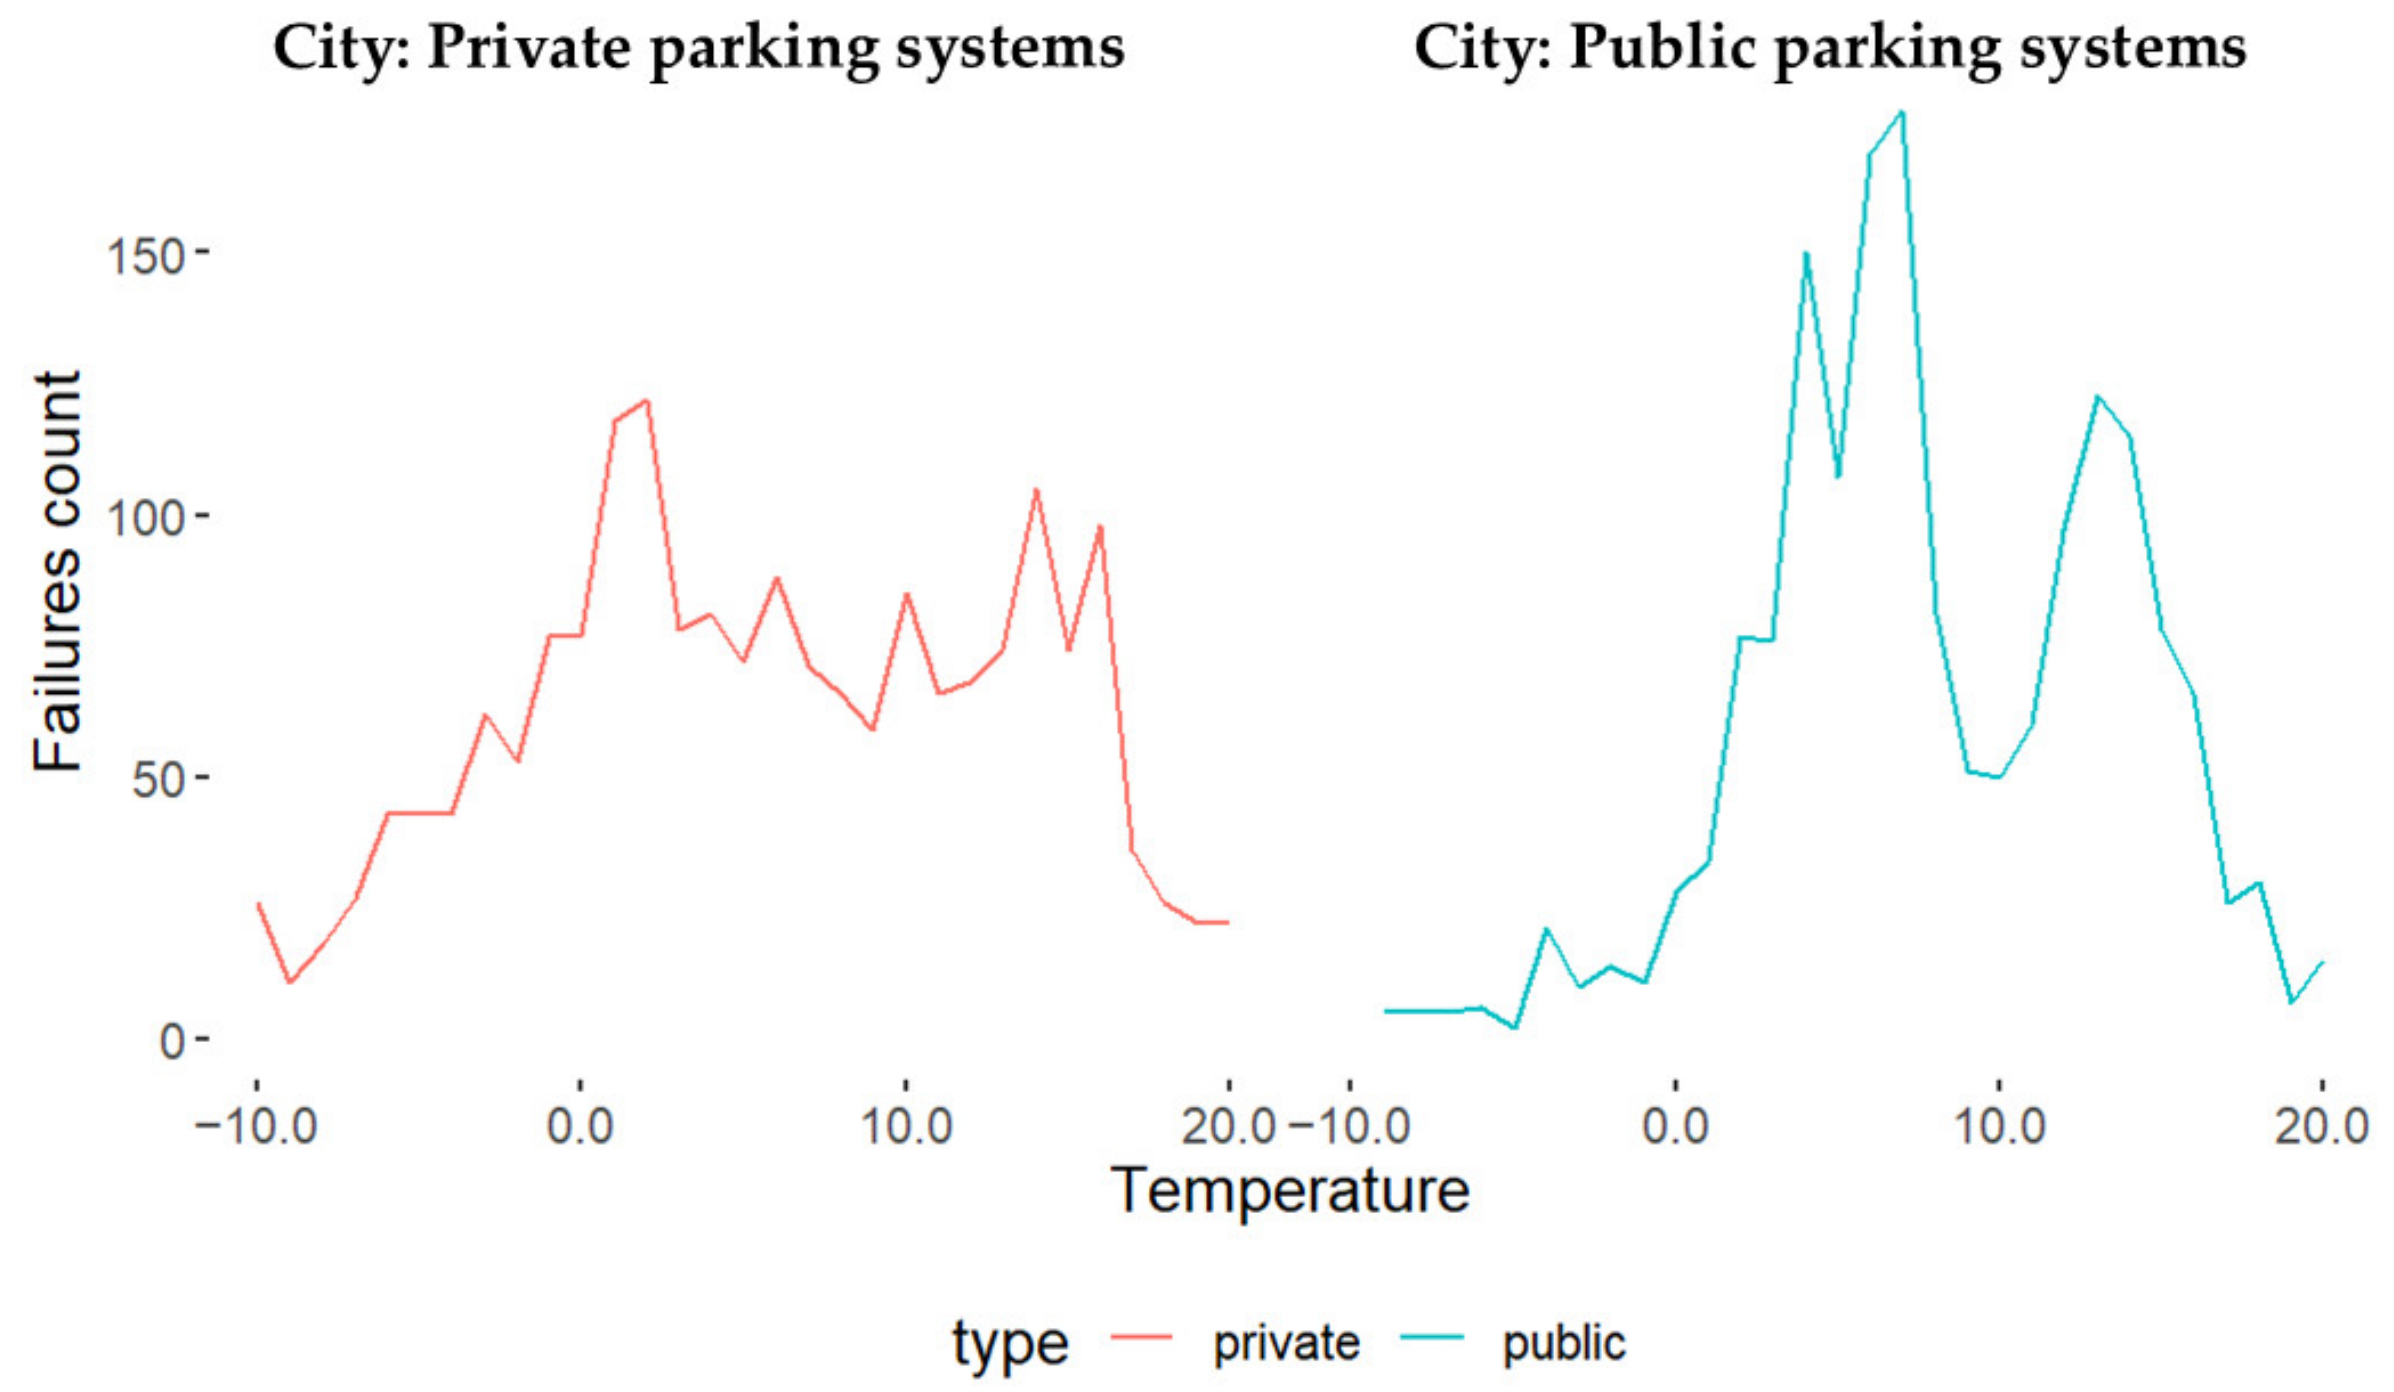
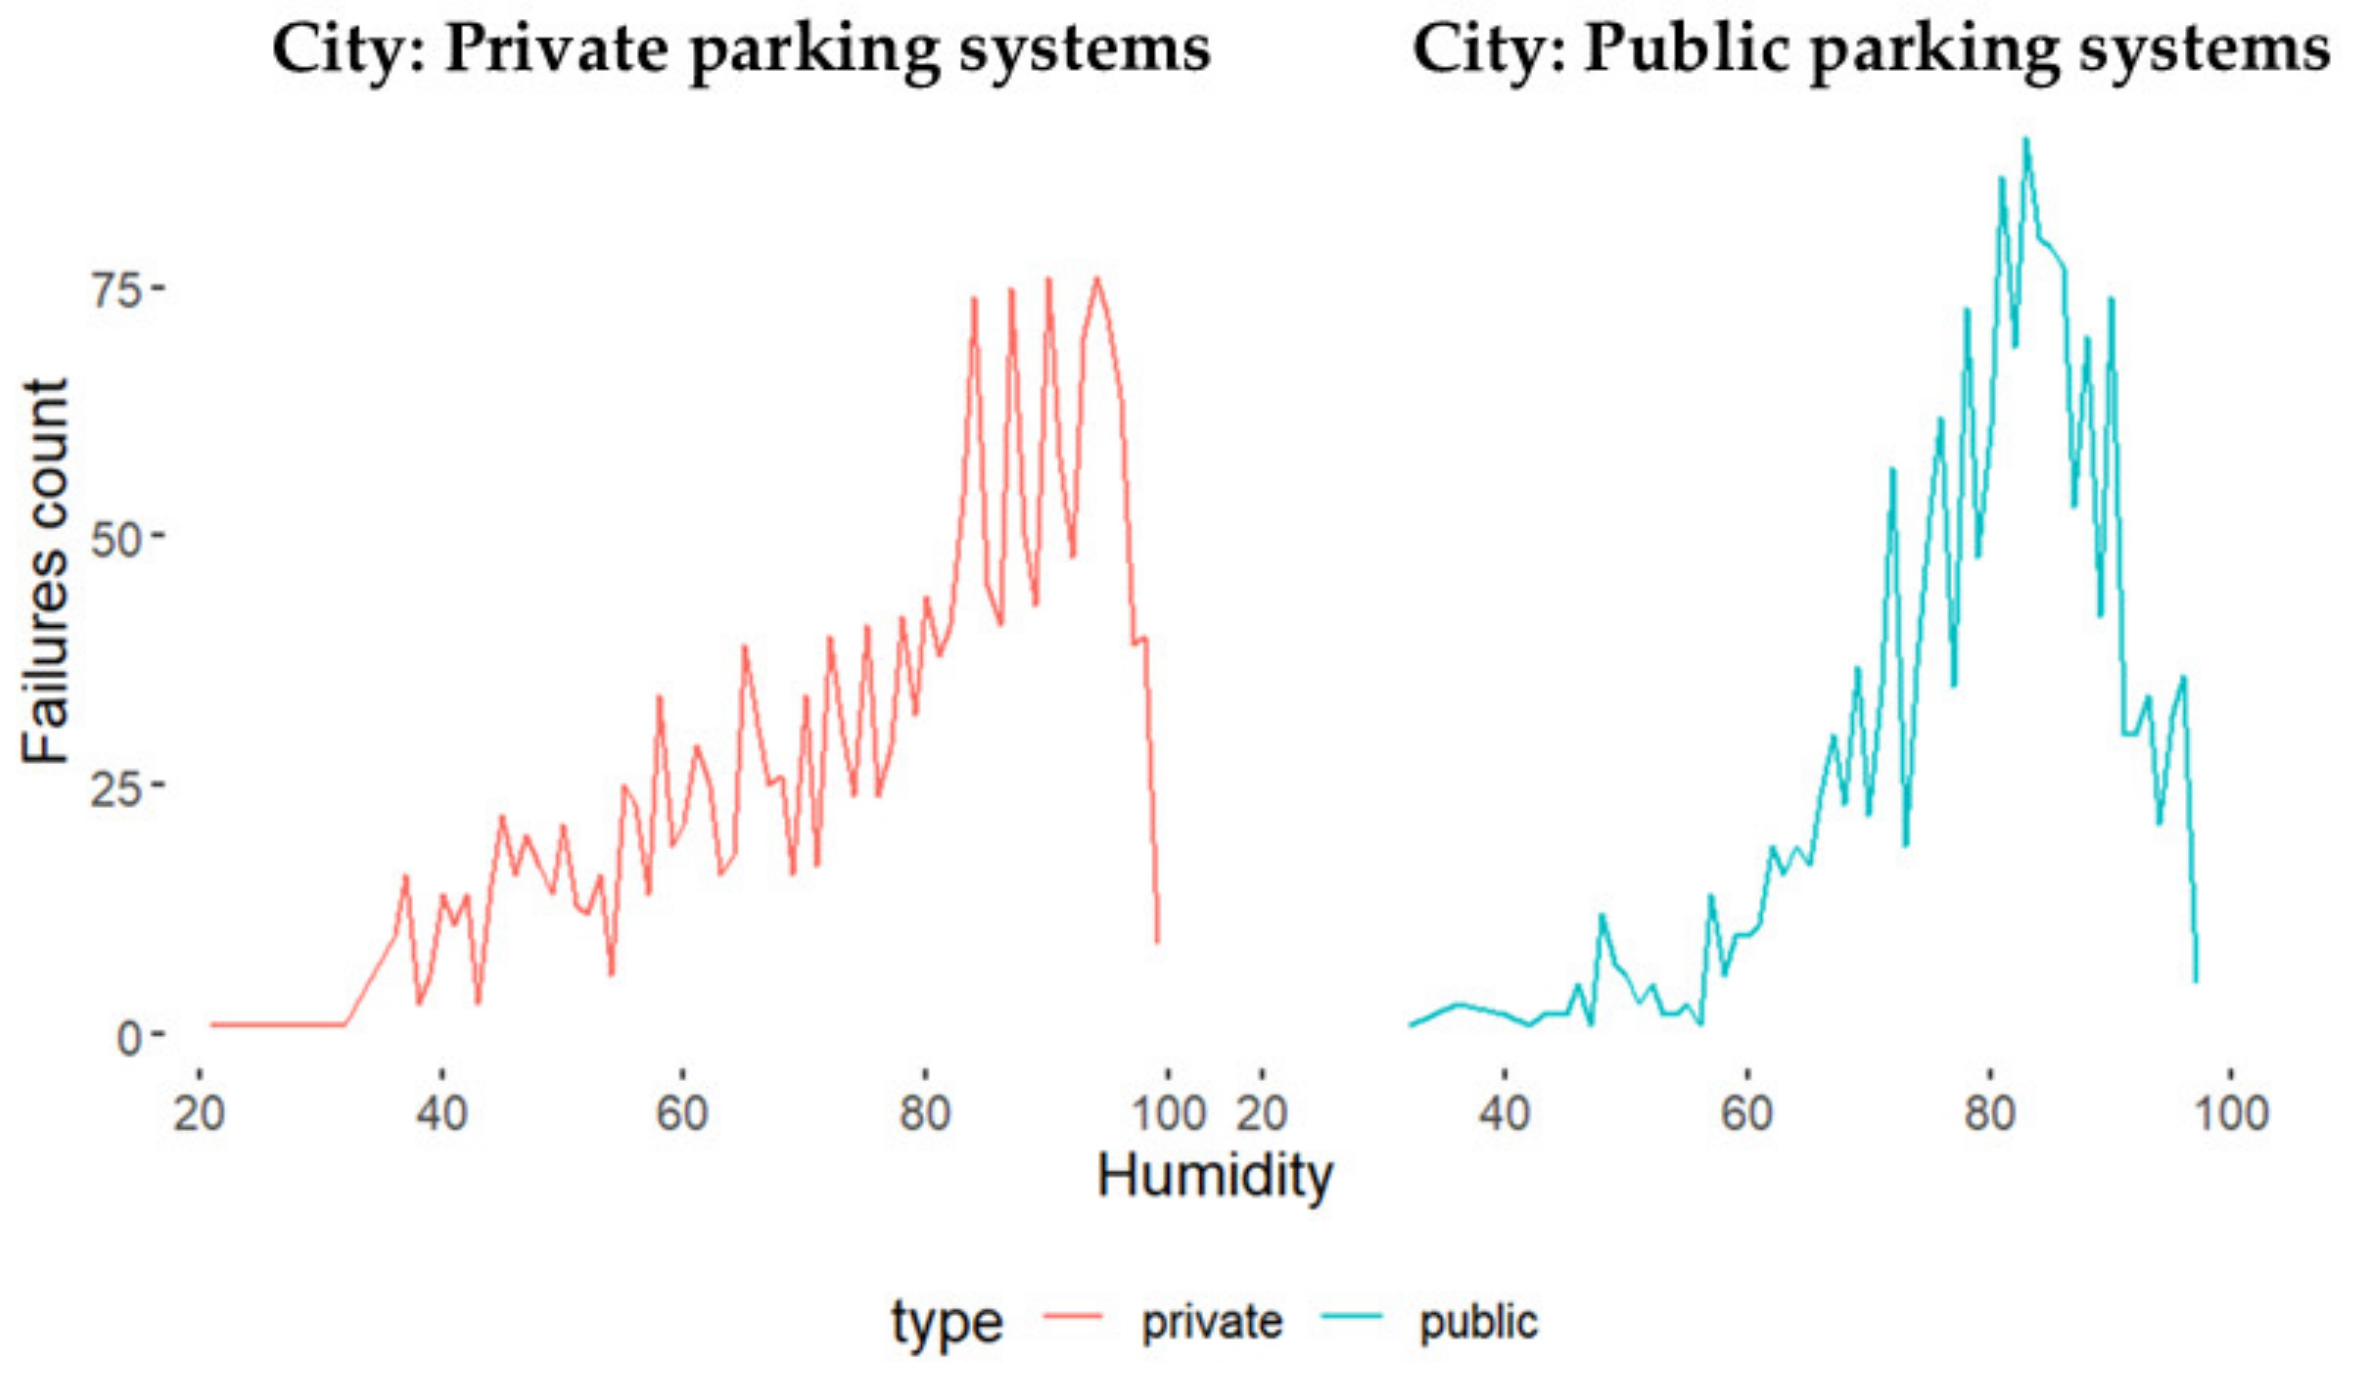
- Collect. In this step (4b), we collected weather data for the same period for the failure data analysis and for the cities where the parking systems installations exist.
- Analyze. In this step (4c), we analyzed weather data and observed possible trends and patterns or any explanation. In this context, conceptual modelling aided in understanding possible explanations with the failure events.
- Verify and validate. The other direction for the decision gate is to proceed with verification and validation of the internal data analysis in case the need for external data is not identified. We verify internal data analysis using the literature and participant observations. Otherwise, external data as another data source were used to verify the internal data analysis’s results. We conducted the validation using, as mentioned, workshops and interviews within the company. We conducted these workshops physically and digitally. The participants of these workshops included company management, the maintenance head of the department, maintenance personnel, project leader, and engineers involved in the early phase of the PD process.
- Decision gate: Add value. Based on the interviews and workshops, we could evaluate if the finding, including the data analysis’s results accompanied by conceptual models, added value to the company in terms of whether it makes sense or not. However, we have one more decision gate after verification and validation. In this decision gate, we need to decide if there is no value added, and then we need to return and collect more internal data stored in the company for further analysis. We conducted some iterations and collected some more internal data such as more failure data for an extended period and some maintenance cost data. We also discovered that pre-processing the data and understanding it were also vital for achieving value.
- Integrate to the knowledge base. After obtaining feedback and verifying and validating the value, we aim to integrate this value into the knowledge base. This step is still a work in progress as this integration depends on the company’s working processes. One of the suggestions we plan to use is A3 Architecture Overviews (A3AO) for the findings. Another suggestion is to integrate the findings as a parameter within the engineering activities in the PD process’s early phase. These activities could, for example, be the Failure Modes and Effects Analysis (FMEA).
4. Results
4.1. Case Study
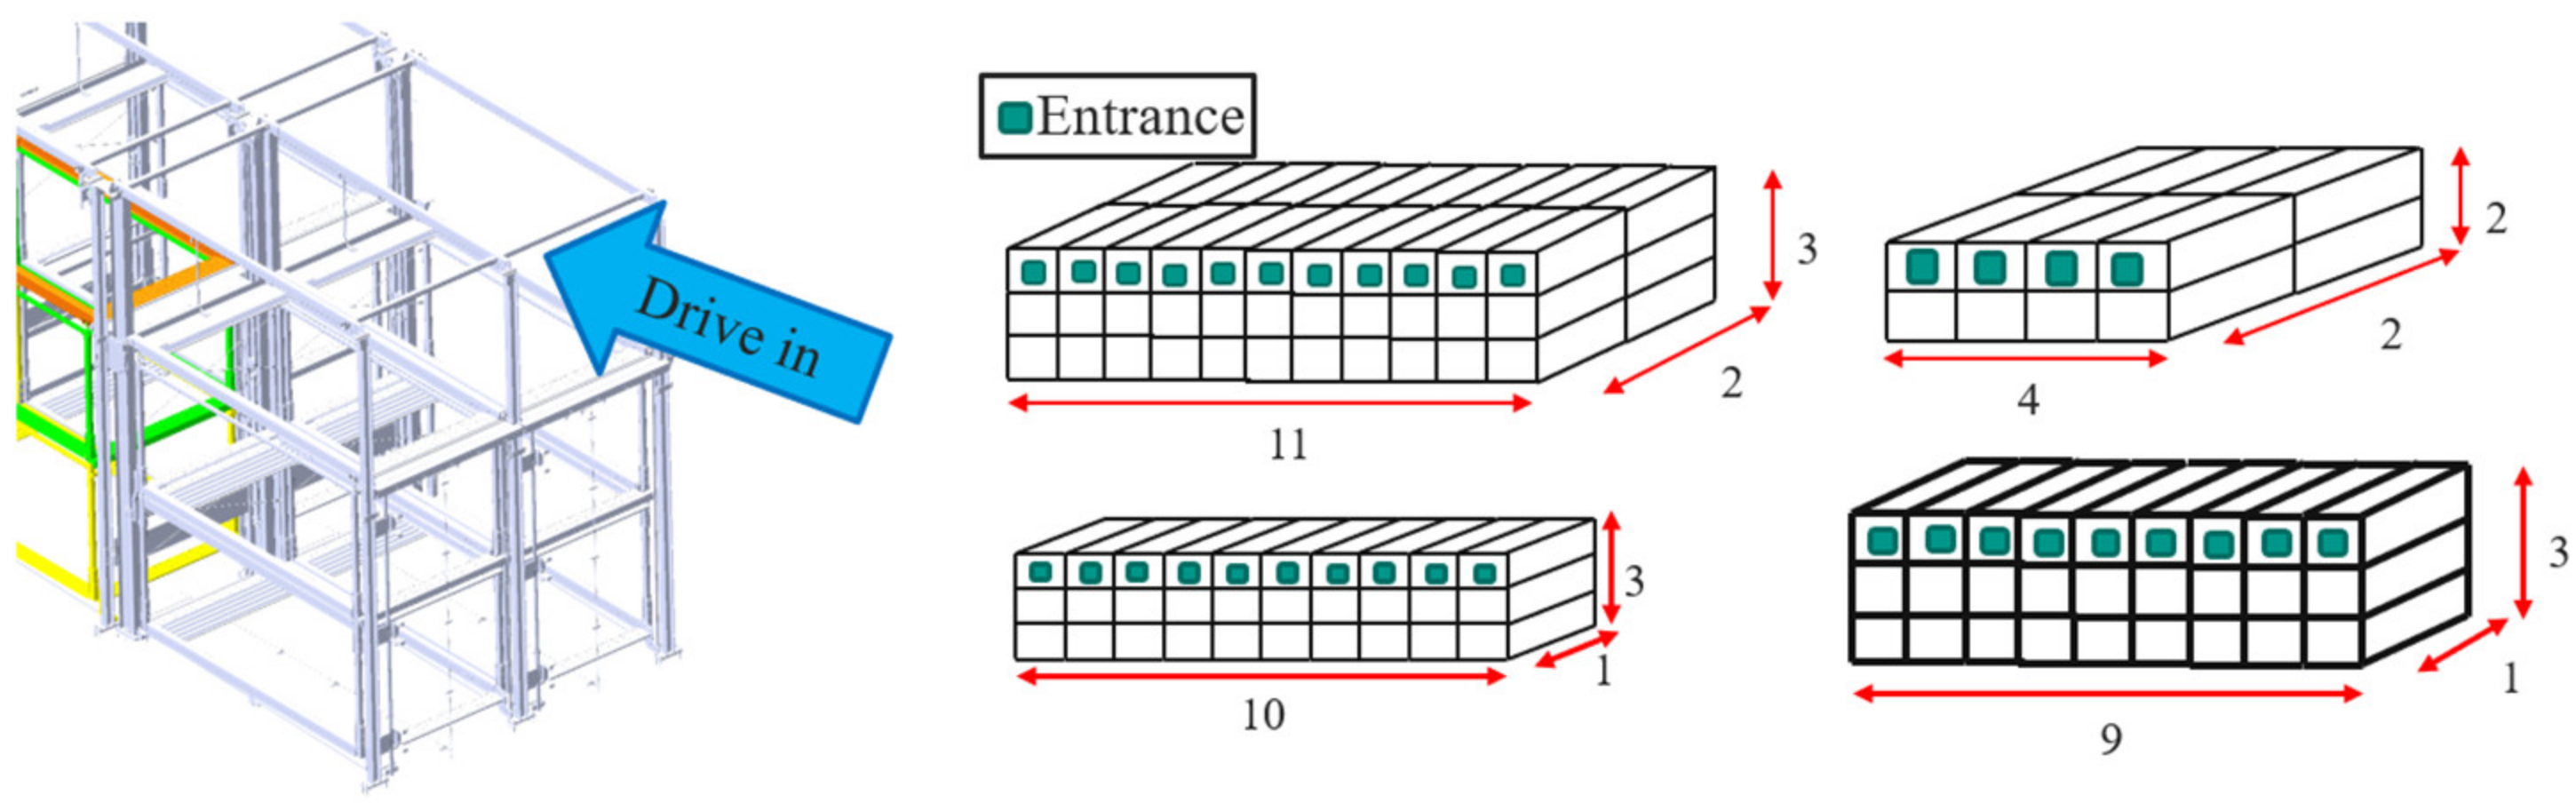
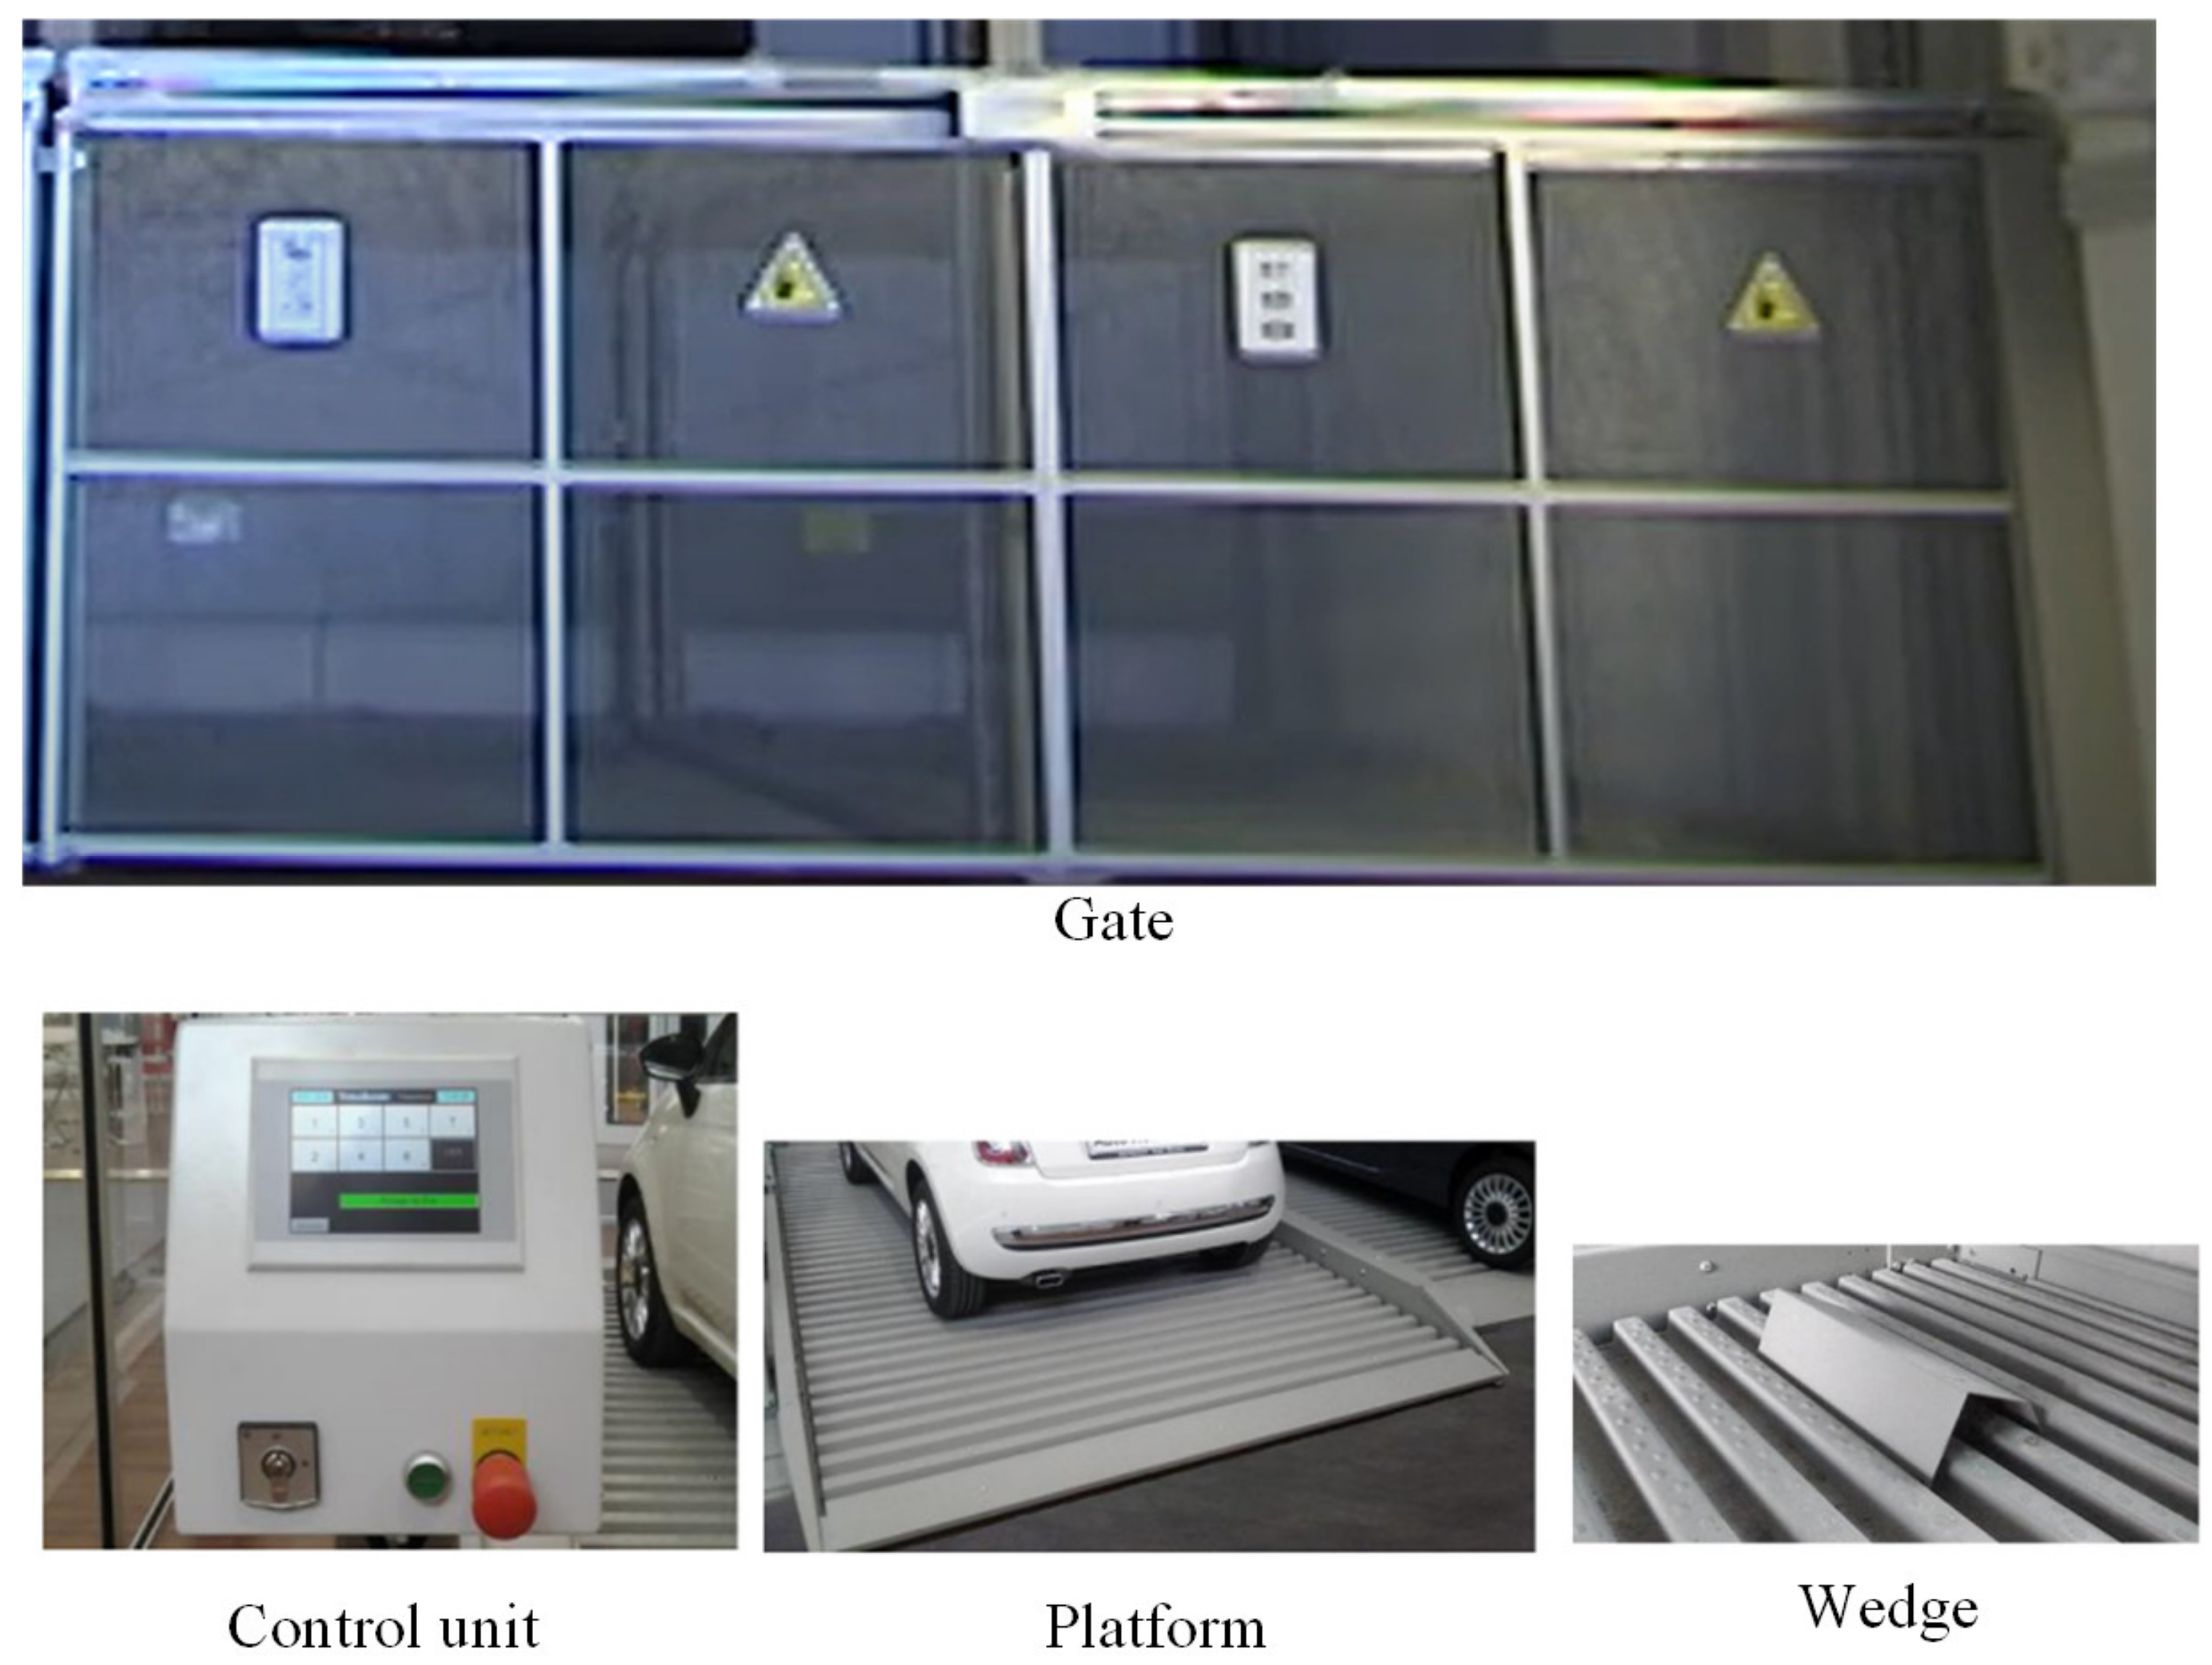
4.1.1. Description of the System
- The gate: The gate is the entrance and exit before and after parking. A collection of two up to three gates is called a segment. Figure 8 shows a segment including two gates.
- The control unit: The control unit is a touch screen with operating instructions, including a key switch and emergency stop. The control is connected to the power unit through cables and fixed on a wall.
- The platform: The platform carries the car to the correct position.
- The wedge: The wedge helps the driver park the car in the correct position.
4.1.2. Failure Data Description
- Date (for a maintenance event);
- Time;
- Telephone number (for the maintenance personnel who investigated the failure event);
- Tag number (for the user (car owner));
- Place number (for which parking lot the failure event occurred);
- Reason (possible reasons for the failure event);
- Conducted by (includes initials of the maintenance person’s name that performed the failure or maintenance event);
- Invoiced yes/no (if the failure event is invoiced as it is not included within the maintenance agreement with the company or not). The company’s agreement includes only planned maintenance. In other words, most maintenance tasks should be invoiced. However, the company rarely invoices its customers.
4.1.3. Failure Data Analysis
Failure Data Collection
Failure Data Pre-Processing
- Tokenization: We divided the text (sentences) into words, commas, and so forth, called tokens.
- Removing the numbers: We removed numbers that stick to the word without a full stop.
- Removing stop words: We removed stop words. Stop words are words that do not add a significant meaning in the natural language, such as is, the, this, and so forth. We removed the stop words using the “corpus” module from the Natural Language Toolkit (NLTK) Python library [56].
- Stemming: Stemming means that we reduced the words to their root by removing the word’s prefixes and suffixes that affixes its root, also called a lemma. We used a stemming algorithm called Snowball Stemmer from Python’s NLTK library [57]. We also lower casing the letters for all text.
- Translation: We translated the results from Norwegian to English. We used Googletrans Python library, which uses Google Translate API (Application Programming Interface) [58].
Failure Data Analysis
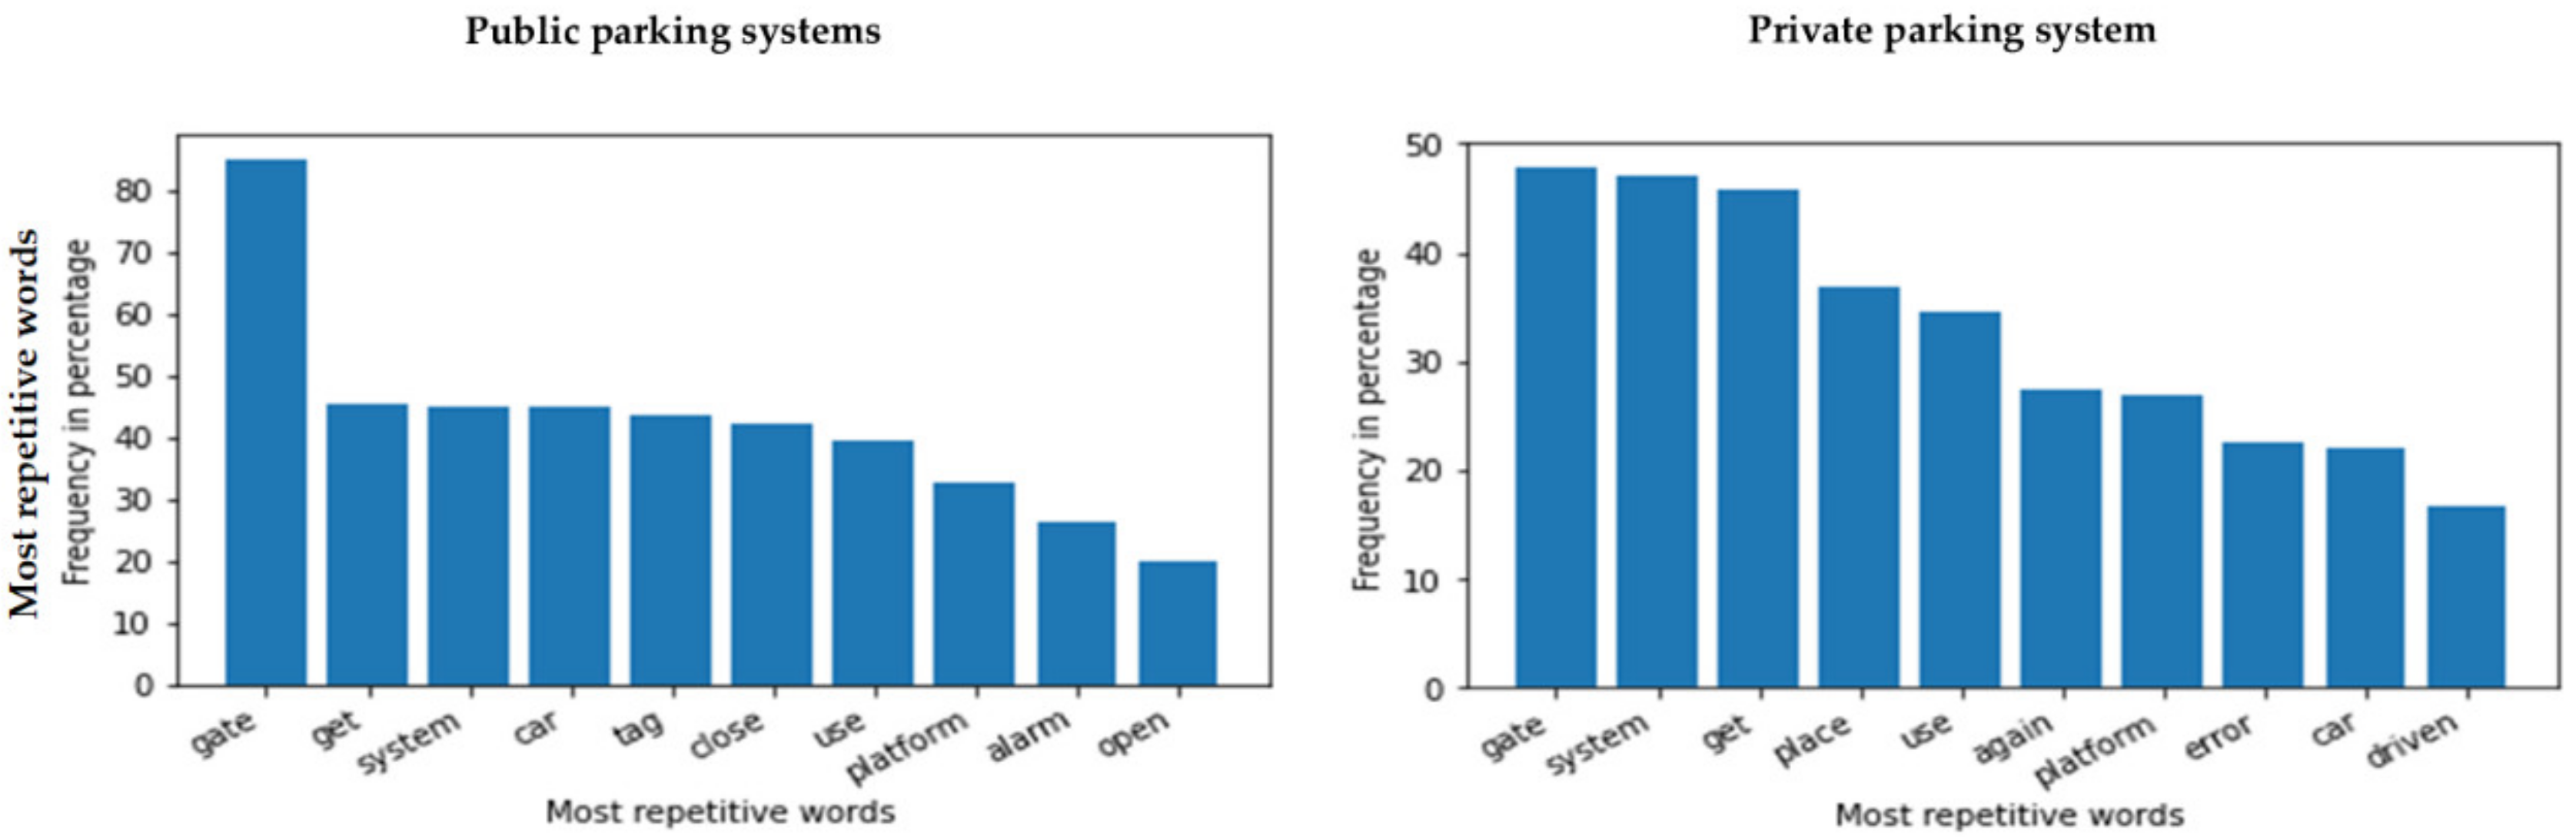
- Tokens (words) frequency: We determined the most common words. We calculated the frequency of each word in the free text (reason column) in number and percentage. We chose to save the ten most repetitive (frequent) words. We also determined the frequency of the unique words. We calculated the frequency of the word per row in number and percentage. Each row represents a failure event. In addition, we conducted an n-gram analysis showing the most frequent three words, four words, and five words. We noticed that the three-word phrase made the most sense in a way that provided an understandable phrase. We chose to show only the most repetitive word in the failure events as the point in this context is to investigate the most critical subsystem.
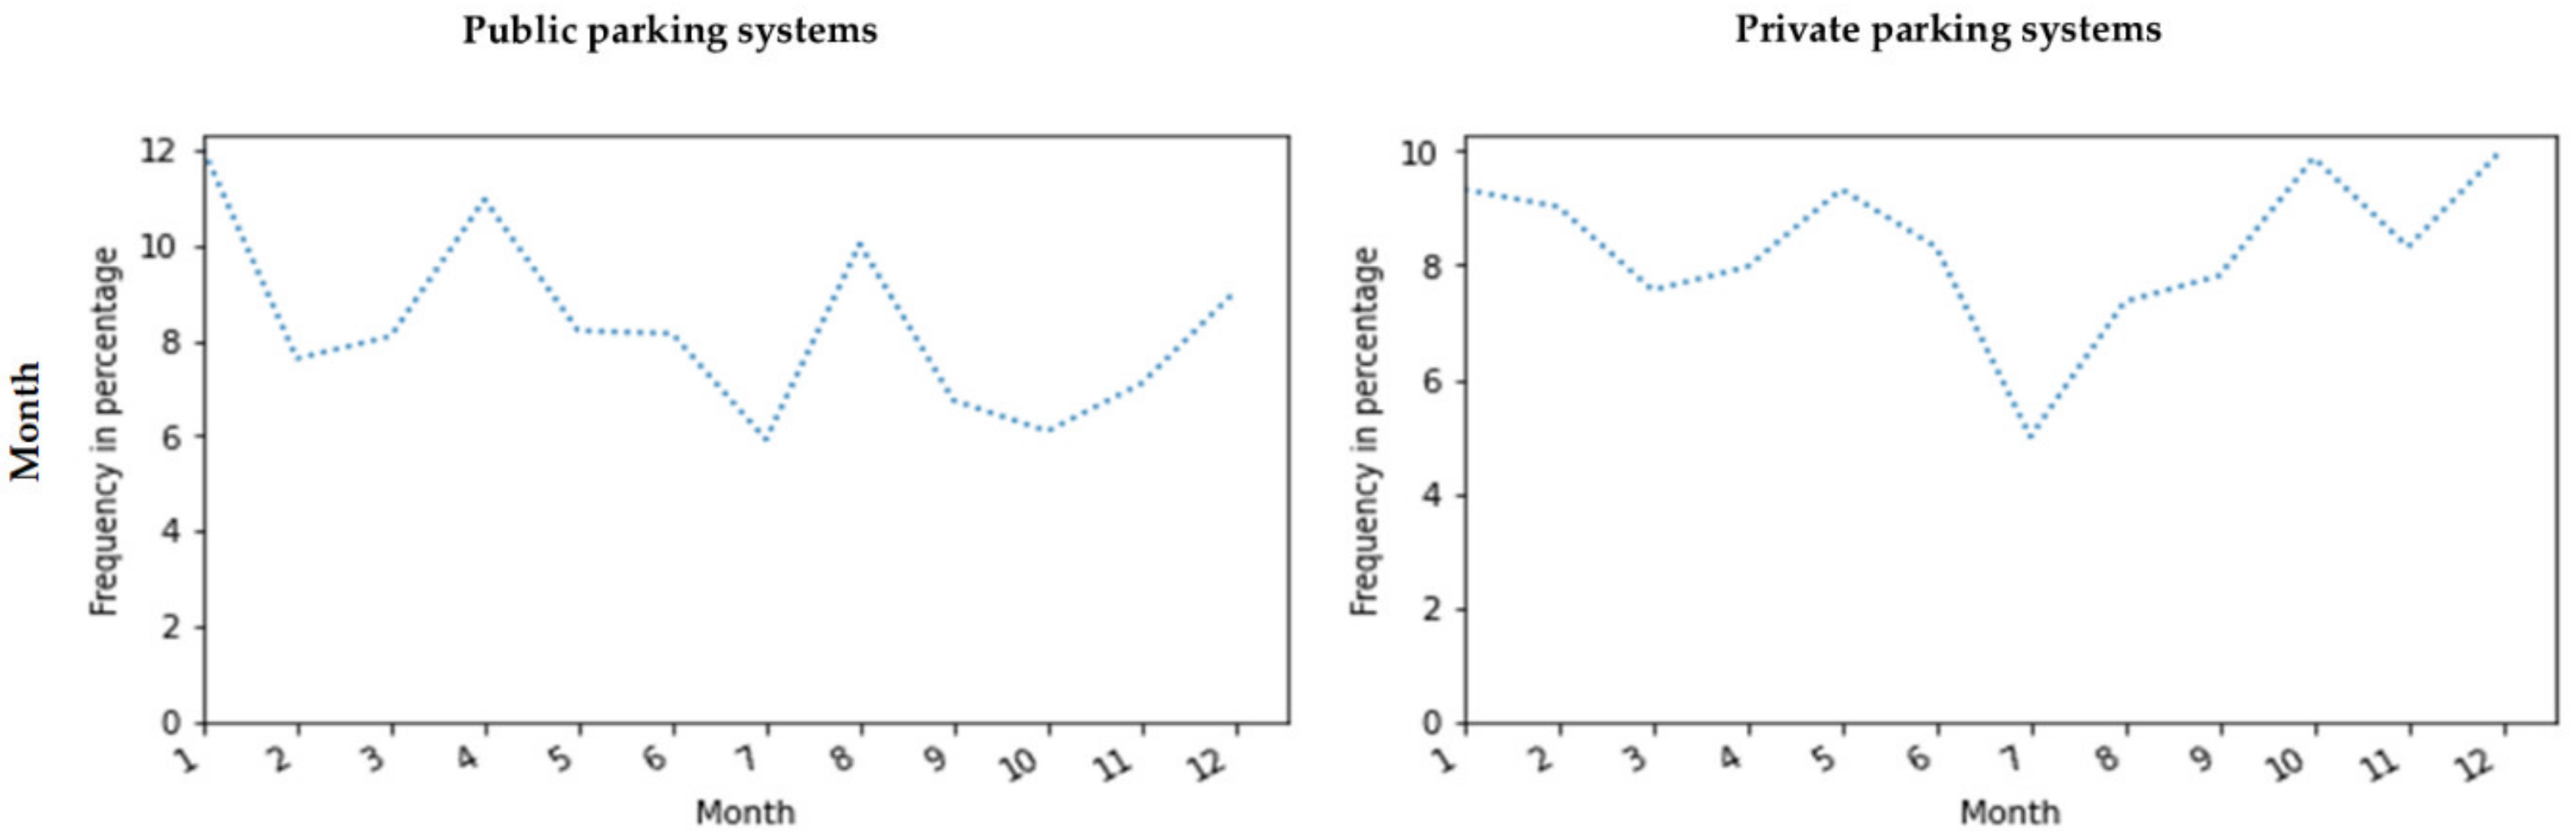
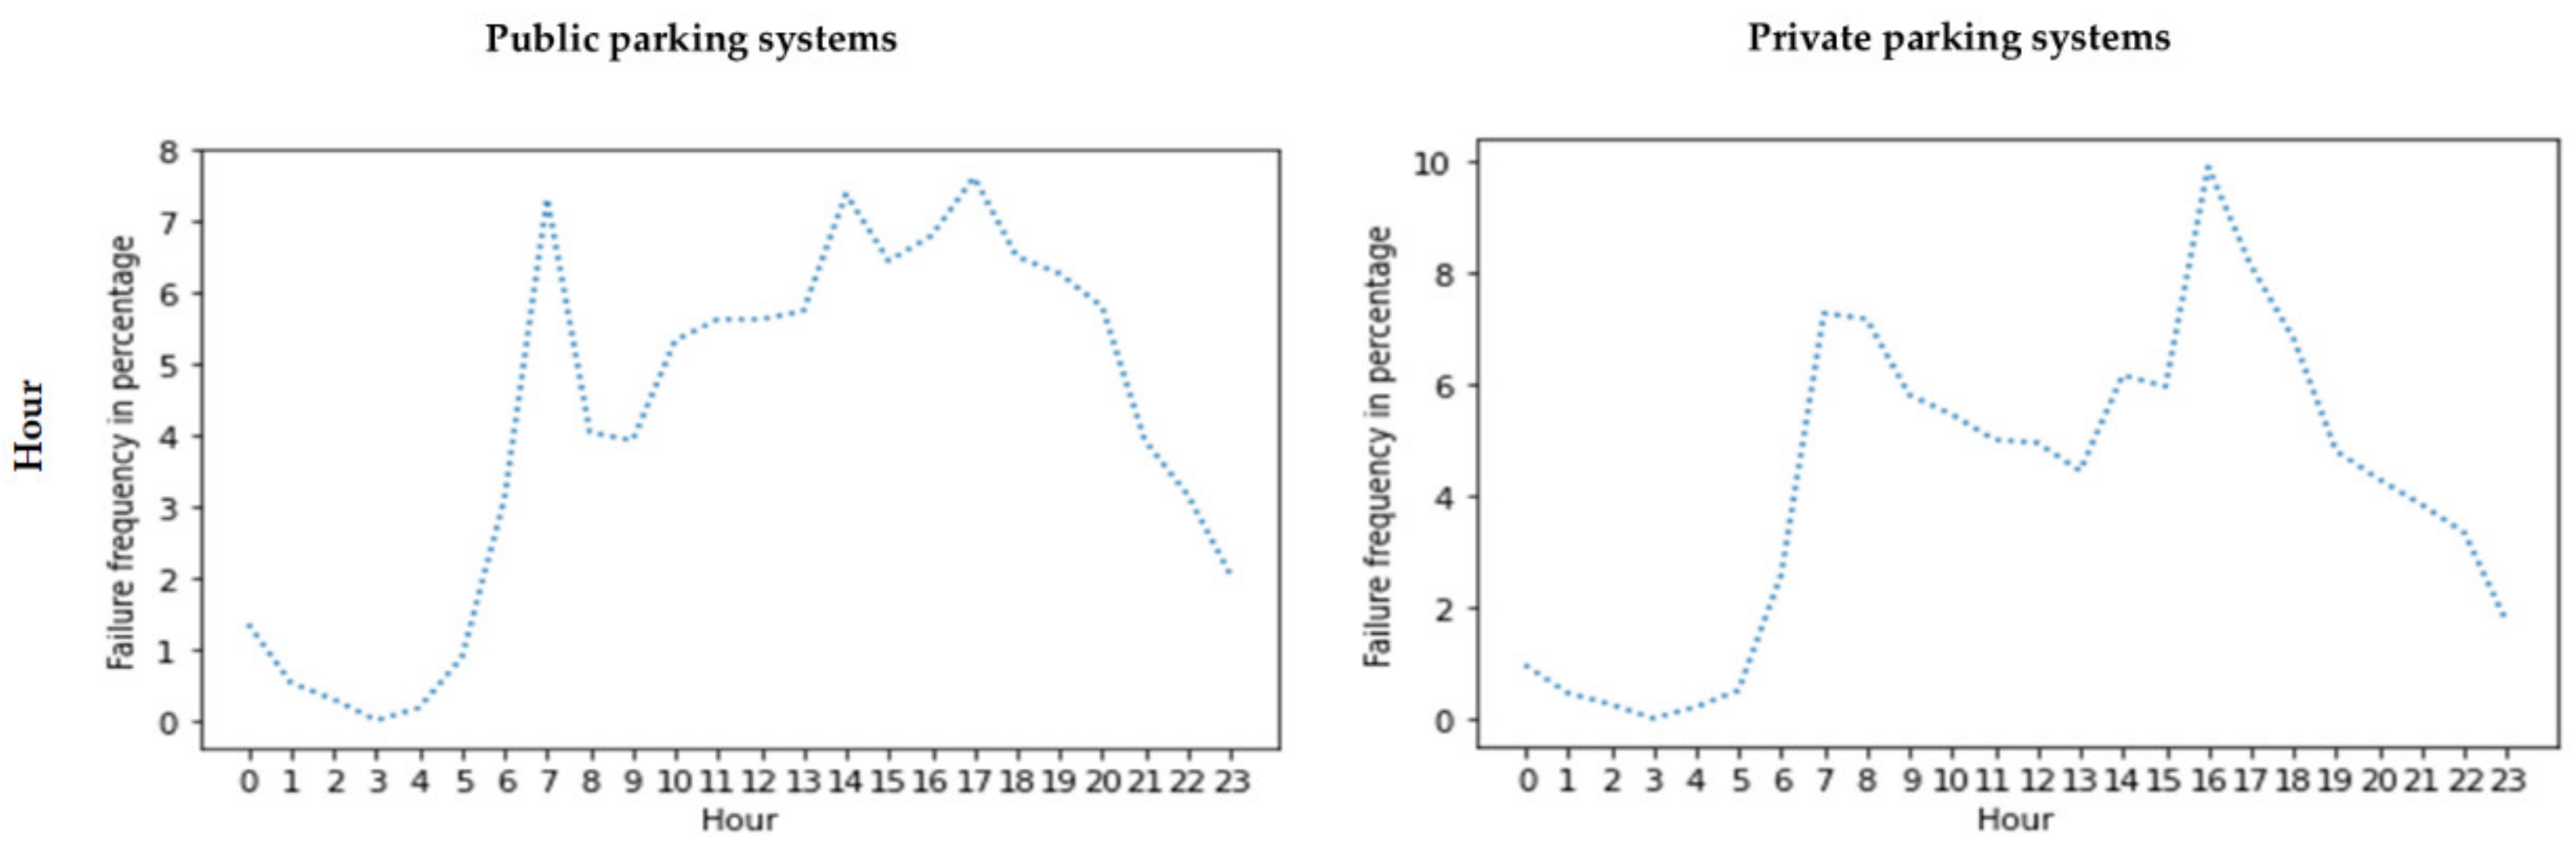
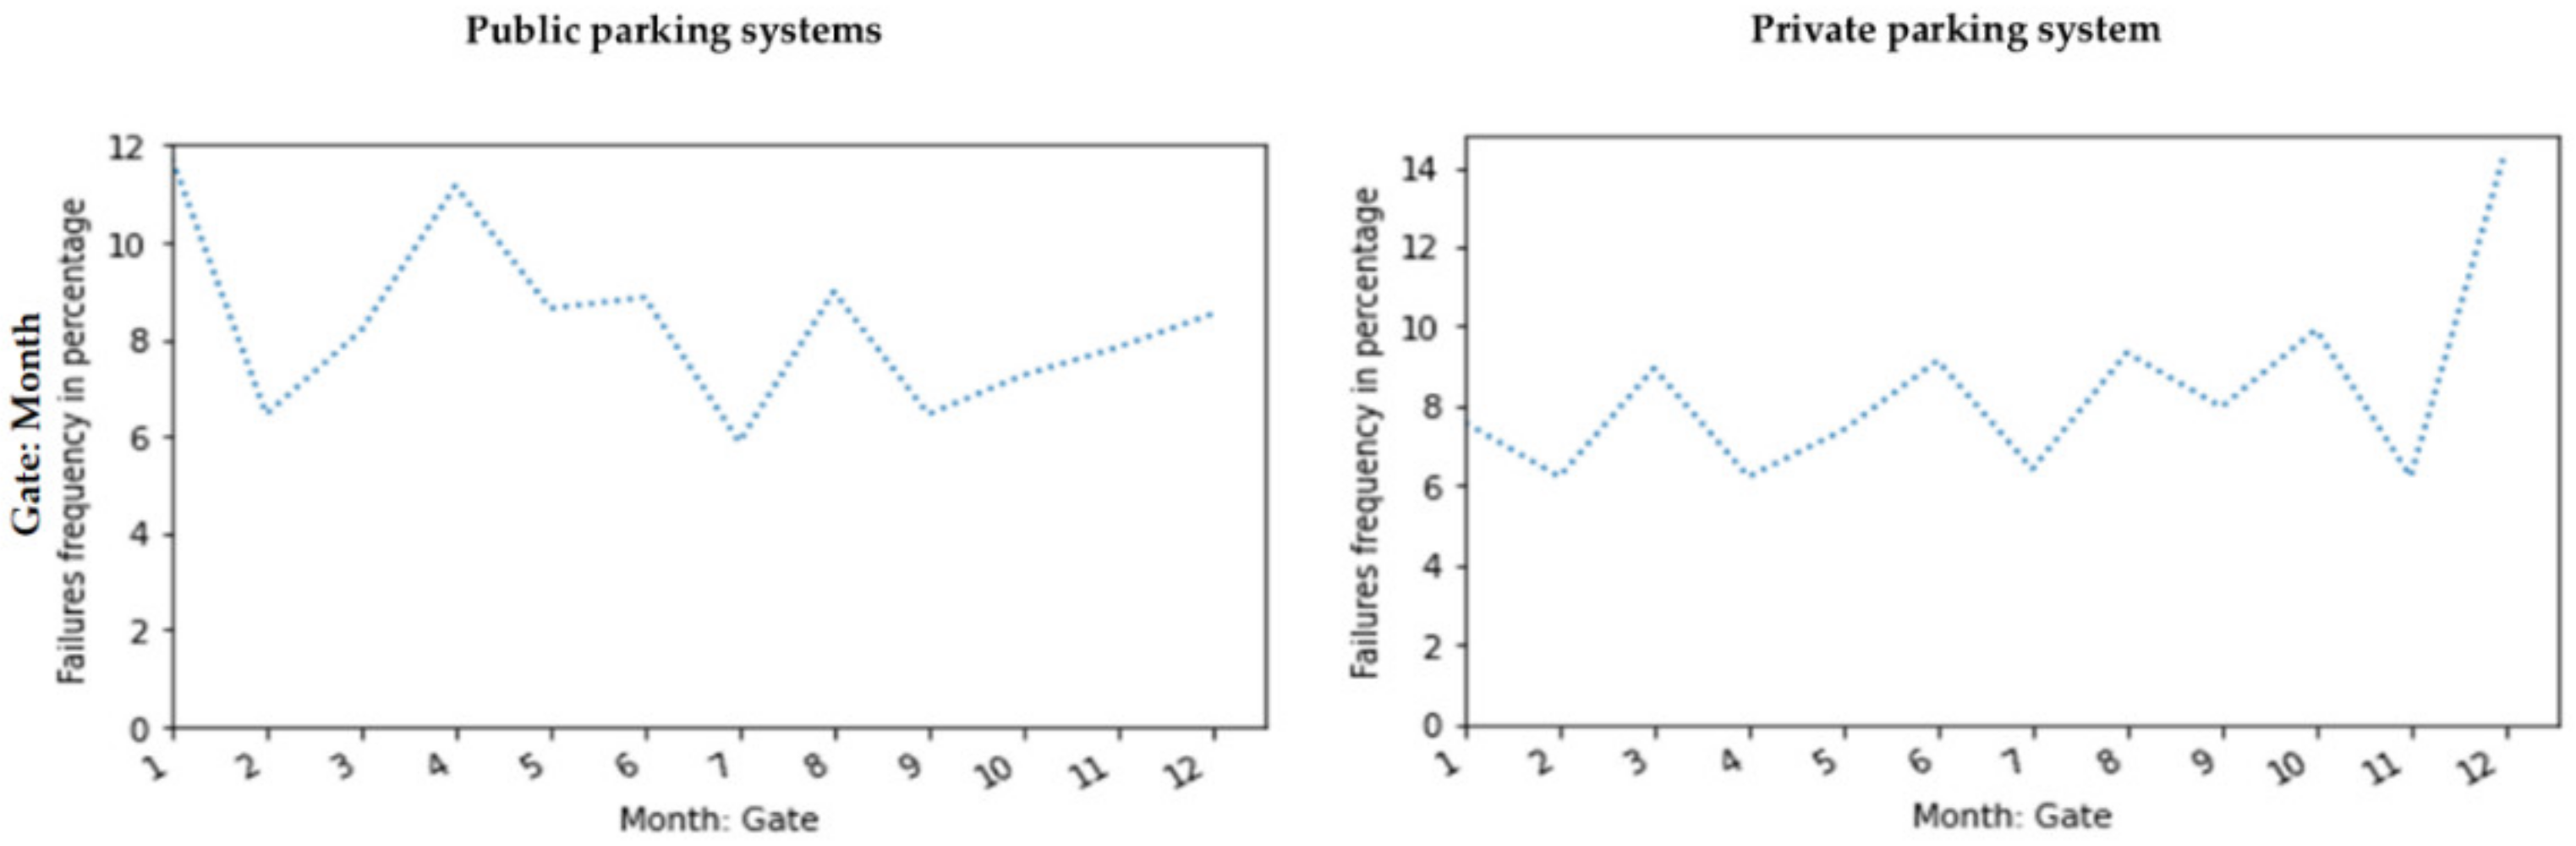
- Failure events frequency versus other columns (parameters): We calculated the frequency of the failure events versus other parameters. These parameters include the year, month, day of the week, and time of day (hour). In this calculation, we saved the numbers and percentages. The calculation of percentages was performed due to the company’s confidentiality.
- Failure rates: We calculated the failure rates by determining the number of failure events divided by the total system operation time.
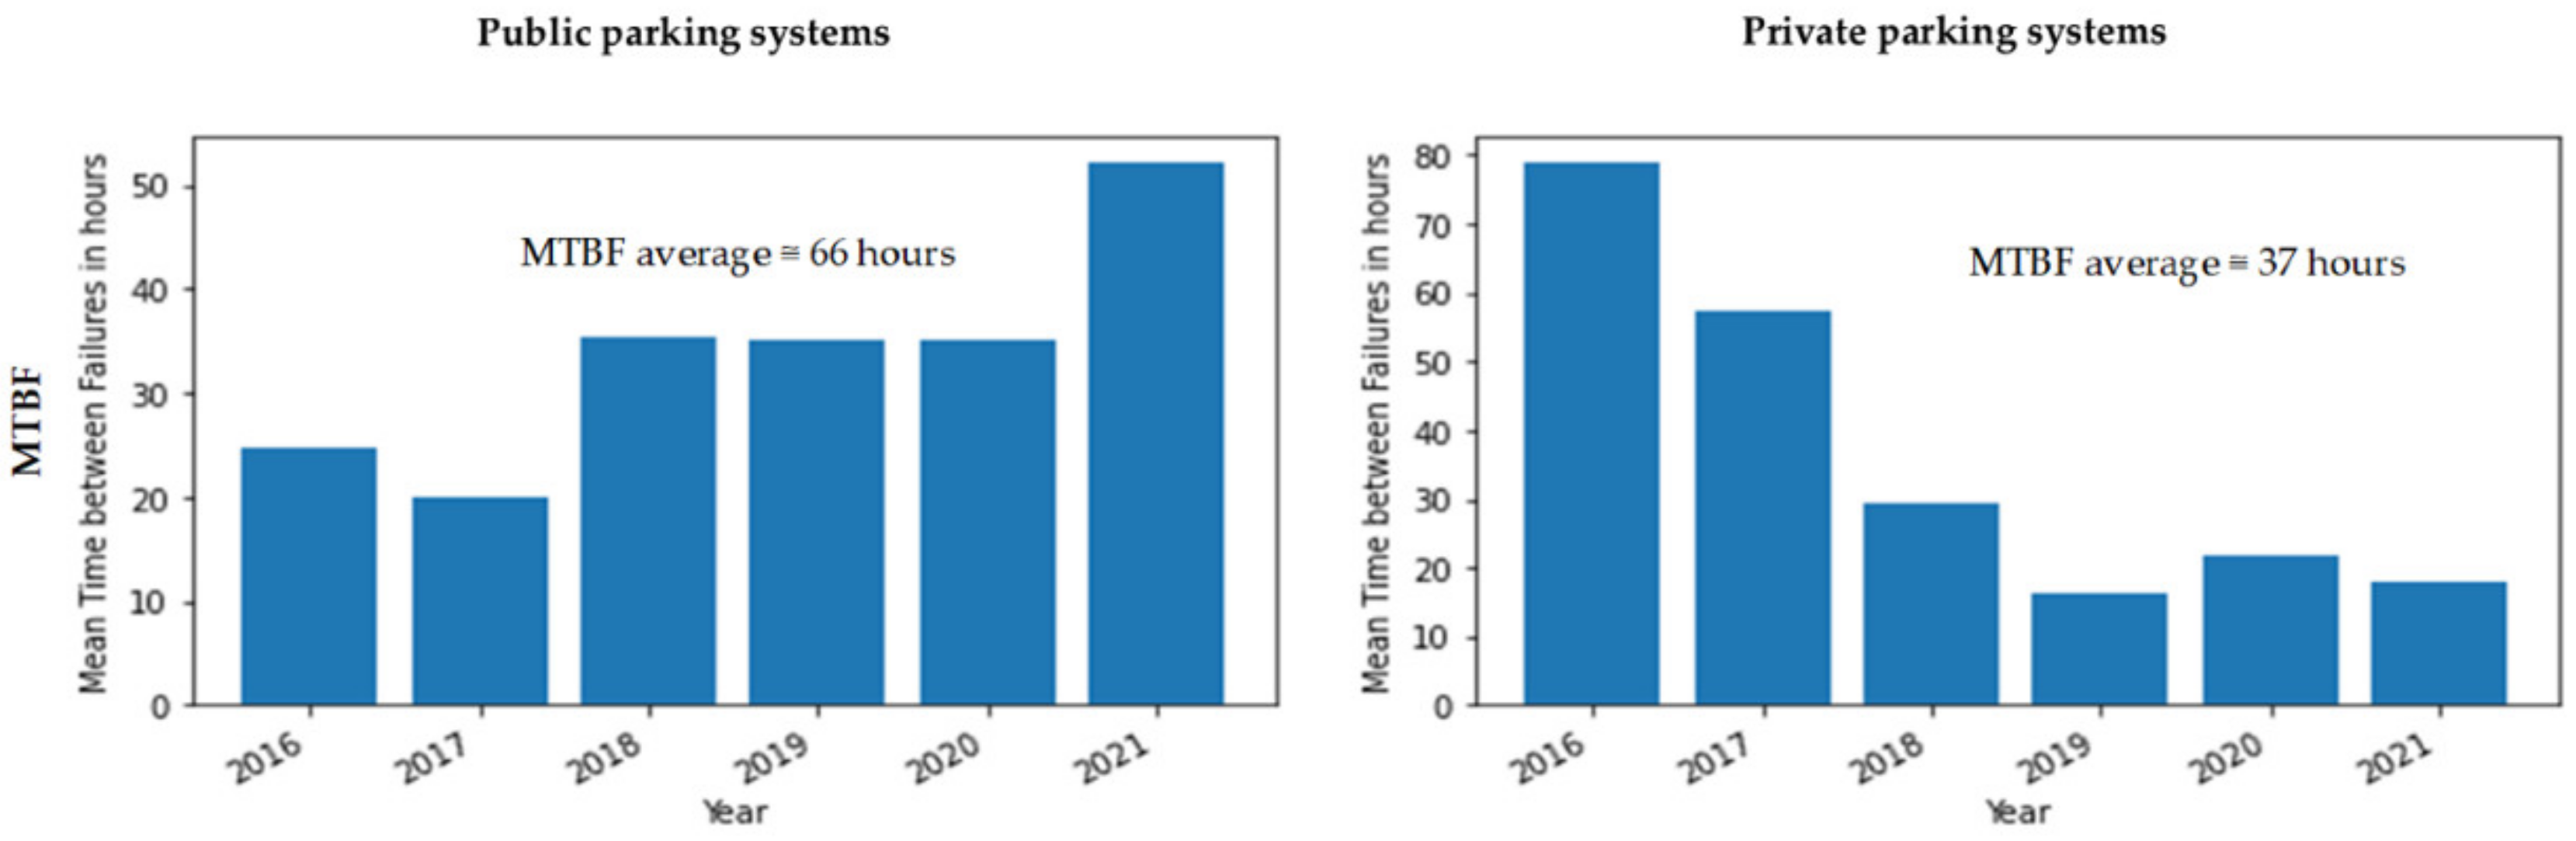
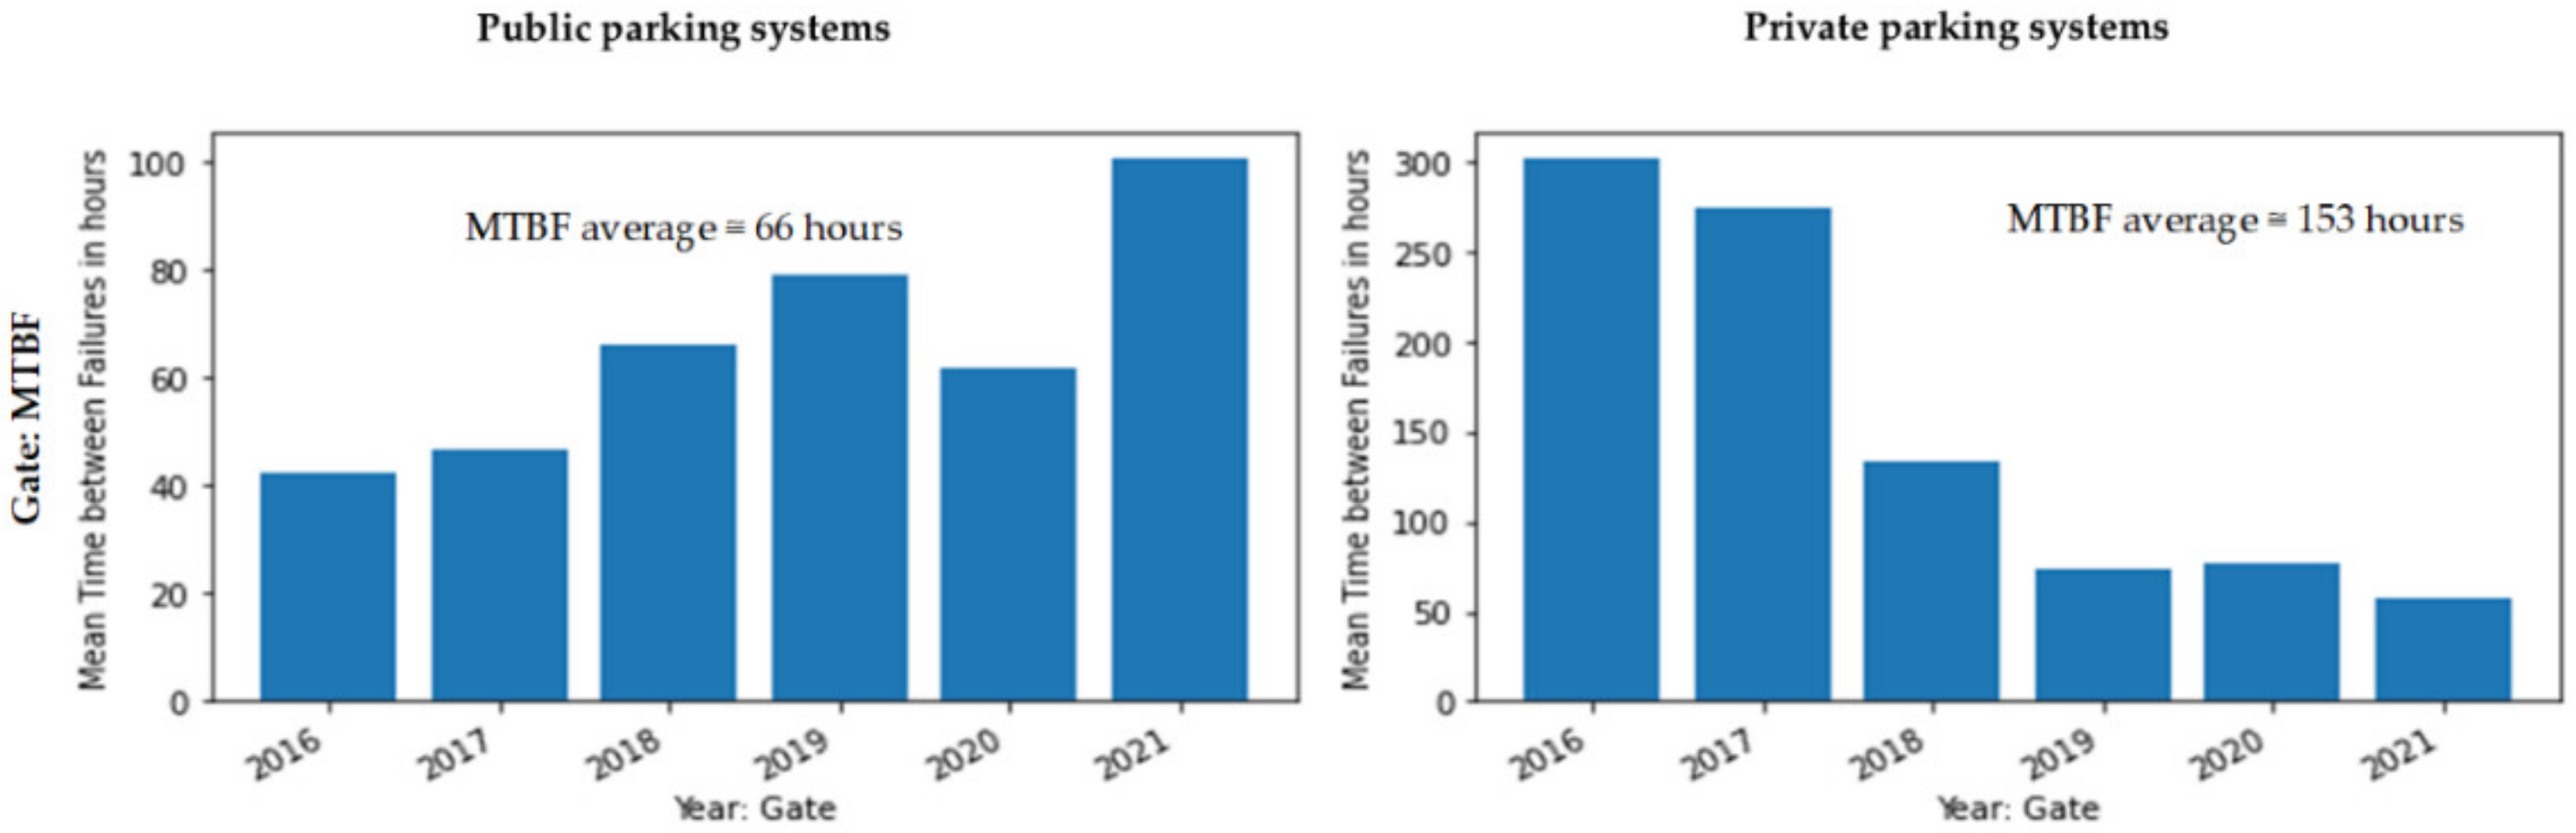
- Mean Time between Failures (MTBF): We determined the MTBF by taking the reciprocal of the failure rate values (total operation time/number of failures).
Failure Data Visualization
Gate as a Use Case
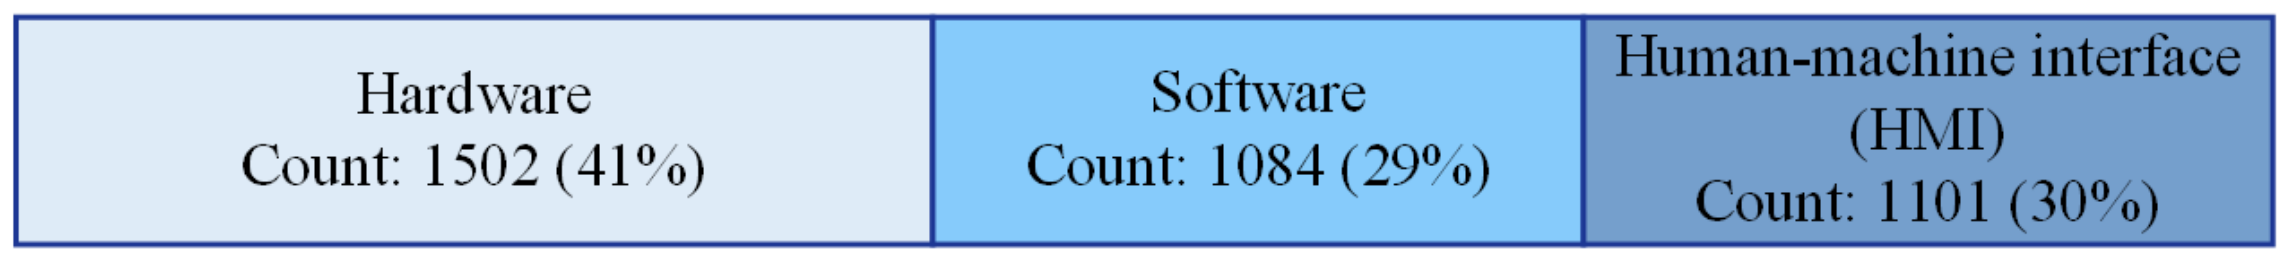
Failure Data Classification
4.1.4. Weather Data Description
4.1.5. Weather Data Analysis
4.1.6. Conceptual Modeling
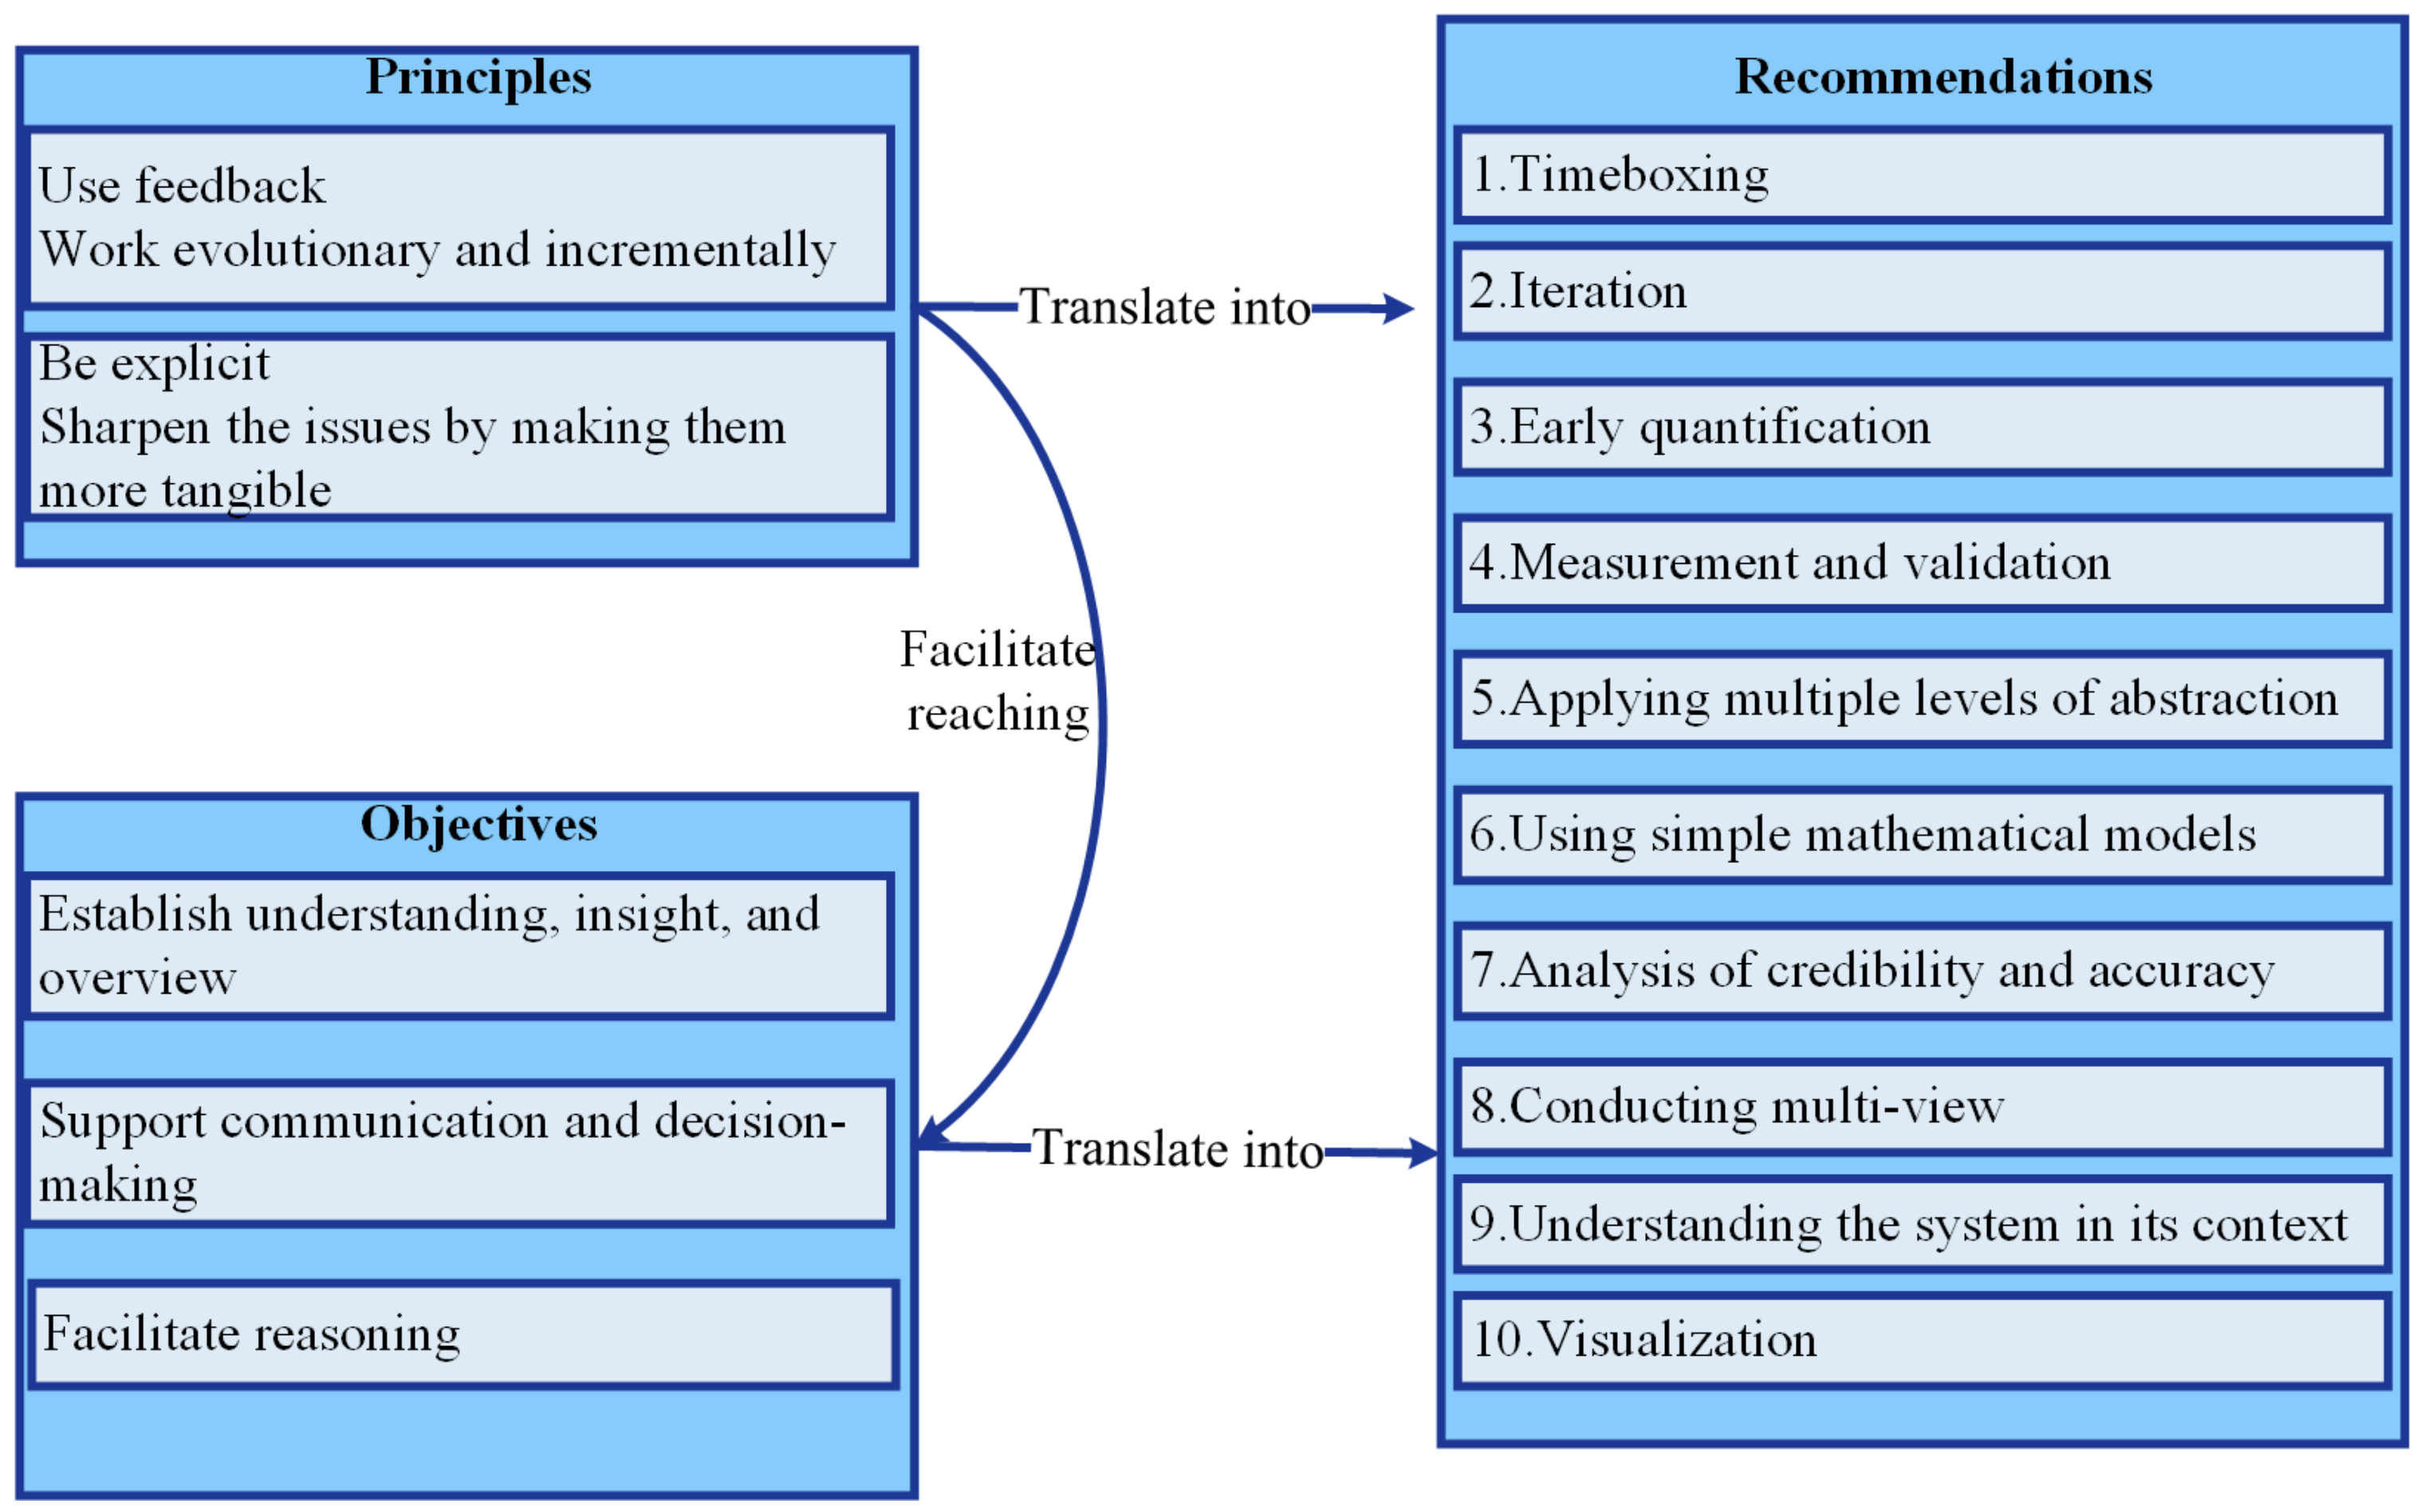
Principles, Objectives, and Recommendations in Applying Conceptual Modeling
- Timeboxing: We used timeboxing for developing several models. The timeboxing varies from minutes to days to weeks.
- Iteration: We iterated using feedback from subject-matter experts’ input. The experts included domain scholars and industry practitioners, focusing on the company’s key persons.
- Early quantification: We translated the principle of being explicit in quantifications early. We used failure data analyses for this early quantification. Early quantification aids in being explicit and sharpening discussions by using numbers. However, these numbers can evolve as we conduct quantifications at an early phase, and more confidence using validations may be needed.
- Measurement and validation: We calculated and measured numbers to have an indication for some essential measurements. For instance, we calculated the failure rates and MTBF to indicate the SOI’s reliability. We validated these numbers by using evidence and arguments from the literature and the company.
- Applying multiple levels of abstraction: We considered the size and complexity of these levels of abstraction. We aimed at connecting high-level abstractions to a lower level to achieve concrete guidance. For instance, we considered conceptually modeling all APS as an SOI. Furthermore, we also generated conceptual models by considering the gate as an SOI and its relation to the APS as a whole.
- Using simple mathematical models: We used simple models to be explicit and to understand the problem and solution domain. These models aimed at capturing the relation between the parts and components of the company’s SOI to be able to reason these relations.
- Analysis of credibility and accuracy: We made ourselves and the company aware of the numbers. These numbers comprised an early quantification that needed further verification and validation within more extended iterations.
- Conducting multi-view: We applied six main (different) views. These views are customer objectives (“what” for the customer), application (“how” for the customer), functional view (“what” of the company’s case study request), conceptual view, and realization view. The conceptual and realization views describe the “how” of the company’s case study request. These six views include more relevant views. Muller [49] describes these views accompanied by a collection of sub-methods. We iterated over these views by using different abstraction levels.
- Understanding the system’s context: We conducted several research data collection methods, including workshops, participant observation, and interviews to understand the SOI’s context. The workshops and interviews were conducted mainly with the company’s key persons. However, using participant observations, we also conducted informal interviews with the end-users. We also conducted a literature review to understand the company’s case study context. We needed to understand the SOI and case study’s context for reasoning.
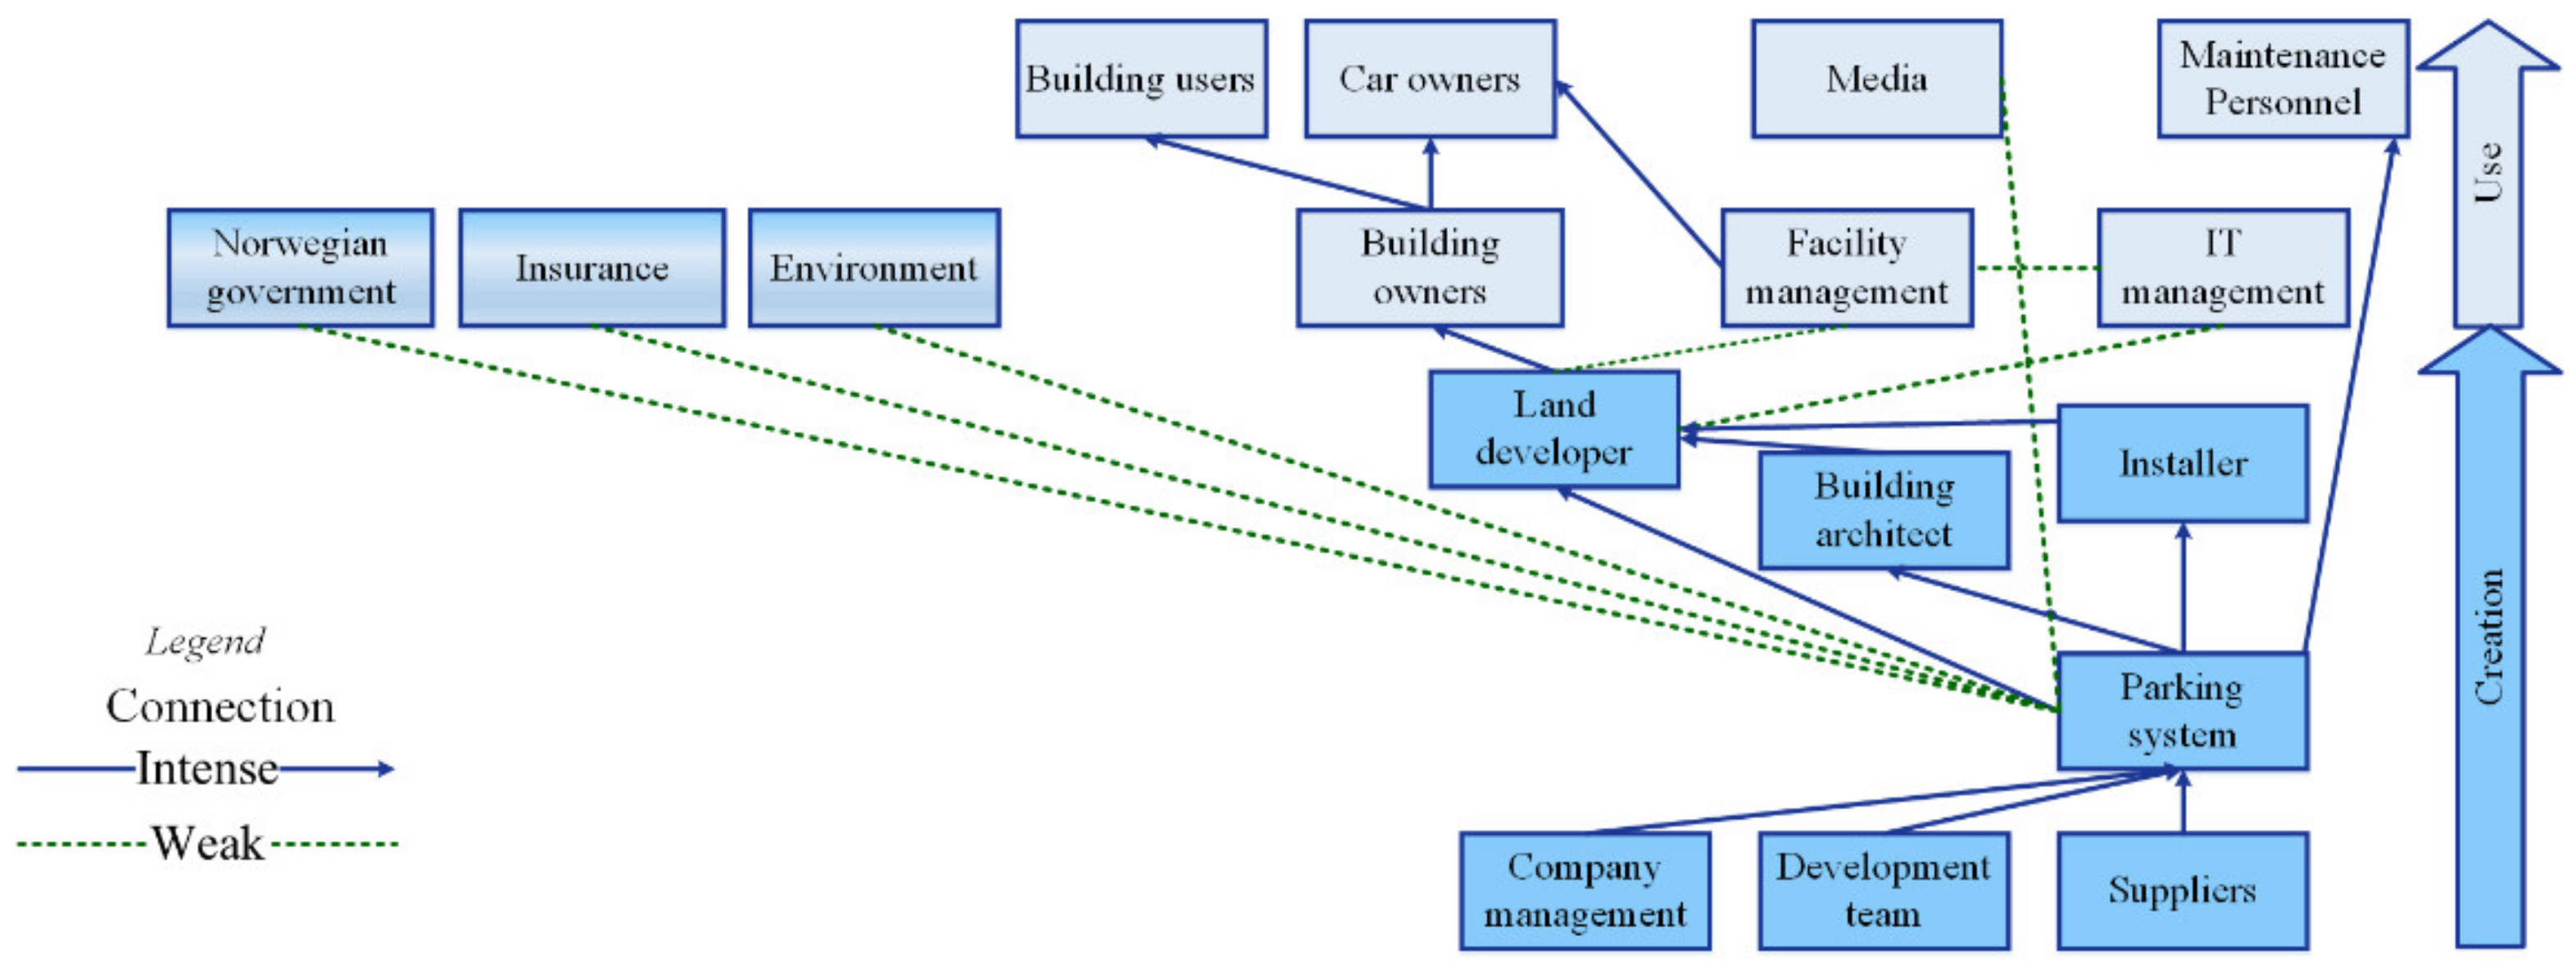
Value Network
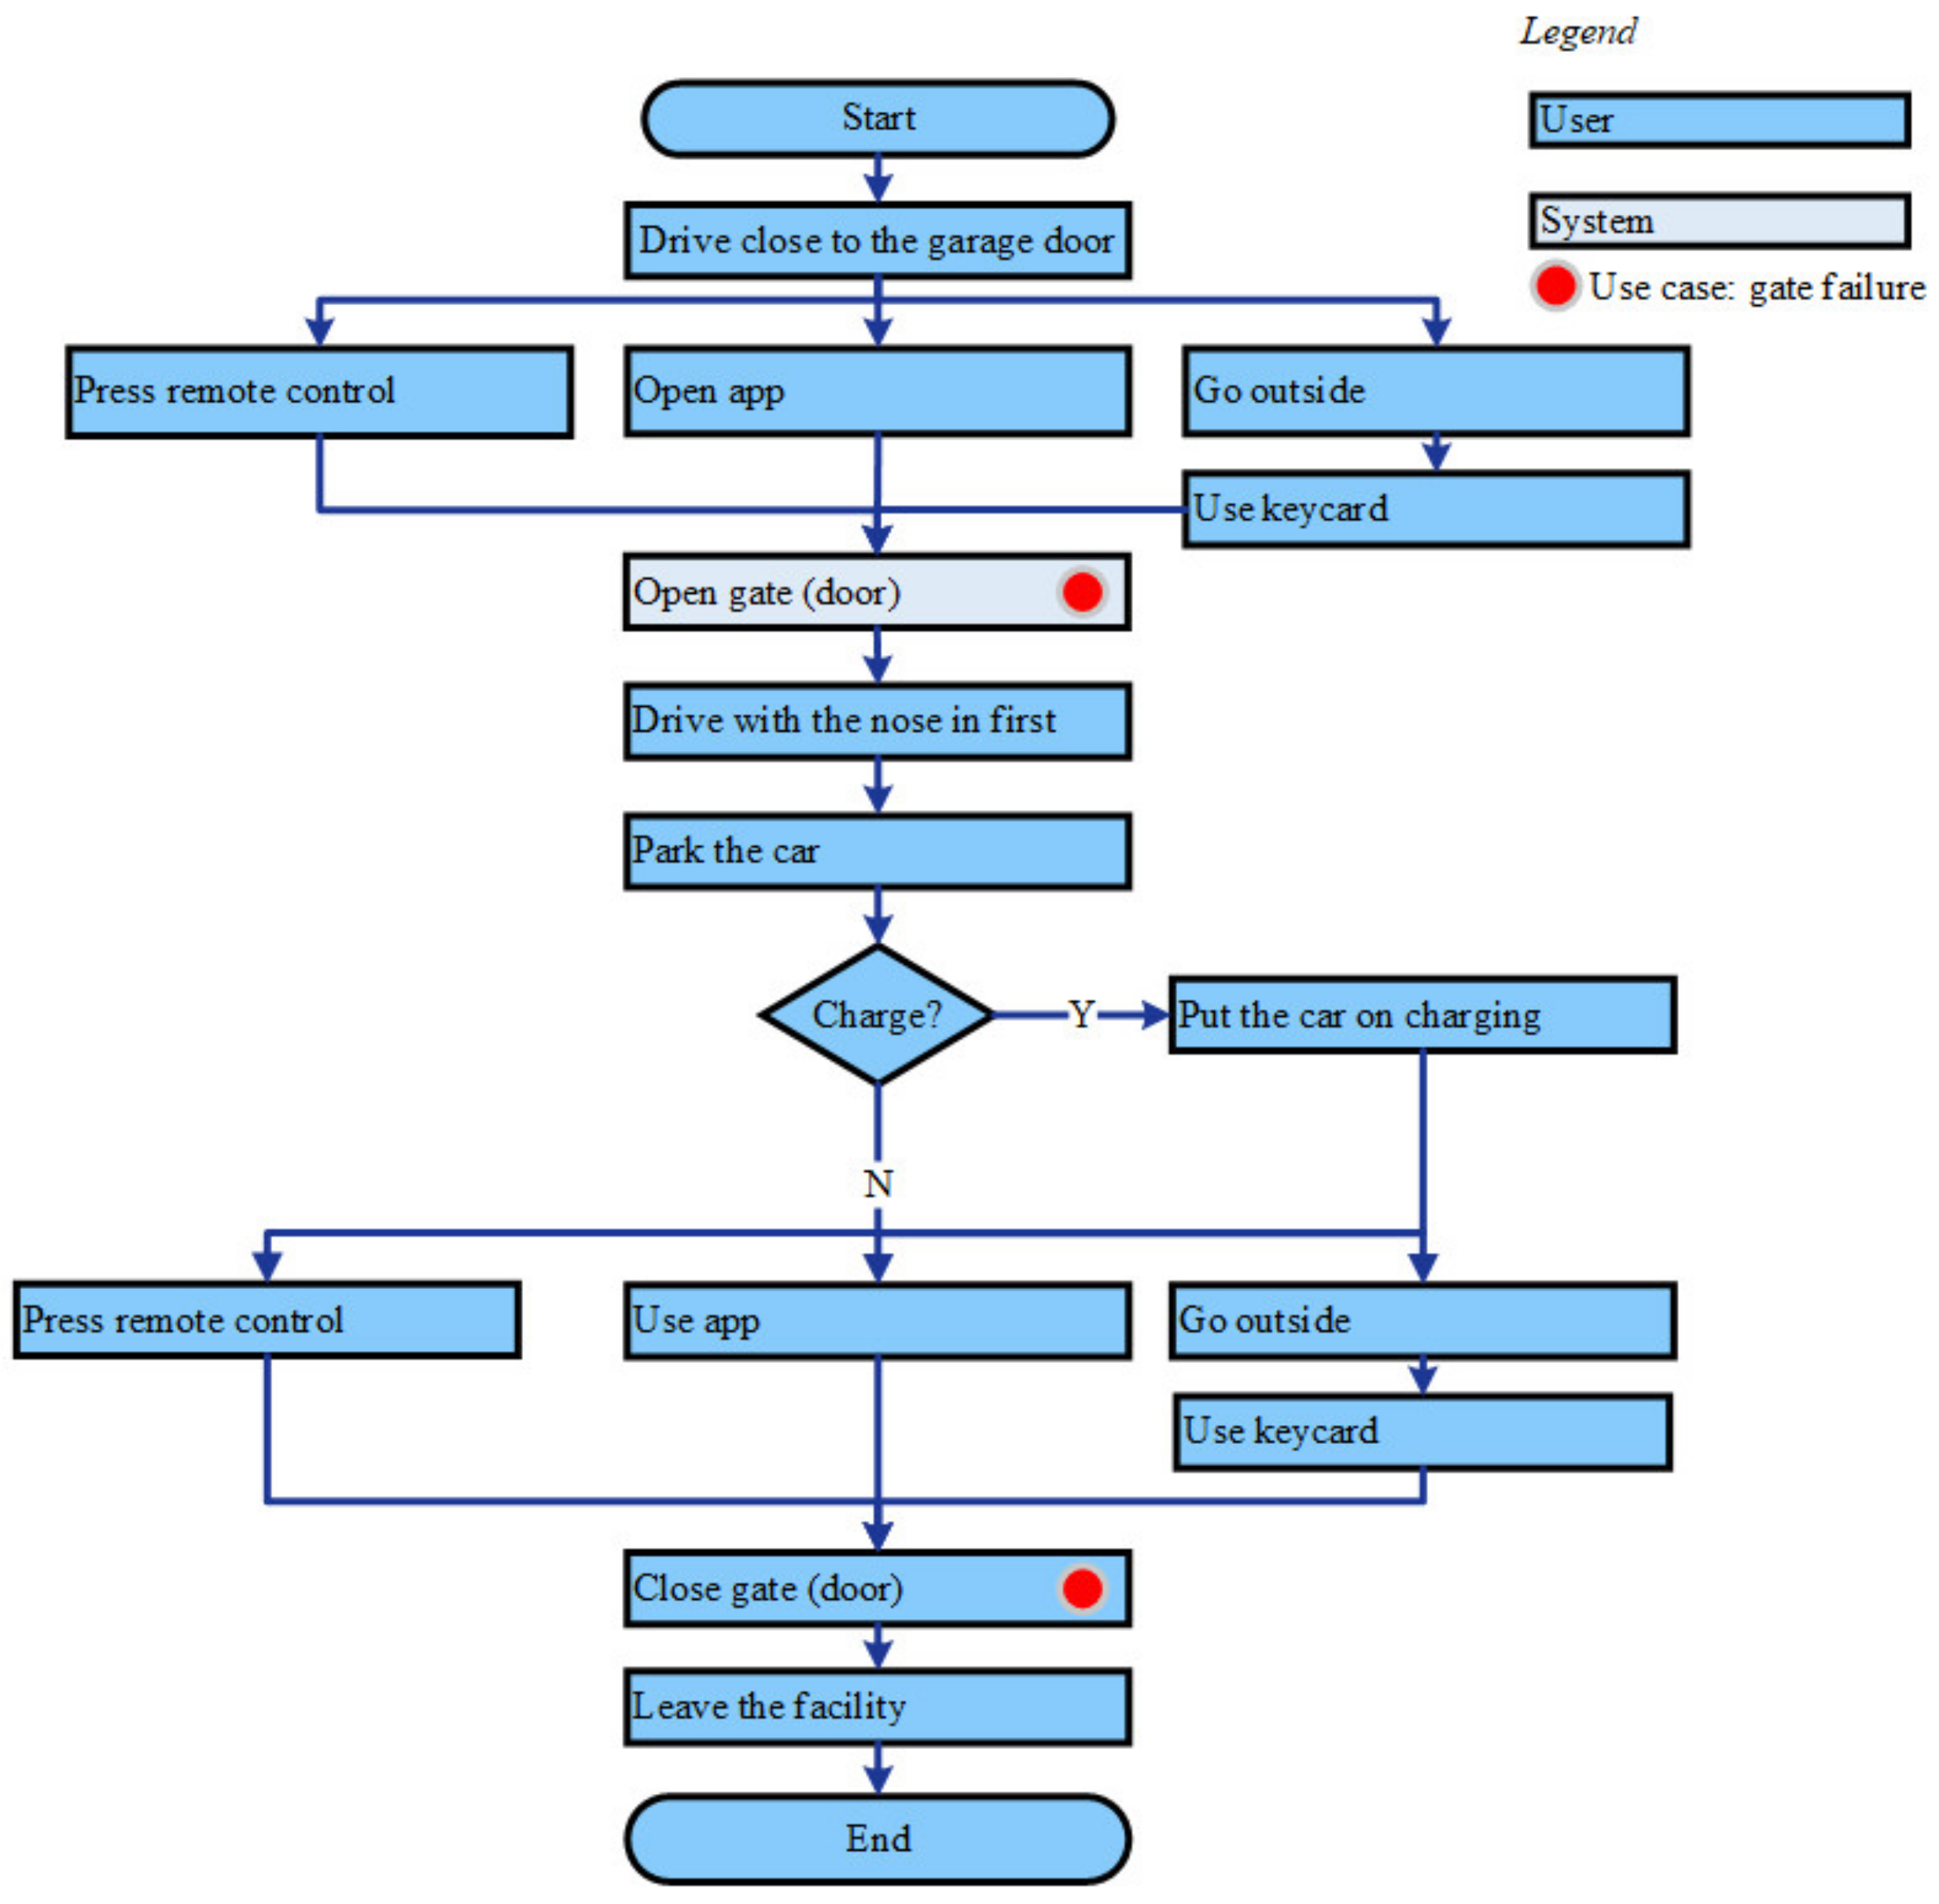
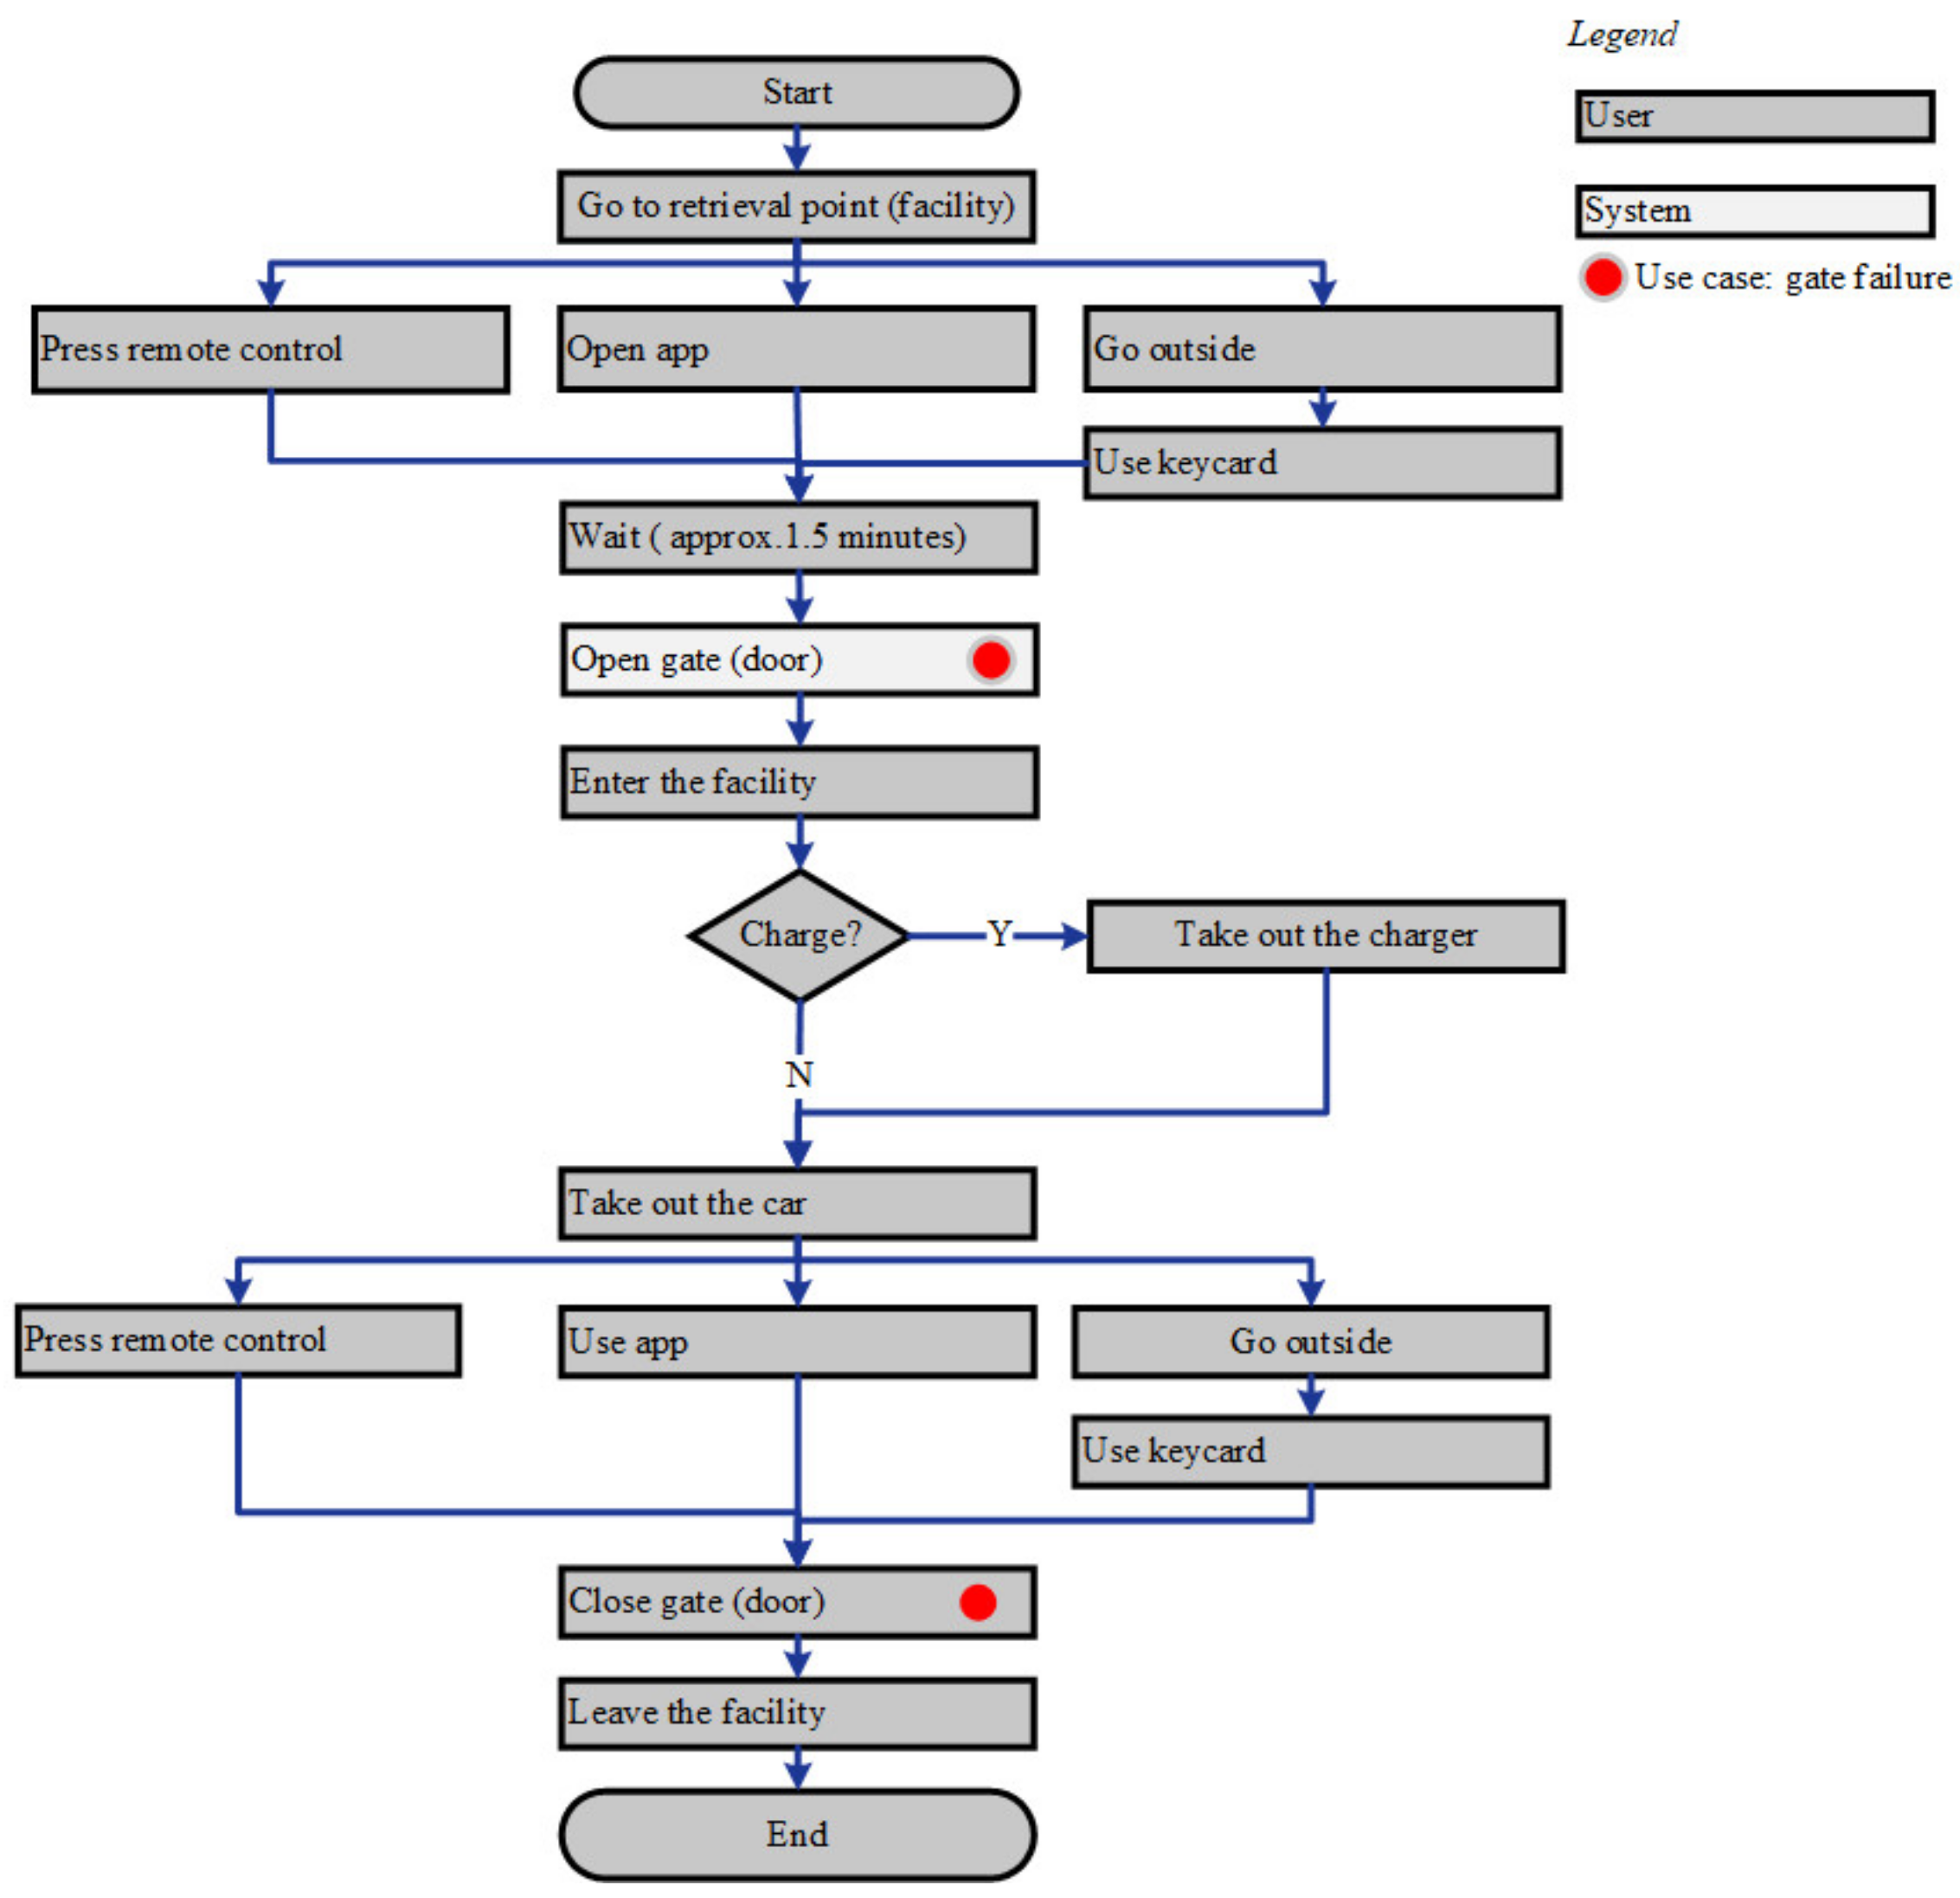
Workflow
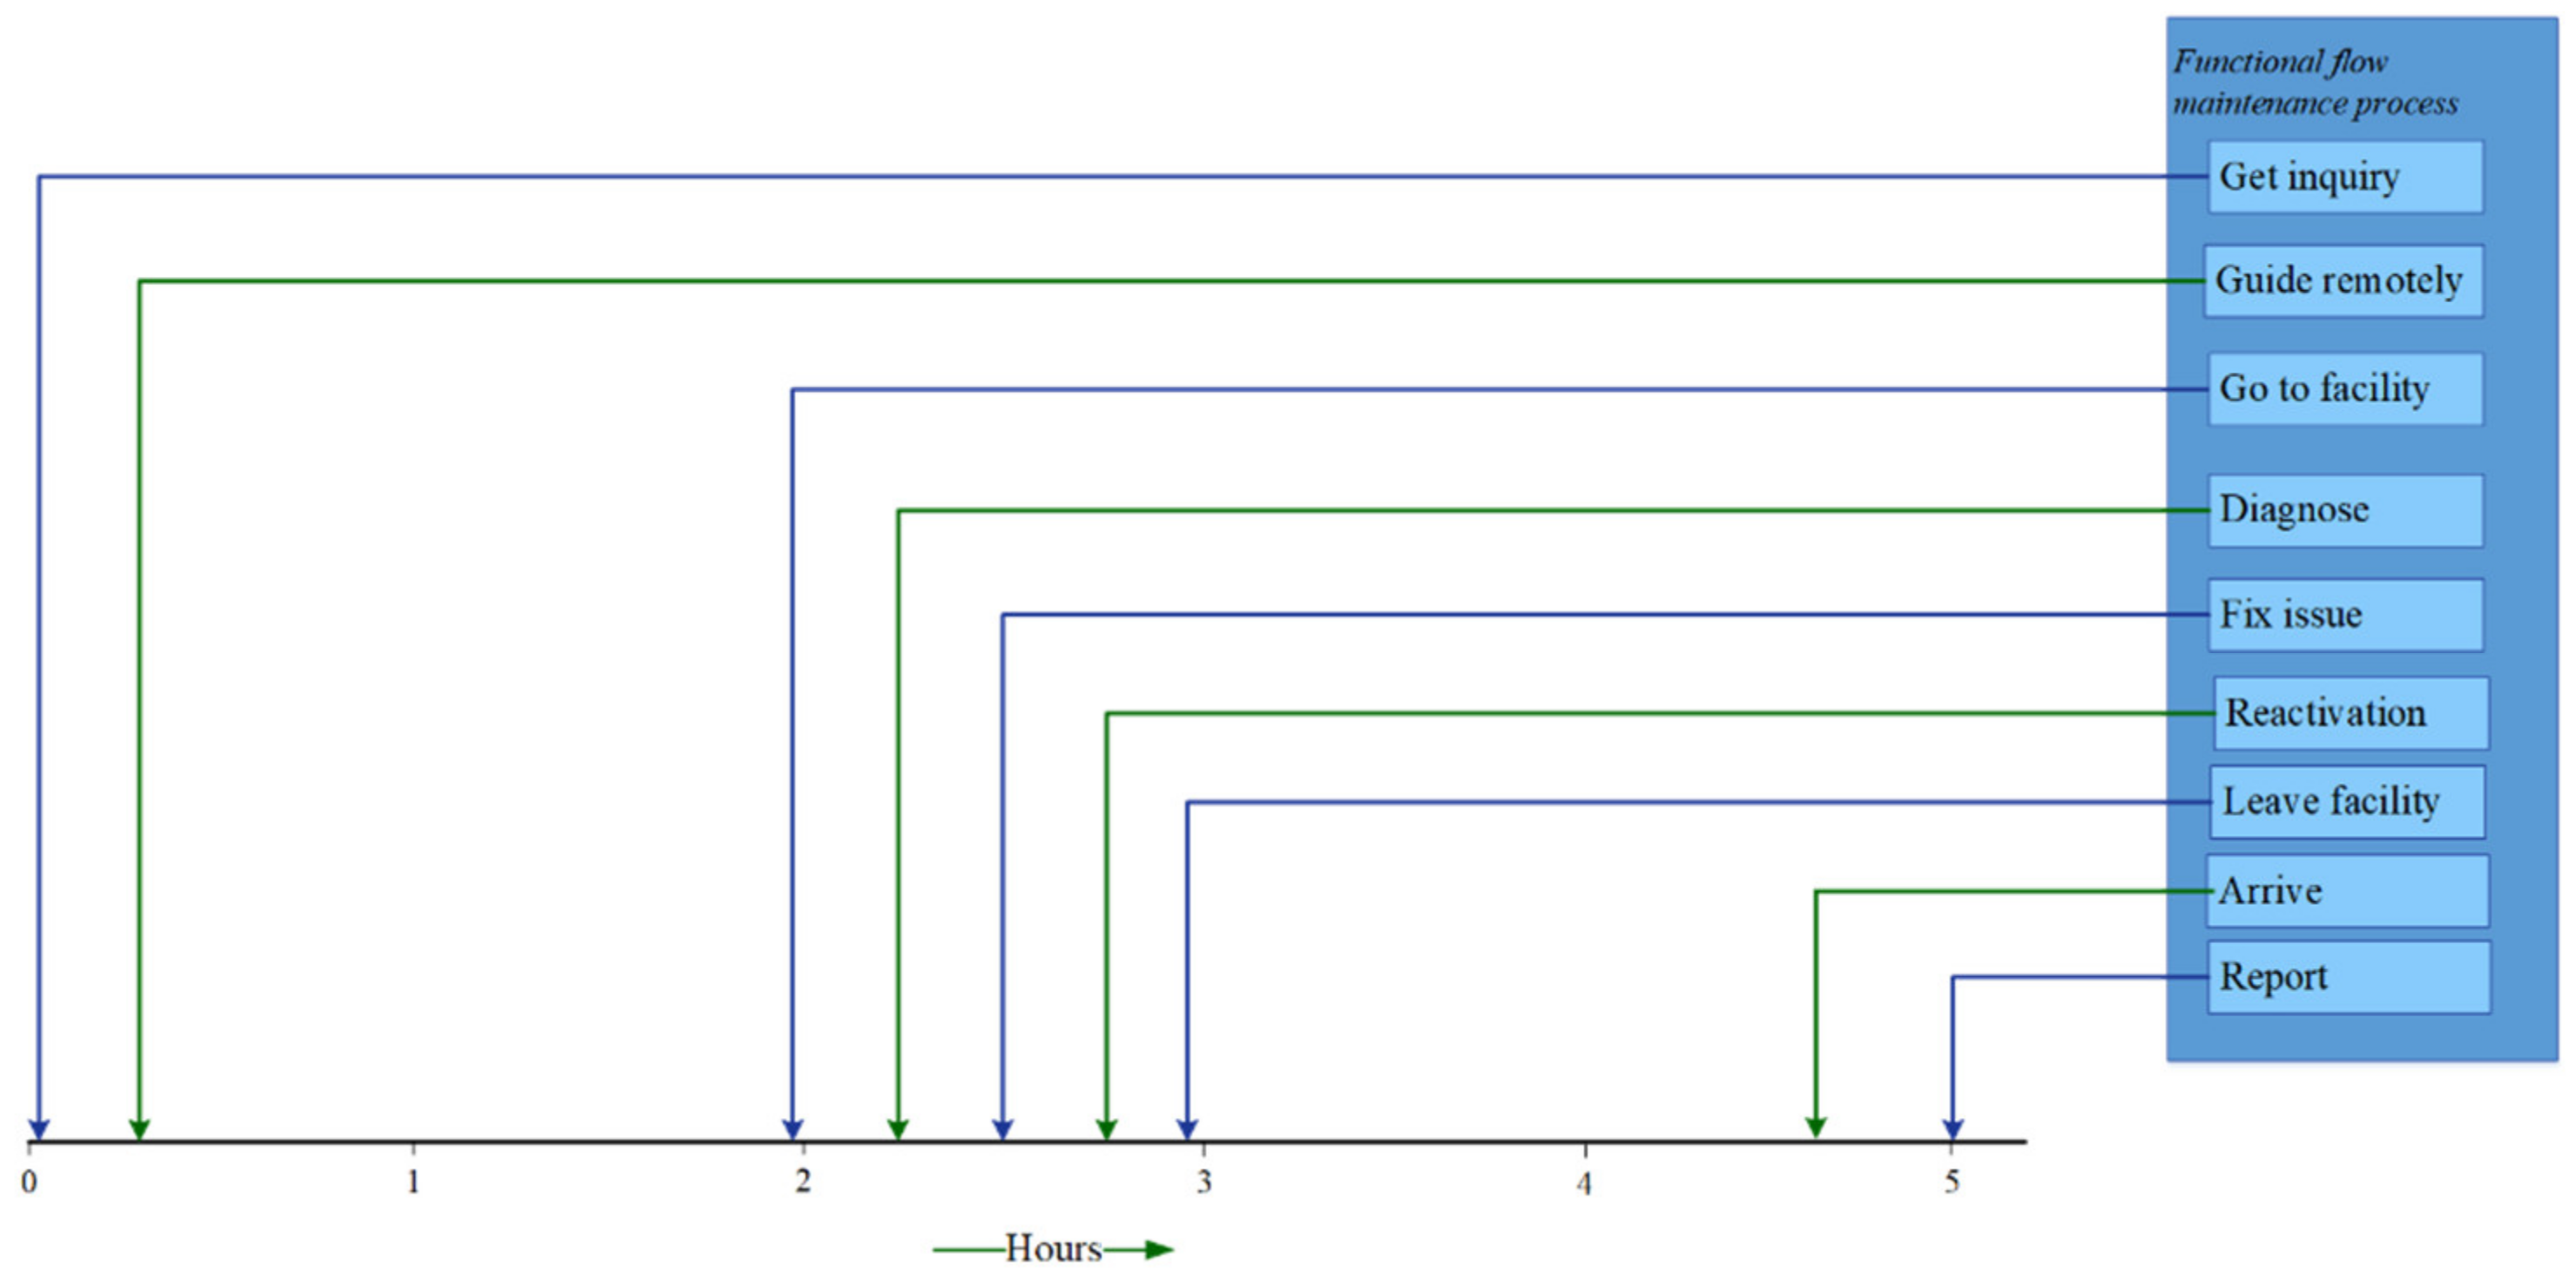
Functional Flow for the Maintenance Process
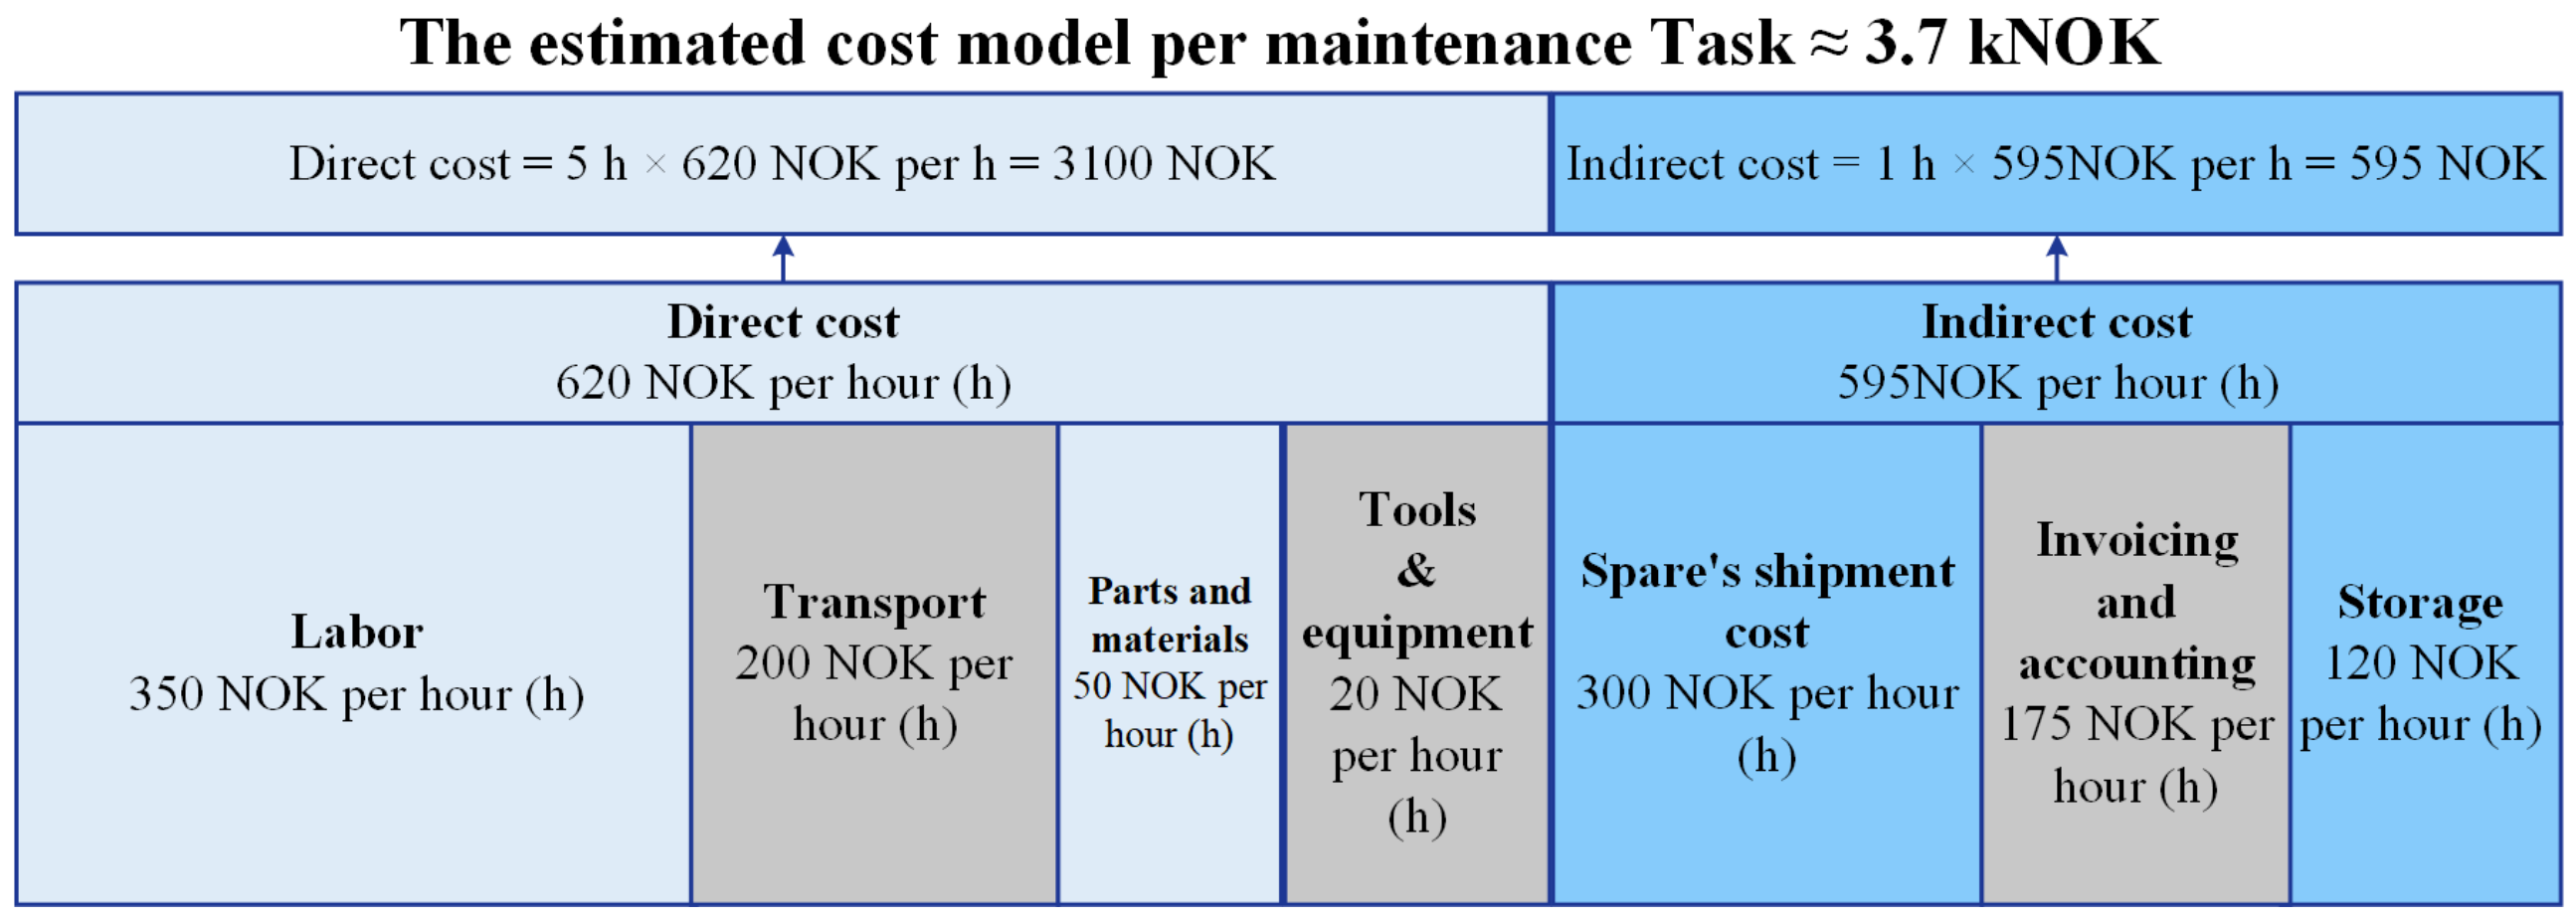
Cost Estimation Model
4.2. Case Study: Conclusion and Recommendation
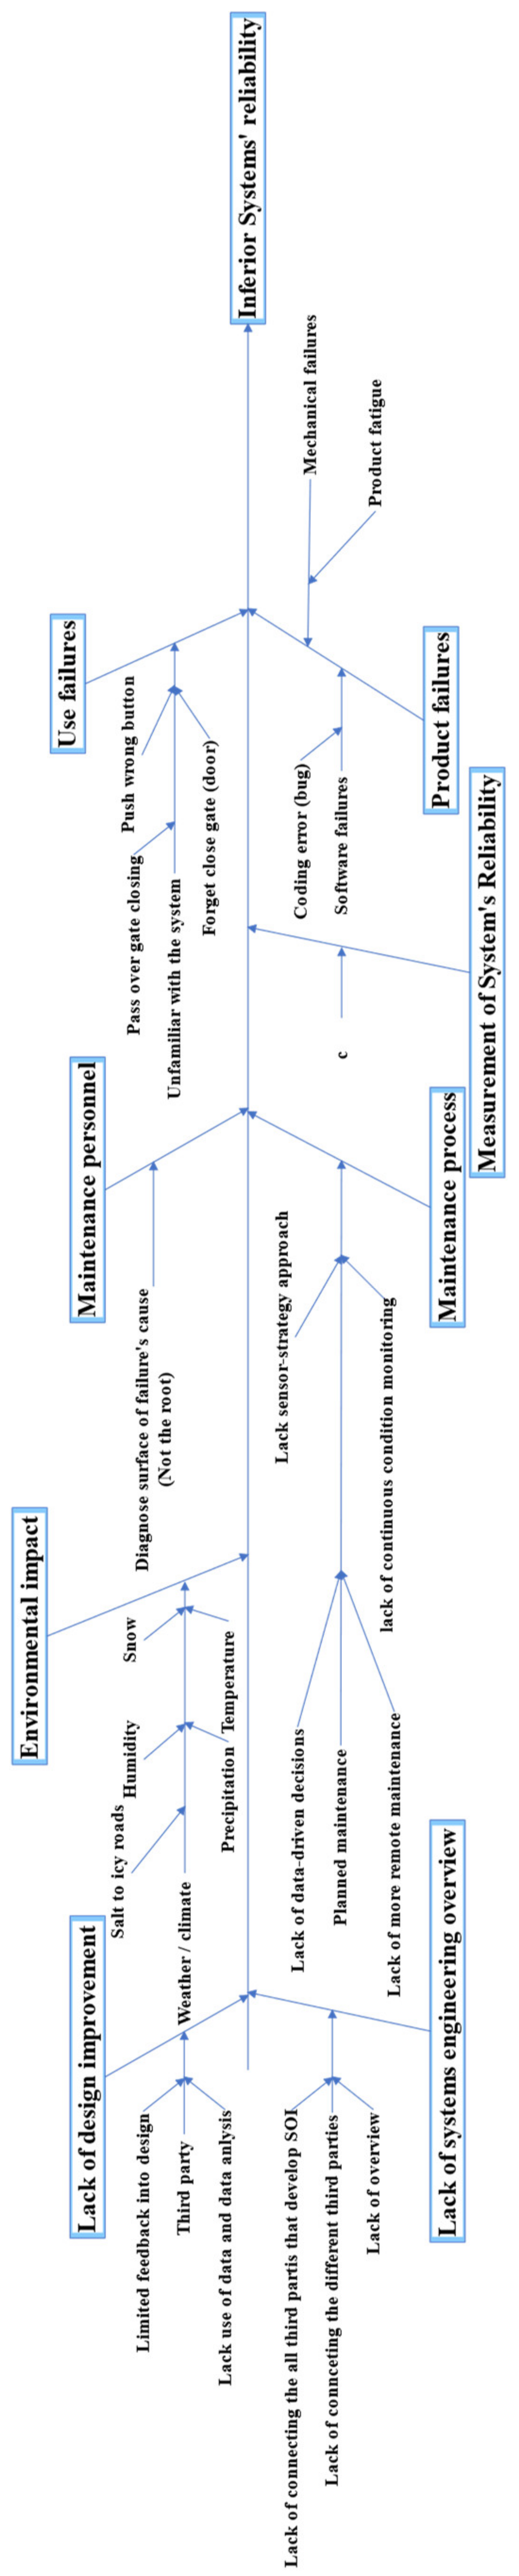
4.2.1. Cause and Effect of the Failure Events
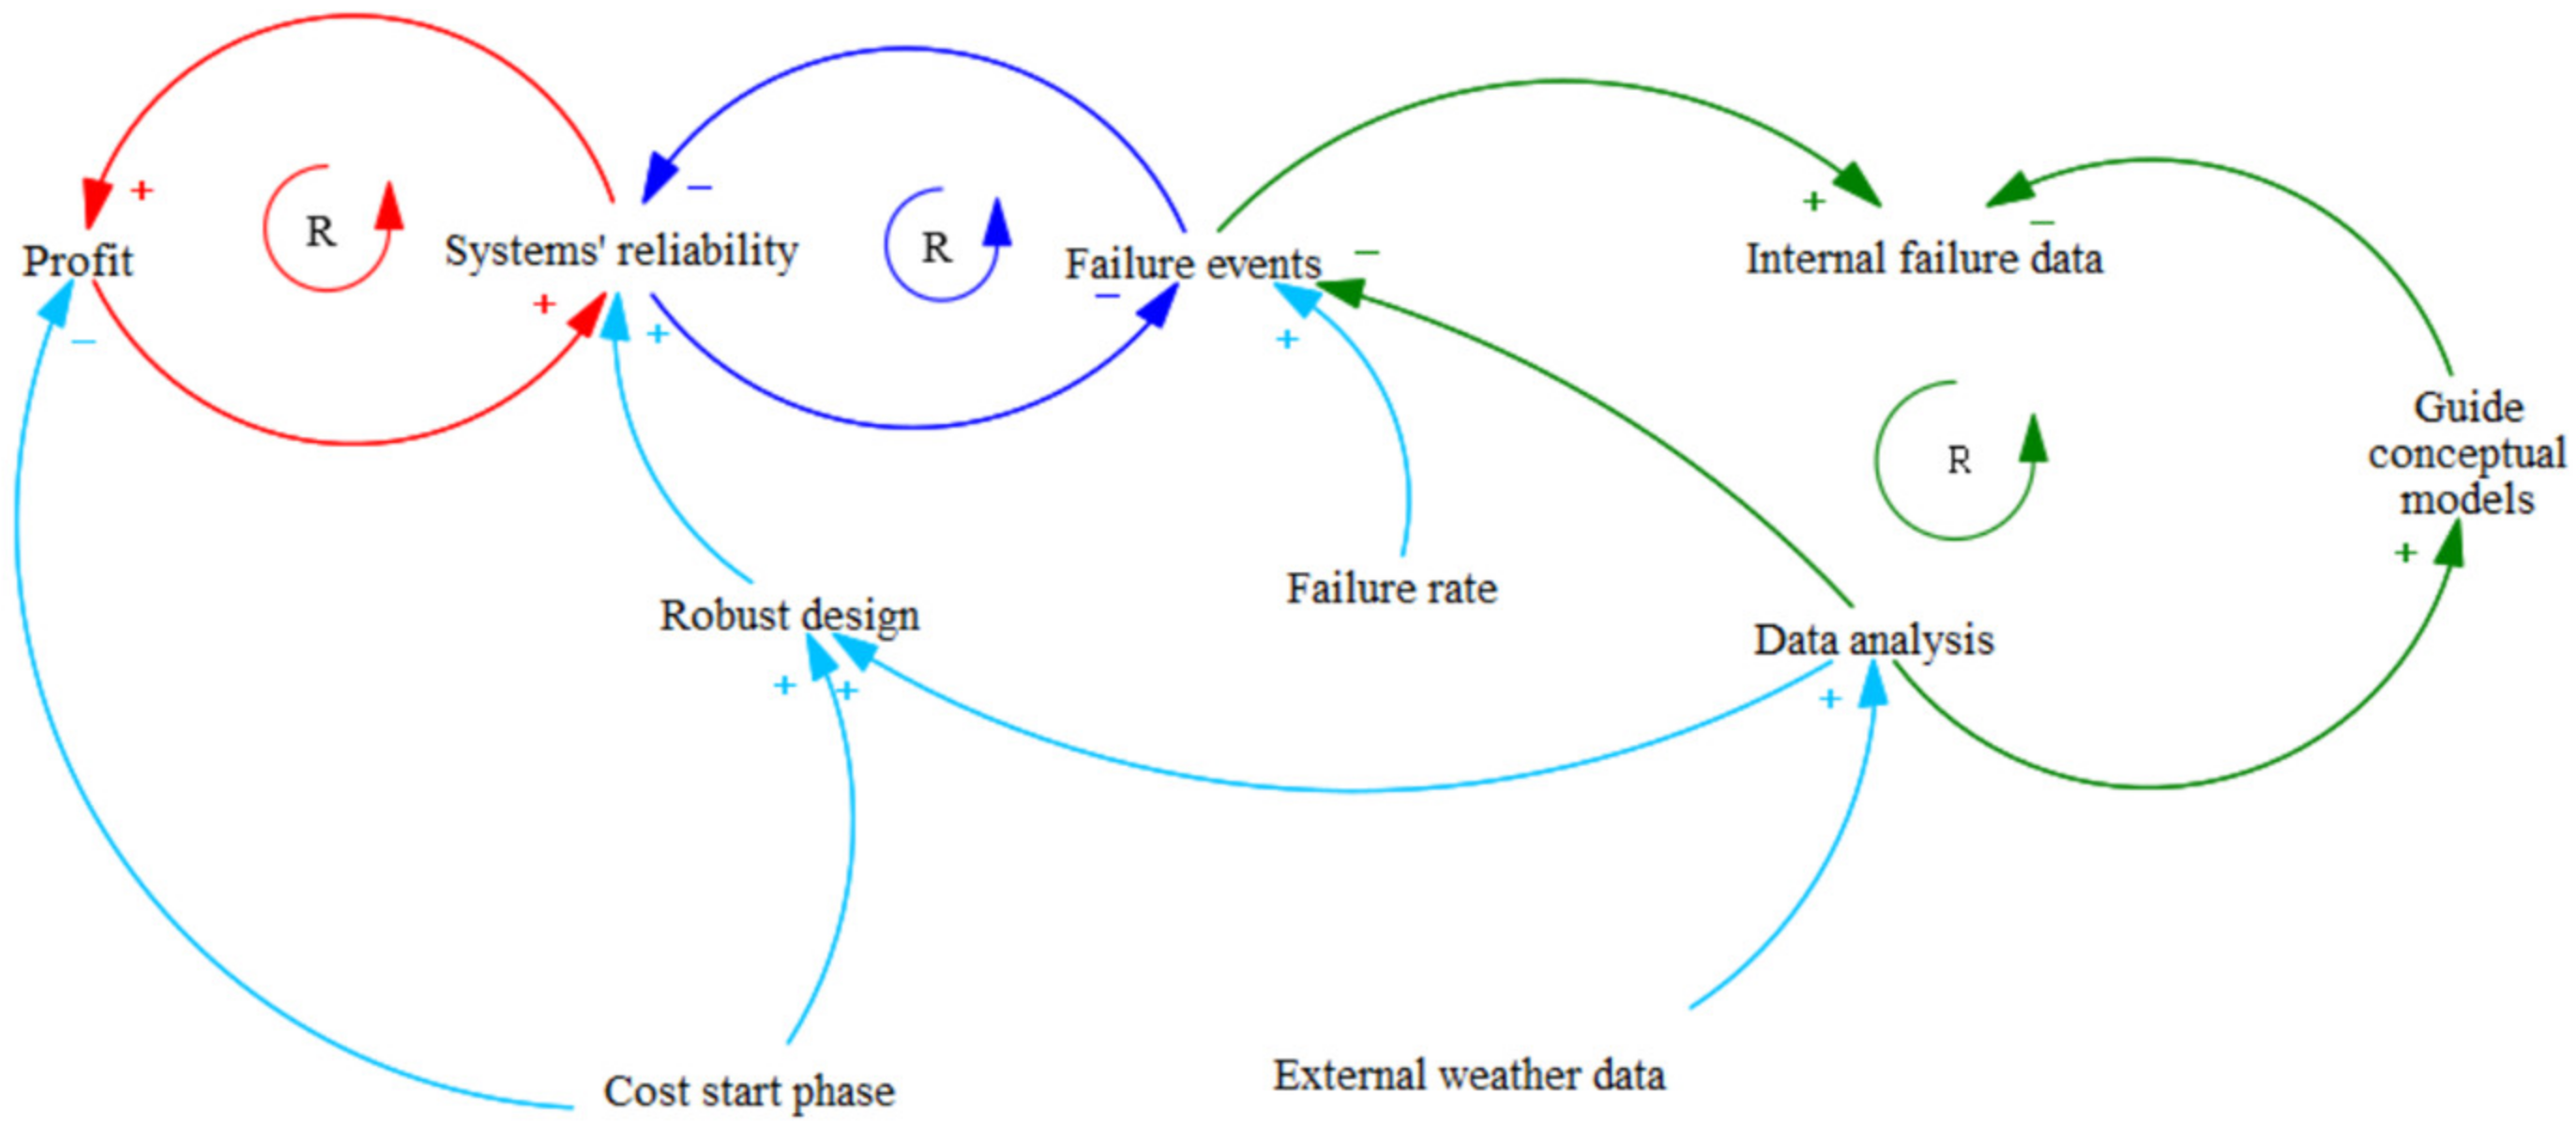
4.2.2. Casual Loop System’s Reliability
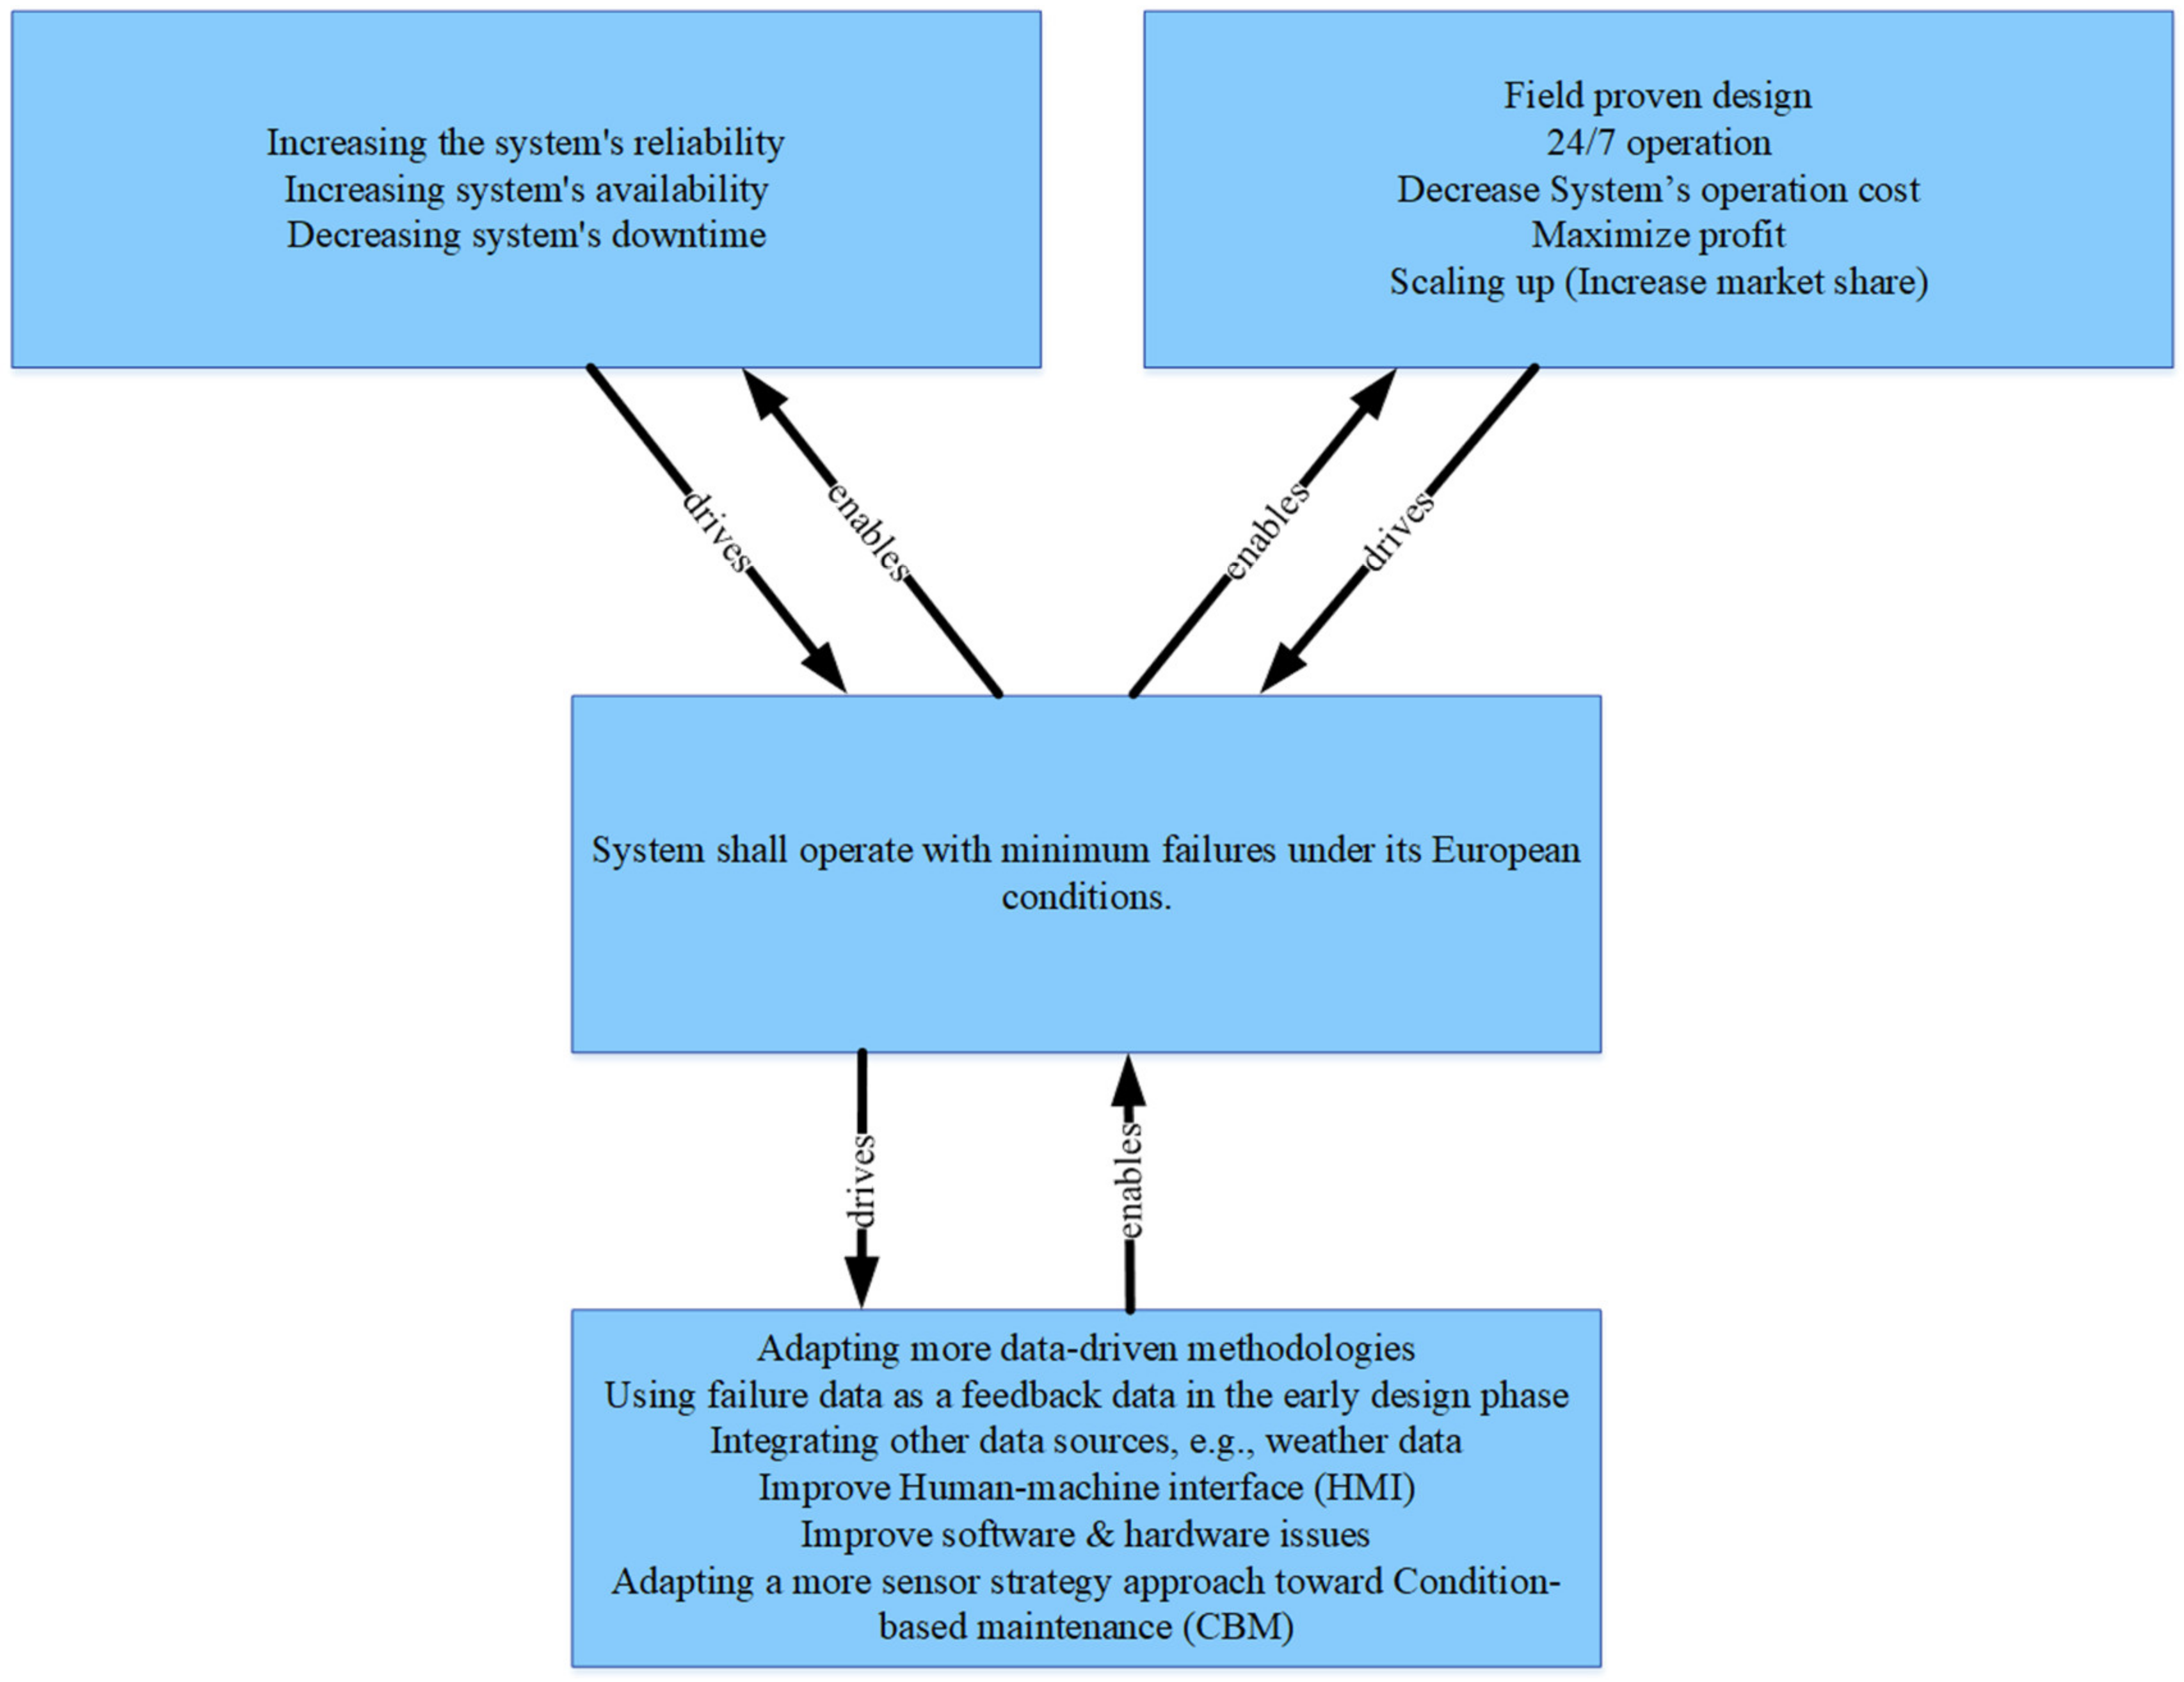
4.2.3. Elevator Pitch: Conclusion and Recommendation
- The left upper box lists the customer value proposition. This value includes increasing the system’s reliability, which decreases the system’s downtime and increases its availability.
- The upper right box lists the business propositions. These propositions are field-proven designs that allow 24/7 operations in order to increase the market share and thus maximize profits.
- The middle box lists the system’s requirements. The most vital system requirement is that the system shall operate with minimum failures under its European condition. These European conditions include mainly the western Europe market. This requirement is triggered by the customer and business value propositions. The system’s requirement focuses on increasing the system’s reliability.
- The lower box in the middle lists the system’s design and technology. The design and technology include several aspects, focusing on integrating data into the company’s development and maintenance processes by adopting more data-driven methodologies. This methodology can use feedback data such as failure data in the early phase of the PD process and the maintenance process. The data-driven methodology should include external data such as weather data to investigate the environmental factors and to form an explanation and correlation between failure events and other environmental factors. These factors include humidity, snow, salt, temperature, etc. The design and technology suggest improving the HMI within the PD and, in addition, improving the software issues (bugs) and hardware issues. Improving these issues is more urgent than the plan for the company, which includes introducing a sensor strategy toward CBM to build further digital twins. We conducted a case study exploration of this actual need in [15]. However, these envisions regarding the CBM can start by adapting the failure data analysis. For instance, the sensors can be installed in the most critical subsystem for remote health monitoring, further building up the CBM by using sensor strategies and by installing sensors for the next critical subsystem, i.e., the platform (ref. Figure 10).
5. Discussion
5.1. Conceptual Modeling and Data Analysis Improve System Developers’ Understanding
5.2. Conceptual Modeling Facilitates Data Identification to Increase A System’s Reliability
5.3. Eeffective Conceptual Models That Facilitate the Product Developers’ Understanding
5.4. Research Limitations
6. Conclusions
Author Contributions
Funding
Institutional Review Board Statement
Informed Consent Statement
Data Availability Statement
Acknowledgments
Conflicts of Interest
Appendix A

References
- Research, H.A. What Is an Automatic Parking System? Available online: https://www.caranddriver.com/research/a31995865/automatic-parking-systems/ (accessed on 15 May 2022).
- Nourinejad, M.; Bahrami, S.; Roorda, M.J. Designing Parking Facilities for Autonomous Vehicles. Trans. Res. Part B Methodol. 2018, 109, 110–127. [Google Scholar] [CrossRef]
- Zhu, Y.; Ye, X.; Chen, J.; Yan, X.; Wang, T. Impact of Cruising for Parking on Travel Time of Traffic Flow. Sustainability 2020, 12, 3079. [Google Scholar] [CrossRef] [Green Version]
- Grand View Research Automated Parking Systems Market Size Report, 2020–2027. Available online: https://www.grandviewresearch.com/industry-analysis/automated-parking-systems-market (accessed on 21 January 2022).
- Cudney, G. Parking Today|Articles—Automated Parking: Is It Right for You? Available online: https://www.parkingtoday.com/articledetails.php?id=181&t=automated-parking-is-it-right-for-you (accessed on 21 January 2022).
- Robles, F. Road to Robotic Parking Is Littered with Faulty Projects. The New York Times, 27 November 2015. [Google Scholar]
- Barnard, R.W.A. 3.2.2 What is wrong with reliability engineering? In Proceedings of the INCOSE International Symposium, Utrecht, The Netherlands, 15–19 June 2008; Wiley Online Library: Hoboken, NJ, USA, 2008; Volume 18, pp. 357–365. [CrossRef]
- Hosseini, H.N.; Welo, T. A framework for integrating reliability and systems engineering: Proof-of-concept experiences. In Proceedings of the INCOSE International Symposium, Edinburgh, UK, 18–21 July 2016; Wiley Online Library: Hoboken, NJ, USA, 2016; Volume 26, pp. 1059–1073. [Google Scholar] [CrossRef]
- Dhillon, B.S. Robot System Reliability and Safety: A Modern Approach; CRC Press: Boca Raton, FL, USA, 2015. [Google Scholar]
- Kozak, K.H.; Graham, C.H.; Wiens, J.J. Integrating GIS-Based Environmental Data into Evolutionary Biology. Trends Ecol. Evol. 2008, 23, 141–148. [Google Scholar] [CrossRef] [PubMed]
- Jørgensen, S.E. Handbook of Environmental Data and Ecological Parameters: Environmental Sciences and Applications; Elsevier: Amsterdam, The Netherlands, 2013; Volume 6. [Google Scholar]
- Klein, G.; Phillips, J.K.; Rall, E.L.; Peluso, D.A. A Data–Frame Theory of Sensemaking. In Expertise Out of Context; Psychology Press: London, UK, 2007; pp. 118–160. [Google Scholar]
- Weick, K.E. Sensemaking in Organizations; Sage: Newcastle upon Tyne, UK, 1995; Volume 3. [Google Scholar]
- Muller, G. Applying Roadmapping and Conceptual Modeling to the Energy Transition: A Local Case Study. Sustainability 2021, 13, 3683. [Google Scholar] [CrossRef]
- Ali, H.B.; Muller, G.; Salim, F.A. Applying conceptual modeling and failure data analysis for “Actual Need” exploration. In Proceedings of the MODERN SYSTEMS 2022: International Conference of Modern Systems Engineering Solutions, Saint-Laurent-du-Var, France, 24–28 July 2022. [Google Scholar]
- O’Connor, P.; Kleyner, A. Practical Reliability Engineering; John Wiley & Sons: Hoboken, NJ, USA, 2012. [Google Scholar]
- Walden, D.D.; Roedler, G.J.; Forsberg, K.; Hamelin, R.D.; Shortell, T.M. Systems Engineering Handbook: A Guide for System Life Cycle Processes and Activities; John Wiley & Sons: Hoboken, NJ, USA, 2015. [Google Scholar]
- Long, E.A.; Tananko, D. Best practices methods for robust design for reliability with parametric cost estimates. In Proceedings of the 2011 Proceedings—Annual Reliability and Maintainability Symposium, Lake Buena Vista, FL, USA, 24–27 January 2011; IEEE: Piscataway, NJ, USA, 2011; pp. 1–6. [Google Scholar]
- Barnard, A. Reliability engineering: Value, waste, and costs. In Proceedings of the INCOSE International Symposium, Edinburgh, UK, 18–21 July 2016; Wiley Online Library: Hoboken, NJ, USA, 2016; Volume 26, pp. 2041–2054. [Google Scholar] [CrossRef]
- Hollis, R. Put Engineering Efforts Back in Reliability Techniques. IEEE Trans. Parts Mater. Packag. 1965, 1, 297–302. [Google Scholar] [CrossRef]
- Coppola, A. Reliability Engineering of Electronic Equipment a Historical Perspective. IEEE Trans. Rel. 1984, 33, 29–35. [Google Scholar] [CrossRef]
- Krasich, M. How to Estimate and Use MTTF/MTBF Would the Real MTBF Please Stand Up? In Proceedings of the 2009 Annual Reliability and Maintainability Symposium, Fort Worth, TX, USA, 26–29 January 2009; IEEE: Piscataway, NJ, USA, 2009; pp. 353–359. [Google Scholar]
- Ridgway, M.; Baretich, M.F.; Clark, M.; Grimes, S.; Iduri, B.; Lane, M.W.; Lipschultz, A.; Lum, N. A Rational Approach to Efficient Equipment Maintenance, Part 2: A Comprehensive AEM Program. Biomed. Instrum. Technol. 2018, 52, 350–356. [Google Scholar] [CrossRef]
- Unhelkar, B. Big Data Strategies for Agile Business; CRC Press: Boca Raton, FL, USA, 2017. [Google Scholar]
- Jifa, G. Data, Information, Knowledge, Wisdom and Meta-Synthesis of Wisdom-Comment on Wisdom Global and Wisdom Cities. Procedia Comput. Sci. 2013, 17, 713–719. [Google Scholar] [CrossRef] [Green Version]
- Bellinger, G.; Castro, D.; Mills, A. Data, Information, Knowledge, and Wisdom. 2004. Available online: https://www.systems-thinking.org/dikw/dikw.htm (accessed on 21 December 2022).
- Ali, H.B.; Salim, F.A. Transferring Tacit Knowledge into Explicit: A Case Study in a Fully (Semi) Automated Parking Garage. In Proceedings of the Society for Design and Process Science, Online, Kongsberg, Norway, 15 December 2021. [Google Scholar]
- Laun, A.; Mazzuchi, T.A.; Sarkani, S. Conceptual Data Model for System Resilience Characterization. Syst. Eng. 2022, 25, 115–132. [Google Scholar] [CrossRef]
- Henderson, D.; Earley, S. DAMA-DMBOK: Data Management Body of Knowledge; Technics Publications: Basking Ridge, NJ, USA, 2017. [Google Scholar]
- Birkland, T.A. Lessons of Disaster: Policy Change after Catastrophic Events; Georgetown University Press: Washington, DC, USA, 2006. [Google Scholar]
- Kunreuther, H.; Useem, M. Learning from Catastrophes: Strategies for Reaction and Response; Pearson Prentice Hall: Upper Saddle River, NJ, USA, 2009. [Google Scholar]
- Ramos, A.L.; Ferreira, J.V.; Barceló, J. Model-Based Systems Engineering: An Emerging Approach for Modern Systems. IEEE Trans. Syst. Man Cybern. Part C (Appl. Rev.) 2011, 42, 101–111. [Google Scholar] [CrossRef]
- Engen, S.; Falk, K.; Muller, G. Conceptual Models to Support Reasoning in Early Phase Concept Evaluation-A Subsea Case Study. In Proceedings of the 2021 16th International Conference of System of Systems Engineering (SoSE), Västerås, Sweden, 14–18 June 2021; IEEE: Piscataway, NJ, USA, 2021; pp. 95–101. [Google Scholar]
- Plattner, H.; Meinel, C.; Leifer, L. Design Thinking Research: Making Design Thinking Foundational; Springer: Berlin/Heidelberg, Germany, 2015. [Google Scholar]
- Wettre, A.; Sevaldson, B.; Dudani, P. Bridging Silos: A New Workshop Method for Bridging Silos. In Proceedings of the RSD8, Chicago, IL, USA, 13–15 October 2019. [Google Scholar]
- Neely, K.; Bortz, M.; Bice, S. Using Collaborative Conceptual Modelling as a Tool for Transdisciplinarity. Evid. Policy 2021, 17, 161–172. [Google Scholar] [CrossRef]
- Sargent, R.G. Verification and Validation of Simulation Models. J. Simul. JOS 2013, 7, 12–24. [Google Scholar] [CrossRef] [Green Version]
- Balci, O.; Arthur, J.D.; Nance, R.E. Accomplishing Reuse with a Simulation Conceptual Model. In Proceedings of the 2008 Winter Simulation Conference, Miami, FL, USA, 7–10 December 2008; IEEE: Piscataway, NJ, USA, 2008; pp. 959–965. [Google Scholar]
- Montevechi, J.A.B.; Friend, J.D. Using a Soft Systems Methodology Framework to Guide the Conceptual Modeling Process in Discrete Event Simulation. In Proceedings of the 2012 Winter Simulation Conference (WSC), Berlin, Germany, 9–12 December 2012; IEEE: Piscataway, NJ, USA, 2012; pp. 1–12. [Google Scholar]
- Robinson, S. Conceptual Modelling for Simulation Part I: Definition and Requirements. J. Oper. Res. Soc. 2008, 59, 278–290. [Google Scholar] [CrossRef] [Green Version]
- Robinson, S. Conceptual Modelling for Simulation Part II: A Framework for Conceptual Modelling. J. Oper. Res. Soc. 2008, 59, 291–304. [Google Scholar] [CrossRef]
- Gorod, A.; Hallo, L.; Ireland, V.; Gunawan, I. Evolving Toolbox for Complex Project Management; CRC Press: Boca Raton, FL, USA, 2019. [Google Scholar]
- Lavi, R.; Dori, Y.J.; Dori, D. Assessing Novelty and Systems Thinking in Conceptual Models of Technological Systems. IEEE Trans. Educ. 2020, 64, 155–162. [Google Scholar] [CrossRef]
- Muller, G. Tutorial Architectural Reasoning Using Conceptual Modeling. In Proceedings of the at INCOSE International Symposium, Seattle, WA, USA, 13–16 July 2015. [Google Scholar]
- Blanchard, B.S. Systems Engineering and Analysis, 5th ed.; Prentice Hall International Series in Industrial and Systems Engineering; Pearson: Boston, MA, USA, 2011; ISBN 978-0-13-714843-1. [Google Scholar]
- Tomita, Y.; Watanabe, K.; Shirasaka, S.; Maeno, T. Applying Design Thinking in Systems Engineering Process as an Extended Version of DIKW Model. In Proceedings of the INCOSE International Symposium, Adelaide, SA, Australia, 15–20 July 2017; Wiley Online Library: Hoboken, NJ, USA, 2017; Volume 27, pp. 858–870. [Google Scholar] [CrossRef]
- Jackson, M.C. Critical Systems Thinking and the Management of Complexity: Responsible Leadership for a Complex World, 1st ed.; Wiley: Hoboken, NJ, USA, 2019; ISBN 978-1-119-11838-1. [Google Scholar]
- Sauser, B.; Mansouri, M.; Omer, M. Using Systemigrams in Problem Definition: A Case Study in Maritime Resilience for Homeland Security. J. Homel. Secur. Emerg. Mang. 2011, 8, 102202154773551773. [Google Scholar] [CrossRef]
- Muller, G. CAFCR: A Multi-View Method for Embedded Systems Architecting; Balancing Genericity and Specificity. Ph.D. Thesis, Technical University of Delft, Delft, The Netherlands, 2004. [Google Scholar]
- Muller, G. Challenges in Teaching Conceptual Modeling for Systems Architecting. In Advances in Conceptual Modeling, Proceedings of the International Conference on Conceptual Modeling, Stockholm, Sweden, 19–22 October 2015; Springer: Cham, Switzerland, 2015; pp. 317–326. [Google Scholar]
- Ali, H.B.; Langen, T.; Falk, K. Research Methodology for Industry-academic Collaboration—A Case Study. In Proceedings of the INCOSE International Symposium CSER, Trondheim, Norway, 24–26 March 2022; Wiley Online Library: Hoboken, NJ, USA, 2016; Volume 32 (Suppl. S2), pp. 187–201. [Google Scholar] [CrossRef]
- Yin, R.K. Applications of Case Study Research, 3rd ed.; SAGE: Los Angeles, CA, USA, 2012; ISBN 978-1-4129-8916-9. [Google Scholar]
- Potts, C. Software-Engineering Research Revisited. IEEE Softw. 1993, 10, 19–28. [Google Scholar] [CrossRef]
- Altrichter, H.; Kemmis, S.; McTaggart, R.; Zuber-Skerritt, O. The Concept of Action Research. Learn. Organ. 2002, 9, 125–131. [Google Scholar] [CrossRef]
- Stenström, C.; Al-Jumaili, M.; Parida, A. Natural Language Processing of Maintenance Records Data. Int. J. COMADEM 2015, 18, 33–37. [Google Scholar]
- Removing Stop Words from Strings in Python. Available online: https://stackabuse.com/removing-stop-words-from-strings-in-python/ (accessed on 7 September 2022).
- GeeksforGeeks. Snowball Stemmer—NLP. Available online: https://www.geeksforgeeks.org/snowball-stemmer-nlp/ (accessed on 21 December 2022).
- Han, S. Googletrans: Free Google Translate API for Python. Translates Totally Free of Charge. Available online: https://py-googletrans.readthedocs.io/en/latest/ (accessed on 21 December 2022).
- Gao, X.; Zhu, N. Hidden Markov Model and Its Application in Natural Language Processing. J. Theor. Appl. Inf. Technol. 2013, 12, 4256–4261. [Google Scholar] [CrossRef] [Green Version]
- Værmeldingen Forteller når Veien Saltes. Available online: https://www.vg.no/i/0m8x0 (accessed on 21 August 2022).
- Statens Vegvesen. Statens vegvesen Fellesdokument Driftskontrakt Veg D2: Tegninger Og Supplerende Dokumenter D2-ID9300a Bruk Av Salt. Available online: https://www.mercell.com/m/file/GetFile.ashx?id=151465704&version=0 (accessed on 21 December 2022).
- Engebakken, E.; Muller, G.; Pennotti, M. Supporting the System Architect: Model-Assisted Communication. In Proceedings of the Systems Research Forum, Kauai, HI, USA, 5–8 January 2010; World Scientific: Singapore, 2010; Volume 4, pp. 173–188. [Google Scholar] [CrossRef] [Green Version]
- Muller, G.; Pennotti, M. Developing the Modeling Recommendation Matrix: Model-Assisted Communication at Volvo Aero. In Proceedings of the INCOSE International Symposium, Rome, Italy, 9–12 July 2012; Wiley Online Library: Hoboken, NJ, USA, 2012; Volume 22, pp. 1870–1883. [Google Scholar] [CrossRef] [Green Version]
- Polanscak, E.; Muller, G. Supporting Product Development: A3-Assisted Communication and Documentation. Unpublished Master Project Paper at Buskerud Uni. Col. 2011. Available online: https://gaudisite.nl/SEMP_Polanscak_A3.pdf (accessed on 21 December 2022).
- Stalsberg, B.; Muller, G. Increasing the Value of Model-Assisted Communication: Modeling for Understanding, Exploration and Verification in Production Line Design Projects. In Proceedings of the INCOSE International Symposium, Las Vegas, NV, USA, 30 June–3 July 2014; Wiley Online Library: Hoboken, NJ, USA, 2014; Volume 24, pp. 827–842. [Google Scholar]
- Muller, G. System and Context Modeling—The Role of Time-Boxing and Multi-View Iteration. In Proceedings of the Systems Research Forum, Orlando, FL, USA, 13–16 July 2009; World Scientific: Singapore, 2009; Volume 3, pp. 139–152. [Google Scholar]
- Muller, G. Teaching Conceptual Modeling at Multiple System Levels Using Multiple Views. Procedia CIRP 2014, 21, 58–63. [Google Scholar] [CrossRef] [Green Version]
- Tip, T. Guidelines for Drawing Causal Loop Diagrams. Syst. Think. 2011, 22, 5–7. [Google Scholar]
- Hoyt, R.E.; Snider, D.H.; Thompson, C.J.; Mantravadi, S. IBM Watson Analytics: Automating Visualization, Descriptive, and Predictive Statistics. JMIR Public Health Surveill. 2016, 2, e5810. [Google Scholar] [CrossRef] [PubMed]
- Ali, H.B.; Helgesen, F.H.; Falk, K. Unlocking the Power of Big Data within the Early Design Phase of the New Product Development Process. In Proceedings of the INCOSE International Symposium, Virtual Event, 17–22 July 2021; Wiley Online Library: Hoboken, NJ, USA, 2021; Volume 31, pp. 434–452. [Google Scholar] [CrossRef]
- Deloitte Development LLC. Deloitte Sustainability Analytics the Three-Minute Guide. 2012. Available online: https://www2.deloitte.com/content/dam/Deloitte/global/Documents/Deloitte-Analytics/dttl-analytics-us-ba-sustainability3minguide.pdf (accessed on 21 December 2022).
- United Nations. The Sustainable Development Goals Report. 2017. Available online: https://unstats.un.org/sdgs/files/report/2017/thesustainabledevelopmentgoalsreport2017.pdf (accessed on 21 December 2022).


| MTBF Values | Estimated Cost Per Year in MNOK |
|---|---|
| 66 | 0.3–0.6 |
| 37 | 0.6–0.9 |
| 153 | 0.1–0.2 |
Disclaimer/Publisher’s Note: The statements, opinions and data contained in all publications are solely those of the individual author(s) and contributor(s) and not of MDPI and/or the editor(s). MDPI and/or the editor(s) disclaim responsibility for any injury to people or property resulting from any ideas, methods, instructions or products referred to in the content. |
© 2022 by the authors. Licensee MDPI, Basel, Switzerland. This article is an open access article distributed under the terms and conditions of the Creative Commons Attribution (CC BY) license (https://creativecommons.org/licenses/by/4.0/).
Share and Cite
Ali, H.B.; Muller, G.; Salim, F.A.; Falk, K.; Güldal, S. Increasing System Reliability by Applying Conceptual Modeling and Data Analysis—A Case Study: An Automated Parking System. Technologies 2023, 11, 7. https://doi.org/10.3390/technologies11010007
Ali HB, Muller G, Salim FA, Falk K, Güldal S. Increasing System Reliability by Applying Conceptual Modeling and Data Analysis—A Case Study: An Automated Parking System. Technologies. 2023; 11(1):7. https://doi.org/10.3390/technologies11010007
Chicago/Turabian StyleAli, Haytham B., Gerrit Muller, Fahim A. Salim, Kristin Falk, and Serkan Güldal. 2023. "Increasing System Reliability by Applying Conceptual Modeling and Data Analysis—A Case Study: An Automated Parking System" Technologies 11, no. 1: 7. https://doi.org/10.3390/technologies11010007