
A Conceptual Framework for Data Sensemaking in Product Development—A Case Study

Abstract
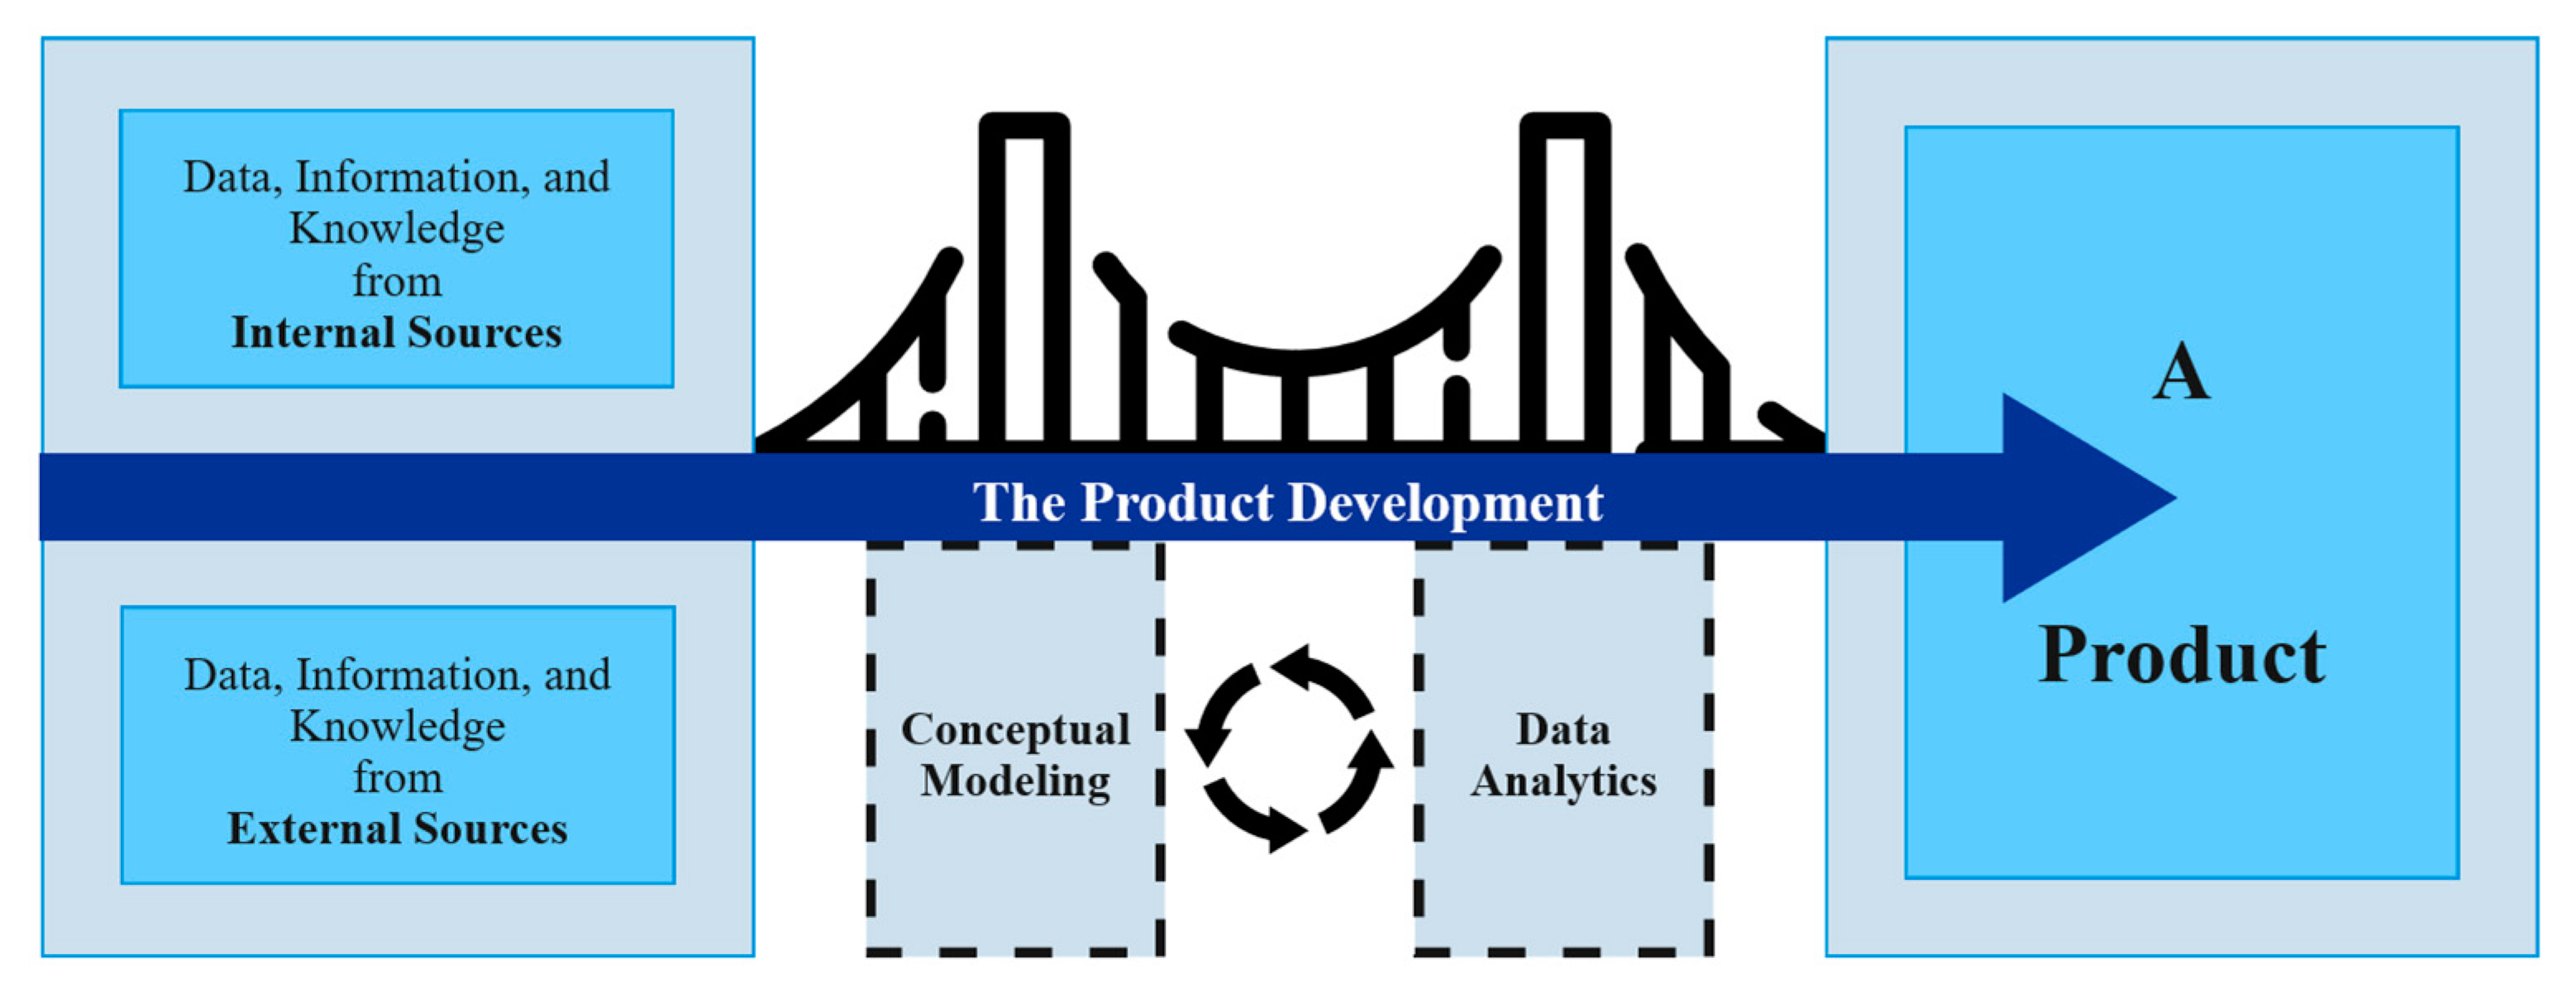
:1. Introduction
Research and Case Study Context
2. Literature
2.1. Early Phase Product Development
2.2. Conceptual Modeling
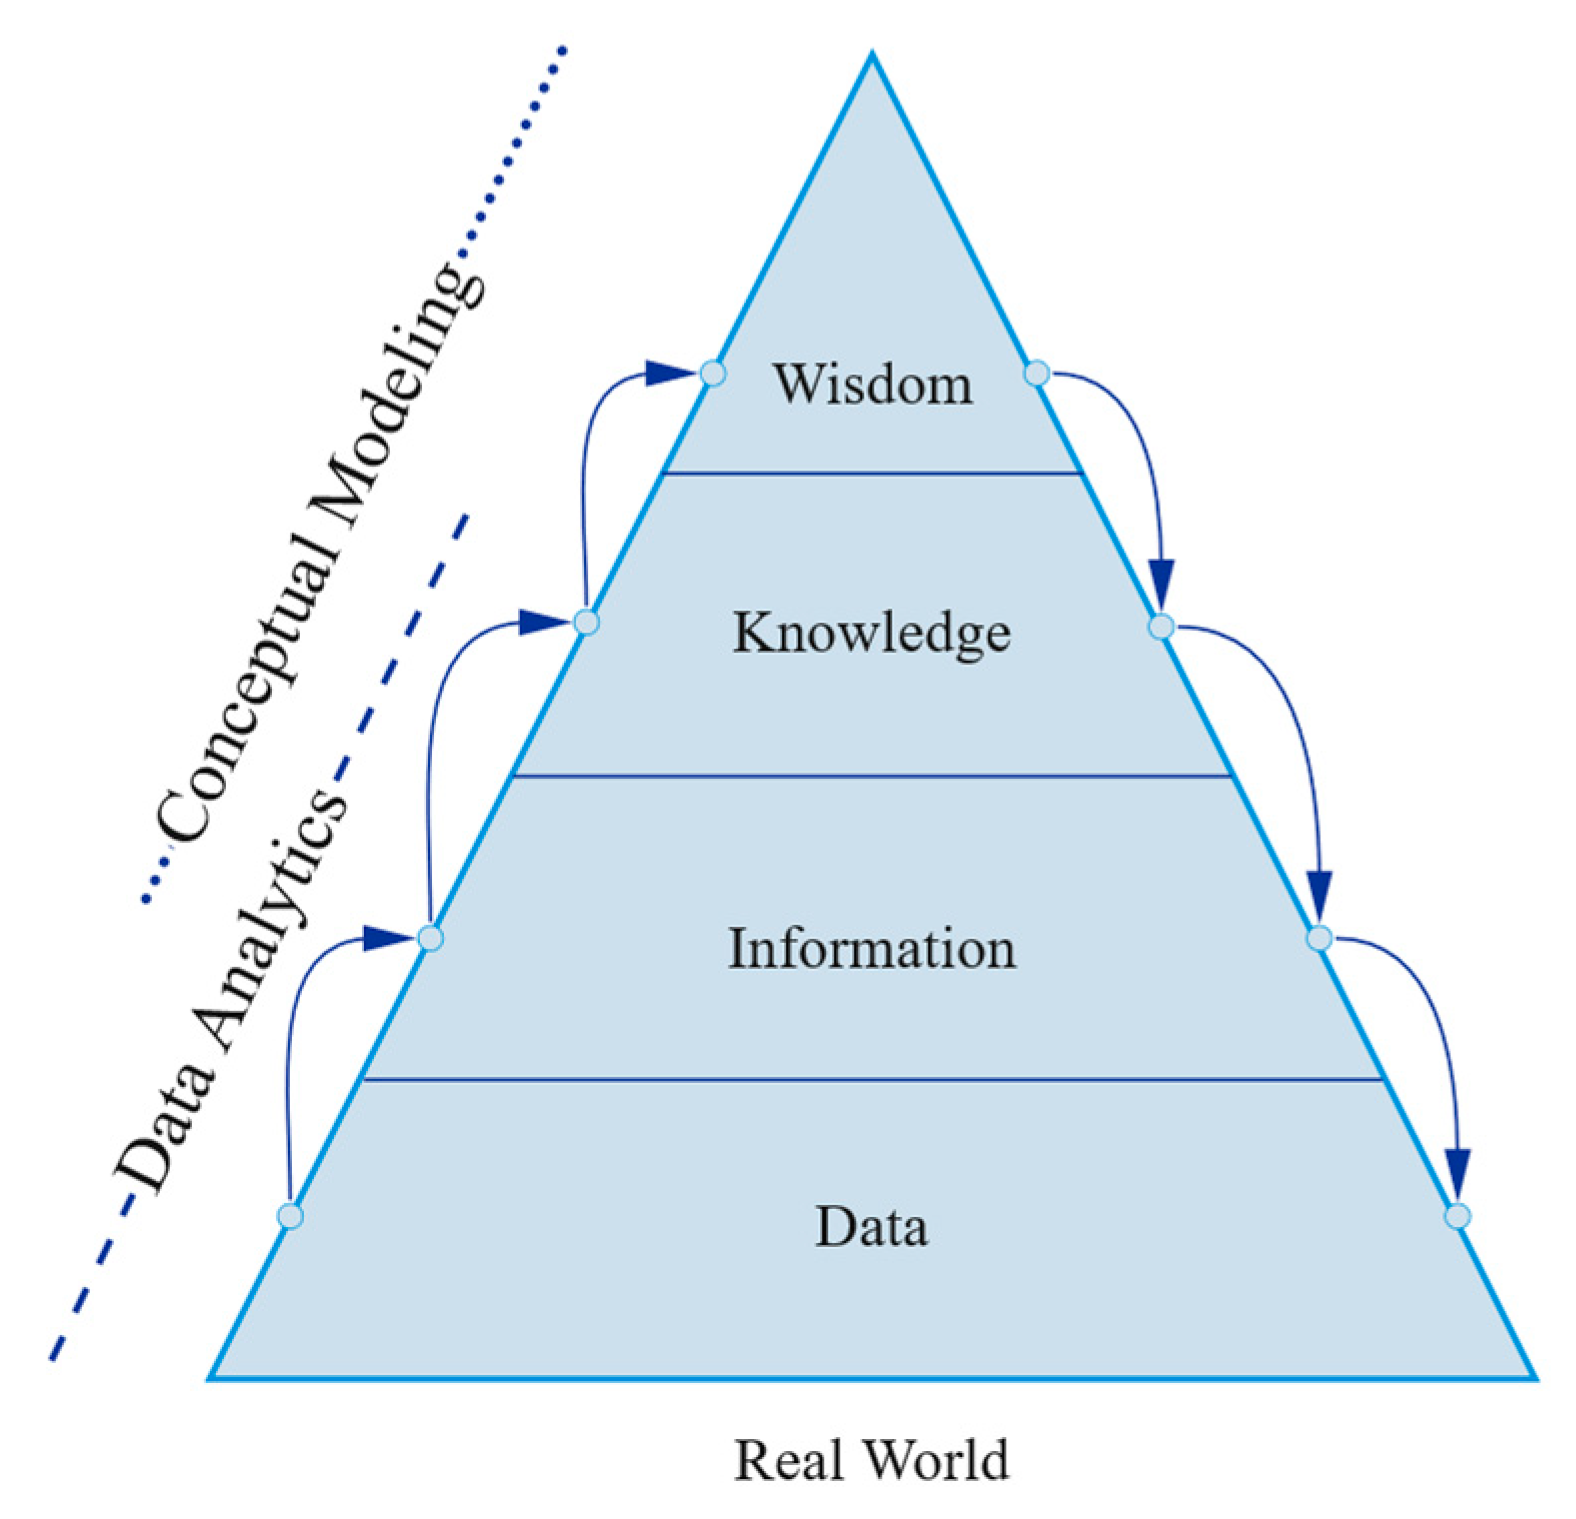
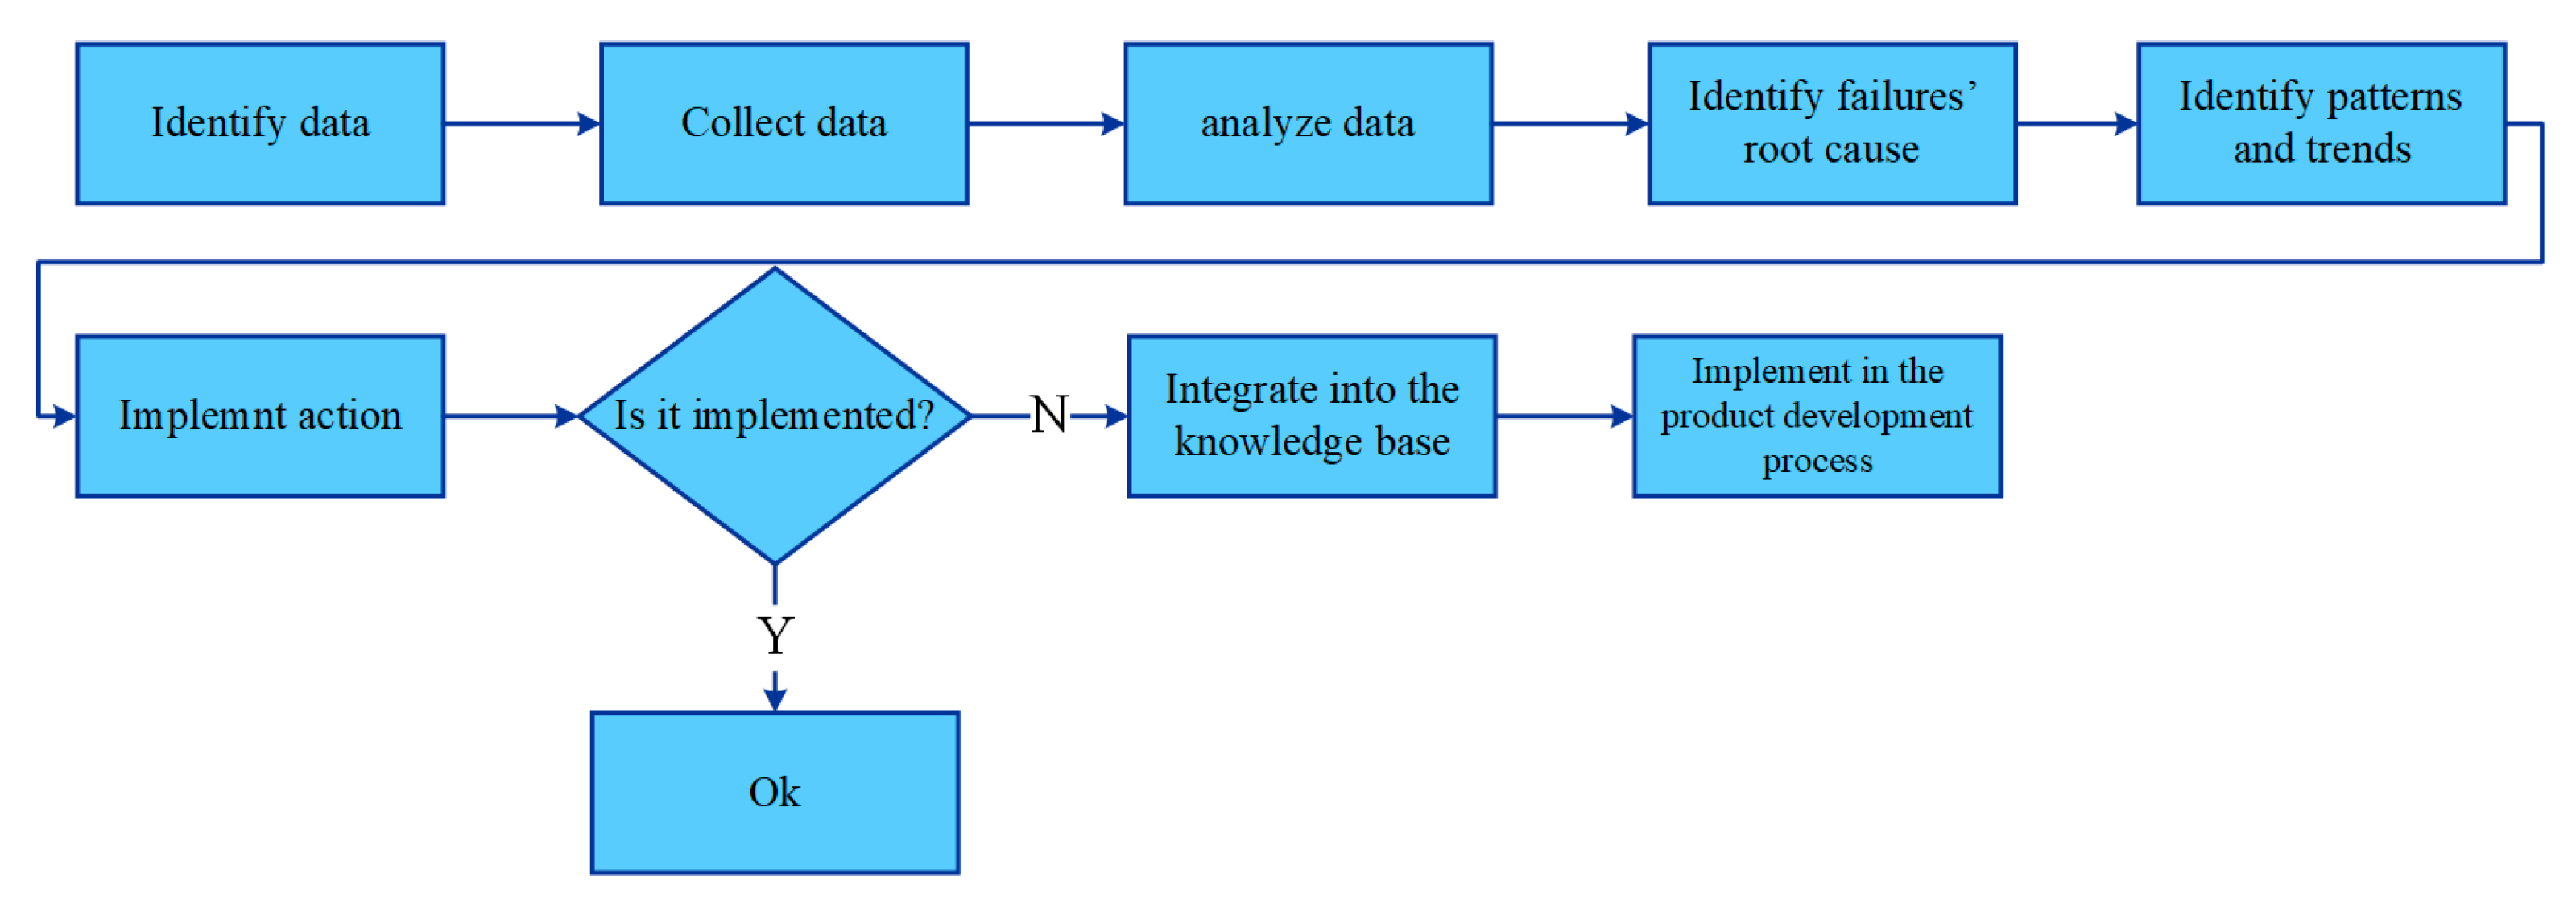
2.3. Data Sensemaking
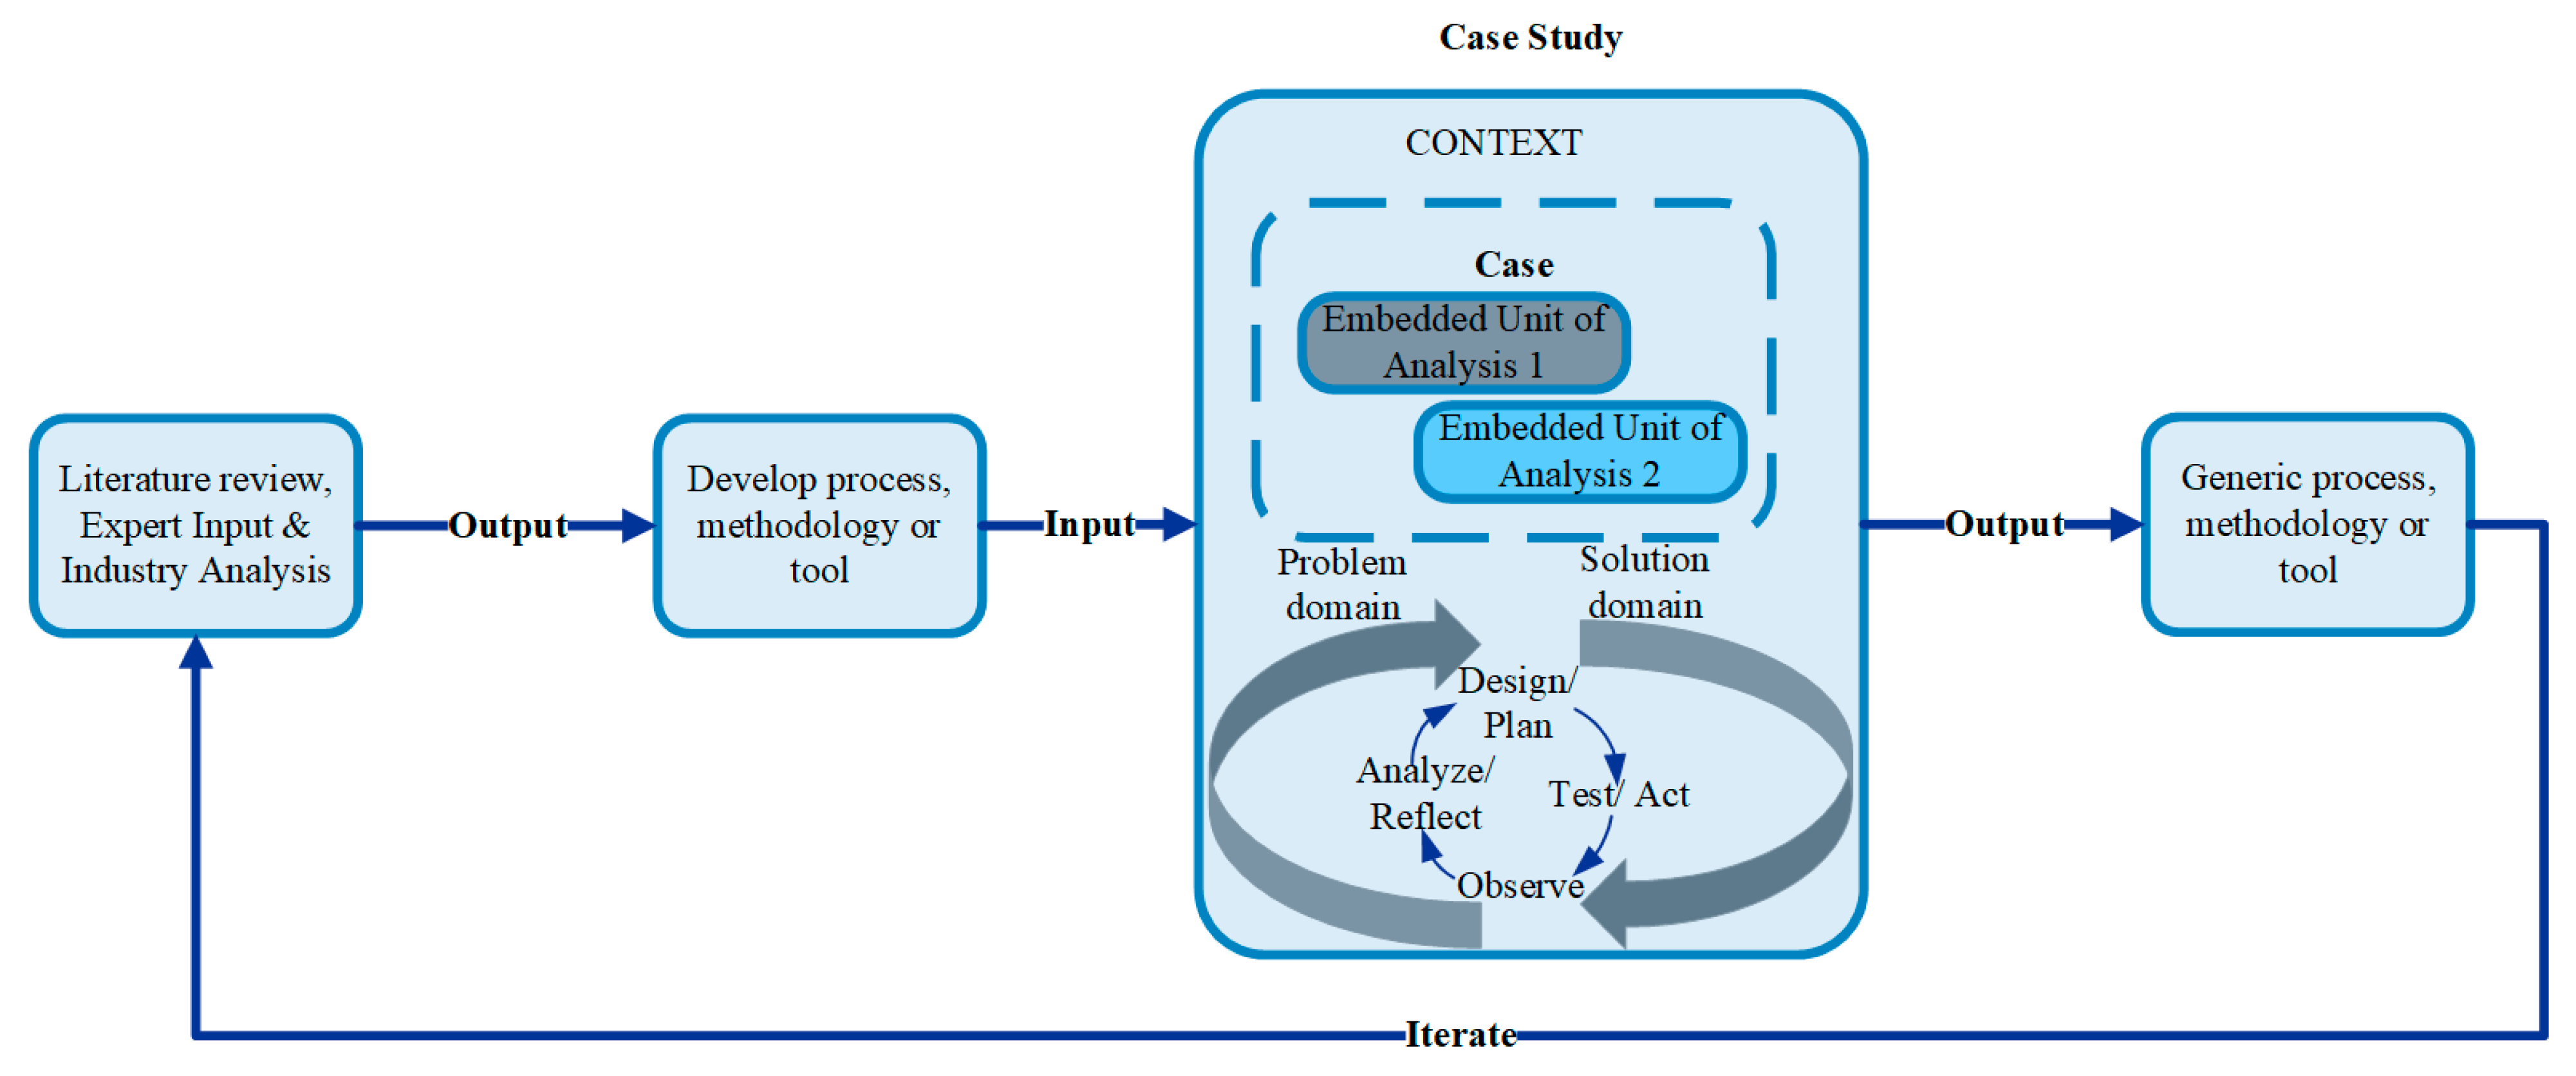
3. Methods
4. Results
4.1. Frameworks for Data Sensemaking
4.2. Criteria for Conceptual Data Sensemaking Framework
- Stepwise process
- Iterative process
- Top-bottom and Bottom-up friendly
- Abstraction capabilities
- Multi-view approach
- Data-centric
- Soft-aspect approach
4.2.1. Stepwise Process
4.2.2. Iterative Process
4.2.3. Top-Down & Bottom-Up
4.2.4. Abstraction Capabilities (Vertical Views)
4.2.5. Multi-View Approach (Horizontal Views)
4.2.6. Data-Centric
4.2.7. Soft Aspect Approach
4.3. Sensemaking Frameworks from the Literature
- Data-frame theory of sensemaking. The Data-frame theory of sensemaking [42] presented a sensemaking process in a natural setting. Data frame theory describes the relationship between the data or signals of an event and the cognitive frame (mental models) or explanatory structure that considers the data and guides the search for more data. As shown in Table 1, the Data-frame theory of sensemaking lacks the coverage of the following criteria: Stepwise process, Multiview approach, and soft-aspect approach. The framework lacks a straightforward stepwise process to implement it. In addition, the framework does not include the different perspectives concerning its context. Further, the framework does not include humans through, for instance, interviews, workshops, and observation to articulate their tacit knowledge.
- Quadruple Diamond. The Hybrid model originated from joint research between academia and larger enterprises, combining Big Data and Design Thinking through mixed teaming [49]. Its combination brings increased efficiency and effectiveness in the innovation process, combines deeper customer insights with deep learning from data, and generates synergies between qualitative and quantitative methods. The Quadruple Diamond was an extension of the Hybrid Model through the addition of Systems Thinking. The approach suggests working in a mixed team with iterations between the three mindsets, design thinking, data analytics, and systems thinking to understand the problem from all perspectives. The book gives four high-level examples of jumping between mindsets, such as sequential and mixed approaches. They highlight that an experienced facilitator and team should only perform the mixed quadruple diamond approach. The approach revolves around many iterations; therefore, its suitability to work in companies that cannot iterate as fast can be questioned. However, the figure itself is linear and does not show the iterative element.
- Cognitive processes of sensemaking. The framework that depicts the cognitive processes of sensemaking [50,51] is based on being data-driven and structure-driven. Data-driven is seen as the inductive bottom-up, and structure-driven is the logical top-down approach. The framework goal is to utilize the cognitive process to get a big-picture view for knowledge creation, organization, and sharing in the sensemaking process. The stepwise process as guidance to take practitioners through the framework is missing. Additionally, it does not emphasize the co-creation and validation aspect for development in complex systems, such as verification and validation from key stakeholders.
- CAFCR. The CAFCR model [52] offers a top-level decomposition of an architecture. CAFCR stands for Customer Objectives, Application, Functional, Conceptual, and Realization. The “why from the customer” is provided by the “Customer Objectives” view and the “Application view.” The “Functional view” describes the “what of the product,” which includes the non-functional requirements. The “how of the product” is described in the “Conceptual and Realization” view. CAFCR, as a framework, lacks an explicit process of integrating the hard aspects and how to utilize the data stored in the organization. Additionally, the framework needs a stepwise process. However, this is explained in the text but not in the figure.
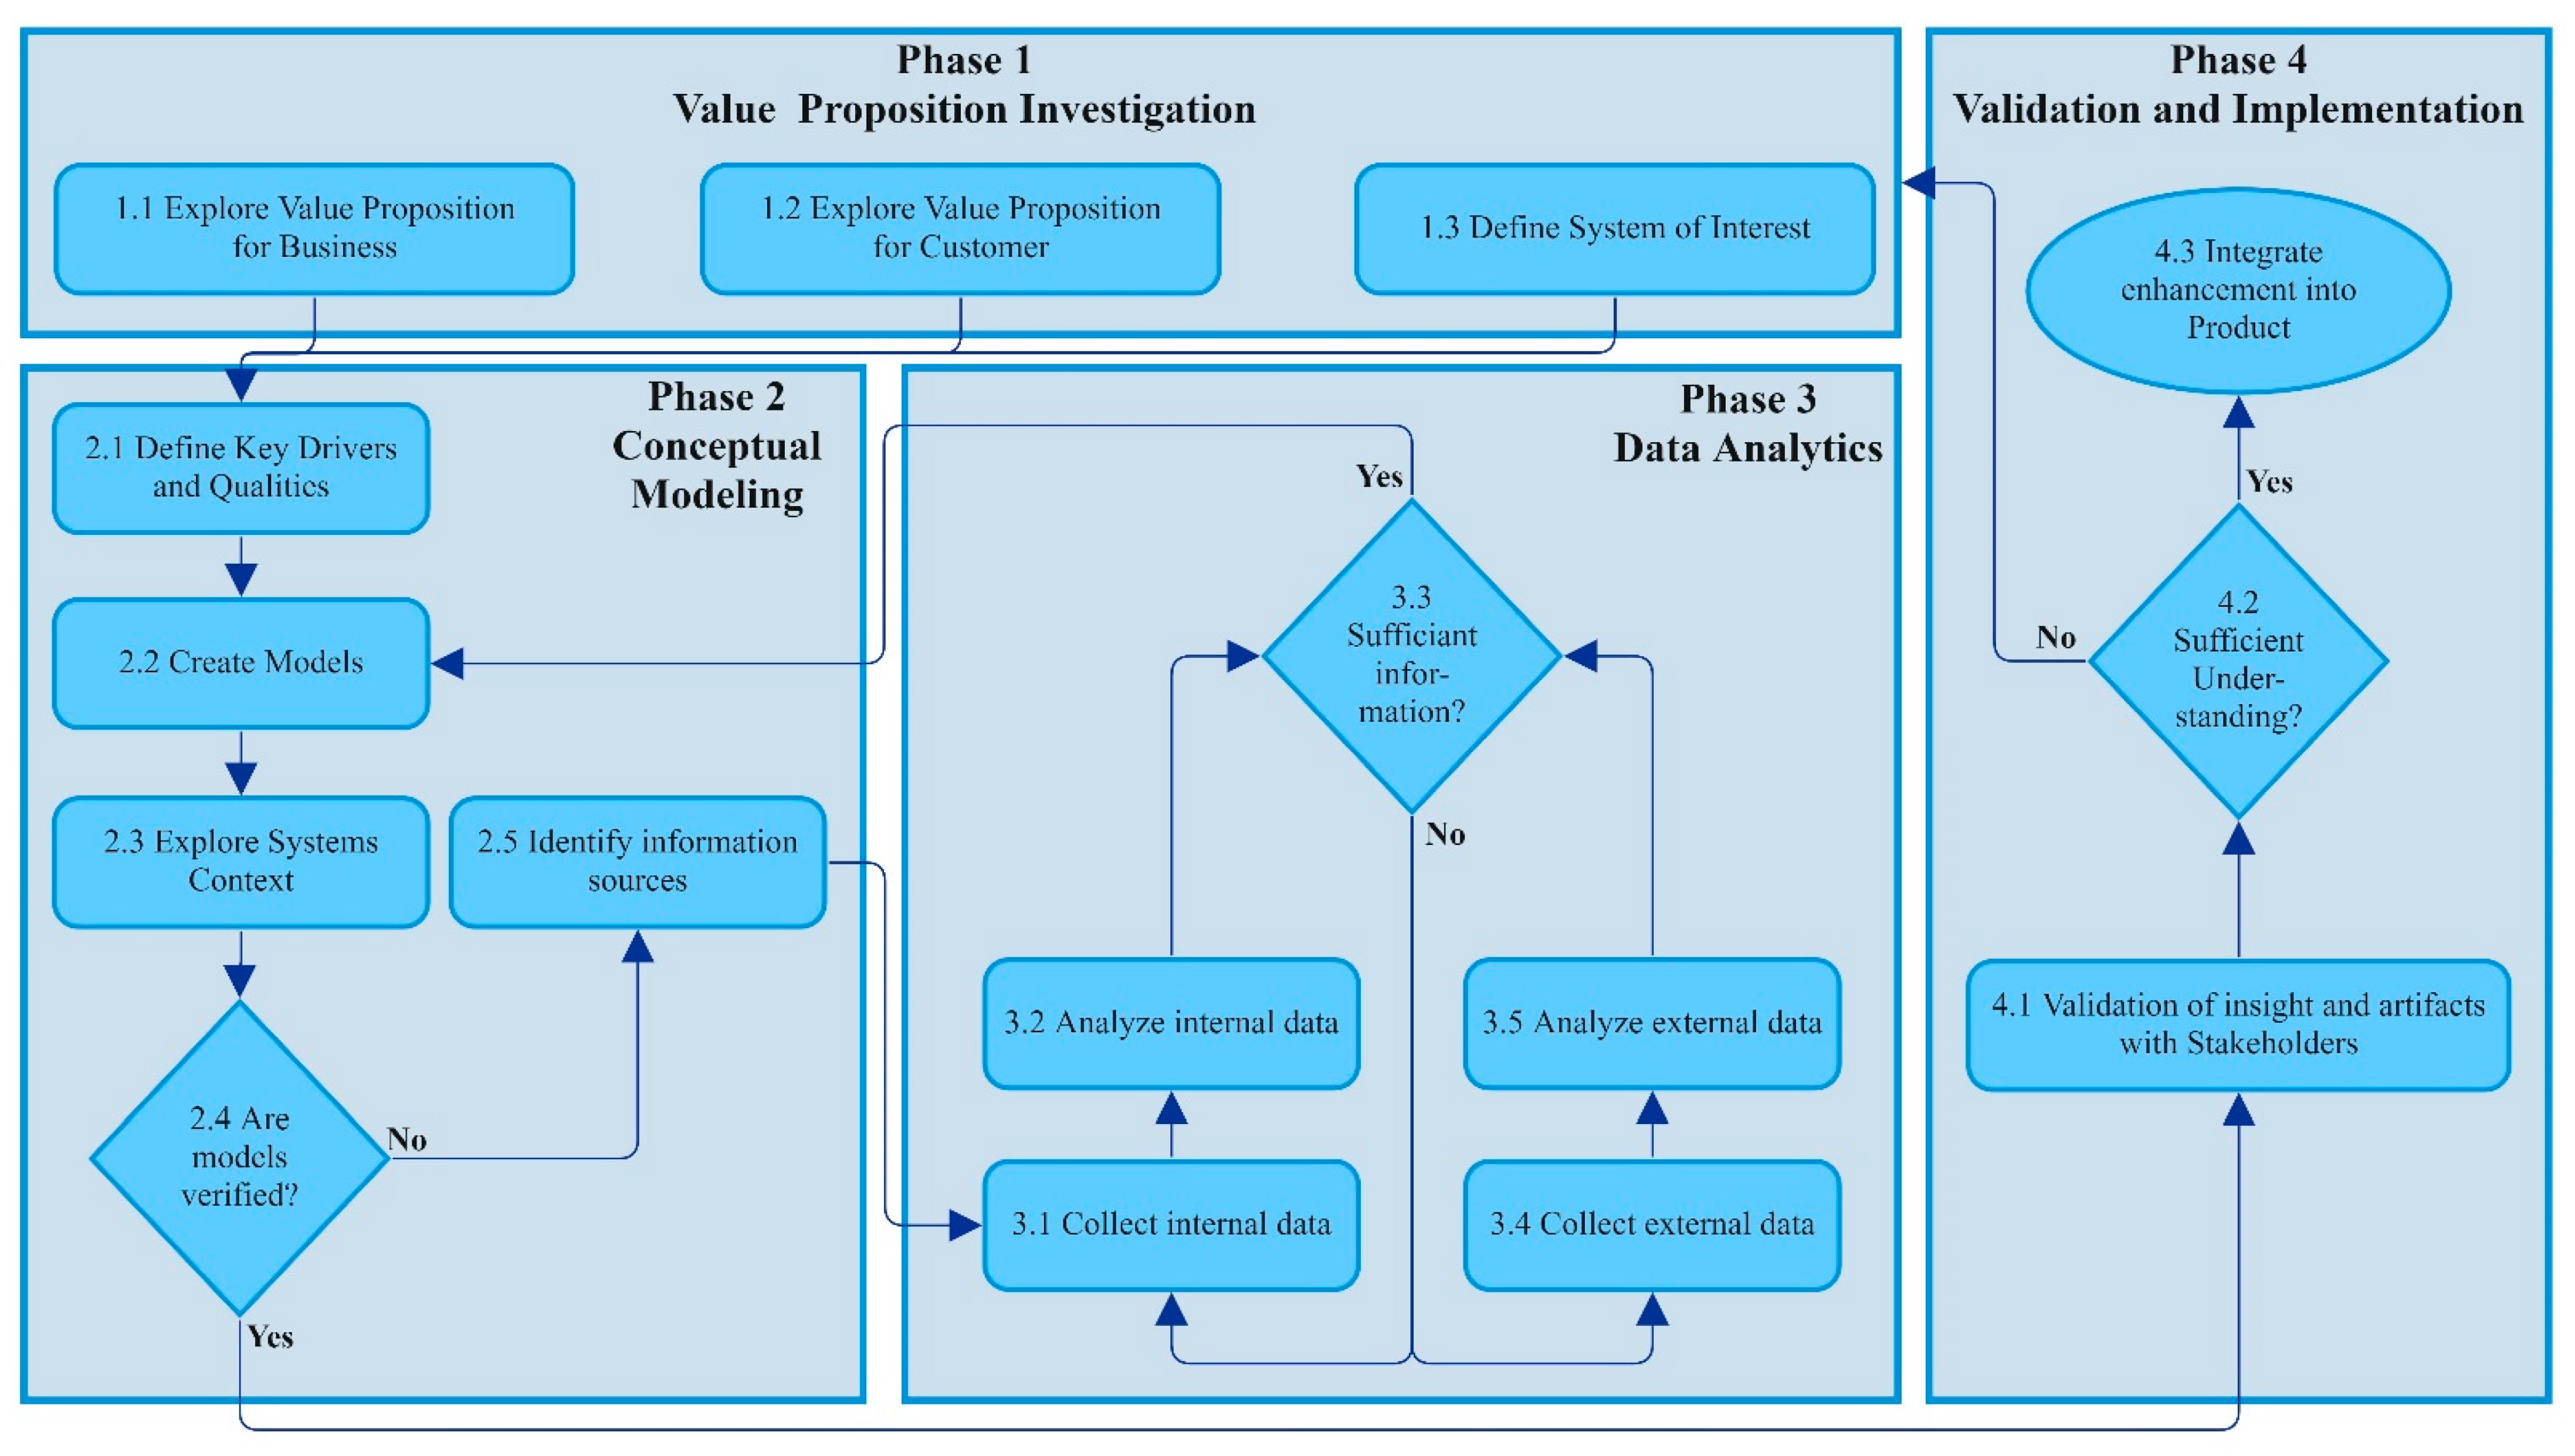
4.4. The Framework Explained
4.4.1. Phase 1—Value Proposition Investigation
4.4.2. Phase 2—Conceptual Modeling
4.4.3. Phase 3—Data Analytics
4.4.4. Phase 4—Validation and Implementation
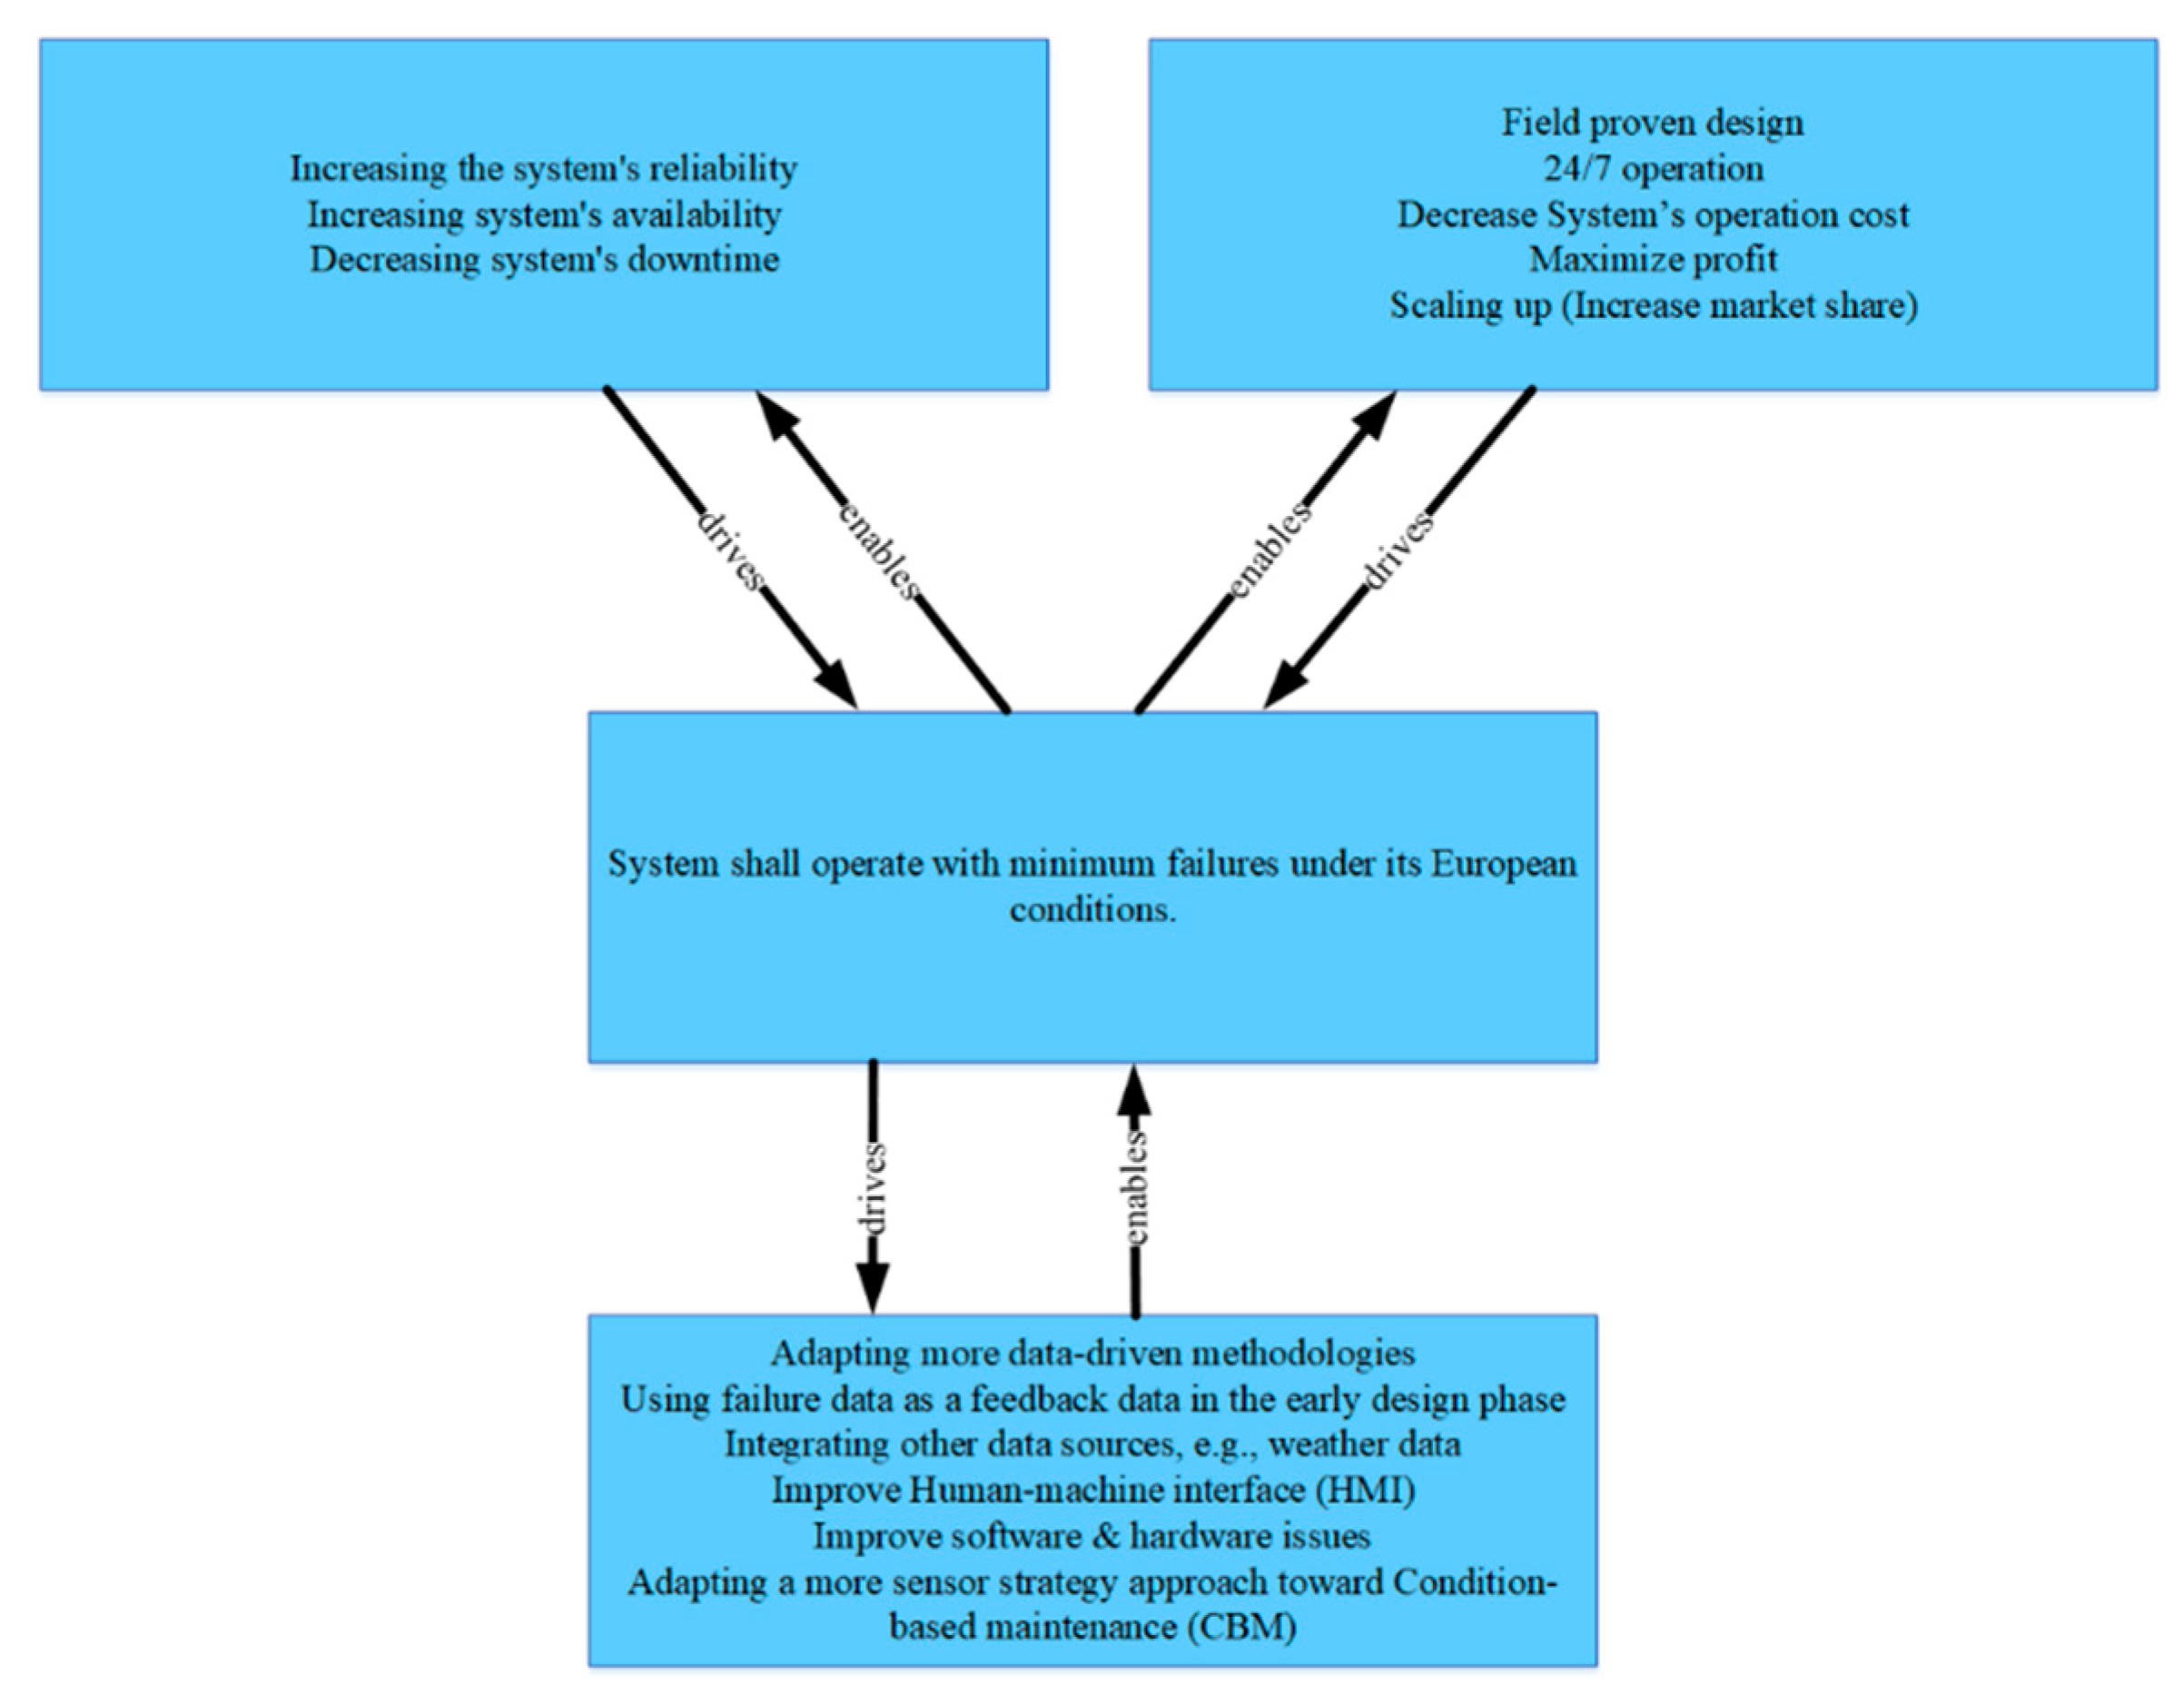
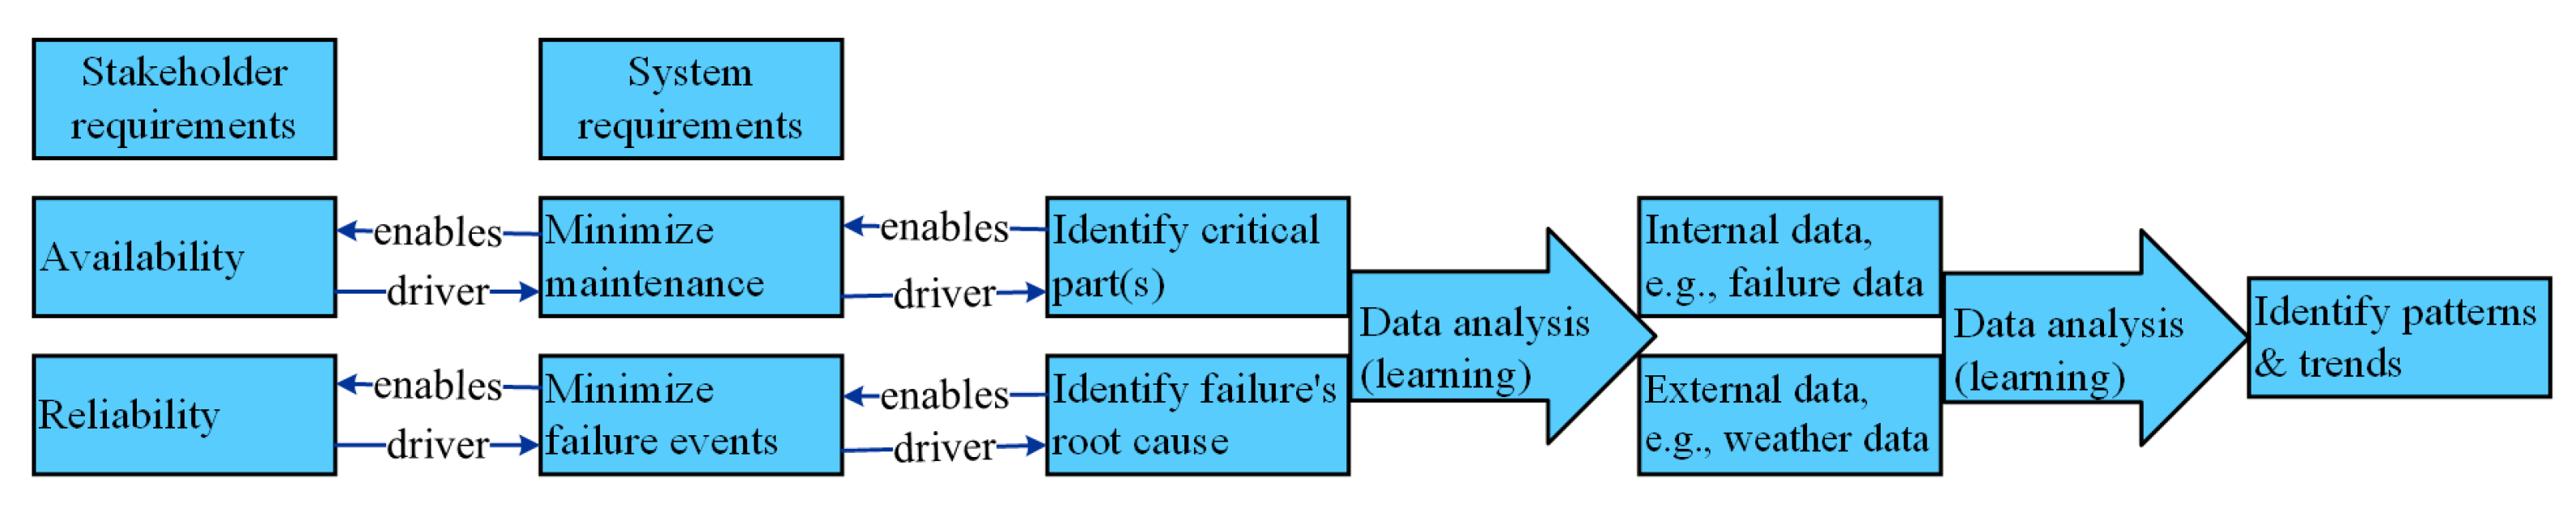
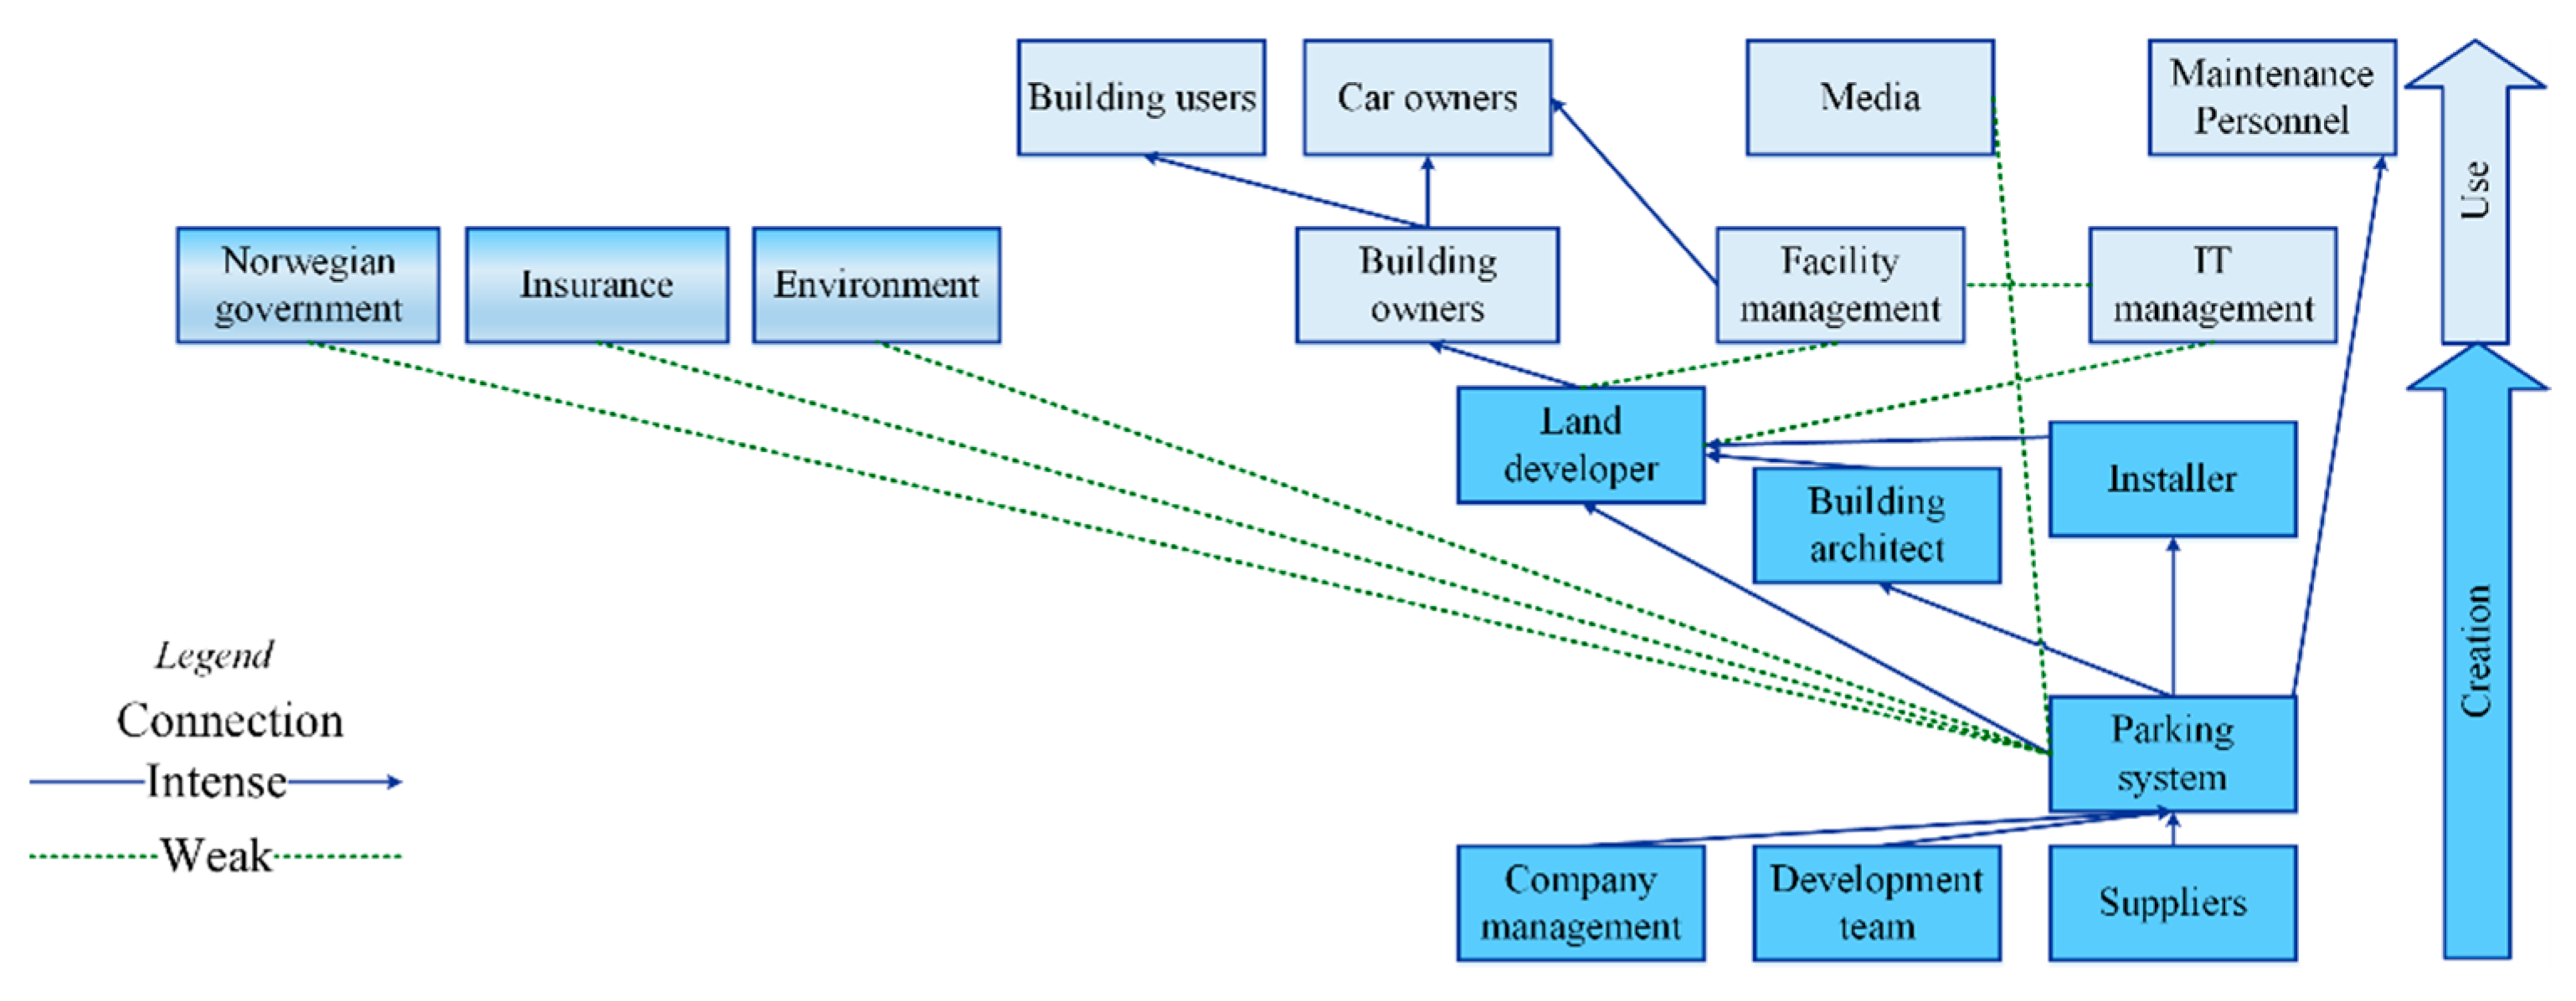
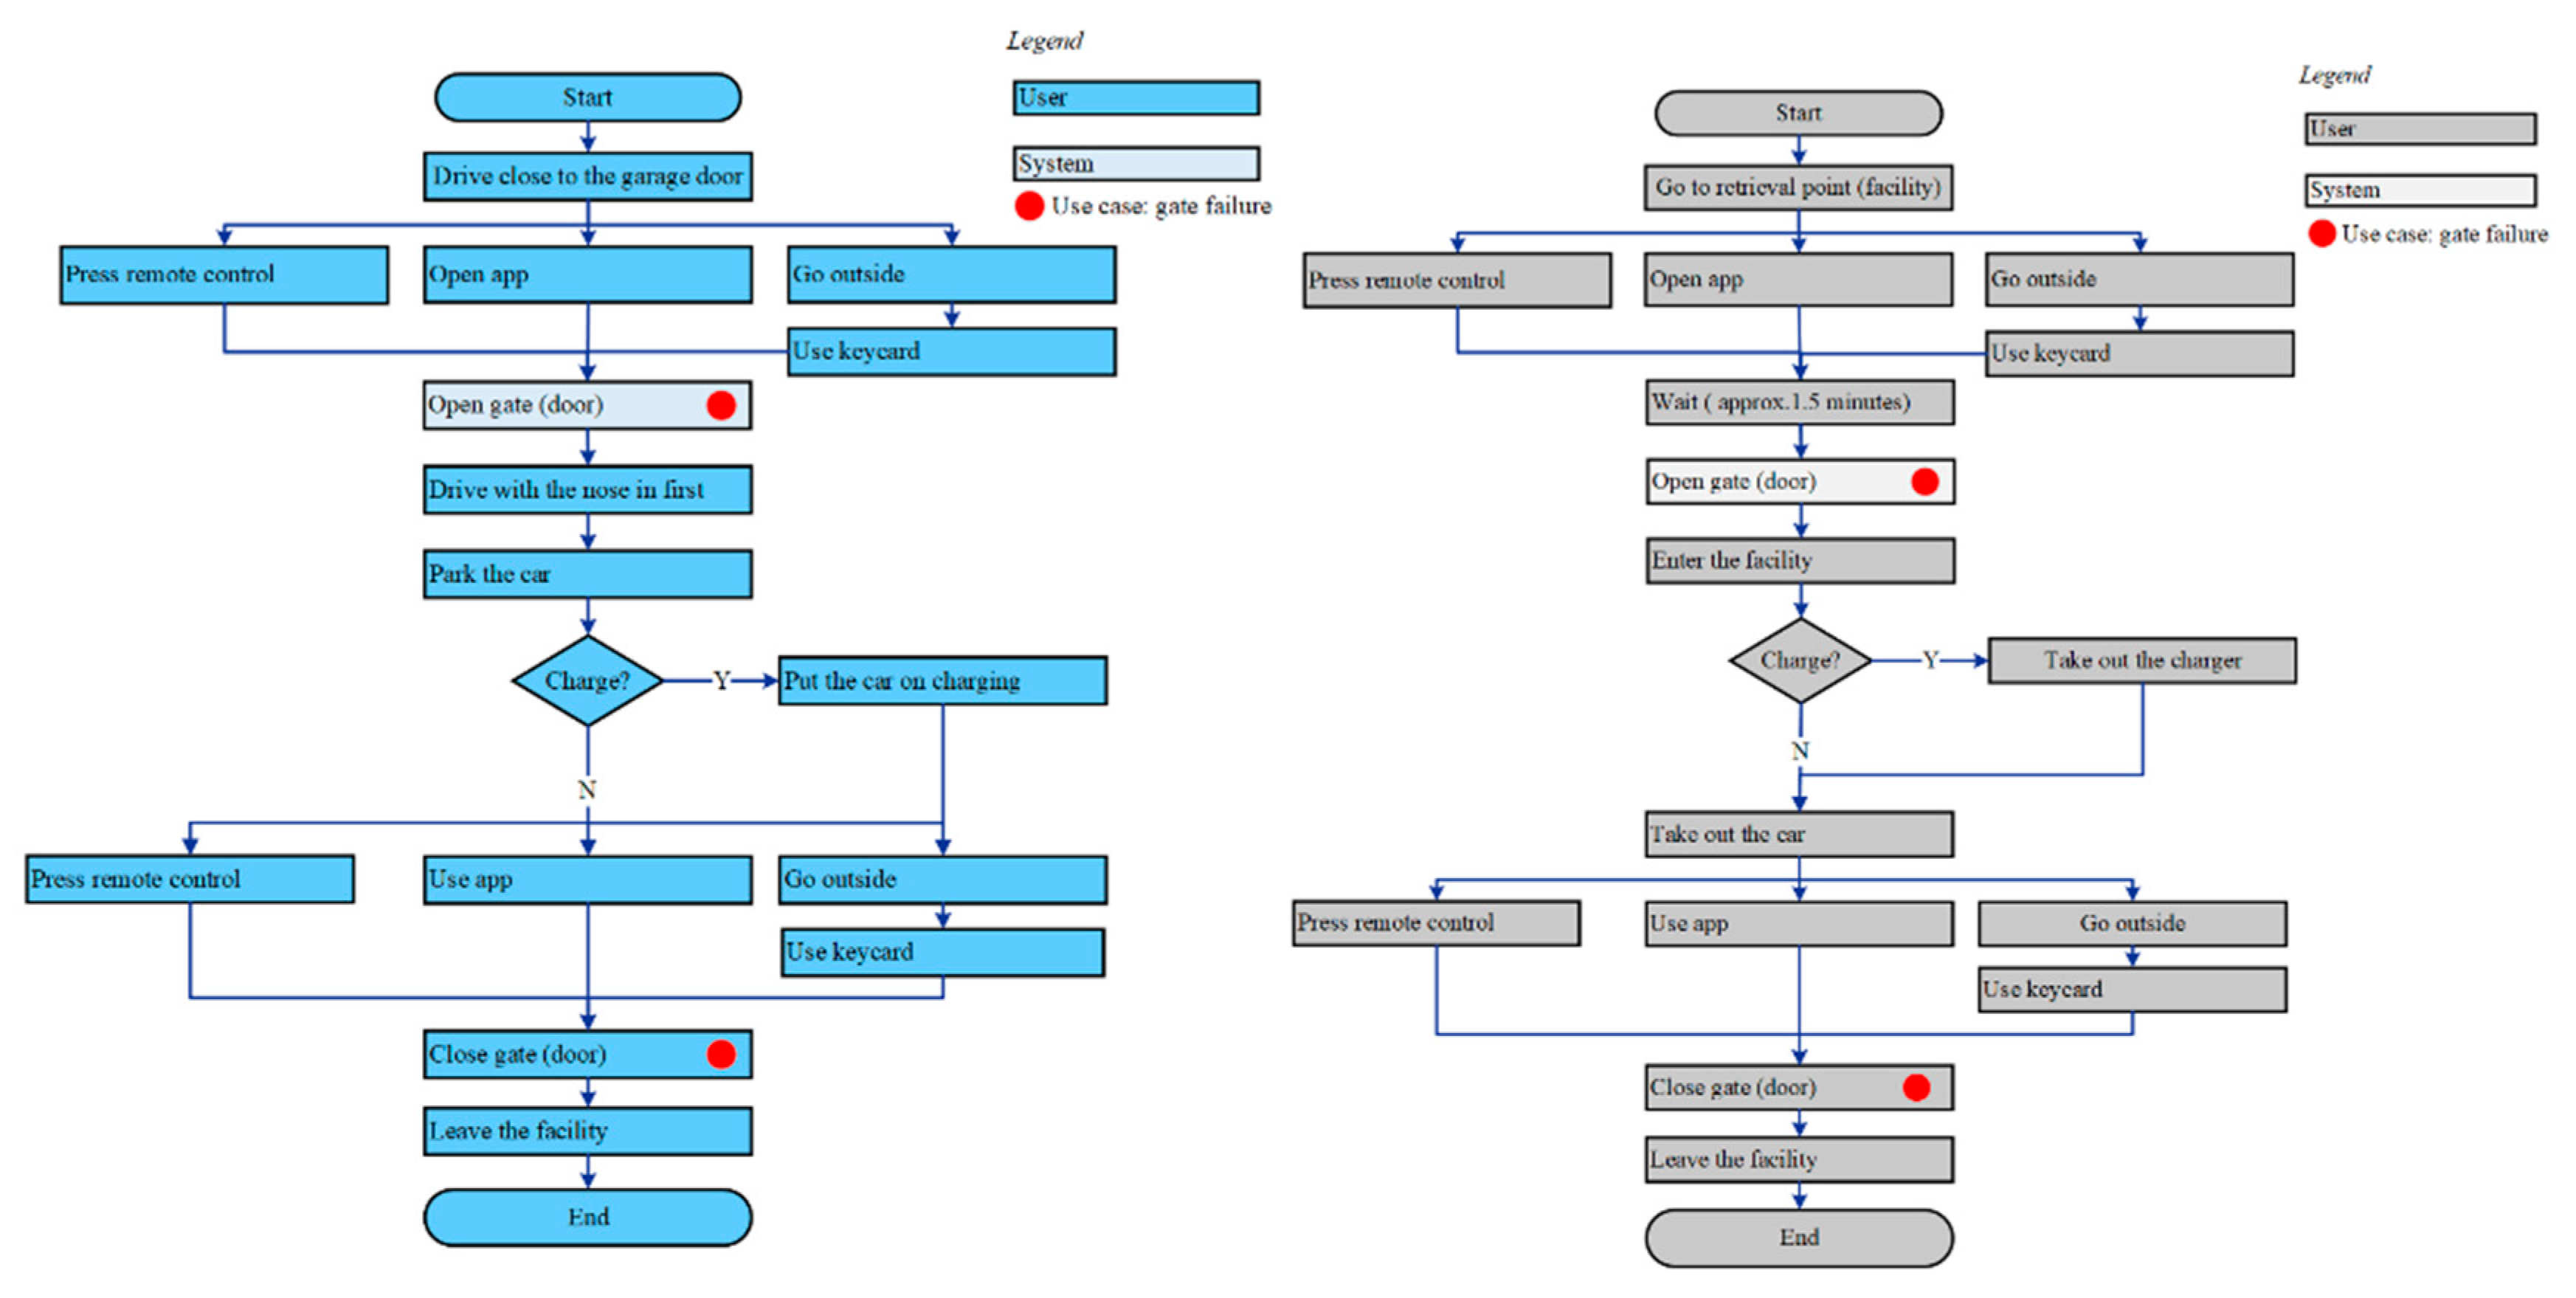
4.5. Framework Tested in Case Study—Automatic Parking Systems
4.5.1. Phase 1—Understand the System Context
4.5.2. Phase 2: Conceptual Modeling—First Iteration
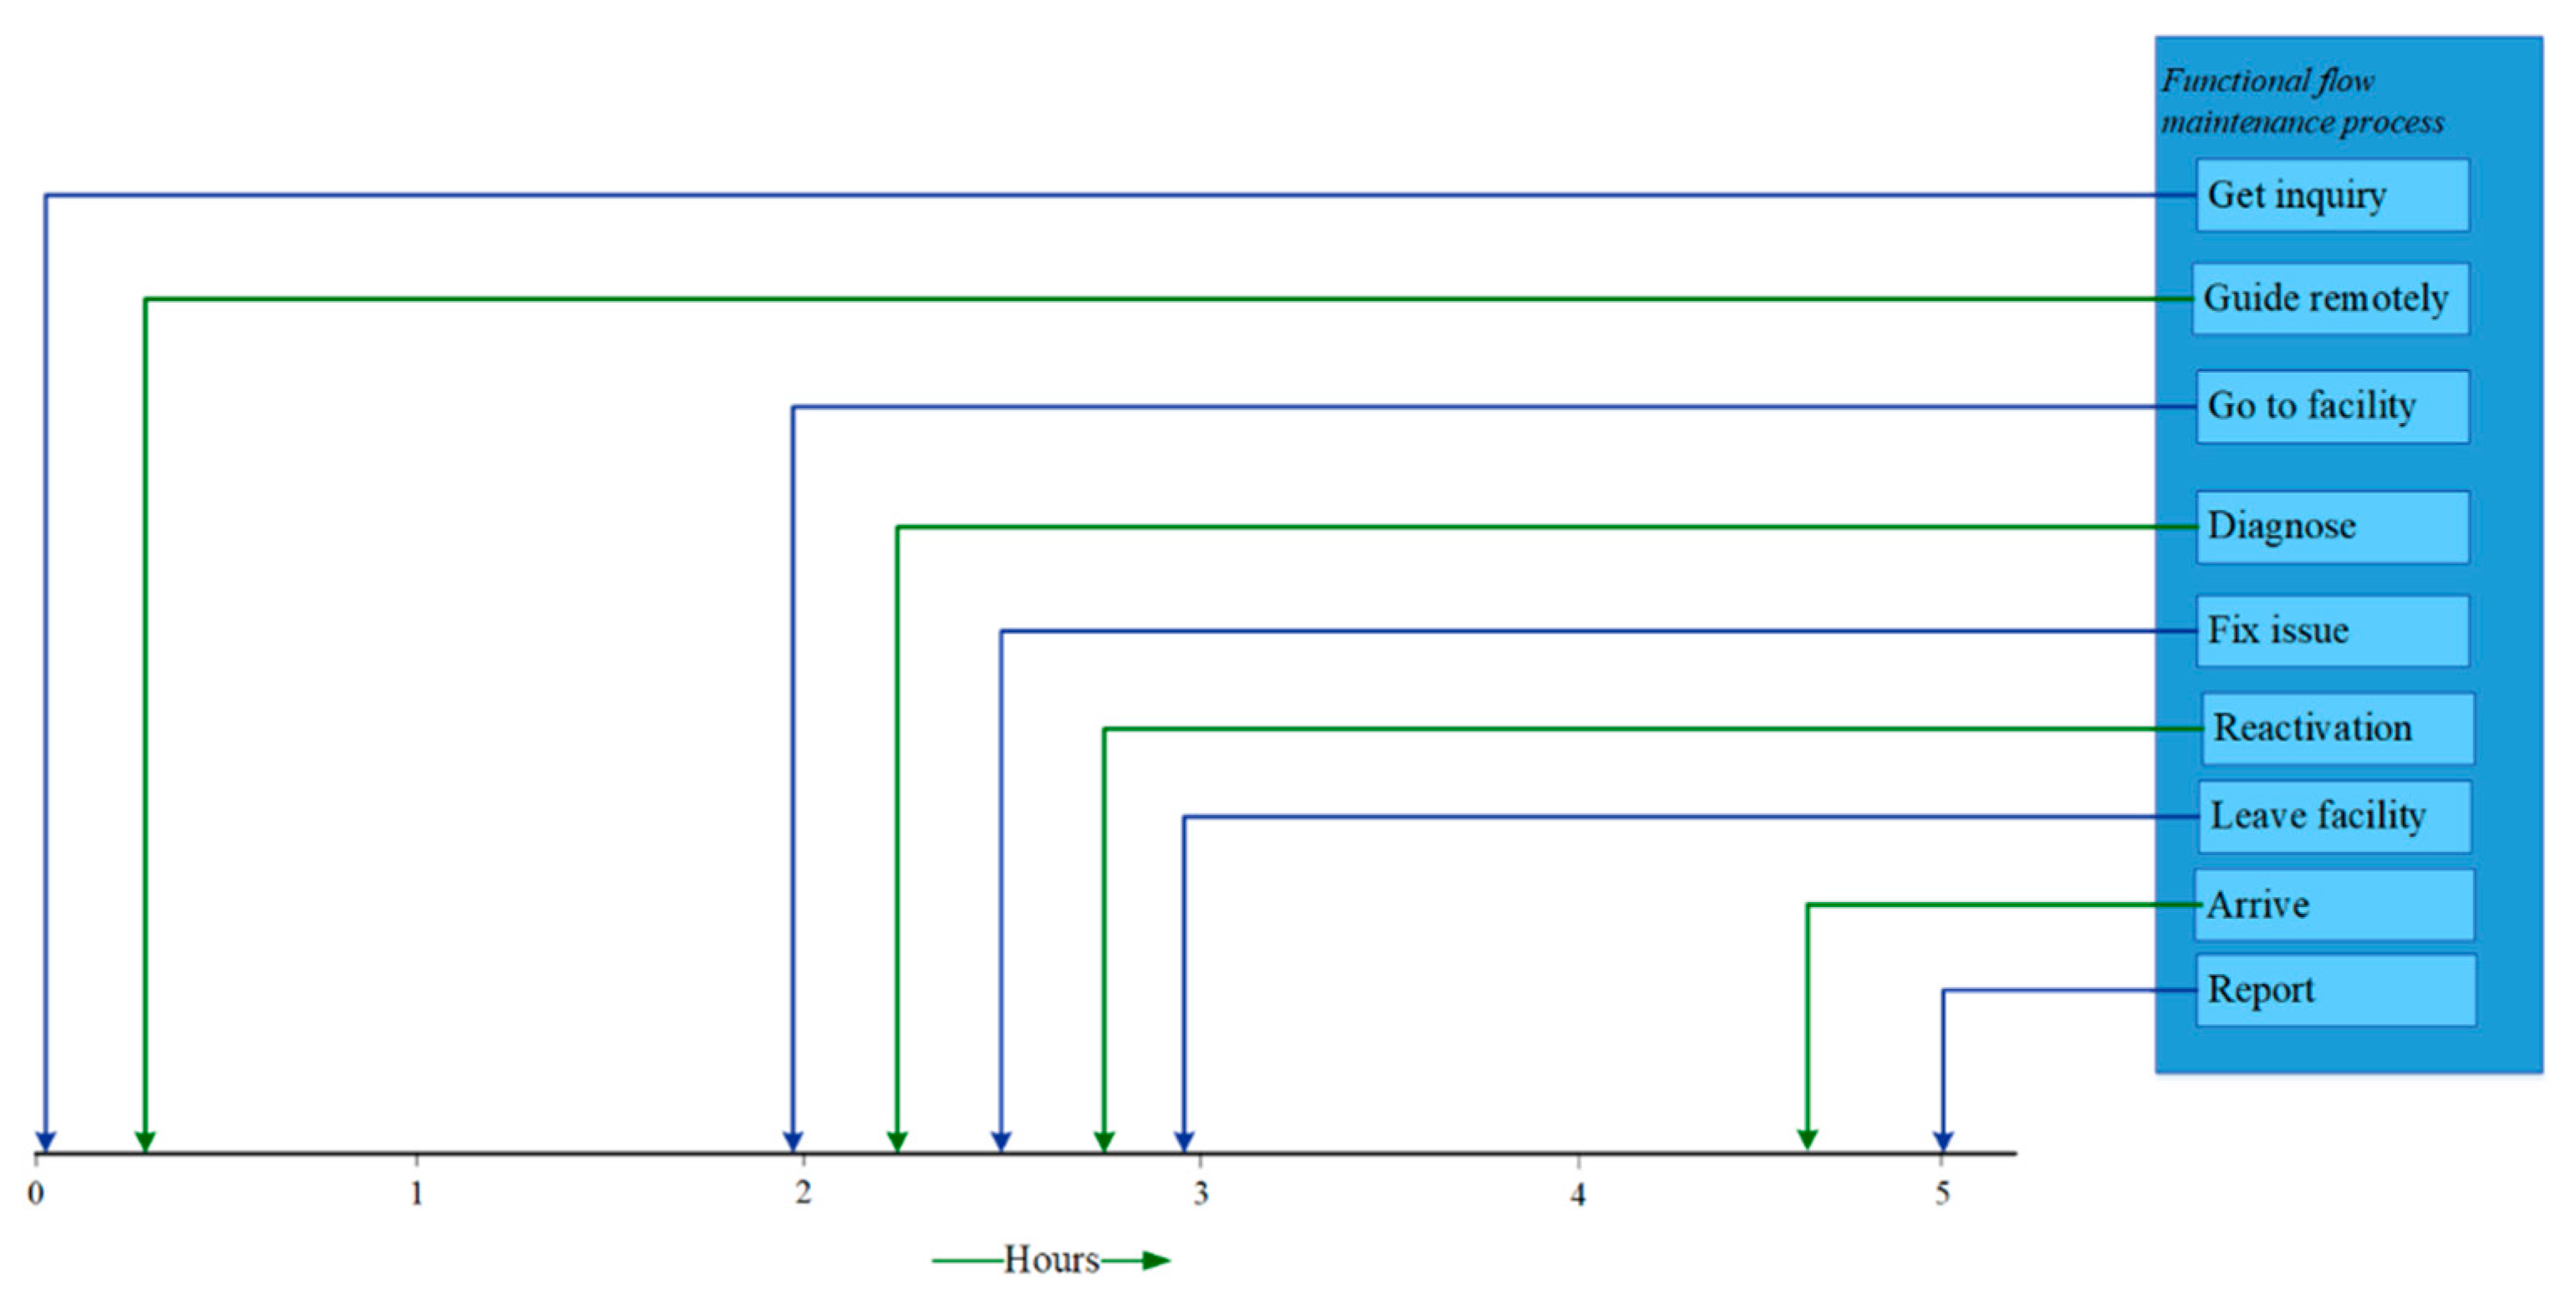
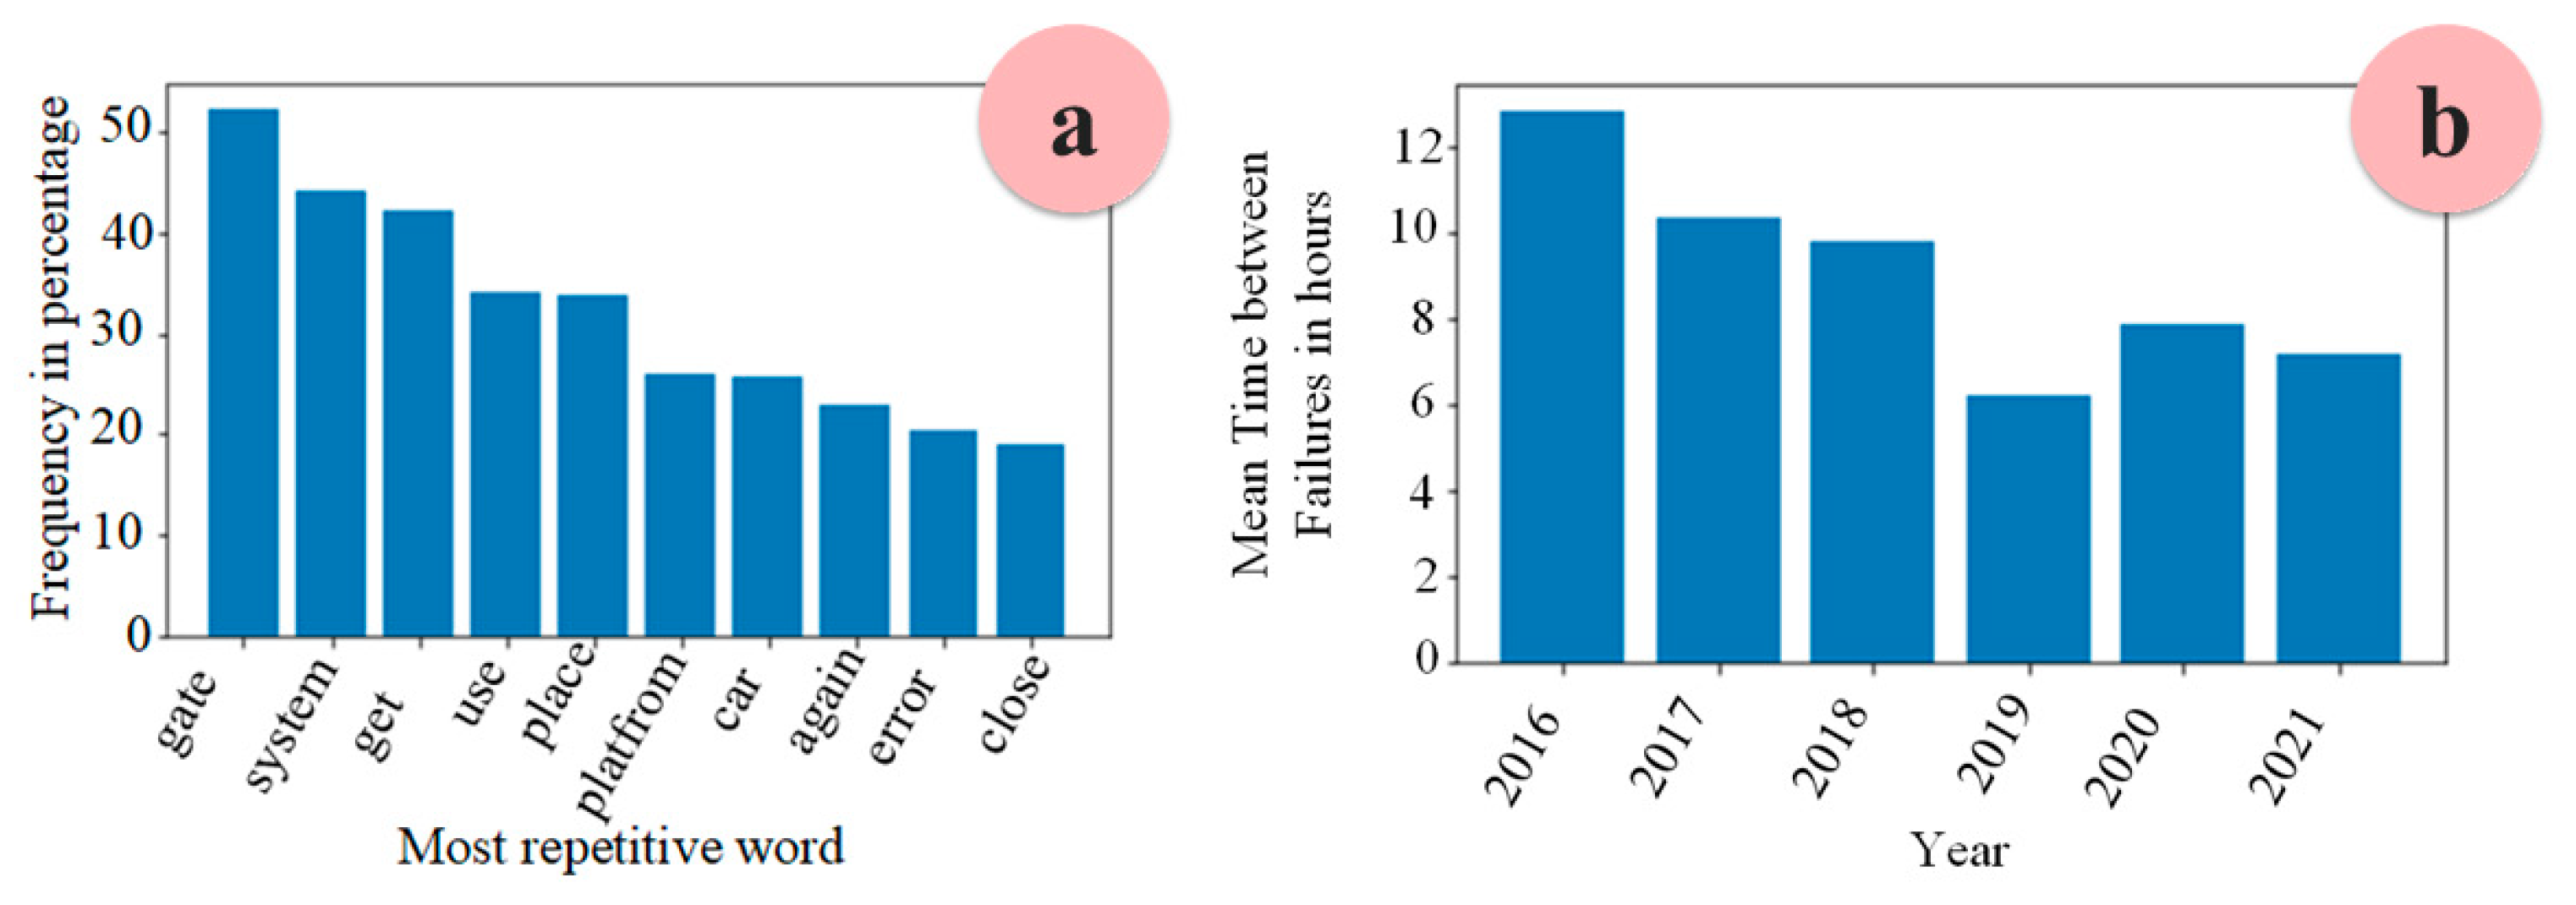
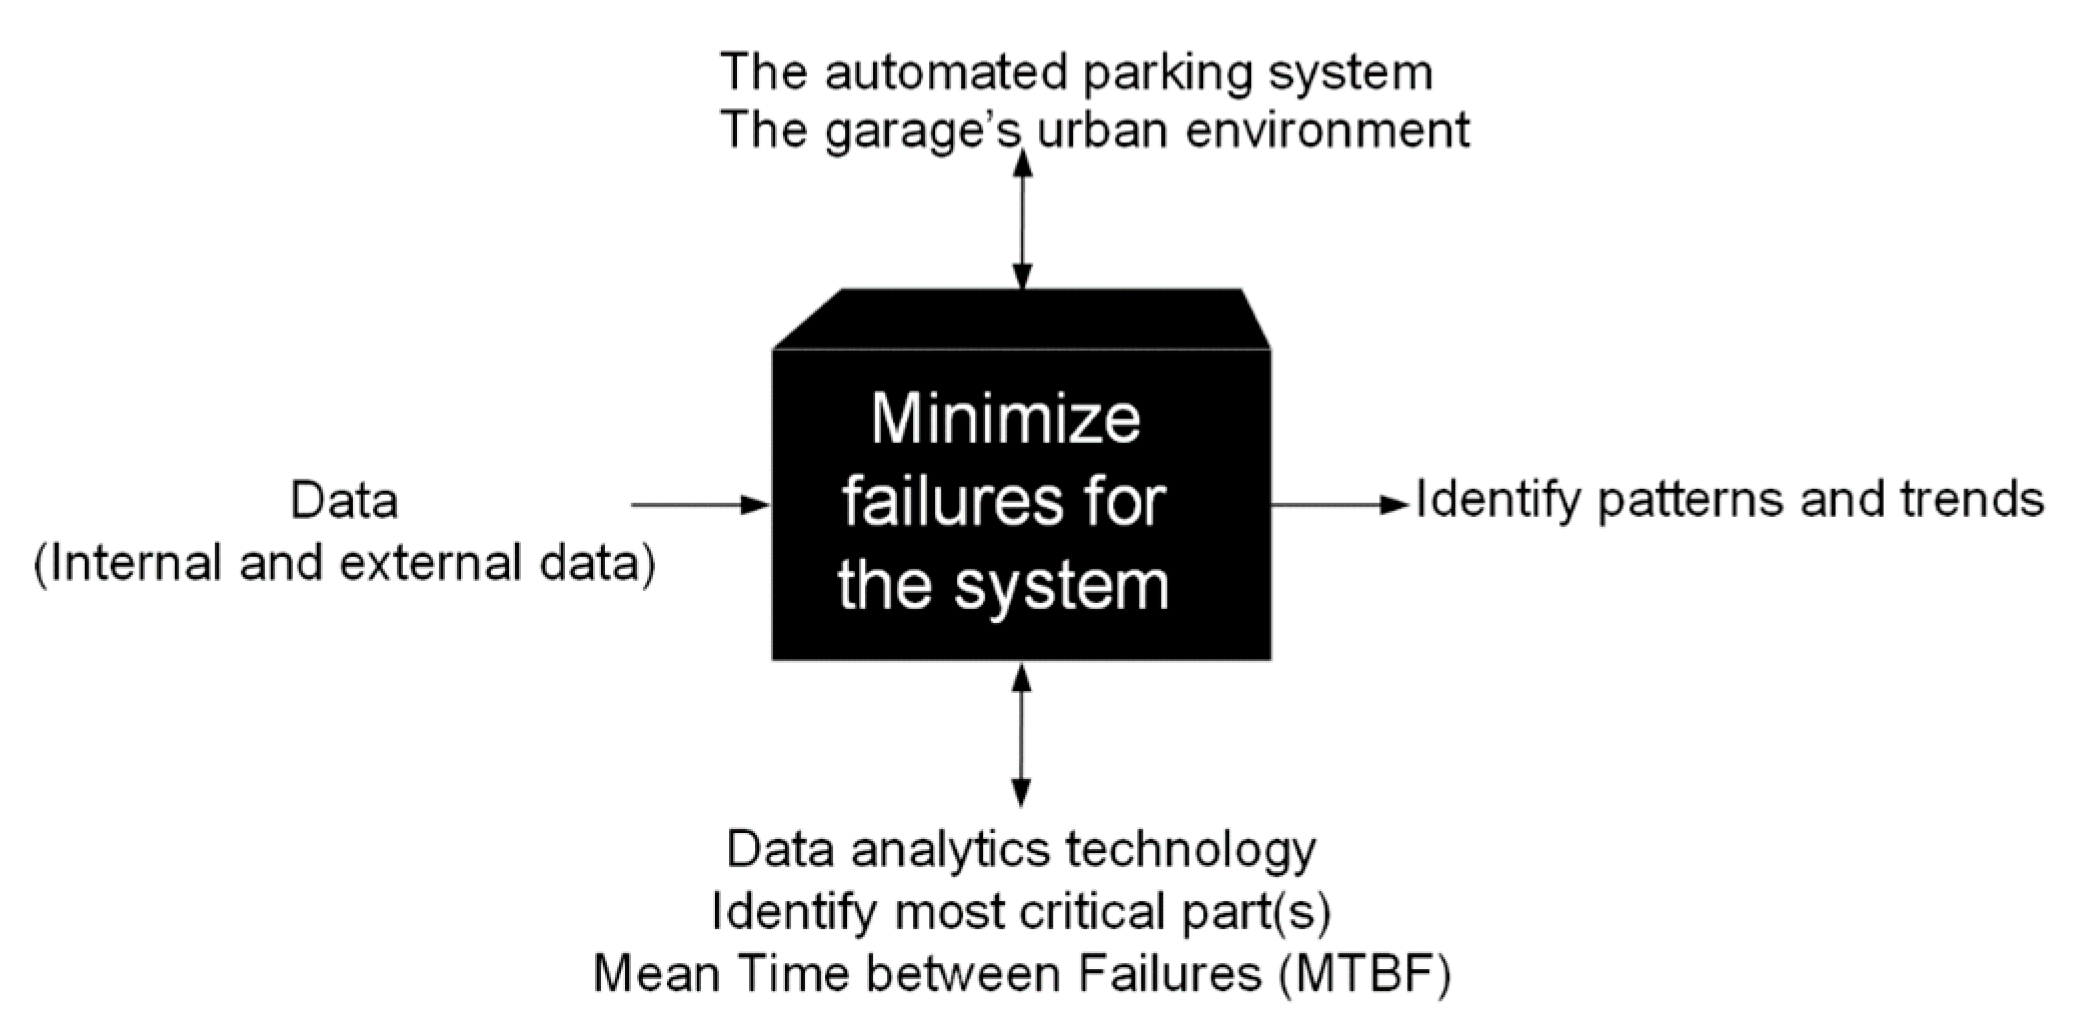
4.5.3. Phase 3: Data Analytics
4.5.4. Conceptual Modeling—Second Iteration
4.5.5. Validation and Integration
5. Discussion
5.1. The Framework, According to the Criteria
5.1.1. Top-Down and Bottom-Up Friendly
5.1.2. Iterative Process
5.1.3. Stepwise Process
5.1.4. Multi-View Approach
5.1.5. Abstraction Capabilities
5.1.6. Soft Aspect and Data-Centric—Tacit and Explicit Knowledge
5.2. Achieving Sensemaking
5.3. Framework Implementation and Concerns
5.4. Research Limitations and Future Studies
6. Conclusions
Author Contributions
Funding
Institutional Review Board Statement
Informed Consent Statement
Data Availability Statement
Acknowledgments
Conflicts of Interest
References
- Tani, G.; Cimatti, B. Technological Complexity: A Support to Management Decisions for Product Engineering and Manufacturing. In Proceedings of the 2008 IEEE International Conference on Industrial Engineering and Engineering Management, Singapore, 8–11 December 2008; pp. 6–11. [Google Scholar]
- Wiendahl, H.-P.; Scholtissek, P. Management and Control of Complexity in Manufacturing. CIRP Ann. 1994, 43, 533–540. [Google Scholar] [CrossRef]
- Lieberman, H.; Paternò, F.; Klann, M.; Wulf, V. End-User Development: An Emerging Paradigm. In End User Development; Lieberman, H., Paternò, F., Wulf, V., Eds.; Human-Computer Interaction Series; Springer: Dordrecht, The Netherlands, 2006; pp. 1–8. ISBN 978-1-4020-5386-3. [Google Scholar]
- Madni, A.M.; Spraragen, M.; Madni, C.C. Exploring and Assessing Complex Systems’ Behavior through Model-Driven Storytelling. In Proceedings of the 2014 IEEE International Conference on Systems, Man, and Cybernetics (SMC), San Diego, CA, USA, 5–8 October 2014; pp. 1008–1013. [Google Scholar]
- Ibrahim, M.H.M.; Mahmoud, A.; Ali, R.B.M. Factors Affecting Systems Engineering Complexity during Developmental Phase: Systems Practitioners, Developers, and Researchers’ Perspectives. Int. J. Innov. Res. Eng. Multidiscip. Phys. Sci. 2020, 8, 16. [Google Scholar]
- Salim, F.; Ali, H.B.; Langen, T.; Wettre, A.; Muller, G.; Falk, K. State of Affair in Terms of Big Data Utilization in Complex System Engineering Organizations. In Proceedings of the MODERN SYSTEMS 2022: International Conference of Modern Systems Engineering Solutions, Saint-Laurent-du-Var, France, 24–28 July 2022. [Google Scholar]
- Zicari, R.V. Big Data: Challenges and Opportunities. In Big Data Computing; Chapman and Hall: London, UK; CRC: Boca Raton, FL, USA, 2013; ISBN 978-0-429-10136-6. [Google Scholar]
- Langen, T.; Falk, K.; Mansouri, M. A Systems Thinking Approach to Data-Driven Product Development. Proc. Des. Soc. 2022, 2, 1915–1924. [Google Scholar] [CrossRef]
- H-SEIF 2—Big Data Meets Systems Engineering. Available online: https://www.usn.no/english/research/our-research/technology/norwegian-industrial-systems-engineering-research-group/h-seif-2/ (accessed on 5 October 2022).
- Ali, H.B.; Muller, G.; Salim, F.A. Applying Conceptual Modeling and Failure Data Analysis for “Actual Need” Exploration. In Proceedings of the MODERN SYSTEMS 2022: International Conference of Modern Systems Engineering Solutions, Saint-Laurent-du-Var, France, 24–28 July 2022. [Google Scholar]
- Krishnan, V.; Ulrich, K.T. Product Development Decisions: A Review of the Literature. Manag. Sci. 2001, 47, 1–21. [Google Scholar] [CrossRef] [Green Version]
- Reid, S.E.; Brentani, U.D. The Fuzzy Front End of New Product Development for Discontinuous Innovations: A Theoretical Model. J. Prod. Innov. Manag. 2004, 21, 170–184. [Google Scholar] [CrossRef]
- de Weck, O.; Eckert, C.M.; Clarkson, P.J. A Classification of Uncertainty for Early Product and System Design. In Proceedings of the DS 42: Proceedings of ICED 2007, the 16th International Conference on Engineering Design, Paris, France, 28–31 July 2007; pp. 159–160. [Google Scholar]
- INCOSE. INCOSE Systems Engineering Handbook: A Guide for System Life Cycle Processes and Activities; John Wiley & Sons: Hoboken, NJ, USA; Incorporated: New York, NY, USA, 2015; ISBN 978-1-118-99940-0. [Google Scholar]
- Wand, Y.; Weber, R. Research Commentary: Information Systems and Conceptual Modeling—A Research Agenda. Inf. Syst. Res. 2002, 13, 363–376. [Google Scholar] [CrossRef] [Green Version]
- Robinson, S.; Arbez, G.; Birta, L.G.; Tolk, A.; Wagner, G. Conceptual Modeling: Definition, Purpose and Benefits. In Proceedings of the 2015 Winter Simulation Conference (WSC), Huntington Beach, CA, USA, 6–9 December 2015; pp. 2812–2826. [Google Scholar]
- Muller, G. Tutorial Architectural Reasoning Using Conceptual Modeling. In Proceedings of the at INCOSE International Symposium, Seattle, WA, USA, 13–16 July 2015. [Google Scholar]
- Balci, O.; Ormsby, W.F. Conceptual Modelling for Designing Large-Scale Simulations. J. Simul. 2007, 1, 175–186. [Google Scholar] [CrossRef]
- Fujimoto, R.; Bock, C.; Chen, W.; Page, E.; Panchal, J.H. (Eds.) Research Challenges in Modeling and Simulation for Engineering Complex Systems; Simulation Foundations, Methods and Applications; Springer International Publishing: Cham, Switzerland, 2017; ISBN 978-3-319-58543-7. [Google Scholar]
- Hoppenbrouwers, S.J.; Proper, H.A.; Weide, T.P. A Fundamental View on the Process of Conceptual Modeling. In Conceptual Modeling—ER 2005. ER 2005. Lecture Notes in Computer Science; Delcambre, L., Kop, C., Mayr, H.C., Mylopoulos, J., Pastor, O., Eds.; Springer: Berlin, Heidelberg, 2005; Volume 3716, pp. 128–143. [Google Scholar]
- Zhang, L.; Zhou, L.; Horn, B.K.P. Building a Right Digital Twin with Model Engineering. J. Manuf. Syst. 2021, 59, 151–164. [Google Scholar] [CrossRef]
- Harrison, N.; Waite, W.F. Simulation Conceptual Modeling Tutorial. In Proceedings of the Summer Computer Simulation Conference, Genoa, Italy, 8–11 July 2012. [Google Scholar]
- Lavi, R.; Dori, Y.J.; Dori, D. Assessing Novelty and Systems Thinking in Conceptual Models of Technological Systems. IEEE Trans. Educ. 2020, 64, 155–162. [Google Scholar] [CrossRef]
- Borches Juzgado, P.D. A3 Architecture Overviews: A Tool for Effective Communication in Product Evolution. Ph.D. Thesis, University of Twente, Enschede, The Netherlands, 2010. [Google Scholar]
- Haveman, S.P. Collective Understanding of System Behavior: Incorporating Simulations in Conceptual Systems Design. Ph.D. Thesis, University of Twente, Enschede, The Netherlands, 2015. [Google Scholar]
- Heemels, M.; Muller, G. Boderc: Model-Based Design of High-Tech Systems; Embedded Systems Institute: Eindhoven, The Netherlands, 2006. [Google Scholar]
- Maier, M.W. The Art of Systems Architecting, 3rd ed.; CRC Press: Boca Raton, FL, USA, 2009; ISBN 978-0-429-19614-0. [Google Scholar]
- Boardman, J.; Sauser, B. Systems Thinking: Coping with 21st Century Problems; CRC Press: Boca Raton, FL, USA, 2008; ISBN 978-1-4200-5492-7. [Google Scholar]
- Sevaldson, B. Visualizing Complex Design: The Evolution of Gigamaps. In Systemic Design: Theory, Methods, and Practice; Jones, P., Kijima, K., Eds.; Translational Systems Sciences; Springer Japan: Tokyo, Japan, 2018; pp. 243–269. ISBN 978-4-431-55639-8. [Google Scholar]
- Gorod, A.; Hallo, L.; Ireland, V.; Gunawan, I. Evolving Toolbox for Complex Project Management, 1st ed.; Complex and Enterprise Systems Engineering; Auerbach Publications: New York, NY, USA, 2019; ISBN 978-0-367-18591-6. [Google Scholar]
- Kwon, O.; Sim, J.M. Effects of Data Set Features on the Performances of Classification Algorithms. Expert Syst. Appl. 2013, 40, 1847–1857. [Google Scholar] [CrossRef]
- Russom, P. Big Data Analytics. TDWI Best Pract. Rep. Fourth Quart. 2011, 19, 1–34. [Google Scholar]
- Laney, D. 3D Data Management: Controlling Data Volume, Velocity and Variety. META Group Res. Note 2001, 6, 1. [Google Scholar]
- Gantz, J.; Reinsel, D. The Digital Universe in 2020: Big Data, Bigger Digital Shadows, and Biggest Growth in the Far East. IDC Iview IDC Anal. Future 2012, 2007, 1–16. [Google Scholar]
- Dijcks, J.-P. Oracle: Big Data for the Enterprise. Oracle White Pap. 2012, 16, 1–14. [Google Scholar]
- Gogia, S.; Barnes, M.; Evelson, B.; Hopkins, B.; Kisker, H.; Yuhanna, N.; Anders, D.; Malholtra, R. The Big Deal about Big Data for Customer Engagement; Forrester Research, Inc.: Singapore, 2012. [Google Scholar]
- White, M. Digital Workplaces: Vision and Reality. Bus. Inf. Rev. 2012, 29, 205–214. [Google Scholar] [CrossRef]
- Big Data Definition—MIKE2.0, the Open Source Methodology for Information Development. Available online: http://mike2.openmethodology.org/wiki/Big_Data_Definition (accessed on 9 October 2022).
- Rajpathak, T.; Narsingpurkar, A. Managing Knowledge from Big Data Analytics in Product Development; White Paper; Tata Consultancy Services: Mumbai, India, 2013. [Google Scholar]
- Unhelkar, B. Big Data Strategies for Agile Business; CRC Press: Boca Raton, FL, USA, 2017. [Google Scholar]
- Ali, H.B.; Helgesen, F.H.; Falk, K. Unlocking the Power of Big Data within the Early Design Phase of the New Product Development Process. INCOSE Int. Symp. 2021, 31, 434–452. [Google Scholar] [CrossRef]
- Klein, G.; Phillips, J.K.; Rall, E.L.; Peluso, D.A. A Data-Frame Theory of Sensemaking. In Expertise out of Context, Proceedings of the Sixth International Conference on Naturalistic Decision Making; Lawrence Erlbaum Associates Publishers: Mahwah, NJ, USA, 2007; pp. 113–155. ISBN 978-0-8058-5510-4. [Google Scholar]
- Weick, K.E. Sensemaking in Organizations; Sage: Thousand Oaks, CA, USA, 1995; Volume 3. [Google Scholar]
- Ali, H.B.; Langen, T.; Falk, K. Research Methodology for Industry-Academic Collaboration—A Case Study. INCOSE Int. Symp. 2022, 32, 187–201. [Google Scholar] [CrossRef]
- Potts, C. Software-Engineering Research Revisited. IEEE Softw. 1993, 10, 19–28. [Google Scholar] [CrossRef]
- Robinson, S. Conceptual Modelling for Simulation: Progress and Grand Challenges. J. Simul. 2020, 14, 1–20. [Google Scholar] [CrossRef]
- Laporte, C.; Vargas, E.P. The Development of International Standards to Facilitate Process Improvements for Very Small Entities. Available online: https://www.igi-global.com/chapter/content/www.igi-global.com/chapter/content/77760 (accessed on 6 October 2022).
- SEBoK Editorial Board. Guide to the Systems Engineering Body of Knowledge (SEBoK); The Trustees of the Stevens Institute of Technology: Hoboken, NJ, USA, 2022; Volume 2.6. [Google Scholar]
- Lewrick, M. The Design Thinking Playbook: Mindful Digital Transformation of Teams, Products, Services, Businesses and Ecosystems; John Wiley & Sons, Inc.: Hoboken, NJ, USA, 2018; ISBN 978-1-119-46747-2. [Google Scholar]
- Zhang, P.; Soergel, D. Towards a Comprehensive Model of the Cognitive Process and Mechanisms of Individual Sensemaking. J. Assoc. Inf. Sci. Technol. 2014, 65, 1733–1756. [Google Scholar] [CrossRef]
- Zhang, P.; Soergel, D. Cognitive Mechanisms in Sensemaking: A Qualitative User Study. J. Assoc. Inf. Sci. Technol. 2020, 71, 158–171. [Google Scholar] [CrossRef]
- Muller, G. CAFCR: A Multi-View Method for Embedded Systems Architecting; Balancing Genericity and Specificity. Ph.D. Thesis, Technical University of Delft, Delft, The Netherlands, 2004. [Google Scholar]
- Kjørstad, M. Exploration and Early Validation in Systems Engineering: A Study on Combining Systems and Design Practices in Systems Development towards Innovations in Norwegian High-Tech Industries. Ph.D. Thesis, University of South-Eastern Norway, Notodden, Norway, 2022. [Google Scholar]
- Stenström, C.; Al-Jumaili, M.; Parida, A. Natural Language Processing of Maintenance Records Data. Int. J. COMADEM 2015, 18, 33–37. [Google Scholar]
- Statens Vegvesen. Statens Vegvesen Fellesdokument Driftskontrakt Veg D2: Tegninger Og Supplerende Dokumenter D2-ID9300a Bruk Av Salt. Available online: https://www.mercell.com/m/file/GetFile.ashx?id=151465704&version=0 (accessed on 14 December 2022).


| Criteria/Framework | Data-Frame Theory of Sense- Making | Quadruple Diamond | Cognitive Processes of Sensemaking | CAFCR |
|---|---|---|---|---|
| Stepwise process | / | |||
| Iterative process | X | / | X | X |
| Top-down/ Bottom-up | X | X | X | X |
| Abstraction capabilities | X | X | X | X |
| Multiview approach | X | X | ||
| Data-Centric | X | X | X | |
| Soft aspect approach | X | X |
Disclaimer/Publisher’s Note: The statements, opinions and data contained in all publications are solely those of the individual author(s) and contributor(s) and not of MDPI and/or the editor(s). MDPI and/or the editor(s) disclaim responsibility for any injury to people or property resulting from any ideas, methods, instructions or products referred to in the content. |
© 2022 by the authors. Licensee MDPI, Basel, Switzerland. This article is an open access article distributed under the terms and conditions of the Creative Commons Attribution (CC BY) license (https://creativecommons.org/licenses/by/4.0/).
Share and Cite
Langen, T.; Ali, H.B.; Falk, K. A Conceptual Framework for Data Sensemaking in Product Development—A Case Study. Technologies 2023, 11, 4. https://doi.org/10.3390/technologies11010004
Langen T, Ali HB, Falk K. A Conceptual Framework for Data Sensemaking in Product Development—A Case Study. Technologies. 2023; 11(1):4. https://doi.org/10.3390/technologies11010004
Chicago/Turabian StyleLangen, Tommy, Haytham B. Ali, and Kristin Falk. 2023. "A Conceptual Framework for Data Sensemaking in Product Development—A Case Study" Technologies 11, no. 1: 4. https://doi.org/10.3390/technologies11010004