Article

Research on the Effect of Road Height Profile on Fuel Consumption during Vehicle Acceleration

1
Department of Transport and Logistics, Faculty of Technology, Institute of Technology and Business in České Budějovice, Okružní 517/10, 370 01 České Budějovice, Czech Republic
2
Department of Road and Urban Transport, Faculty of Operation and Economics of Transport and Communications, University of Žilina, Univerzitná 1, 010 26 Žilina, Slovakia
*
Author to whom correspondence should be addressed.
Technologies 2022, 10(6), 128; https://doi.org/10.3390/technologies10060128
Submission received: 14 November 2022 / Revised: 29 November 2022 / Accepted: 7 December 2022 / Published: 9 December 2022
(This article belongs to the Section Environmental Technology)

Abstract

:
The presented article deals with research on the dependence between road vehicle fuel consumption and the longitudinal height profile of the road. The main research goal is to investigate the difference in fuel consumption during acceleration on different longitudinal profiles of the road (i.e., flat surface, downhill) based on the actual investigation. In the first part of the article, important factors influencing fuel consumption during vehicle acceleration are summarized and a review of literature dealing with this issue is carried out. The next part focuses on the very real-world measurement. In addition to fuel consumption, other parameters were recorded that could be detected by a professional measuring laboratory. In the final part of the article, all the recorded data are evaluated, compared with research question and an actual example is given. Based on the evaluation, it could be concluded that approx. 100 L of fuel can be saved in one week thanks to the implemented measures. Thereafter, recommended possibilities for further use of these findings in technical practice are outlined in the conclusion.

1. Introduction

The issue of vehicle fuel consumption investigation has been the focus of many research teams for many years, not only from research institutions, but also, for example, from automotive development teams or independent experts [1]. The results of such research are projected, into data on vehicle consumption in urban and non-urban traffic, their combination, average values, and so on [2]. Data on the fuel consumption of vehicles are also included in the technical parameters of vehicles, while the exact methodology for the given measurements is also specified in the implementing decrees of relevant legislative regulations [3]. However, the actual fuel consumption of vehicles can be completely different from the values provided by the manufacturer. This can be due to a wide array of factors, wherein the technical condition of the vehicle and its powertrain, driving style or fuel quality play a big role, as well as other influences such as climate and road and its material and height profile [4]. The physics of motion indicates that rapid fuel consumption occurs during acceleration. Although accelerations last for a relatively short time, they occur very often, e.g., when vehicles are in motion in the urban environment [5]. In addition to increased fuel consumption, acceleration is also associated with emissions (mainly exhaust gases and noise) [6]. This research focuses on acceleration from 0 km/h on a distance of about 30 m and analyzes fuel consumption and its changes when the vehicle accelerates on a flat surface or downhill [7]. Based on the above, the research question is formulated as follows: “How does the height profile of road surface affect the vehicle’s fuel consumption during acceleration in observed range of speeds?”.
The main research goal is to examine the difference in fuel consumption during acceleration on roads with defined different height profiles, based on real-world measurements, because it is necessary to look for solutions that will lead to the sustainability of transport, regardless of the behavior and demands of its users. Research conclusions can serve to facilitate the decision-making process in relation to transport planning, and its practical use in the right direction can affect not only the fuel consumption of vehicles (which is beneficial for their owners), but also reduce the volume of emissions from road traffic (which is desirable for the environment) [8].
As mentioned, this part summarizes and cites a number of relevant sources (such as research studies and methodologies) dealing with the issue discussed. Research in the field of fuel consumption can be divided into several directions. Many scientific articles dealing with the fuel consumption of vehicles, especially in terms of its comparison based on the type of road traffic, type of engine and speed of vehicles, is included. At the same time, it is necessary to mention the concept of electromobility as well. Although it does not deal with fuel consumption, but due to effort to achieve the greatest possible share of electric vehicles, the physical principle of their movement regarding energy conversion, which is practically identical to vehicles with internal combustion engine, is basically the same.
Distribution of vehicle speeds indicates that idling and low speeds account for a large proportion of total driving time in urban areas [9]. Based on the microscopic analysis performed, it can be seen that low speeds show high emission factors; the modal analysis points to the fact that emissions produced by vehicles when idling are several times higher than during other driving modes. The above-mentioned study was conducted for the city of Hong Kong. The research included several types of vehicles with different types of propulsion (passenger car and van with spark ignition engine, and van and bus with compression ignition engine).
In several scientific articles, fuel consumption of vehicles is perceived differently according to the environment in which the vehicle moves. For example, the research studies [10,11] describe different driving styles in the urban environment and their impact on fuel consumption and emissions. On the contrary, the papers [12,13] propose models that divides vehicle fuel consumption into two different operating modes: constant travel speed and vehicle acceleration. In each mode, fuel consumption was proven to depend on the instantaneous engine efficiency, approximated by two analytical functions instead of the commonly considered consumption map. Furthermore, the works [14,15,16,17,18] present the distinct approaches of instantaneous fuel consumption, which encompass vehicle characteristics, engine characteristics, as well as gear selection schemes. These models are further implemented in different types of passenger cars and their operations are examined by applying microscopic traffic simulation or artificial neural networks.
Specifically, in the literature [14], the authors ascertain that for each 1% increase (decrease) in travel time in comparison with traveling in common traffic conditions (i.e., according to the set speed), the fuel consumption increases (decreases) by approx. 1.1%. Nevertheless, a professional driver can save fuel without increasing travel time by skillfully modifying his velocity in order to evade stops at light-controlled intersections. In the research [15], Treiber et al. interpret that congestions in traffic that occurred usually leading to an increase in fuel consumption by approx. 80%, whilst the travel time is often up to four times higher. Hence, they state that the effect of congestion occurrence on fuel consumption is significantly lower than that on travel time. In contrast to the previous, the manuscript [16] presents a significance analysis of the effects of 3D road infrastructure (such as gradient and curvature parameters), hypothetical constraints in estimated time of arrival, as well as emission limitations and enforced stops on the fuel consumption and the optimum driving course of common road vehicles with a compression ignition engine. It suggests an introduction of multiple-phase optimum control in order to obtain a better comprehending of actual driving scenarios and encourages the deviation from typical driving styles. In addition, works [17,18] are focused on modeling and conducting experimental simulations in terms of prediction of vehicle fuel consumption based on using the principles of an artificial neural network.
In addition to fuel consumption, emission production represents another monitored attribute. As stated in the publications [19,20,21,22], the effect of vehicle acceleration on actual fuel consumption and the produced emissions of hydrocarbons, carbon monoxide and nitrogen oxides can be quantified using simple demonstrations. In principle, these studies show that the vehicle fuel consumption is more sensitive to travel velocity rather than to the acceleration per se, whereas the related emission rates are more sensitive to the vehicle’s acceleration and deceleration level. Specifically, the paper [19] discusses simulation options to rearrange the traffic condition and vehicle batch movements with an adaptive smoothing technique, render acceleration rates from the rearranged vehicle movements, and quantify the amount of consumed fuel and produced emissions with filtered velocity and estimated acceleration level are the input parameters.
On the other hand, Fontaras et al. [20] and Van Mierlo et al. [21] deal with an experimental investigation of fuel consumption and CO2 emissions of passenger cars depending on multiple driving styles in various laboratory and real-traffic conditions when affecting different traffic aspects (i.e., vehicle configuration, acceleration degree, as well as traffic and weather conditions such as traffic intensity, road class, side winds, and rain). Moreover, the authors of the article [22] explicitly prove that the vehicle’s acceleration degree has a rather considerable effect on the vehicle’s emission production. In particular, a generation of hydrocarbon and carbon monoxide emission volumes is highly sensitive to the acceleration level in comparison with driving velocities in the common scope.
At the same time, according to Zhang et al. [23], there are also significant differences in driving smoothness, emissions and fuel consumption depending on the different types of drivers. Cautious, novice drivers produce the lowest vehicle emission production and fuel consumption, but also the lowest travel speed. Conversely, experienced drivers when driving smoothly are able to drive at a higher travel speed while maintaining low fuel consumption and emissions. Aggressive drivers show a higher travel speed, but with a very uncomfortable (nonsmooth) drive, which is reflected in higher fuel consumption and larger volumes of produced emissions [23].
Thus, the studies [24,25,26,27] essentially focus on the comparison of alternative-fuel-powered and conventional vehicles and their impact on fuel consumption and emissions. According to [24,25], hybrid electric vehicles are perceived as more energy efficient and less polluting than vehicles with a conventional combustion engine when compared over different driving cycles and various actual driving examinations. The findings of their works indicate that hybrid vehicles saved between 23% and 49% of fuel compared to the conventional ones. Slavin et al. [26] demonstrate that in spite of economic differences in countries all over the world, even in less developed states, a series of endeavors have been conducted to diminish vehicle exhaust emissions. In addition, they perform real-world traffic and single-roller dynamometer examination in order to quantify fuel, economic, environmental and energy indicators of a serial car with a standard carburetor power system and a car equipped with an electronic gasoline injection system and a three-component catalytic converter. In addition, the literature [27] compares two methodologies related to quantification of the fuel consumption, greenhouse gas (GHG) production and several other exhaust pollutants (according to the European Standard EN 16258:2012—general methodology for evaluation and declaration of energy consumption and GHG emissions, and the Handbook of Emission Factors for Road Transport) in terms of assessing the possibility of minimizing the values of those indicators. The research was conducted by introducing liquefied natural gas buses into Slovak bus transport.
On the other hand, publication [28] deals with the effect of fuel price changes on the concentration of traffic. The authors of this study assume that a 10% rise in real fuel price and remaining at that level results in an approximately 1% decrease in total traffic volume in one year, which leads to an approximate 3% reduction over a longer period (i.e., five years). The fuel consumption will decrease by about 2.5% during the year, which entails more than a 6% reduction in the longer term. The reason why the decrease in fuel consumption is larger than a decrease in the traffic volume is likely due to the fact that price rise leads to more efficient use of fuel (by combining technical vehicle improvements, more fuel-efficient driving style and driving in more favorable traffic conditions).
Lastly, the subject of the paper [29] is to design a methodology for investigating vehicle fuel consumption based on actual operating conditions, and presents selected significant parameters affecting vehicle fuel consumption during laboratory test driving. The authors first constructed a route height profile using a special application which also displays the speed course according to the distance traveled and initial time of examination. Subsequently, individual time sections were divided into speed intervals, which then enabled the determination of the percentage value of the total time of the journey when the vehicle was moving within the defined speed limits.
The structure of this case study is compiled as follows: after the introductory and literature review sections, which encompass numerous topic-related literature sources, in the subsequent sections, all the relevant data and methods are specified and the results obtained are presented, along with the accompanied discussion. This is followed by the conclusion, where specific recommendations for further research in the particular topic are discussed.

2. Data and Methods

This section describes the actual investigation carried out in order to provide the answer to the research question stipulated. The real-world measurement of fuel consumption was performed in cooperation with the University of Žilina, namely with the researchers from the Faculty of Operation and Economics of Transport and Communications, Department of Road and Urban Transport, with the aim to quantify selected operating parameters of a laboratory tested vehicle and its engine during its acceleration at different road height profiles (namely, flat surface 0.00%, downhill −8.51%). The experimental investigation included a total of 20 vehicle starts on the flat surface and 20 downhill starts. The laboratory tested vehicle was a Kia Ceed (see Figure 1), whose technical parameters are listed in Table 1.
As part of the measurements, the following technology (equipment) was installed in the vehicle. The parameters of the vehicle detected using this technology are as follows [30]:
(1) Diagnostics of Vgate Icar 2 electronic systems with the OBD Fusion software:
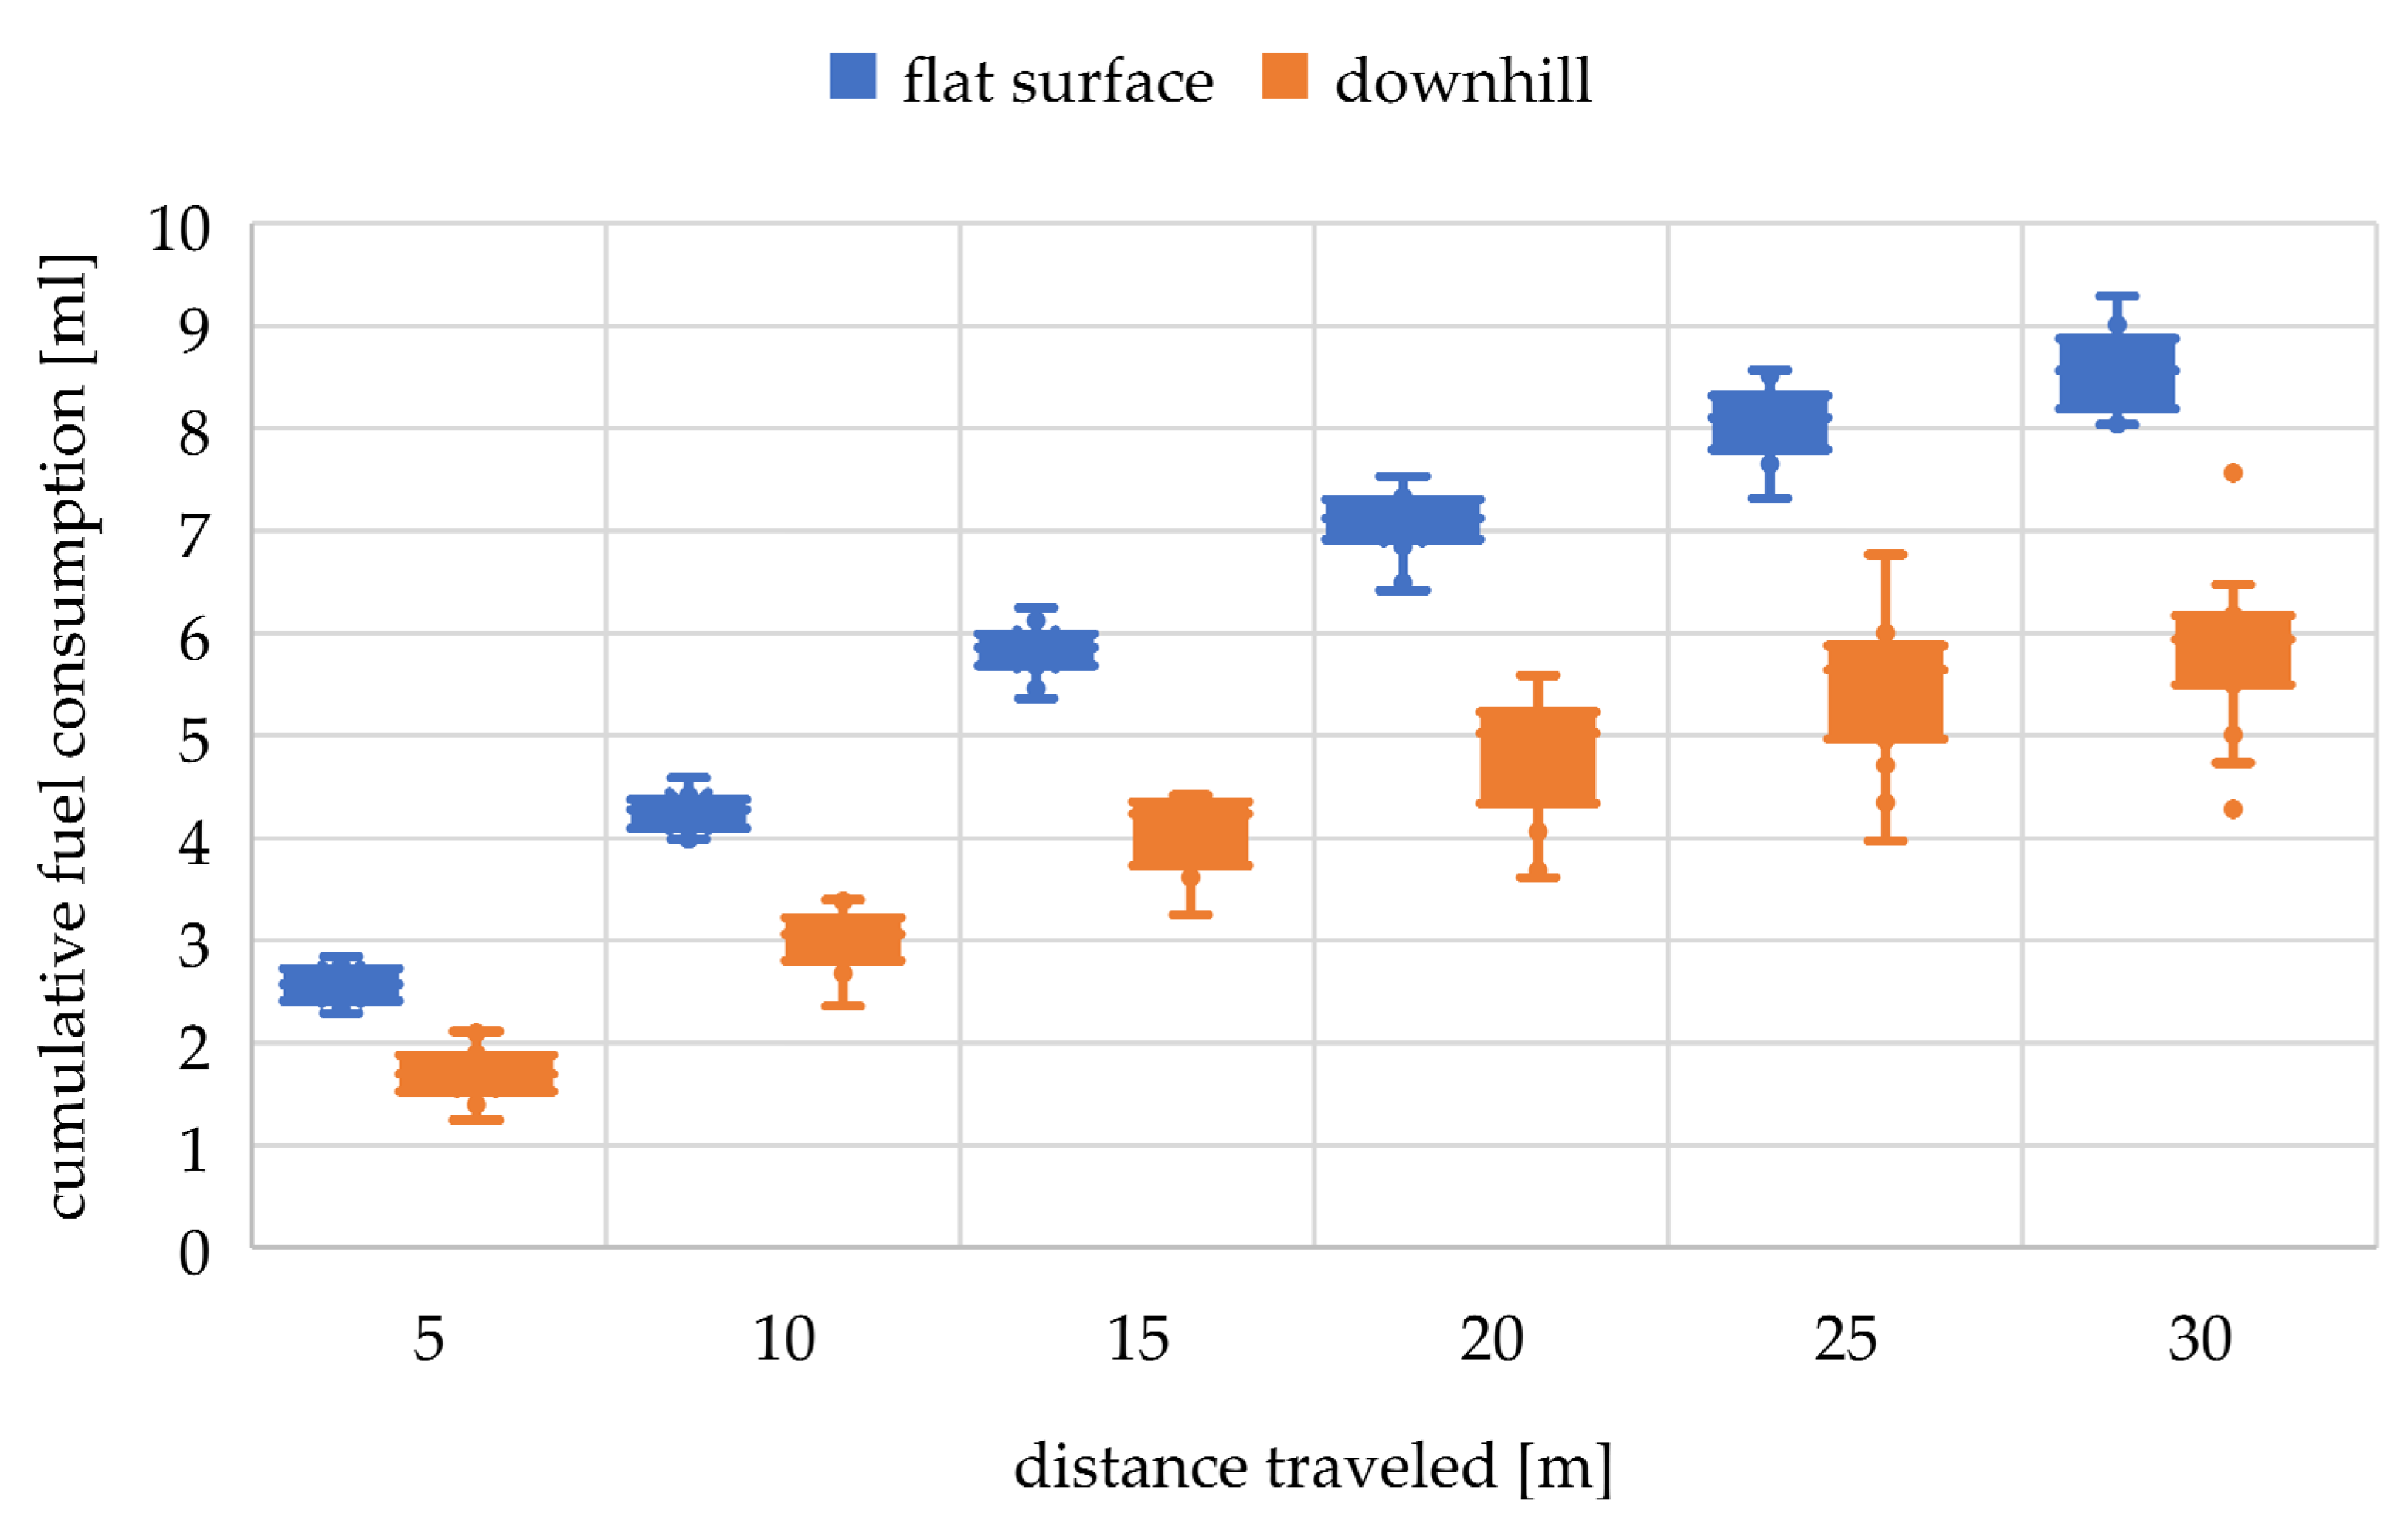
  • volume of consumed fuel [mL];
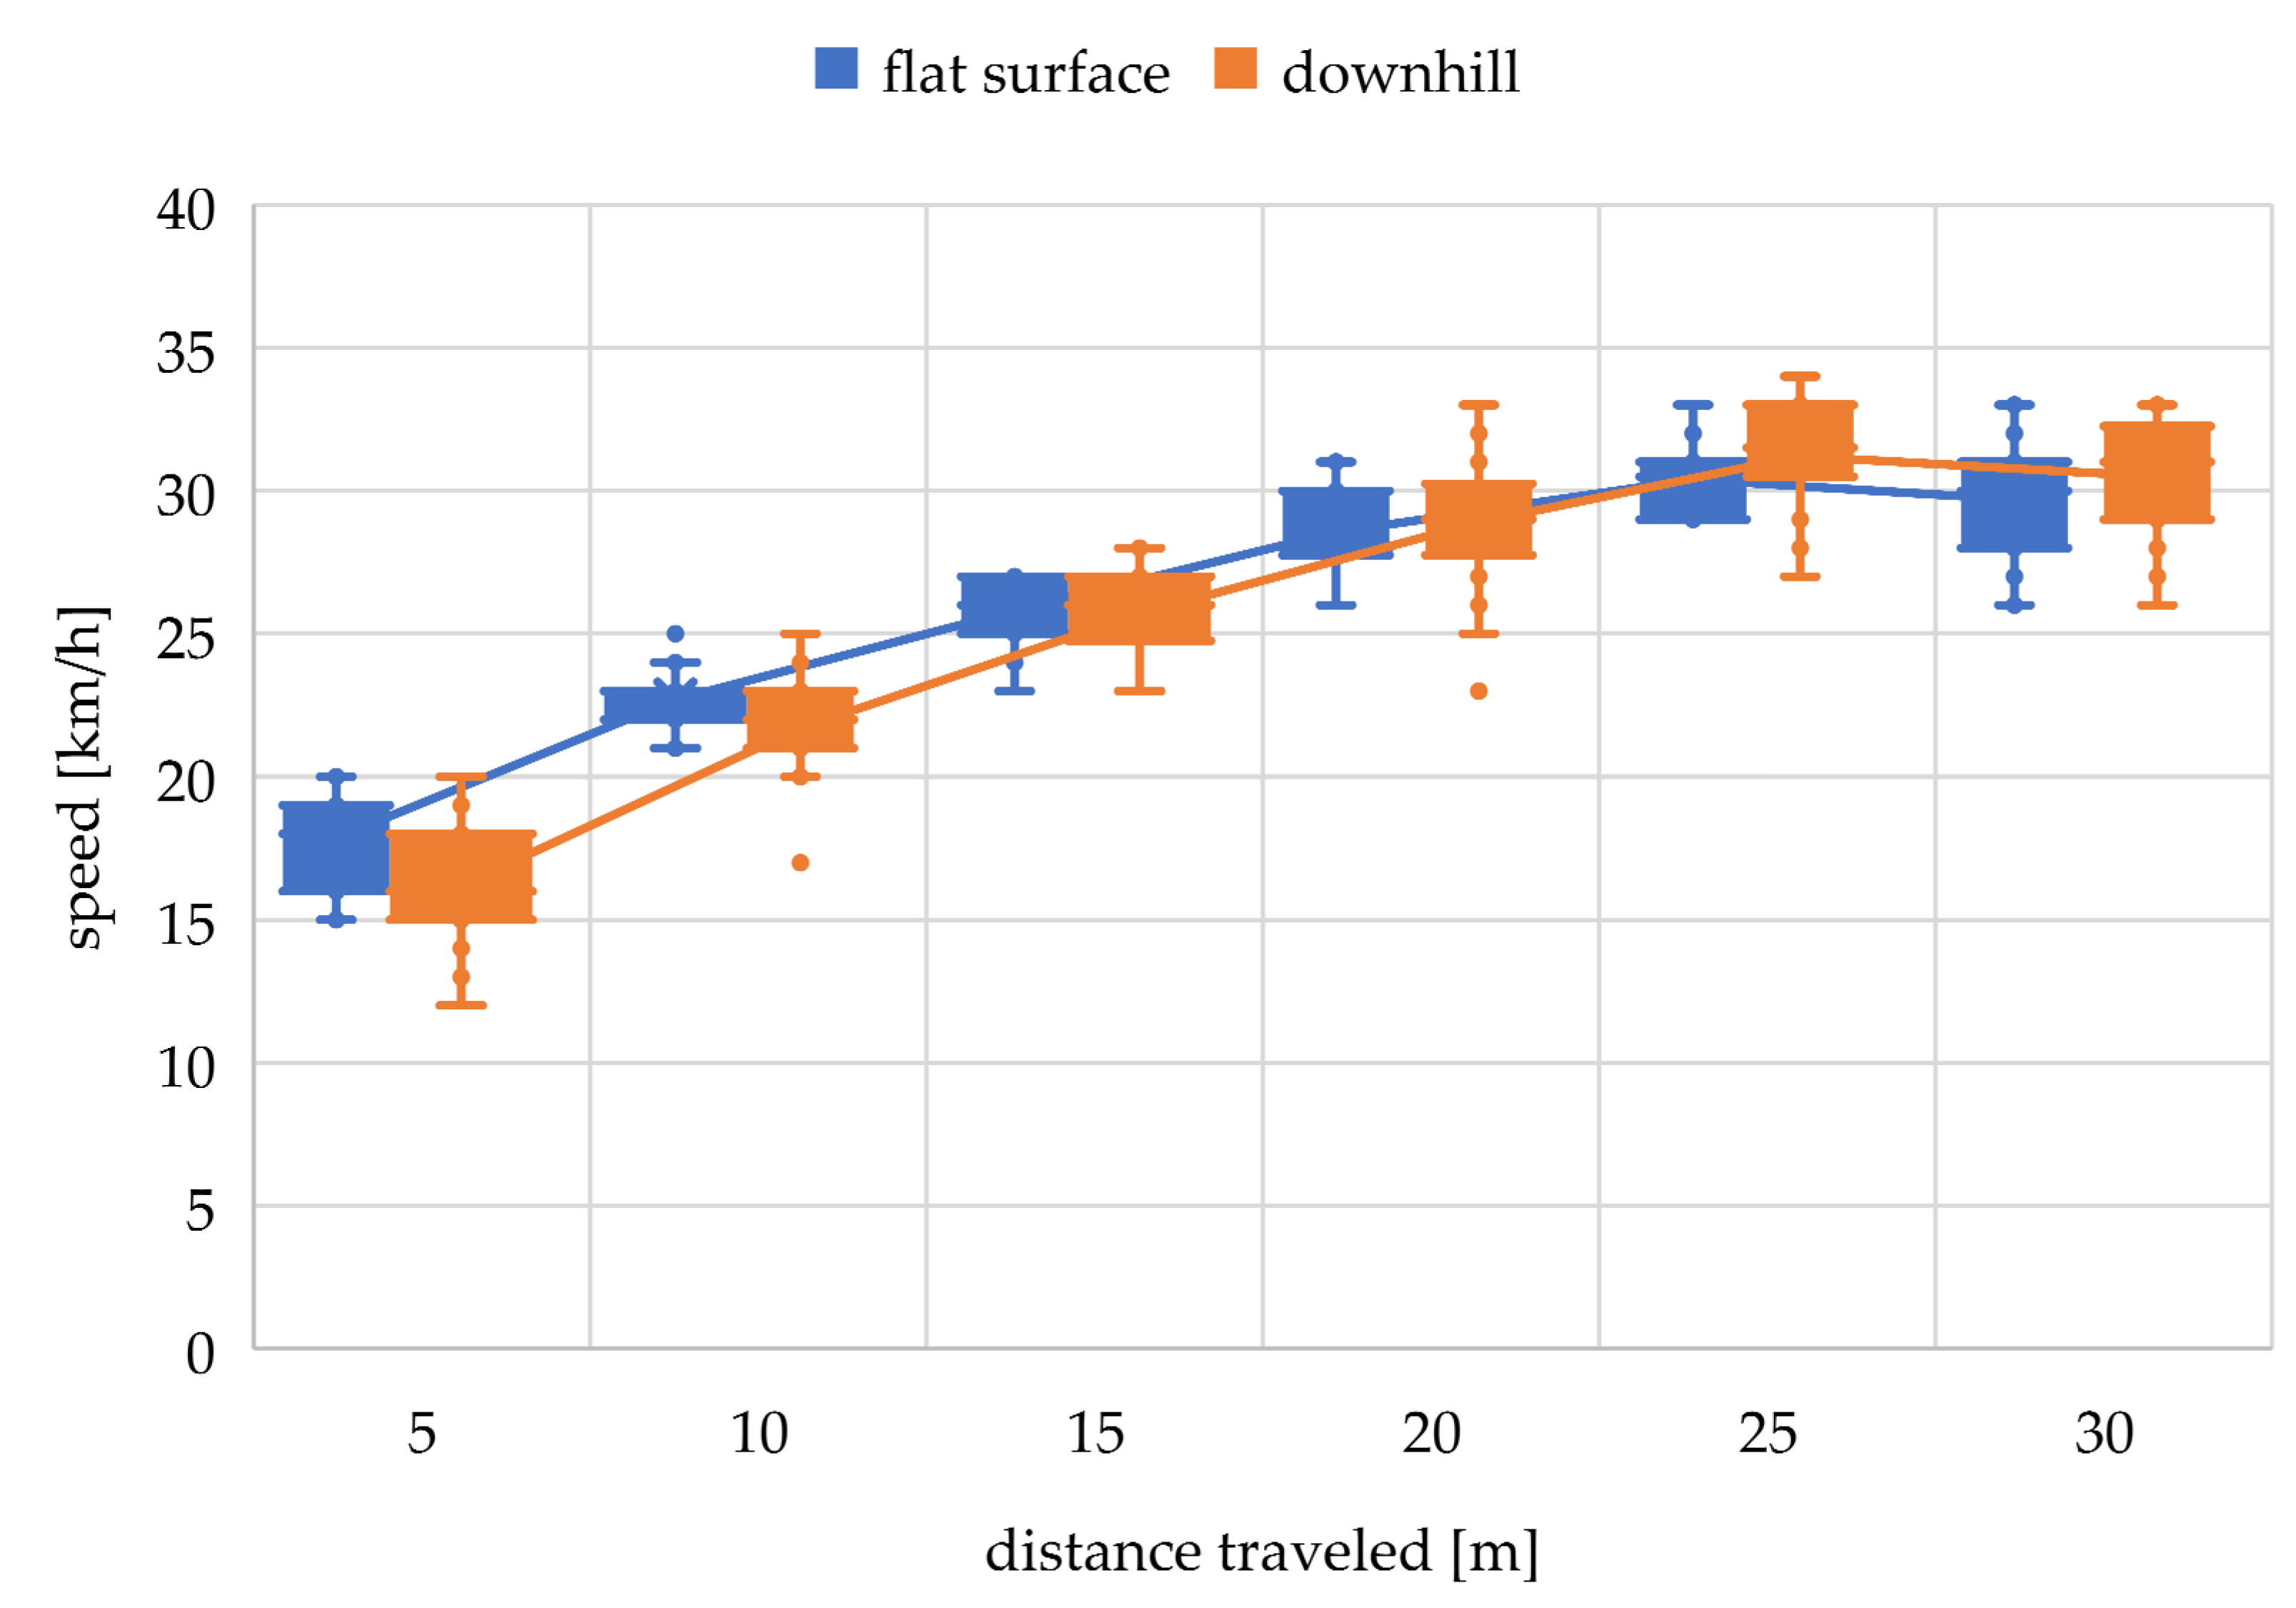
  • vehicle speed [km/h];
  • engine speed [min−1];
  • throttle position [%];
  • volume of air [g/s];
  • engine power [kW];
  • engine torque [Nm].
(2) MAHA MGT 5 exhaust gas analyzer:
  • volume concentration of CO, HC, NOx, CO2 [%];
  • production of CO, HC, NOx, CO2 [g/0.05 s];
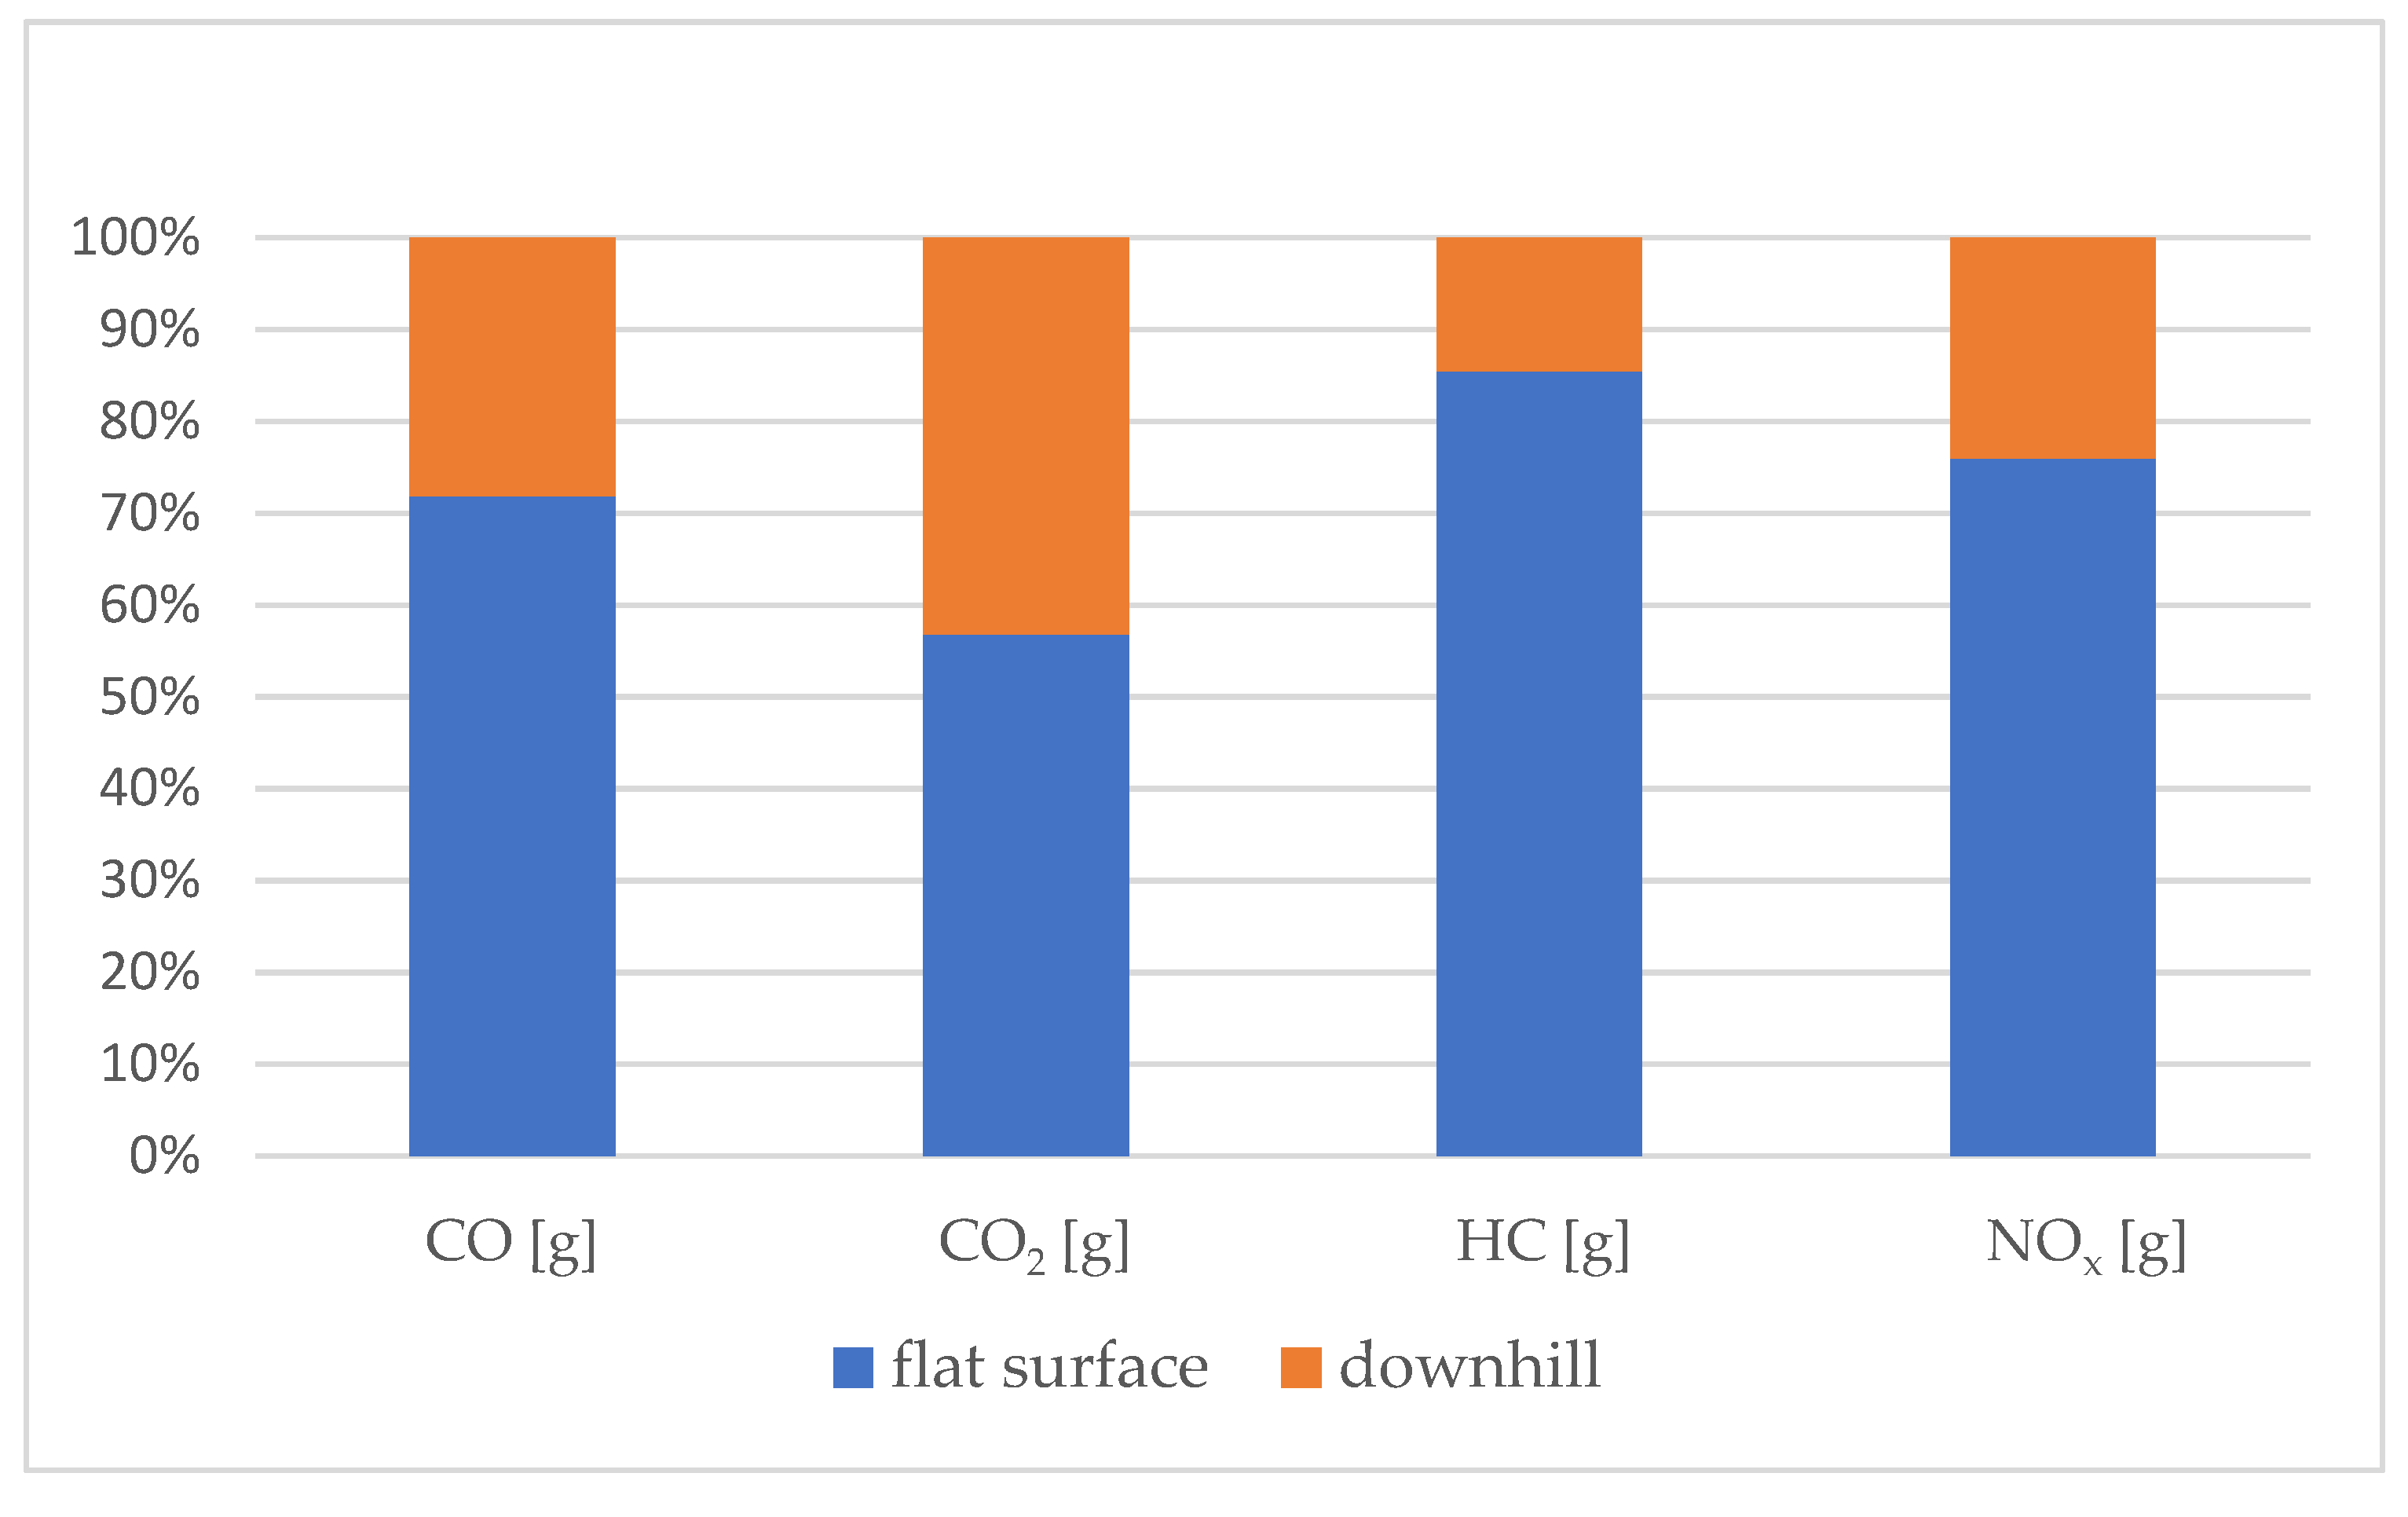
  • production of CO, HC, NOx, CO2 [g].
The equipment used to perform the real-world measurement is commonly used for OBD (on-board diagnostics) and is able to communicate with the electronic control unit of many types of vehicles. The data obtained can be converted into communication protocols according to the generally used standards SAE J1850 PWM, SAE J1850 VPW, ISO9141-2, ISO14230-4 (KWP2000) and ISO15765-4/SAE J2480 (CAN BUS). This diagnostics was chosen due to its applicability in a wide array of vehicles, which will be used in further steps of the research [30]. Table 2 shows the fundamental technical data of the MAHA MGT 5 device.
Basic outputs from a measurement process for individual road height profiles as well as the related discussion are presented in the following section entitled Results and Discussion.

3. Results and Discussion

Due to the reliability of the experimental measurements, it was necessary to consider deviations caused primarily by the human factor (or the driver’s ability to drive the car repeatedly with the same or similar acceleration rate). Basically, it is the matter of monitoring and recording the properties of a “hard system” (if perceiving the car as a machine), driven by a “soft system” (human). Therefore, a total of 25 measurements of flat surface acceleration and 25 measurements of downhill acceleration were taken, with the five most different measurements from each section being excluded [31].
Using a box plot, Figure 2 shows a comparison of speeds depending on the distance traveled when driving on a flat surface and driving downhill. The purpose of this comparison was to show the variance of individual measurements, while the minimum speed values over a traveled distance of 5–20 m are deemed comparable for the purpose of this research, so that the fuel consumption during individual trips could thus be considered relevant.
It can be seen from Figure 2 that speeds while accelerating on the flat surface and when driving downhill are very similar. Therefore, the inaccuracy of the consumption caused by the effect of acceleration jerk was neglected.
During the consumption investigation, the emphasis was placed on performing similar vehicle accelerations in both road height profiles in terms of achieving speeds in the specified distances. As mentioned, 20 acceleration measurements were evaluated for each road height profile. A box plot in Figure 2 above shows the distribution of data into quartiles and highlights the median and outliers. Vertical lines called “whiskers” run from the boxes which indicate variability outside the upper and lower quartiles, and any point outside these lines is regarded as an outlier.
Table 3 presents the results of the cumulative fuel consumption from each measurement. The graphical representation of the difference in fuel consumption by a box plot is depicted in Figure 3, from which it is clear that fuel consumption in both road height profiles is different and even the whiskers do not overlap in the individual driving sections (i.e., they do not acquire similar values).
Following Table 3 and Figure 3, it can be concluded that fuel consumption during downhill acceleration is clearly lower (approximately of 30%) compared to fuel consumption during flat surface acceleration. The resulting measured values of emissions for five selected starts of the laboratory tested vehicle on the flat surface are summarized in Table 4, while the values for downhill acceleration are presented in Table 5. Figure 4 shows the total values of CO [g], CO2 [g], HC [g] and NOx [g] emissions as a sum of all the measurements.
Based on the executed starts (i.e., 20 acceleration measurements on a flat surface and 20 downhill acceleration measurements with an average longitudinal gradient of −8.51%) of the Kia Ceed vehicle on the determined section, it can be seen that the difference in the average fuel consumption within the distance of 30 m between acceleration on a flat surface and downhill is 31.41% (excluding min. and max. values). As part of the real-word investigation, other technical parameters such as vehicle emissions, vehicle speed, engine speed, throttle position, volume of air intake, engine power and torque were monitored and recorded during vehicle acceleration. In addition to measuring fuel consumption, an emission measuring device was installed in the tested vehicle, which was only used for measurement at every fifth time the vehicle was started. As part of this research, which was primarily aimed at confirming the research question in the form of case study/pilot project when executing real-world examination, its limitations were not taken into account since each measurement step took place under the same conditions (the same vehicle, the same driver, the same road height profile, the same road testing section, the same climatic conditions, and the same vehicle weight, where weight loss due to fuel consumption was neglected) and the same measuring techniques. Following the evaluation of the recorded data, the research question concerning the dependence of the vehicle fuel consumption on the road height profile could thus be objectively confirmed [32].
This finding can be used in technical practice; for instance, in designing elevated parking places or intersections that minimize the negative impacts of vehicle acceleration on their fuel consumption on the one hand, and on the environment in the form of reduced traffic emissions on the other hand [33]. The roundabout on road II/156 in České Budějovice (GPS 48.9586150N, 14.4986328E) can be used as an example. It was initially designed as elevated compared to the surrounding ground level, presumably because of the off-grade crossing with the pedestrian and cycling path that runs under this intersection (see Figure 5). A side effect of this design lies in the fact that vehicles lowering their speed before the intersection for safety reasons are gravitationally slowed down just by driving uphill, which, among other things, will also reduce the wear of brake components and increase the efficiency of the vehicle’s braking system [34].
On the other hand, the exit from this roundabout is followed by a downhill run. Here, it is possible to apply the findings stated in Section 2 of this article (given that the effect of gravity reduces the fuel consumption of vehicles while accelerating), which will have a positive effect on reducing the fuel consumption and the volume of vehicle emissions, which will also be lower than when driving on flat surface [35]. Given that the parameters of this intersection and its roads are very similar to those of the road height profile on which the experimental investigation was conducted, it can be concluded that the savings in fuel and reduced emissions will be similar [36]. With 100,000 vehicles passing through this site in one week, and taking into account vehicles similar to the experimental laboratory vehicle used (see Table 1), the experts estimate that approx. 100 L of fuel could be saved due to the height profile of this roundabout [37].

4. Conclusions

The topic of this research is based on the years-long effort of traffic engineers to increase the flow of traffic, and, in addition, to find ways to limit the stopping and restarting of vehicles, which are the moments when the fuel consumption is enormous, albeit short-term, to reduce high volumes of exhaust gas emissions, as well as an electricity conversion in line with vehicles with an electric propulsion. The results of these efforts can be utilized, for example, in the construction of roundabouts, level crossings and in the design of other measures and approaches, as mentioned in the previous section of the paper.
The main objective of the research conducted was to examine the difference in the vehicle’s fuel consumption when accelerating on roads with predefined distinct height profiles. Individual findings can assist towards decision-making purposes in the context of transport planning, and their practical application in the right direction can positively affect both the vehicle’s fuel consumption volume as well as the volume of exhaust gas emissions induced from road traffic. As mentioned, approx. 100 L of fuel can be saved in one week by introducing the proposed measures.
The authors realize that in the event of addressing a greater research study or project, it would be appropriate to minimize the number of limitations and, for the greater investigation objectivity, it would be reasonable and desirable to take into consideration even the aspects as follows, for instance, multiple measuring operations on different road longitudinal profiles, as well as comparative examination of several categories of vehicles, such as passenger car, truck, bus, and types of vehicles with different conventional propulsion systems (gasoline, diesel, gas). Furthermore, it also would be beneficial to include alternative types of propulsions, such as electric cars, hybrid or autonomous vehicles in the research, as well as other measuring equipment such as accelerometers, fuel flow meters of different types and functions, or another independent measuring laboratory. Moreover, if a significantly greater number of measuring operations are being conducted, especially on road height profiles with different slopes, in different climatic conditions and using different types of vehicles, an uncertainty analysis would be of great benefit. In that case, it would be possible to identify and analyze actual factors that affect the dispersion of the recorded values.
The authors of the article also believe that the findings can be applied in technical practice, primarily by public administration and authorities dealing with transport constructions, rather than in commercial use.
As for further research, it will be imperative to aim at such solutions and measures that will lead to transport sustainability, regardless of the behavior and demands of its users. The authors are aware of the fact that there is still room for improvement with regard to the topic discussed, for example, in places where the implementation of innovative transport solutions is out of the question due to multiple reasons, or in addressing issues that have not yet been addressed. Such solutions can involve, for example, elevated surfaces of road at-grade intersections, parking places, bus stops or entrance/exit flow of roundabouts, as shown in the designed roundabout scenario in Figure 5. However, searching for the right solutions to these concerns still requires an individual approach, at least until all these solutions are standardized and incorporated into the relevant legislative measures.

Author Contributions

Conceptualization, O.S. and B.Š.; methodology, J.H. and J.P.; software, J.H. and J.P.; validation, O.S., L.B. and B.Š.; formal analysis, O.S. and B.Š.; investigation, J.H., J.P. and B.Š.; resources, L.B. and B.Š.; data curation, J.P., O.S. and B.Š.; writing—original draft preparation, J.H. and J.P.; writing—review and editing, J.H., J.P. and O.S.; visualization, J.H. and O.S; supervision, L.B., O.S. and B.Š.; project administration, J.H. and O.S.; funding acquisition, J.H. and J.P. All authors have read and agreed to the published version of the manuscript.

Funding

This research received no external funding.

Institutional Review Board Statement

Not applicable.

Informed Consent Statement

Not applicable.

Data Availability Statement

Not applicable.

Acknowledgments

This article was supported by addressing the specific university research project No. 04SVV22 entitled “Research into the influence of road height profile on fuel consumption during vehicle acceleration” at the Institute of Technology and Business in České Budějovice.

Conflicts of Interest

The authors declare no conflict of interest.

References

  1. Ait Ouallane, A.; Bakali, A.; Bahnasse, A.; Broumi, S.; Talea, M. Fusion of engineering insights and emerging trends: Intelligent urban traffic management system. Inf. Fusion 2022, 88, 218–248. [Google Scholar] [CrossRef]
  2. E, J.; Zhao, X.; Qiu, L.; Wei, K.; Zhang, Z.; Deng, Y.; Han, D.; Liu, G. Experimental investigation on performance and economy characteristics of a diesel engine with variable nozzle turbocharger and its application in urban bus. Energy Convers. Manag. 2019, 193, 149–161. [Google Scholar] [CrossRef]
  3. Vedula, S.; Pandey, N.K.; Nese, R. An adaptive neuro-fuzzy logic based systematic approach of modelling virtual driver for real world driving. In Proceedings of the IEEE International Transportation Electrification Conference, ITEC-India 2015, Chennai, India, 27–29 August 2015. [Google Scholar] [CrossRef]
  4. Wang, S.; Yu, P.; Shi, D.; Yu, C.; Yin, C. Research on eco-driving optimization of hybrid electric vehicle queue considering the driving style. J. Clean. Prod. 2022, 343, 130985. [Google Scholar] [CrossRef]
  5. Fischer, S.; Gluck, P. An exercise in vehicle kinematics and energetics. Phys. Teach. 2009, 47, 137–141. [Google Scholar] [CrossRef]
  6. Hydén, C.; Várhelyi, A. The effects on safety, time consumption and environment of large scale use of roundabouts in an urban area: A case study. Accid. Anal. Prev. 2000, 32, 11–23. [Google Scholar] [CrossRef] [PubMed]
  7. Lv, C.; Liu, J.; Zhang, X. Research on intelligent vehicle detection and tracking method based on multivision information fusion. Mob. Inf. Syst. 2022, 2022, 6230713. [Google Scholar] [CrossRef]
  8. Eichlseder, W.; Raab, G.; Krisper, G. Calculation of driving performance, fuel consumption and emissions of military trucks by driving simulation. SAE Tech. Pap. 1993. [Google Scholar] [CrossRef]
  9. Tong, H.Y.; Hung, W.T.; Cheung, C.S. On-Road Motor Vehicle Emissions and Fuel Consumption in Urban Driving Conditions. J. Air Waste Manag. Assoc. 2000, 50, 543–554. [Google Scholar] [CrossRef] [Green Version]
  10. Ericsson, E. The relation between vehicular fuel consumption and exhaust emission and the characteristics of driving patterns. Trans. Built Environ. 1999, 41, 137–147. [Google Scholar]
  11. Wang, H.; Fu, L.; Zhou, Y.; Li, H. Modelling of the fuel consumption for passenger cars regarding driving characteristics. Transp. Res. Part D Transp. Environ. 2008, 13, 479–482. [Google Scholar] [CrossRef]
  12. Ben-Chaim, M.; Shmerling, E.; Kuperman, A. Analytic Modeling of Vehicle Fuel Consumption. Energies 2013, 6, 117–127. [Google Scholar] [CrossRef]
  13. Zhou, M.; Jin, H.; Wang, W. A review of vehicle fuel consumption models to evaluate eco-driving and eco-routing. Transp. Res. Part D Transp. Environ. 2016, 49, 203–218. [Google Scholar] [CrossRef]
  14. Evans, L. Driver behavior effects on fuel consumption in urban driving. In Proceedings of the Human Factor Society—22nd Annual Meeting 1978, Detroit, MI, USA, 16–19 October 1978; pp. 437–442. [Google Scholar] [CrossRef]
  15. Treiber, M.; Kesting, A.; Thiemann, C. How Much does Traffic Congestion Increase Fuel Consumption and Emissions? Applying a Fuel Consumption Model to the NGSIM Trajectory. In Proceedings of the 87th Annual Meeting of the Transportation Research Board, Washington, DC, USA, 13–17 January 2008; pp. 1–17. [Google Scholar]
  16. Pease, G.; Limebeer, D.; Fussey, P. Fuel Consumption Minimization, with Emissions Constraints, for Diesel Powered Cars. IEEE Trans. Control. Syst. Technol. 2020, 28, 1243–1257. [Google Scholar] [CrossRef]
  17. Amer, A.; Abdalla, A.; Noraziah, A.; Fauzi, A.A.C. Prediction of Vehicle Fuel Consumption Model Based on Artificial Neural Network. In Proceedings of the Power and Energy Systems III, Bangkok, Thailand, 23–24 November 2013; pp. 3–6. [Google Scholar] [CrossRef]
  18. Tomasikova, M.; Sojcak, D.; Nieoczym, A.; Brumercik, F. Experimental Data in Vehicle Modeling. LOGI–Sci. J. Transp. Logist. 2017, 8, 82–87. [Google Scholar] [CrossRef] [Green Version]
  19. Wang, M.; Daamen, W.; Hoogendoorn, S.; van Arem, B. Estimating Acceleration, Fuel Consumption, and Emissions from Macroscopic Traffic Flow Data. Transp. Res. Rec. J. Transp. Res. Board 2011, 2260, 123–132. [Google Scholar] [CrossRef]
  20. Fontaras, G.; Zacharof, N.G.; Ciuffo, B. Fuel consumption and CO2 emissions from passenger cars in Europe Laboratory versus real-world emissions. Prog. Energy Combust. Sci. 2017, 60, 97–131. [Google Scholar] [CrossRef]
  21. Van Mierlo, J.; Maggetto, G.; Van De Burgwal, E.; Gense, R. Driving style and traffic measures-Influence on vehicle emissions and fuel consumption. Proc. Inst. Mech. Eng. Part D J. Automob. Eng. 2004, 218, 43–50. [Google Scholar] [CrossRef]
  22. Rakha, H.A.; Ding, Y. Impact of Stops on Vehicle Fuel Consumption and Emissions. J. Transp. Eng. 2003, 129, 23–32. [Google Scholar] [CrossRef]
  23. Zheng, F.; Li, J.; Van Zuylen, H.; Lu, C. Influence of driver characteristics on emissions and fuel consumption. In Proceedings of the Transportation Research Procedia, Amsterdam, The Netherlands, 4–6 September 2017; Volume 27, pp. 624–631. [Google Scholar] [CrossRef]
  24. Huang, Y.; Surawski, N.C.; Organ, B.; Zhou, J.L.; Tang, O.H.H.; Chan, E.F.C. Fuel consumption and emissions performance under real driving: Comparison between hybrid and conventional vehicles. Sci. Total Environ. 2019, 659, 275–282. [Google Scholar] [CrossRef]
  25. Wang, Y.; Hao, C.; Ge, Y.; Hao, L.; Tan, J.; Wang, X.; Zhang, P.; Wang, Y.; Tian, W.; Lin, Z.; et al. Fuel consumption and emission performance from light-duty conventional/hybrid-electric vehicles over different cycles and real driving tests. Fuel 2020, 278, 118340. [Google Scholar] [CrossRef]
  26. Slavin, V.; Shuba, Y.; Caban, J.; Matijosius, J.; Rimkus, A.; Korpach, A.; Gutarevych, S. The Performance of a Car with Various Engine Power Systems—Part I. LOGI—Sci. J. Transp. Logist. 2022, 13, 130–140. [Google Scholar] [CrossRef]
  27. Jurkovic, M.; Kalina, T.; Skrucany, T.; Gorzelańczyk, P.; Ľupták, V. Environmental Impacts of Introducing LNG as Alternative Fuel for Urban Buses—Case Study in Slovakia. Promet-Traffic Transp. 2020, 32, 837–847. [Google Scholar] [CrossRef]
  28. Goodwin, P.; Dargay, J.; Hanly, M. Elasticies of Road Traffic and Fuel Consumption with Respect to Price and Income: A Review. Transp. Rev. 2004, 24, 275–292. [Google Scholar] [CrossRef]
  29. Sarkan, B.; Holesa, L.; Caban, J. Measurement of Fuel Consumption of a Road Motor Vehicle by Outdoor Driving Testing. Adv. Sci. Technol. Res. J. 2013, 7, 70–74. [Google Scholar] [CrossRef]
  30. Kuranc, A.; Caban, J.; Šarkan, B.; Dudziak, A.; Stoma, M. Emission of selected exhaust gas components and fuel consumption in different driving cycles. Communic.–Sci. Lett. Univ. Žil. 2021, 23, B265–B277. [Google Scholar] [CrossRef]
  31. Gajek, A.; Pieniążek, W.; Janczur, R.; Wolak, S. Verification of Sensors for Yaw Rate and Lateral Acceleration in Car ESP System. Arch. Automot. Eng. Arch. Motoryz. 2020, 88, 61–67. [Google Scholar] [CrossRef]
  32. Tucki, K.; Orynycz, O.; Wasiak, A.; Świć, A.; Mruk, R.; Botwińska, K. Estimation of carbon dioxide emissions from a diesel engine powered by lignocellulose derived fuel for better management of fuel production. Energies 2020, 13, 561. [Google Scholar] [CrossRef]
  33. Pukalskas, S.; Kriaučiūnas, D.; Rimkus, A.; Przybyła, G.; Droździel, P.; Barta, D. Effect of hydrogen addition on the energetic and ecologic parameters of an SI engine fueled by biogas. Appl. Sci. 2021, 11, 742. [Google Scholar] [CrossRef]
  34. Zainuri, F.; Sumarsono, D.A.; Adhitya, M.; Siregar, R.; Prasetya, S.; Heryana, G.; Nazaruddine; Susanto, I.; Subarkah, R.; Ihsanudin. Analysis and optimization of electric vehicle conversion performance. J. Mech. Eng. Res. Dev. 2021, 44, 128–137. [Google Scholar]
  35. Warianek, M.G.; Lejda, K. The Environmental Safety of the Fiat 0.9 TwinAir Compressed Natural Gas Engine. Arch. Automot. Eng. Arch. Motoryz. 2020, 88, 47–60. [Google Scholar] [CrossRef]
  36. Pateraki, S.; Manousakas, M.; Bairachtari, K.; Kantarelou, V.; Eleftheriadis, K.; Vasilakos, C.; Assimakopoulos, V.D.; Maggos, T. The traffic signature on the vertical PM profile: Environmental and health risks within an urban roadside environment. Sci. Total Environ. 2019, 646, 448–459. [Google Scholar] [CrossRef] [PubMed]
  37. Ondruš, J.; Vrábel, J.; Kolla, E. The influence of the vehicle weight on the selected vehicle braking characteristics. In Proceedings of the 22nd International Scientific on Conference Transport Means 2018, Trakai, Lithuania, 3–5 October 2018; pp. 384–390. [Google Scholar]
Figure 1. The laboratory tested vehicle, a Kia Ceed. Source: author.
Technologies 10 00128 g001
Figure 2. Comparison of speeds when driving on a flat surface and when driving downhill. Source: author.
Technologies 10 00128 g002
Figure 3. Overview of cumulative fuel consumption depending on the distance traveled. Source: author.
Technologies 10 00128 g003
Figure 4. Composition of exhaust gas emissions according to Table 3 and Table 4. Source: author.
Technologies 10 00128 g004
Figure 5. Elevated roundabout scenario on road II/156 in České Budějovice. Source: author.
Technologies 10 00128 g005
Table 1. The technical data of the laboratory tested vehicle. Source: [30].
Commercial Name of VehicleKia CeedEngine CodeG4FC
Engine displacement1591 cm3Length4265 mm
FuelgasolineWidth1790 mm
Number of cylinders4Height1480 mm
Max. power90 k/6200 rpmAllowed weight1163 kg
Max. torque154 Nm/4200 rpmTotal weight1710 kg
Max. speed192 km/h
Table 2. Technical data of MAHA MGT 5. Source: [30].
Measured GasesCOCO2HCO2NOx
Measuring ranges0–15.00 Vol %0–20.00 Vol %0–2000 ppm Vol (Hexan)
0–4000 ppm Vol (Propan)
0–25.00 Vol %0–5000 ppm Vol
The accuracy of measuring0.06 Vol %0.5 Vol %12 ppm0.1 Vol %32–120 ppm Vol
Measurement principleinfraredinfraredinfraredelectrochemicalelectrochemical
Resolution of values0.0010.010.10.011
Measuring range deviationless than ± 0.6% of the final value of the measuring range
Flowmax. 3.5 L/min · min 1.5 L/min
Gas outletapprox. 2.5 L/min
Condensate drainautomatically, continuously · approx. 1 L/min
Working pressure750–1100 mbar
Pressure fluctuationsmax. error 0.2% with fluctuations of 5 kPa
Table 3. Cumulative consumption during individual starts of the vehicle. Source: author.
FLAT SURFACEDOWNHILL
Cumulative Fuel Consumption [mL]Cumulative Fuel Consumption [mL]
18.046.15
28.816.18
38.645.14
48.076.27
58.116.18
68.036.16
79.296.16
88.615.50
98.305.75
108.206.27
118.194.73
128.196.47
139.014.28
148.535.50
159.197.56
168.905.80
178.596.10
188.926.08
198.505.86
208.805.84
Average fuel consumption8.555.90
Table 4. Exhaust gas composition for five selected accelerations—flat surface. Source: author.
FLAT SURFACE
MeasurementCO [g]CO2 [g]HC [g]NOx [g]
10.45771219.855800.0058020.061980
20.29325222.106950.0027770.034336
30.29964421.246360.0020420.026315
40.18693620.210600.0013040.018689
50.19992619.906950.0014750.019384
SUM1.437470103.3266600.0134000.160704
Table 5. Exhaust gas composition for five selected accelerations—downhill. Source: author.
DOWNHILL
MeasurementCO [g]CO2 [g]HC [g]NOx [g]
10.14001316.253750.0005500.012670
20.11227016.209510.0004550.008889
30.09787213.623570.0003960.009497
40.12411616.321710.0004520.009675
50.08967016.095510.0004340.010221
SUM0.56394178.5040500.0022870.050952
Publisher’s Note: MDPI stays neutral with regard to jurisdictional claims in published maps and institutional affiliations.

