1. Introduction
Manhole covers are important structural elements in transport infrastructure [
1]. The covers are usually circular or square plates that are located on pavements or roads to enable underground utility inspection and maintenance. Their main requirements are mechanical strength and durability to withstand the loads and impact of pedestrians and various vehicles. Traditionally, the covers have consisted of cast iron, although newer products are also produced with composite materials that enable additional functionality, e.g., the transmission of the monitoring data without the removal of the manhole cover [
2].
Kırbaş [
3] has proven that, due to many passes through the manhole at ride speeds of 40 km/h and above, and at depths of 7.5 cm and beyond, a potential health risk exists for the human body, so proper installation and maintenance are of crucial importance. Furthermore, Su et al. [
4] analysed manhole-cover defects and related accidents. The direct causes were identified to be manhole-cover damage, wrong use of the manhole covers, manhole covers slipping and flipping, the unevenness between manhole covers and roadside or the broken pavement around the manhole covers. The root causes listed the manhole covers management, manhole cover installation and surrounding road construction or material quality [
4]. A study by Hu et al. [
5] analysed the impact of different factors on the pavement damage [
5]. Influencing factors were road inclination, driving speed, damping and stiffness of tire, the height difference from the pavement, the manhole settlement, and the stiffness of the manhole cover. The highest-impact damage to the manhole cover was assigned to the inclination of the road, the driving speed, and the height difference. Moreover, Kwaśniewski [
6] presented the results of computer simulations of the interaction between the wheels and the concrete cover of a cable duct. The obtained results enabled the estimation of the maximal stress and the determination of the dynamic load coefficient, which then described the response of the structure due to dynamic effects. The simulations were performed for several cases at different static loads and different cover heights (inplane with the roadway, and 10 mm above and below the road surface). Simulations showed the case where the cover protruded above the road surface as the most critical. Recent studies on manhole covers included driving comfort evaluation for manhole covers and the pavement around manholes [
7], composite materials for manhole covers [
8], the automated detection of manhole covers with mobile laser scanning systems [
9], and the improvement of the geometry of manholes to withstand high loads [
10].
The available literature has not yet offered a comprehensive study of a conventional cast-iron manhole cover that would combine the detailed geometric properties of the product and typical load scenarios originating from the installation, operation, and maintenance procedures. This study, hence, fills this gap to assess the strength and durability of cast-iron manhole covers under realistic conditions. The focus was set on the influence of several factors and their interaction, which included geometric details, vehicle speed, installation height, the position of the load, and the inclusion of impurities during the installation of a cover or after a maintenance procedure.
2. Method
Implicit dynamic structural analysis using the structural finite element method in Abaqus 6.13-5 was used in the study to compare the response of a manhole cover subjected to typical load scenarios. The load originating from a tire driving across the cover was applied in time steps. The advantage of implicit analysis is the global balance of the load and the structural response, which is established in the model at each time increment [
11,
12]. Once the equilibrium had been established, the local finite element variables (e.g., stresses and strains) for each increment were calculated. The time increments in implicit analysis can, hence, be large, as the global balance is checked within each time increment. However, the computational time is longer as compared to that in explicit dynamic analysis, as an iterative procedure is required to reach the equilibrium.
Once the stress–strain response of the manhole cover had been simulated, the load cycles contributing to fatigue damage were determined. This is most commonly achieved by the rain-flow counting method, which extracts fatigue cycles from the simulated response history [
13,
14]. The result of this step is the rain-flow matrix of extracted cycles, which carries the information of the number of extracted cycles, and their amplitudes and mean stress levels at every finite element. This form of information is more compact and manageable than the original time history data series are.
The durability curve of the material [
15] was used next to determine the number of cycles to failure for each amplitude and mean stress level at every finite element. Furthermore, if a component or product is subjected to variable amplitude loads throughout the load history, the fatigue damage caused by the load application accumulates in the product. To consider this phenomenon, the Palmgren–Miner rule of linear damage accumulation is typically applied [
16,
17]. This rule assumes that a crack is initiated once fatigue damage accumulation represented by the sum of the cycle ratios
for each group of cycles at constant stress amplitude reaches critical damage (
D):
A critical value was used here for manhole-cover damage estimation.
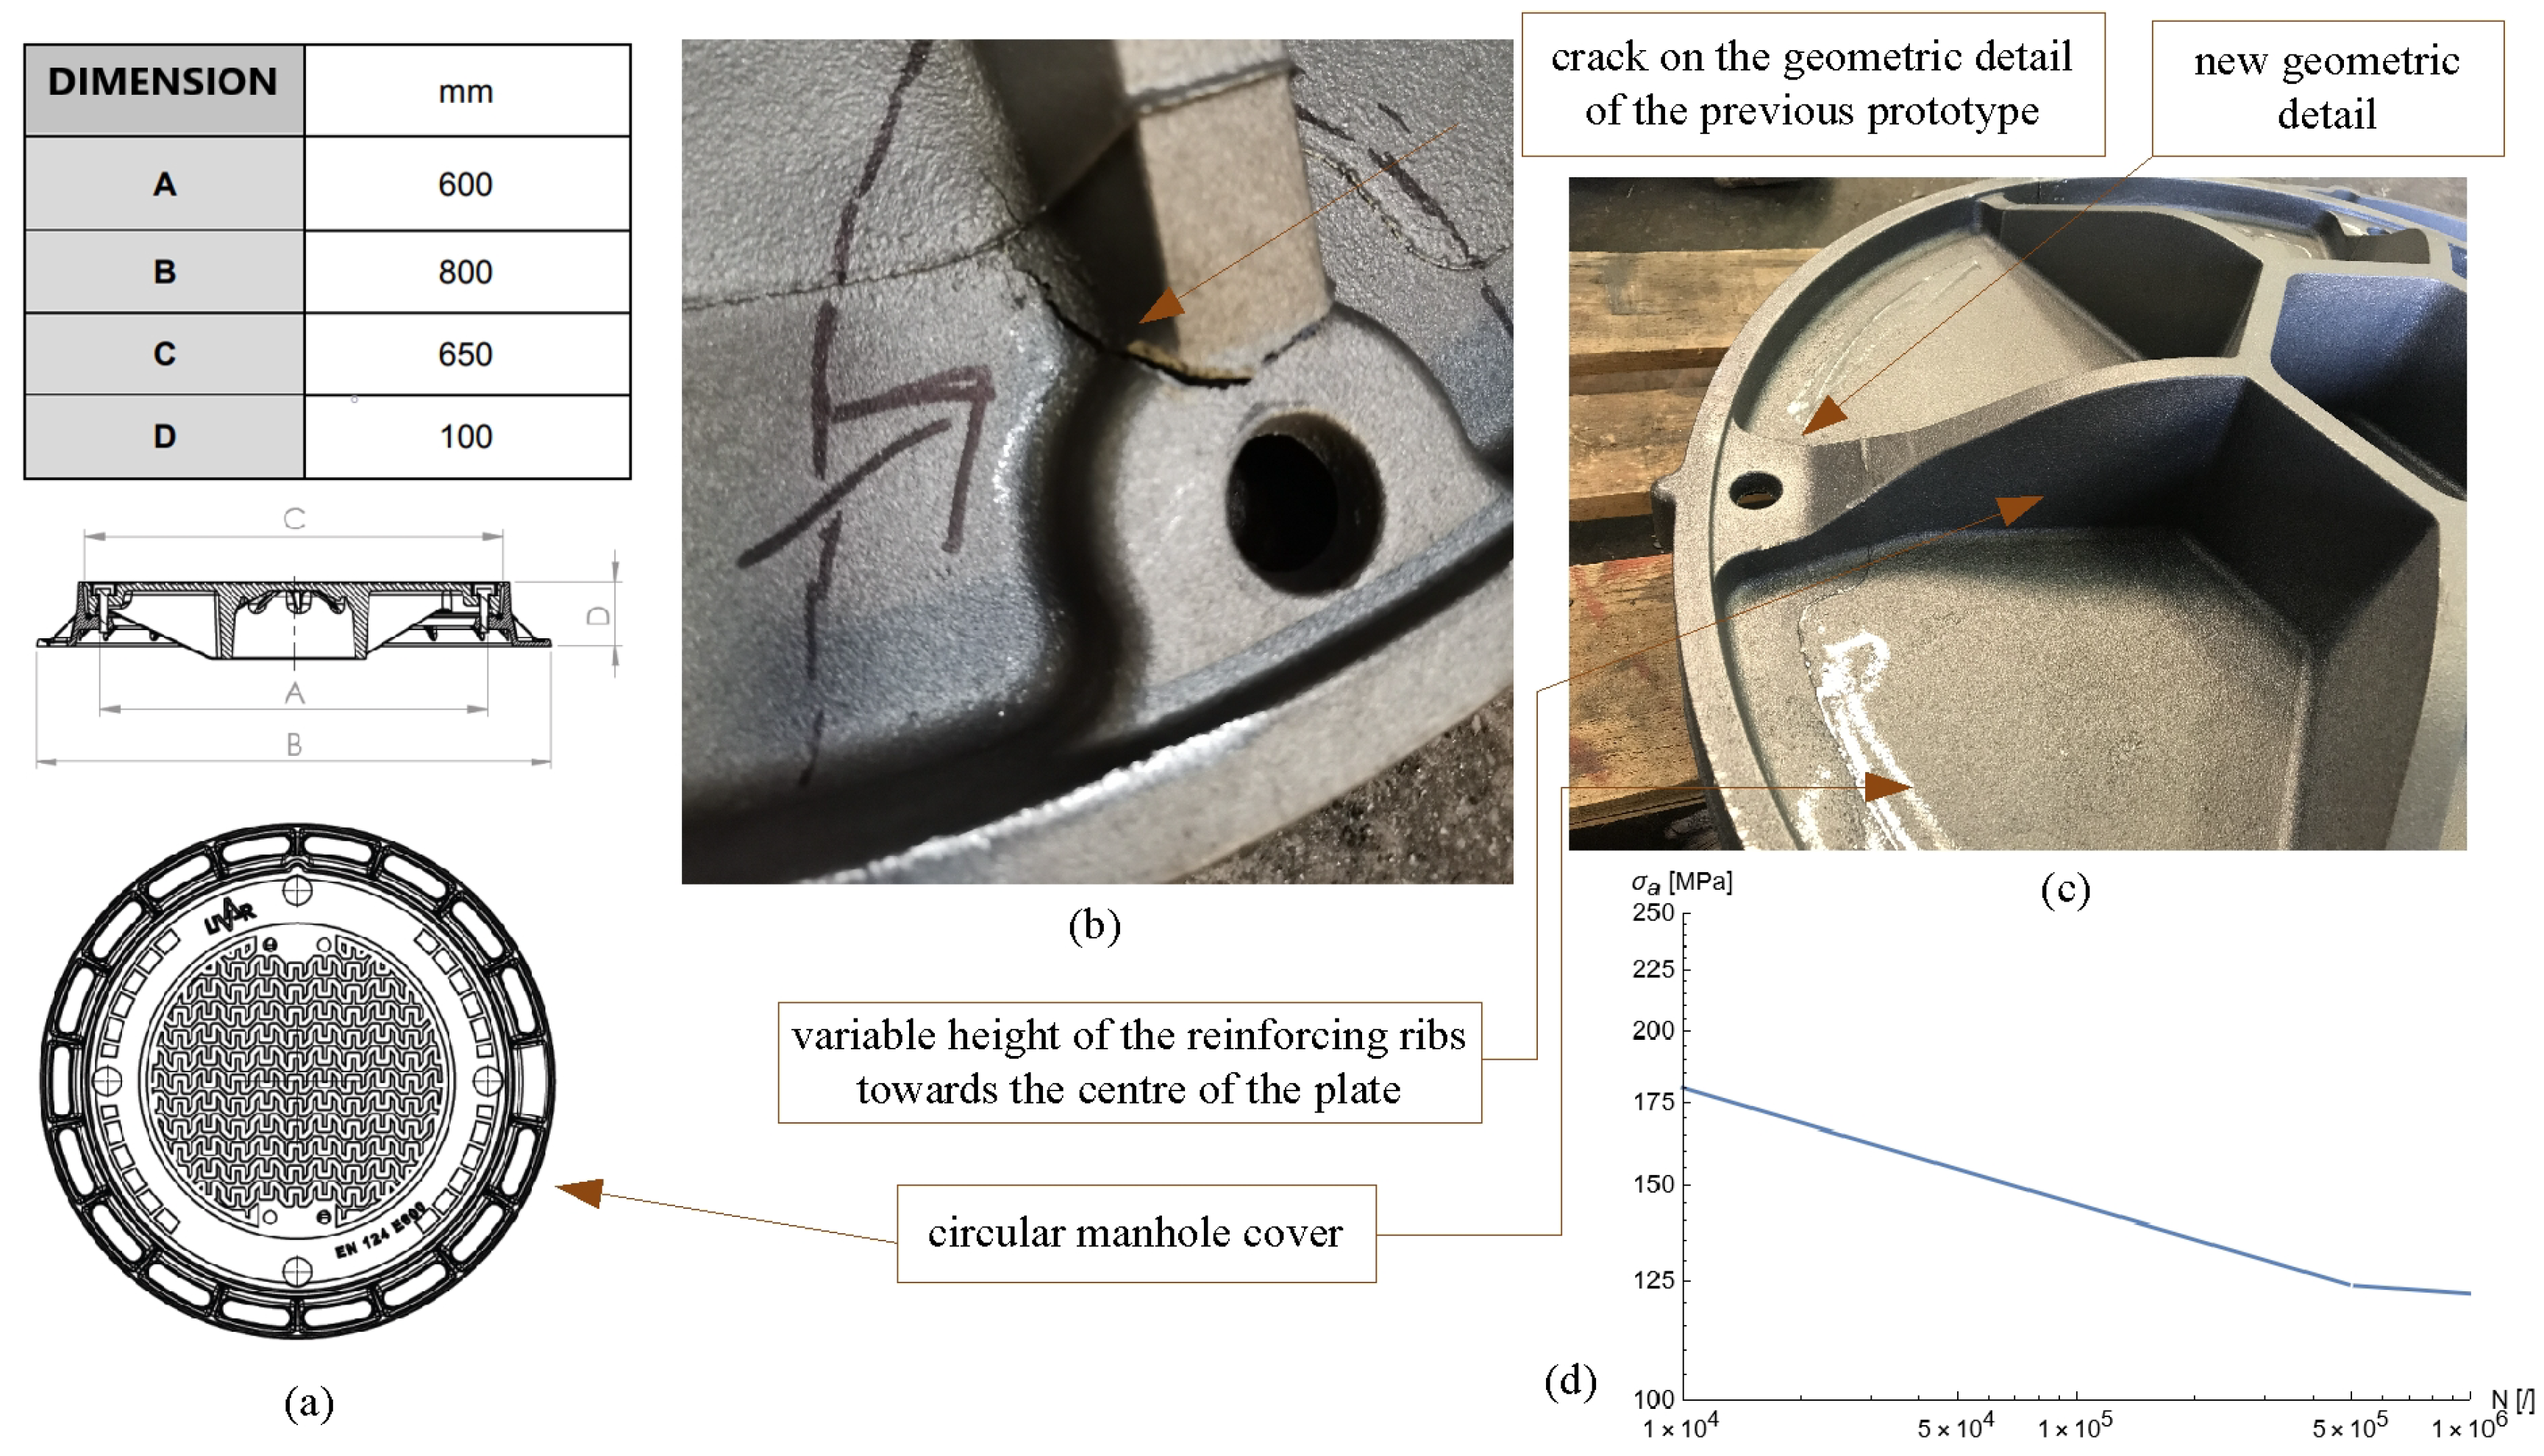
A circular manhole cover was used in this study. Its dimensions are given in
Figure 1a. The 3D model was designed and amended in Catia V5 R21. The circular plate was supported by reinforcing ribs that increased the stiffness of the top surface [
18]. The important geometric detail is the transition from the ribs to the surface, which can represent the initiation of the cover failure if it is not designed properly (
Figure 1b). A small radius with a narrow rib cross-section on the previous version of the manhole-cover prototype caused a crack on the bottom side of the product, which was then improved by a higher radius and a larger cross-section at that location. The improved geometry of the manhole cover is given in
Figure 1c, which also shows the variable height of the reinforcing ribs towards the centre of the plate that immensely increased the stiffness of the component.
The material used for the manhole cover in this study was ductile iron grade EN-GJS-500-7. The following mechanical properties were experimentally determined from standard uniaxial tensile specimens and considered in the simulations: elastic modulus
GPa, Poisson’s ratio
, tensile strength
MPa, yield stress
MPa, elongation at rupture
and density
7800
. An elastoplastic material model was utilised with the kinematic hardening of the manhole-cover material assuming that yielding at loading in the opposite direction started at stress
. Both values of yield stress differed by twice the initial value of the yield stress (
). The absolute value of the yield stress was, therefore, reduced when the load sign changed (according to the last achieved value of the yield stress). This phenomenon is called the Bauschinger effect [
20]. The durability curve of the ductile iron is given in
Figure 1d. The durability curve of the material was adapted from [
15], as cyclic tests of the material were not performed within this study. The fatigue limit at dynamic ratio
was 125
.
To simulate the operational response of the manhole cover, a 295/75 R22.5 truck tire was selected to provide realistic load scenarios in the simulations. The tire, with a radius of
mm, was modelled using shell elements with a complex multilayered structure. The geometric model was simplified into three layers with homogeneous isotropic material properties: tread and side rubber, reinforcement belts under the tread, and side carcass reinforcements. The material properties of the rubber matrix in the carcass and belt inserts were modelled on the basis of data from the study of Wang et al. [
21]. They are listed in
Table 1 and
Table 2.
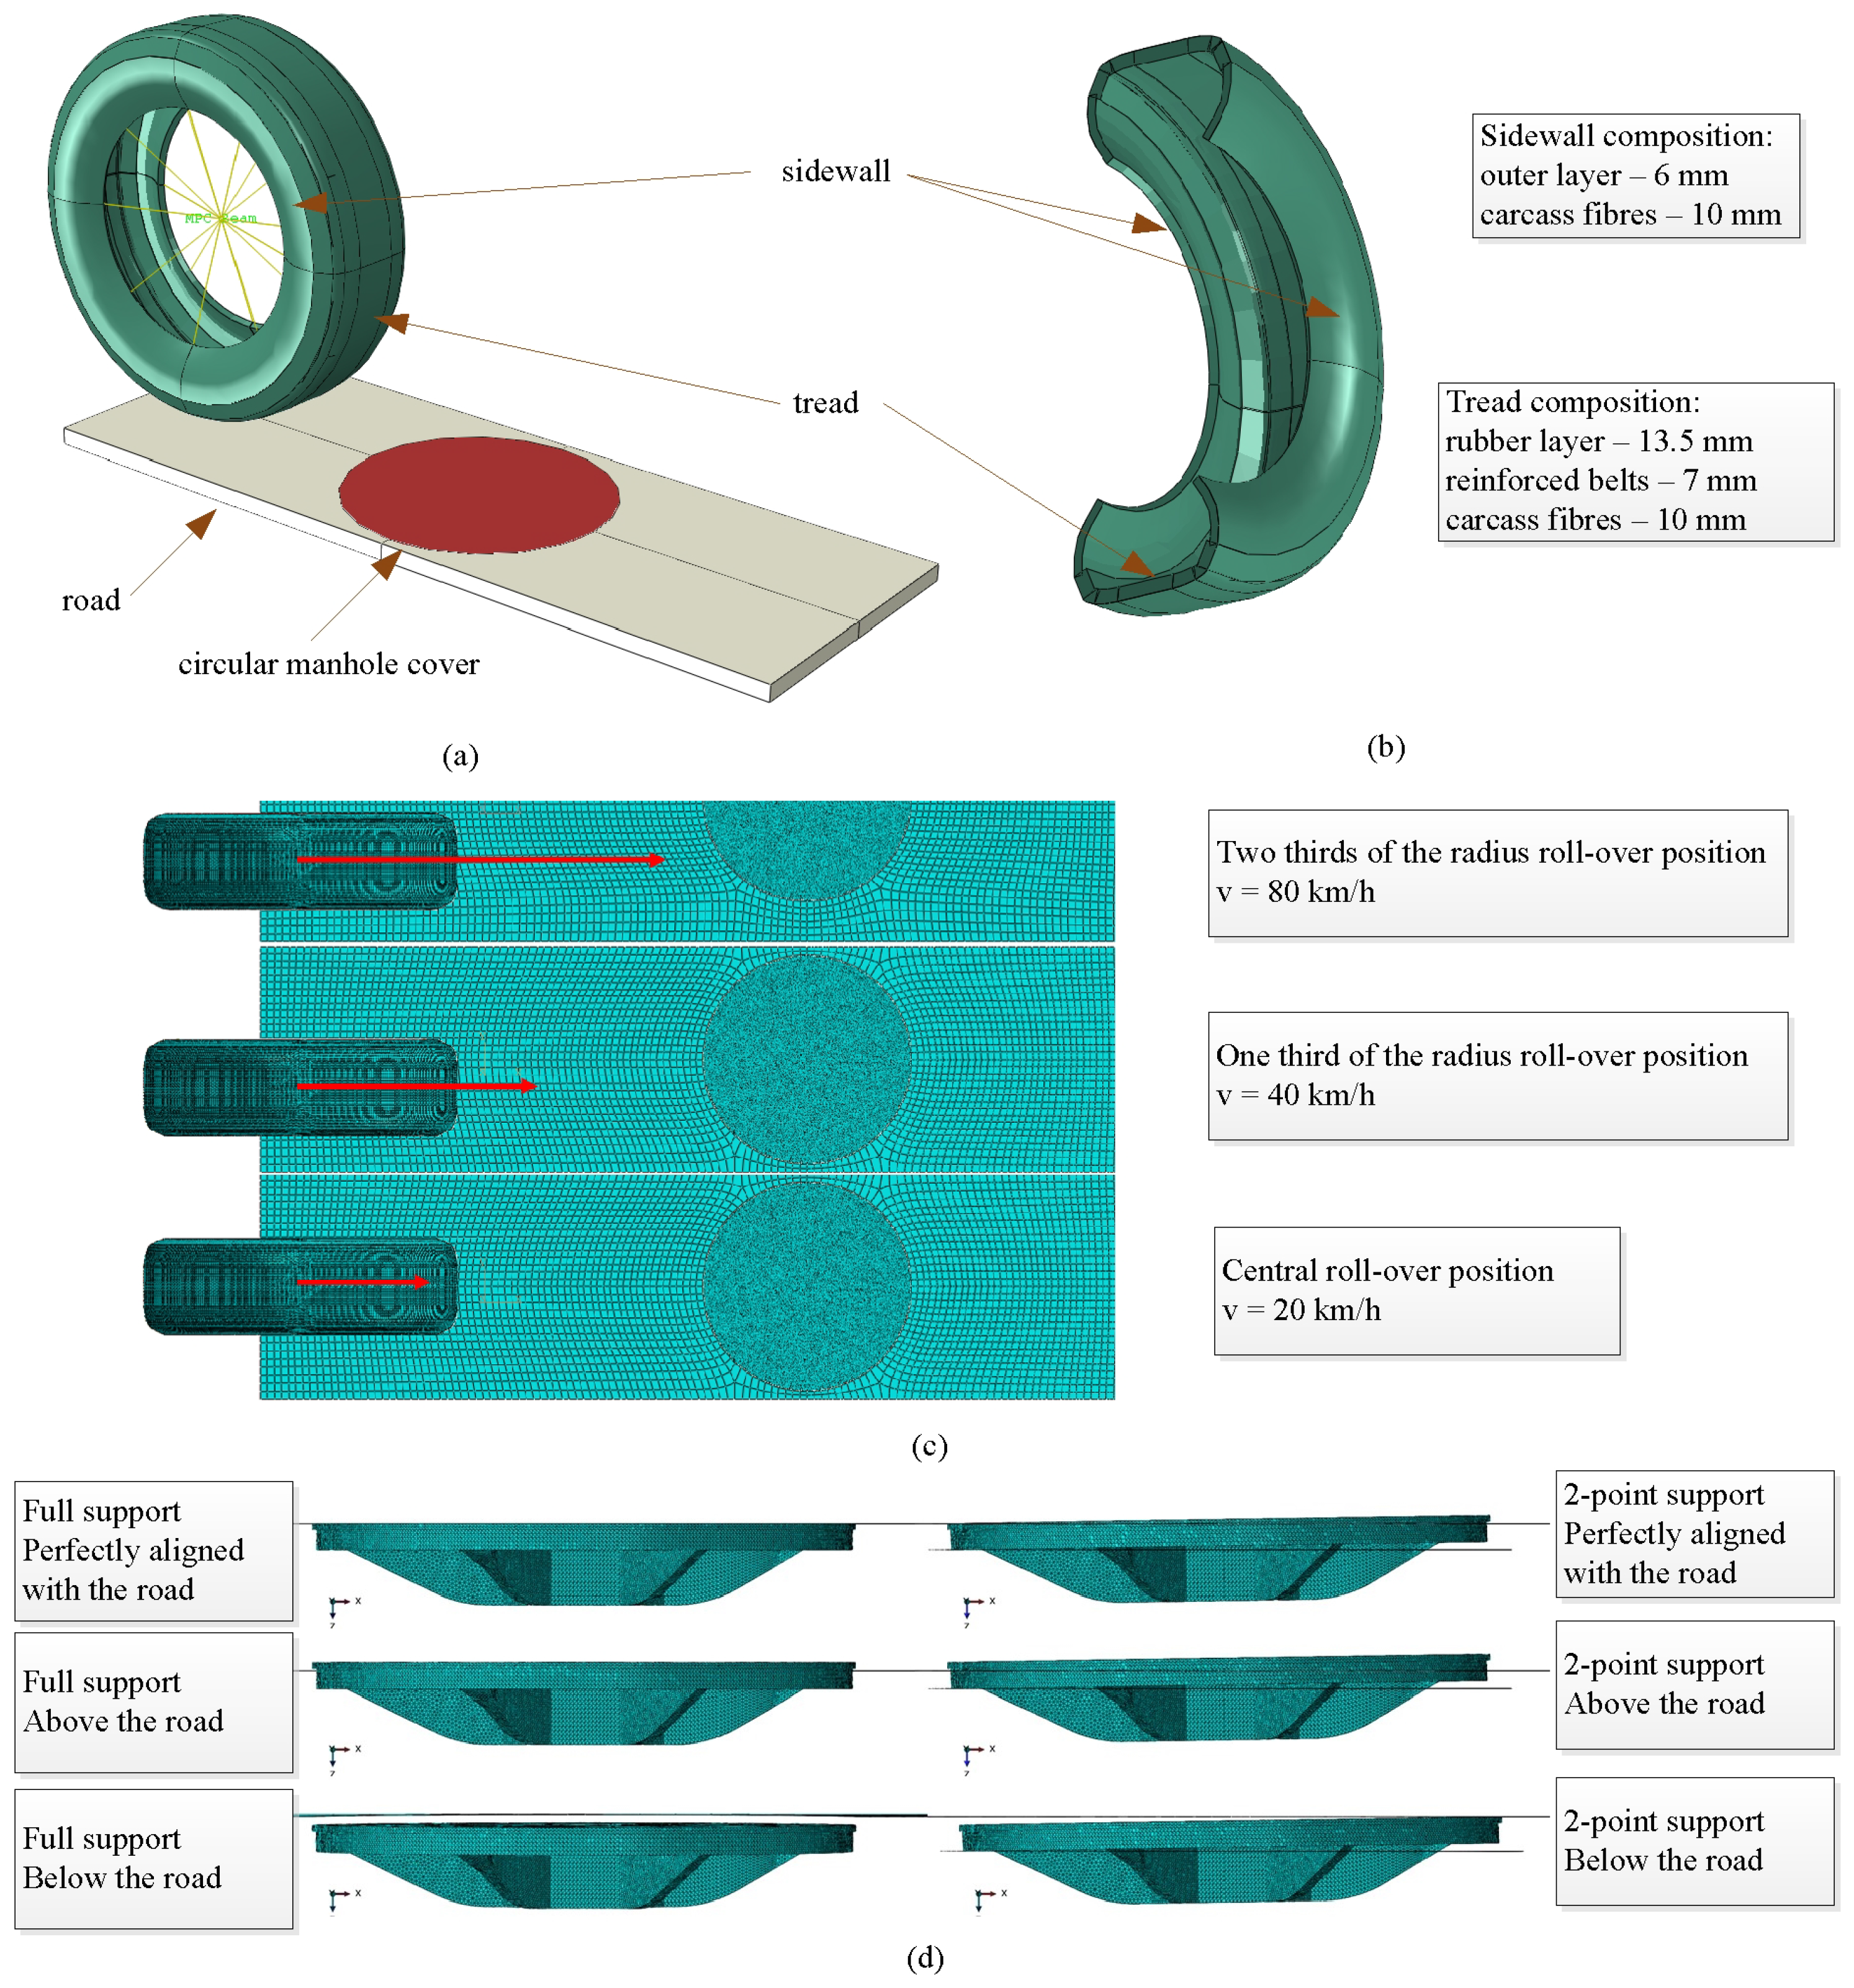
Figure 2a,b show the simulation setup and the cross-section of the tire. The numerical model of the tire consisted of two composite parts. The sidewall was composed of the carcass layer and the outer layer of the rubber, whereas the tread was composed of the carcass, the reinforcing fibres of the belts, and the upper tread rubber (
Figure 2b). A total of 40,700 nodes and 40,269 shell elements
were used to represent the numerical model of the tire.
The boundary conditions in the simulations reflected the operational load scenarios (
Figure 2a). The road was assumed to be a rigid nondeformable base; hence, it was bounded by displacements in all three directions of the global coordinate system. A total of 6780 nodes and 2150 shell elements
were used to represent the numerical model of the road. The load scenarios were then applied in three steps. In the first step, the tire was pumped with internal pressure; in the second step, the weight that represented the load of the truck was applied; in the third step, the speed of the tire was applied, and the tire was rolled over the manhole cover. The numerical model of the manhole cover consisted of 33,692 nodes and 66,429 solid C3D4 elements. In all cases, a pressure of 7.58 bar was first applied to the inner surface of the tire, which was the prescribed pressure for the used tire. The edge of the tire was connected to the reference point in the centre of the tire using multipurpose constraints to simulate wheel rims (
Figure 2a). The load application was determined from a truck with a load capacity of 10 tons that was assumed to drive over the manhole cover. If the weight had then been evenly distributed to four wheels, one tire would have been loaded through the reference point with 25 kN in the vertical direction to the road surface. This load was, hence, used in the simulations.
Furthermore, the load scenarios were separated by three tire speeds at three tire roll-over positions, three installation heights of the manhole cover, and two cover support conditions. This created a total of 54 typical load scenarios, which enabled the study of the influence of four load factors and their interaction. The tire speeds were 20, 40, and 80 km/h. These represented typical truck speeds for the type of cover used in the study. The velocities were applied at the reference point with translation in the parallel direction to the road surface and angular velocity around the axle of the wheel (
Figure 2c). The tire roll-over positions included the load of the tire across the centre of the cover, the offset from the centre by a third of the cover radius, and the offset from the centre by two-thirds of the cover radius (
Figure 2c). Three heights of the manhole cover resembled typical positions after installation works and the subsidence of the ground around the manhole cover. The first height stood for a properly installed cover that was parallel to the road surface. The second height represented a subsidence of the road surface around the cover, so the cover was bulged 10 mm higher than the road surface (+10 mm). The third height illustrated a fault during installation works where the cover is sunken 10 mm lower than the road surface (−10 mm), (
Figure 2c). Lastly, the support conditions reflected the position of the cover after typical maintenance work. The first scenario stood for a cover resting on an entire support surface, which happens after proper maintenance work (
Figure 2d). The second scenario served for the simulation of either impurities being caught between the cover and the support surface or an unevenly worn rubber inserted between the cover and the support surface, which is frequent after maintenance work. Both events cause a slope of the mounted cover and provide physical contact with the ground in only two points. The latter scenario was simulated with a cover angle of
and contact in two points (
Figure 2d).
Upon the completion of the simulations, two critical locations on the manhole cover were chosen on the basis of the accumulated fatigue damage criterion. The influential factors were evaluated with analysis of variance, which analysed the stresses at critical locations [
22].
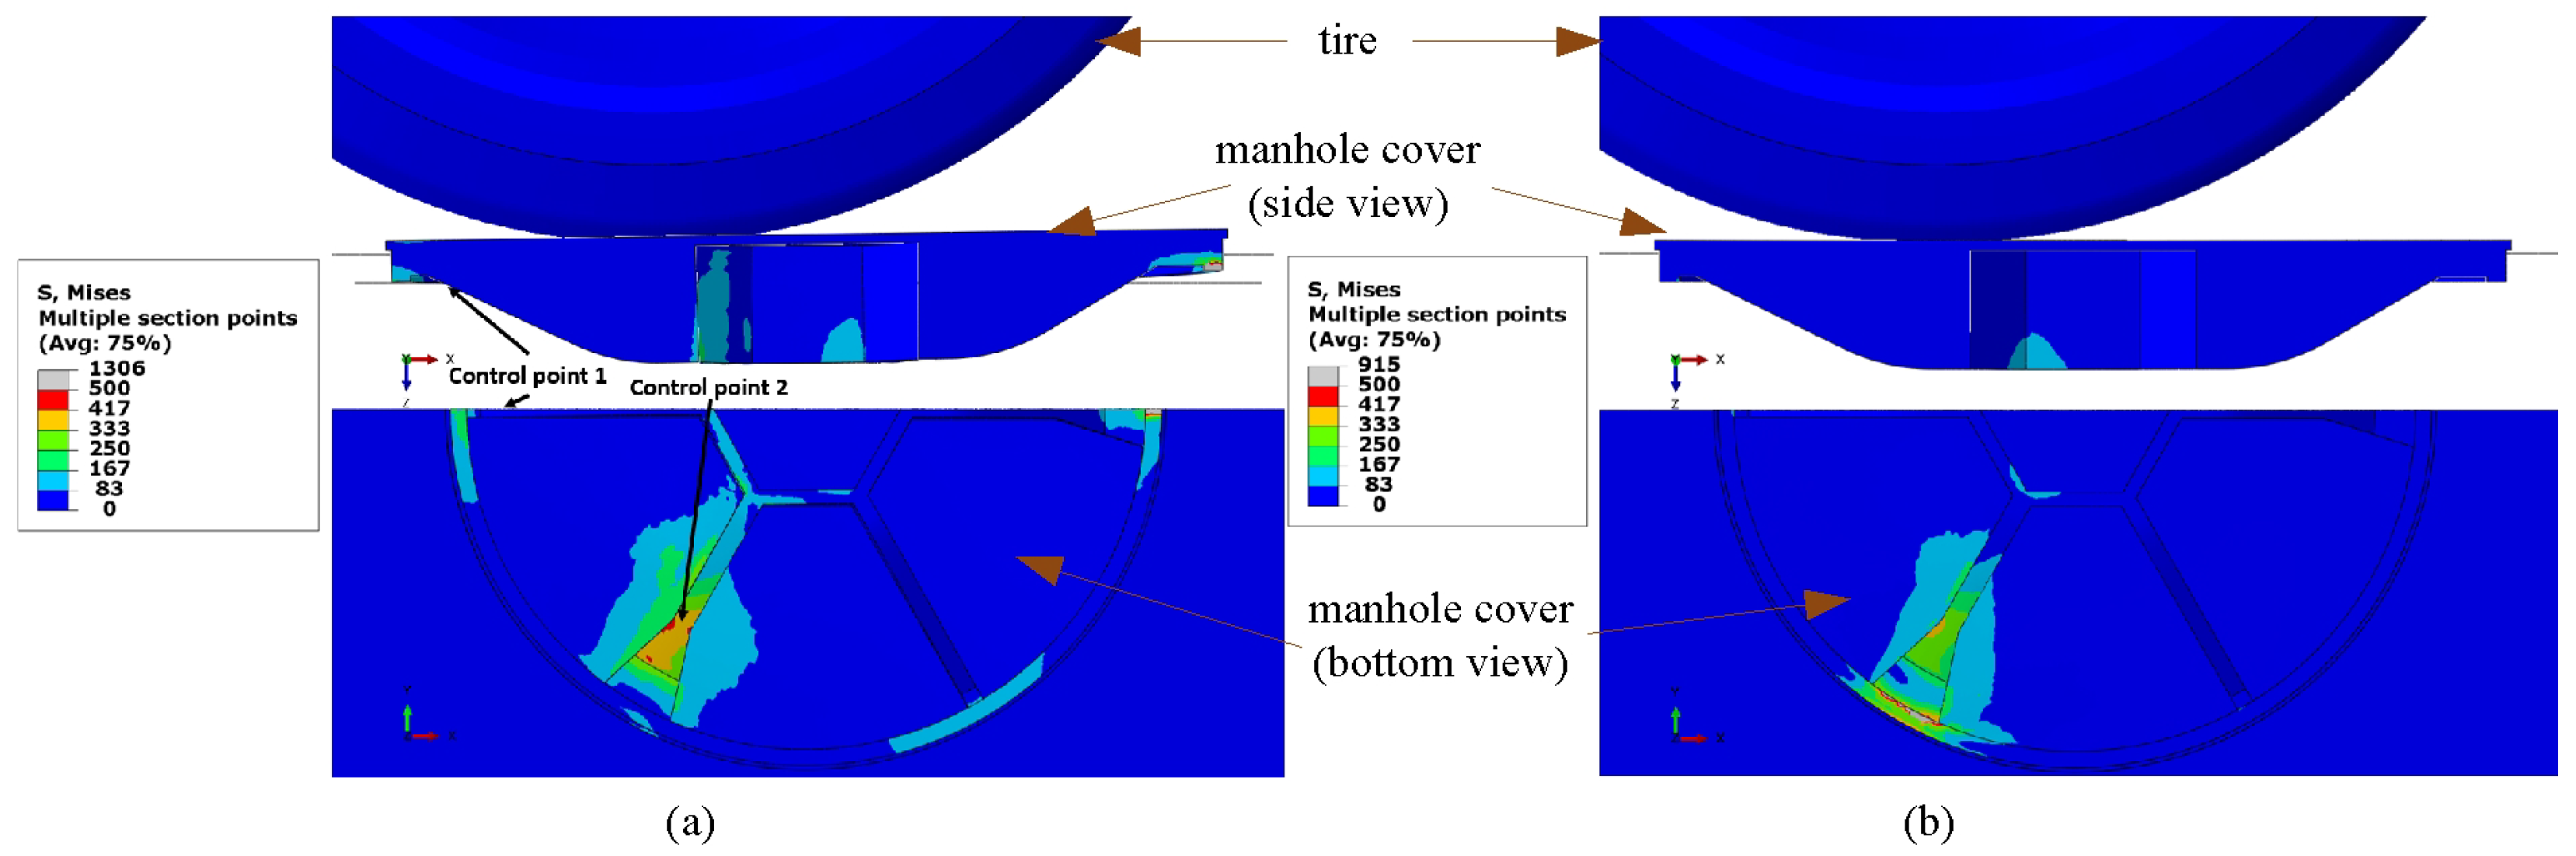
In this study, 54 scenarios with different boundary conditions were analysed (
Table 3). Two critical locations on the manhole cover are marked in
Figure 3. They were determined on the basis of the highest average accumulated damage from all the load scenarios. The first critical location rested at the beginning of the reinforcing rib in the centreline of the cover, whereas the second critical location lay at the same geometric detail where a crack had been observed on the previous prototype (
Figure 1b). During the process of identification of the critical locations, the elastic material properties of the manhole cover were used, as this assumption considerably shortened the computational time of the simulations.
3. Results and Discussion
From the results in
Figure 3 and
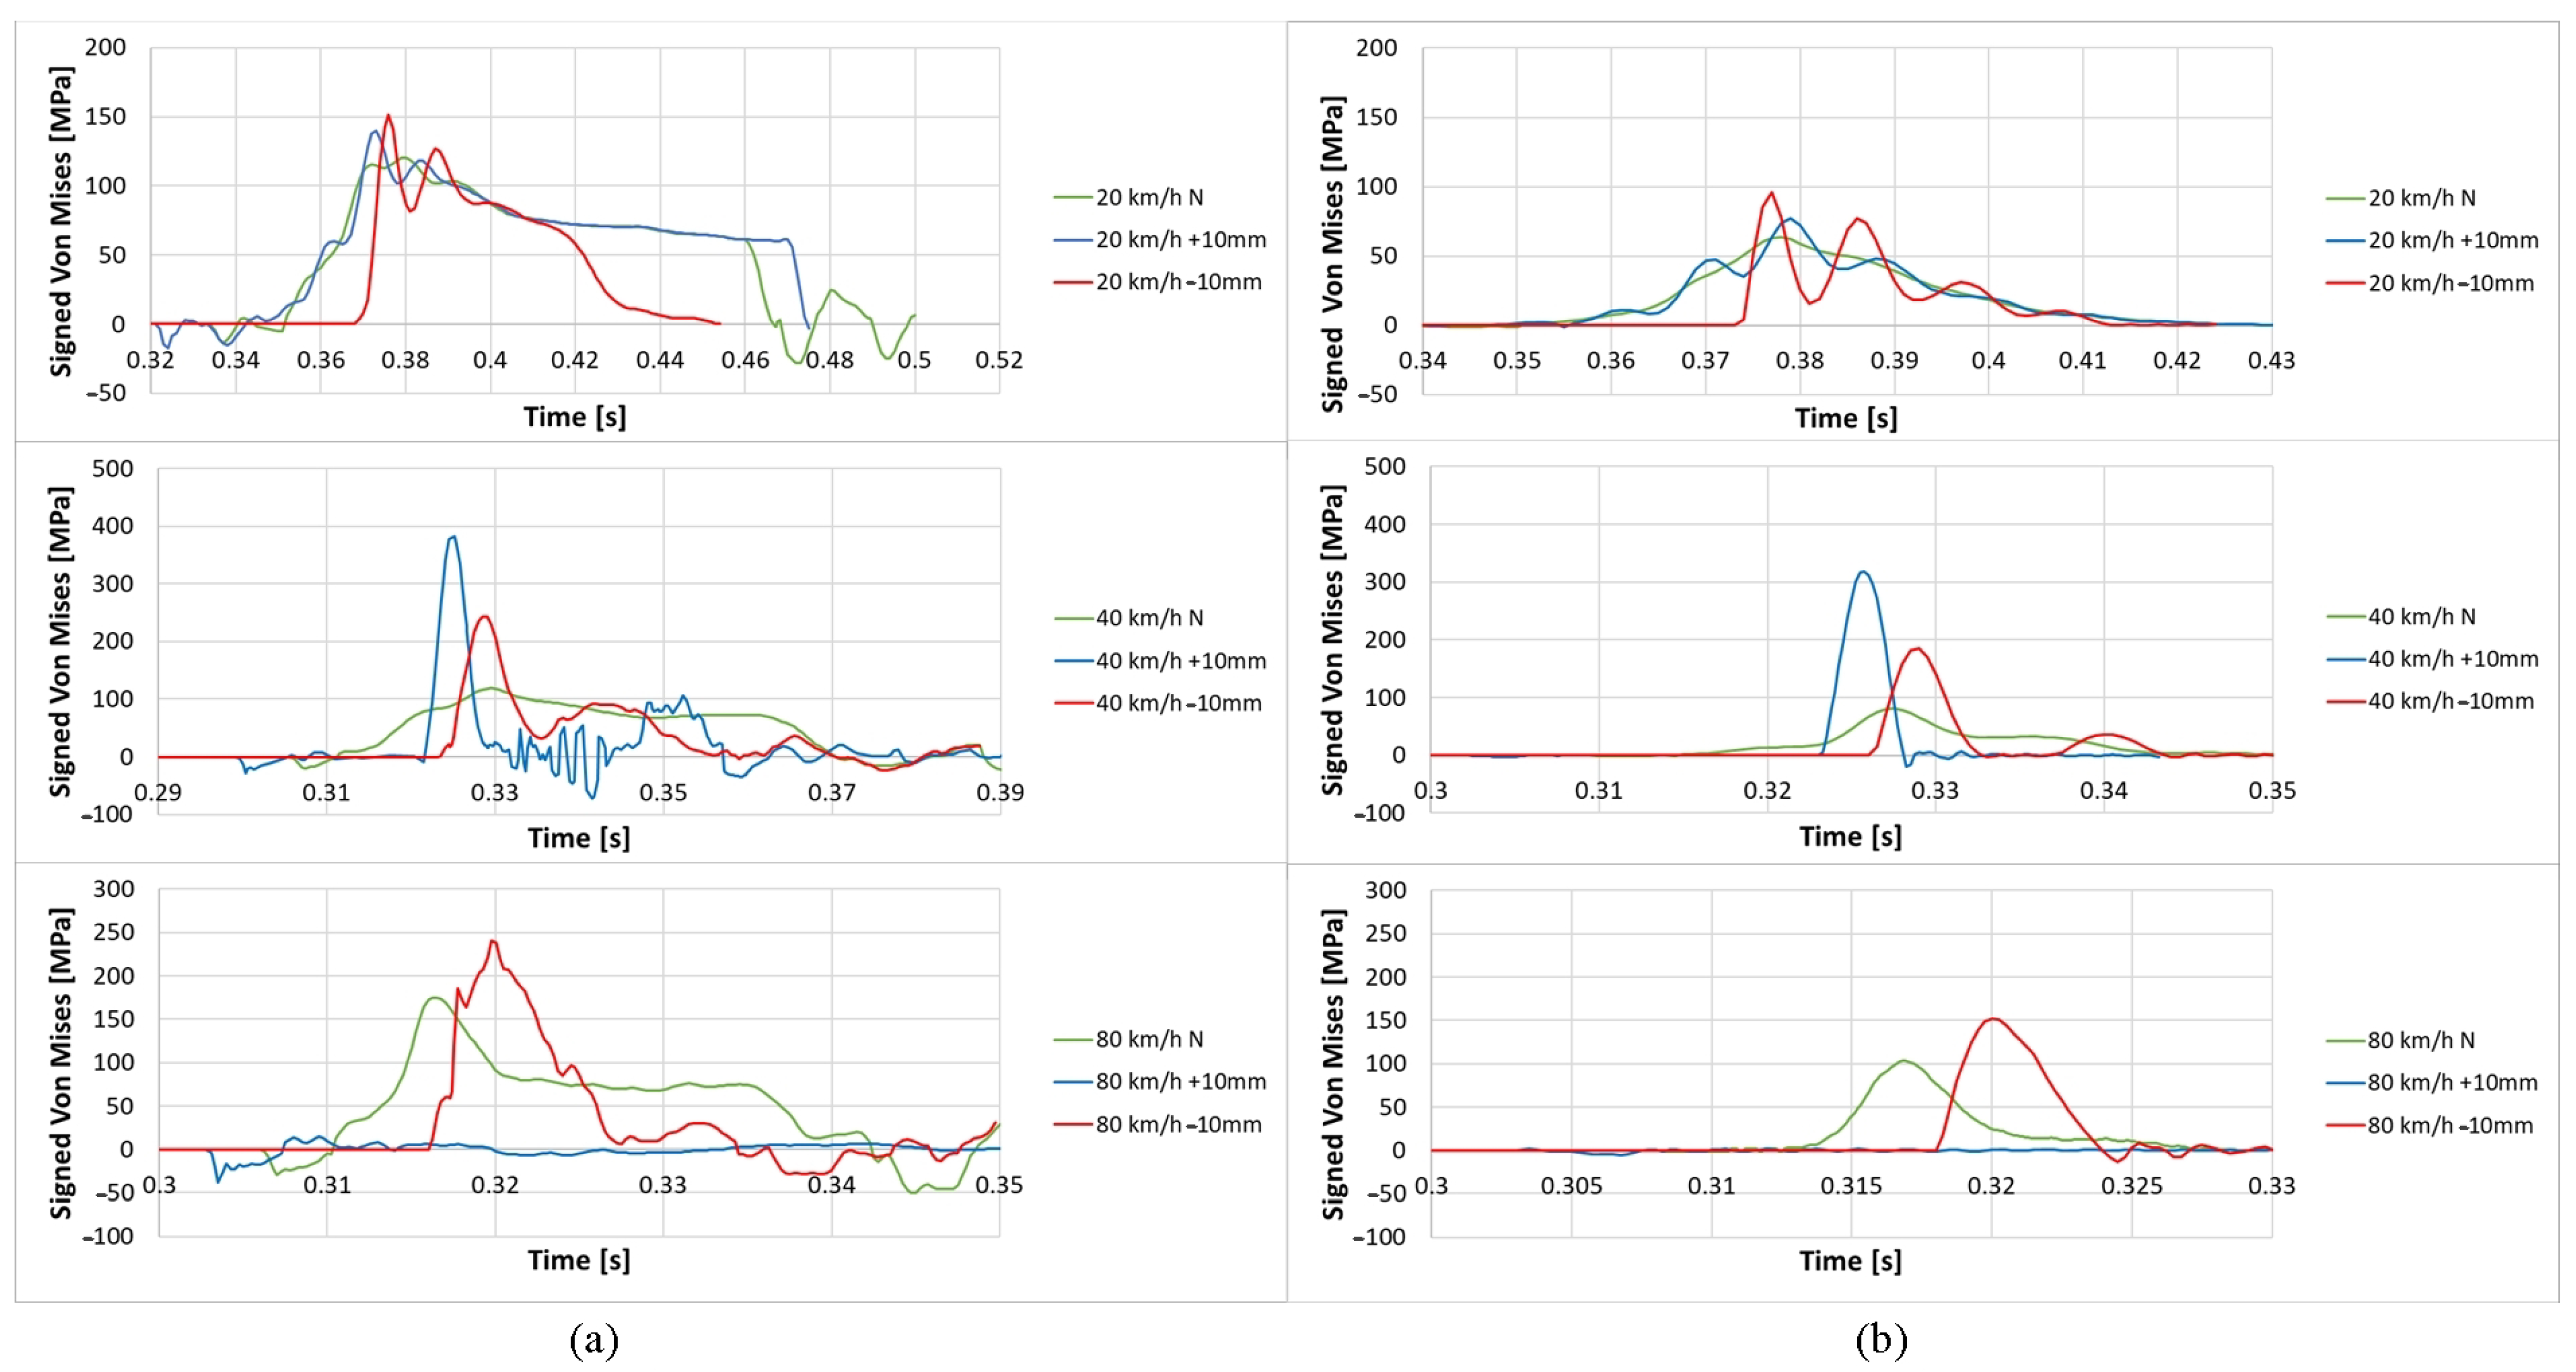
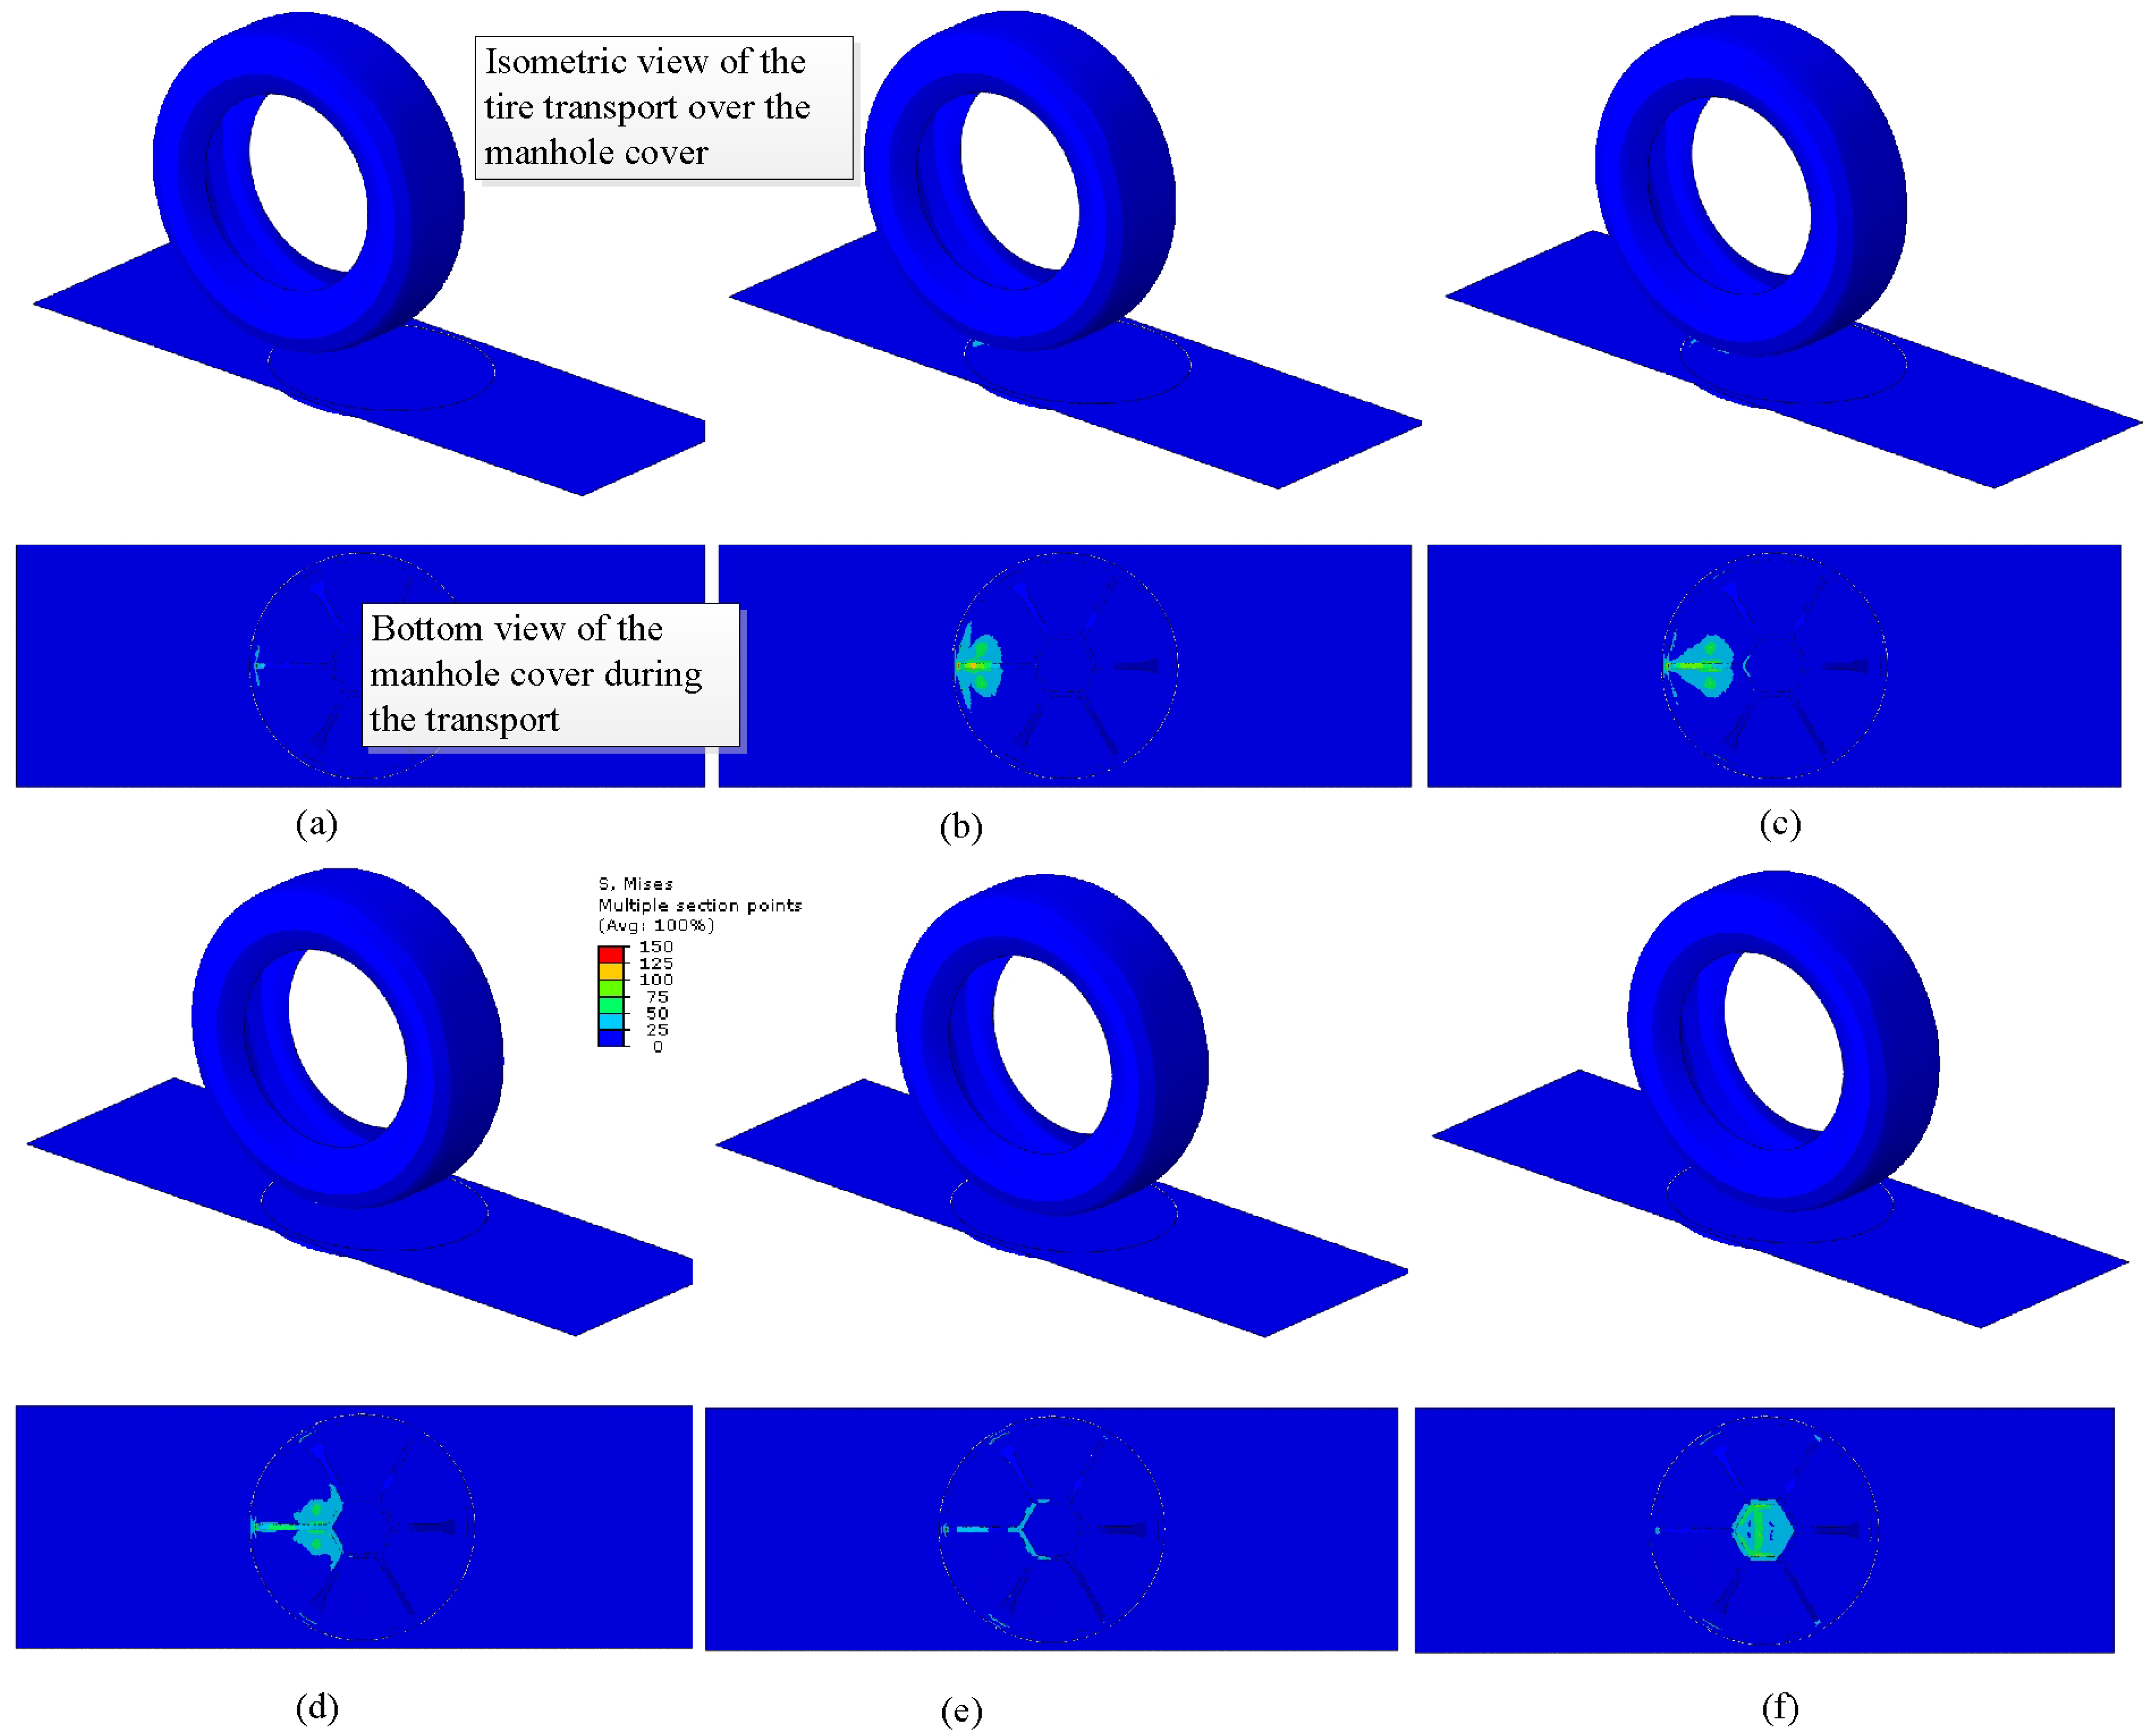
Figure 4, it can be concluded that, for each location on the cover, there was a maximal speed to which the load increased. The position of the cover perfectly aligned with the road was always subjected to modest load fluctuations (symbol N in
Figure 4). On the other hand, when the cover was bulged above the surface, the highest loads were observed as compared to the other two cases. Nevertheless, a separation of the tire from the road and cover oscillation can appear at higher speeds. At 80 km/h, the tire separated from the bulge cover, resulting in almost no load on the cover.
By rolling the tire over the cover away from the centreline, the loads at the first critical location were reduced, but increased at the second critical location. When the tire rolled over the manhole cover at two-thirds of the radius, the stresses at the first critical location became negligibly low. On the other hand, the initial contact between the tire and the cover in the case of a bulged installation and speed of 40 km/h could reach the yield strength of the material when the cover was fully supported or even exceed it in the case of a two-point support (middle diagrams in
Figure 4). The load always decreased as the tire moved farther away from the critical location, although oscillations of the cover introduced additional loads nonetheless (
Figure 5).
The bold-face results in
Table 3 indicate critical-load scenarios for Critical Location 2, and the normal-face results mark noncritical-load combinations for the observed location. In the majority of scenarios, where the cover rested on the entire support surface, the fatigue limit of the cast iron was not exceeded. Adversely, the most critical scenarios involved a bulged cover supported at two points and a travel speed of 40 km/h rolling over two-thirds of the cover radius (Position 3 in
Table 3). According to the material data used in the simulation, the cover would only withstand 82 such repetitions at Critical Location 2. In the case of a sunken cover and the other conditions being the same, the durability of the cover would increase to 14,200 cycles. Similarly, in the case of a fully supported bulged cover, a crack would initiate at Critical Location 2 after 821 cycles, whereas this would happen after 368,000 repetitions in the case of a sunken cover. Rubber, which is usually placed between the cover and the support surface to additionally dampen vibrations, was not included in the simulations. The reason for this decision was the fact that damaged roads and improper cover installation typically damage the rubber rapidly after installation or maintenance work, so its function quickly ceases. Analysis of variance shows that all the analysed factors had statistically significant influence on the durability of the manhole cover. The highest influence was due to the installation height, followed by the roll-over position before load speed for either full or partial support.


