Article

Comparison of the Predictive Performance of Medical Coding Diagnosis Classification Systems

College of Health Professions, Health Administration Division, Central Michigan University; Mount Pleasant, MI 48858, USA
*
Author to whom correspondence should be addressed.
Technologies 2022, 10(6), 122; https://doi.org/10.3390/technologies10060122
Submission received: 8 October 2022 / Revised: 15 November 2022 / Accepted: 23 November 2022 / Published: 28 November 2022

Abstract

:
Health analytics frequently involve tasks to predict outcomes of care. A foundational predictor of clinical outcomes is the medical diagnosis (Dx). The most used expression of medical Dx is the International Classification of Diseases (ICD-10-CM). Since ICD-10-CM includes >70,000 codes, it is computationally expensive and slow to train models with. Alternative lower-dimensionality alternatives include clinical classification software (CCS) and diagnosis-related groups (MS-DRGs). This study compared the predictive power of these alternatives against ICD-10-CM for two outcomes of hospital care: inpatient mortality and length of stay (LOS). Naïve Bayes (NB) and Random Forests models were created for each Dx system to examine their predictive performance for inpatient mortality, and Multiple Linear Regression models for the continuous LOS variable. The MS-DRGs performed highest for both outcomes, even outperforming ICD-10-CM. The admitting ICD-10-CM codes were, surprisingly, not underperformed by the primary ICD-10-CM Dxs. The CCS system, although having a much lower dimensionality than ICD-10-CM, has only slightly lower performance while the refined version of CCS only slightly outperformed the old CCS. Random Forests outperformed NB for MS-DRG, and ICD-10-CM, by a large margin. Results can provide insights to understand the compromise from using lower-dimensionality representations in clinical outcome studies.

1. Introduction

Clinical analytics can contribute to a better understanding of care and of the clinical parameters that contribute to negative hospital outcomes, such as mortality, hospital acquired infections, post-surgical complications, and excess length of stay (LOS) [1]. To predict these outcome measures, researchers commonly analyze hospital characteristics, along with clinical and socio-demographic patient attributes. While sociodemographic characteristics of patients, such as age, sex, or availability of insurance, are easily retrievable from hospital records, clinical factors reflect variety of diseases and conditions. Medical diagnoses (Dx) are used in data analysis projects either as target variables or as predictors. There is a lot of research around developing data-driven recommender systems which can assist clinical decision makers establish the diagnosis [2,3]. There is also plentiful research where Dx codes are used as predictors in risk estimation models, such as to predict high risk patients for the development of negative outcomes of care [4]. Among generally accepted classifications used as predictors for hospital performance are International Classification of Diseases (ICD-10-CM), Medicare Severity Dx Related Groups (MS-DRG) and Clinical Classification Software codes (CCS), including their recently refined version (CCSR).
During a hospital stay, a principal Dx, in ICD-10-CM format, is assigned to each patient, representing the reason for hospitalization. In addition, an admitting Dx code (also in ICD-10-CM format) is established at the time of admission and before all the medical examinations, radiology and laboratory tests are completed. The admitting Dx code is oftentimes a symptom or chief complaint rather than a diagnosis. For known problems (e.g., during an elective admission) the admitting Dx code matches the principal Dx code [5].
MS-DRGs are used in prospective payment systems for reimbursement purposes. The MS-DRG system is created on the combination of clinical Dx, patient characteristics, and required hospital resources and contains approximately 500 groups based on 25 major diagnostic categories of body systems [6]. An MS-DRG code is calculated from the principal and secondary ICD-10-CM codes with the use of a software called ‘Grouper’ [6]. Each inpatient stay will generate one MS-DRG code, which incorporates information about the principal Dx and the presence of complications or comorbidities. MS-DRG codes, therefore, do not only use the principal Dx for their calculation, but they draw information from secondary Dx’s too. An MS-DRG code may lack the specificity of ICD-10-CM but can be used as a proxy for disease severity, since it provides information on whether the principal Dx was accompanied by complications of comorbidities [7].
CCS is a classification system that is used to group the tens of thousands of different ICD-10-CM codes into a smaller collection of clinically meaningful categories. The CCS system has been developed by the Agency of Healthcare Research and Quality (AHRQ) and has been used extensively in research due to its reduced dimensionality. The most recent revision of CCS aggregates more than 70,000 ICD-10-CM Dx codes into over 530 clinical categories [8]. A recently refined version of CCS is called CCSR and uses a many-to-many representation of Dx’s, where one ICD-10-CM code can be matched with more than one CCS code.
Other than Dx classification systems used as study inclusion criteria [9,10,11,12,13,14,15], multiple research endeavors used major classification systems as predictors of hospital performance. In 1994, Cheng et al. [16] found that MS-DRG can predict hospital LOS reasonably well, however, the prediction was more accurate for large groups of patients rather than for individuals. MaWhinney et al. [17] attempted to determine predictors of cost, charges, and LOS from MS-DRG using Cox proportional hazards models and emphasized the importance of clinical factors to predict risk-adjusted mortality. Liu, Phillips, and Codde [18], however, warned that MS-DRG had limited ability (30% of the variance) to predict the mean LOS, in comparison to 46% reported by Rutledge and Osler [19] for trauma patients. Omachonu and Suthummanon [20] reported that for the top five MS-DRGs by volume for Medicare patients at a teaching hospital in the United States, multiple regression models indicated that approximately 60 percent (R2) of the variance in the LOS is explained by patient attributes and clinical indicators. More recent studies [21] found discrepancies between actual LOS and MS-DRG-predicted LOS for hip and knee replacement patients. As an alternative for actual MS-DRG codes, Bert et al. [22] used MS-DRG weight (≤1 vs. >1) as a predictor of a longer-than-expected LOS and found that MS-DRGs with higher weights and MS-DRGs with comorbidities and complications can be viewed as a proxy of clinical complexity and patient needs.
Deschepper et al. [23] used hierarchical ICD data to predict a hospital unplanned readmission, using Random Forests technique and found that first three digits of ICD-10 codes (less detailed) may be a better predictor than the full detailed 5 digits code. Harerimana, Kim, and Jang [24] applied a deep attention model to forecast the LOS and hospital mortality based on ICD codes using the basic Hierarchical Attention Network (HAN), and reported AUROC of over 0.82 for LOS model. Similarly, Karnuta et al. [25] used artificial neural networks to predicting LOS, discharge disposition, and inpatient costs after shoulder arthroplasty using CCS and reported AUC 0.78 for LOS. CCS is commonly used as a predictor of hospital performance due to the lower number of codes. Aubert et al. [26] used CCS categories to predict 30-day hospital readmission and prolonged LOS, while Radley et al. [27] compared CCS comorbidity risk-adjustment strategies among persons with hip fracture on a sample of Medicare claims data to other risk-adjustment instruments: Iezzoni and the Charlson Index to find only modest ability to predict 1-year mortality following hip fracture. The CCS performed best overall (c = 0.76), followed by the Iezzoni (c = 0.73) and Charlson models (c = 0.72). Recent applications of machine learning methods to predict hospital performance also rely on clinical classification. Ramkumar et al. [28] reported a naïve Bayesian model after principal total hip arthroplasty to predict LOS and payment models with ROC of 0.87 for LOS; Kim et al. [14] investigated gastrointestinal patients LOS using CCS.
Since the year of 2015 all hospitals in the United States started to use the 10th edition of ICD-10-CM, for the purpose of capturing medical diagnoses. The 10th edition includes five times more unique codes than its predecessor, increasing the clinical specificity. This advantage though, creates a challenge, which is the very high dimensionality (>70,000 unique codes). The use of the ICD-10-CM in predictive analytics, therefore, can significantly increase computational cost and at the same time creates the requirement for clinical datasets that contain enormous data points, enough to include an adequate number of cases for each unique ICD-10-CM code. While health systems benefit from this high-resolution representation of medical Dx’s, ICD-10-CM was not designed with predictive analytics in mind. There are several approaches to reduce its dimensionality and make it possible to complete classification experiments, which otherwise could not have been possible due to computational cost. These methods are grouped into two categories: (i) statistical dimensionality reduction approaches, such as Principal Component Analysis, and (ii) alternative representations of clinical diagnoses, of reduced dimensionality, which derived from ICD-10-CM. The two most widely used, by researchers, alternatives, are the MS-DRGs, and the CCS codes.
Even though there are several clinical outcome studies that utilize these Dx classification systems, there is no comparison of their predictive performance. This is the motivation of the present study, as the first ever effort to quantify the differences in the predictive performance of these widely used Dx classification systems. In specific, the study objective is to estimate the predictive performance of the CCS and its recent refined version (CCSR), the MS-DRG classification systems, and the admitting Dx codes for the outcomes of: (i) inpatient mortality and (ii) hospital LOS, and to furthermore compare their performance against the principal ICD-10-CM Dx’s. We will test the hypotheses that:
  • MS-DRGs outperform the principal ICD-10-CM Dx codes for the prediction of in-patient mortality and LOS, since they incorporate information about the presence or not of (major) complications or comorbidities. This information is not incorporated into the principal ICD-10-CM.
  • CCS and CCSR codes perform reasonably well compared to ICD-10-CM codes for in-patient mortality and LOS, since CCS consist of manual, expert-designed representations of medical Dx’s in a clinically meaningful way.
Table 1 summarizes the different diagnosis classification systems, and their role in the present study.
The study does not aim to develop clinically applicable models, but to compare the performance of these medical Dx coding systems. The goal is therefore not to compare algorithms to find the best performing one. For the outcome of inpatient mortality, the study focuses on the positive class ‘died’ since this is the outcome that health systems and clinical decision makers are interested about.
The next section of the article (methods) explains the data preparation, the experimental setup, and the analysis pipeline. The article continues with the results of the classification and regression experiments and the comparison of the performance of the studied constructs of medical diagnoses. The discussion section, finally, summarizes findings to discuss practical implications and recommendations for future research.

2. Materials and Methods

2.1. Dataset

The research was conducted with secondary medical claims from the Centers for Medicare and Medicaid Services (CMS) [29]. The dataset was purchased after a Data Use Agreement with CMS. The original dataset includes every Medicare hospital admission during the year 2018 in the State of Michigan and has a total of 418,529 observations. The dataset includes, among other features, the admission information, patient demographics, the ICD-10-CM Dx’s (principal and secondary) and MS-DRG codes. Since the CCS codes were not originally included in the dataset, we added them with the use of a mapping database that was provided by AHRQ [30]. The refined mapping of CCS (CCSR) follows a many-to-many relationship with ICD-10-CM, and therefore some ICD-10-CM codes were mapped with more than one CCS code. We represented this relationship in our dataset by merging the multiple CCS codes per patient into a new feature. The LOS variable was calculated after subtracting the admission date from the discharge date. The following features were then extracted from the database and imported to the Weka Environment for Knowledge Analysis [31]: admitting ICD-10-CM Dx, principal ICD-10-CM Dx, principal CCS Dx, principal CCSR Dx (merged feature), LOS, age group, gender, ethnicity, type of admission (elective/urgent/emergency), and ‘transfer from another hospital’.

2.2. Experimental Setup

A randomized sample of 50,000 cases was extracted from the CMS database and was used to complete the classification experiments. The sampling was performed with the ReservoirSample method in Weka, which is a popular random sampling approach [32]. The target dichotomous variable ‘inpatient mortality’ has two classes (A—‘alive’, D—‘died’). The experiments were completed with the use of two different classifiers: Naïve Bayes, and Random Decision Forest. Naïve Bayes (NB) is a method based on the Bayes theorem, and it uses conditional probabilities. The algorithm’s most discussed drawback is that it assumes independence of the predictors. Despite this limitation the algorithm has been used extensively in biomedical research [33]. Random Forests is a popular ensemble learning method that operates by constructing many decision trees during the training phase, therefore creating a ‘forest’. The output is the class selected by most trees [34]. We ran all the experiments with these two algorithms since they follow a quite different approach. NB is a simple and computationally efficient Bayesian method, which is oftentimes used as baseline in similar studies, while the Decision Forests consist of a popular ensemble method that uses the principles of decision trees combined with bagging and majority voting.
Six NB and four Random Forest models were created. The first one was used as a baseline and only included the demographic variables. This model served as the baseline performance model of the study. Models 2–6 used the demographic variables plus one Dx coding system: Model 2 = baseline features + principal ICD-10-CM Dx, Model 3 = baseline features + principal CCS (old), Model 4 = baseline features + principal CCSR (refined), Model 5 = baseline features + MS-DRGs, and Model 6 = baseline features + admission ICD-10-CM Dx. We created multiple models since the goal of this work is to examine the predictive power of each of the coding systems independently. The coding systems cannot be used together in one model, since they are expressions of the same concept, that is the medical diagnosis. Inserting different expressions of these data into a single model would introduce multicollinearity.
In all models, the following control variables were included: patient age group, ethnicity, gender, type of admission (elective/urgent/emergency), and the ‘transferred from another hospital’ index. All control variables were inserted into the model as dichotomous ones, where each of the categories were assessed as present/non-present (0/1), This format is appropriate for algorithms that require the independent variables to be categorical or numerical, therefore appropriate for classification and regression experiments. For the prediction of the continuous variable LOS, we used the Multiple Linear Regression implementation of Weka and disabled the feature selection option in the algorithm parameters. A bagging method with 100 iterations was used. Figure 1 presents a summary of the experimental setup.
For all experiments we tested the models using the 10-fold cross validation method. The two classes are unbalanced because the number of cases of the negative class (A-alive) outweighed significantly, in number, the cases in the positive class (D-died). In the case of unbalanced datasets, the overall accuracy metric provides skewed and biased information [35]. Added to this, there is a tendency for algorithms to correctly classify cases of the large sized class (in our case ‘alive’), therefore boasting low false positive rates, while having the tendency to misclassify deaths as ‘alive’. Due to this, the precision metric is also not useful to the researcher. For these reasons, the present study will evaluate the performance using the Recall, F-score, ROC, and Precision-Recall Curve (PRC) metrics. While there is no natural ground truth for the performance comparison, the ICD-10-CM construct can be considered as one, since this is the foundation on which the other summary classification systems (CCS, DRGs) were created from.

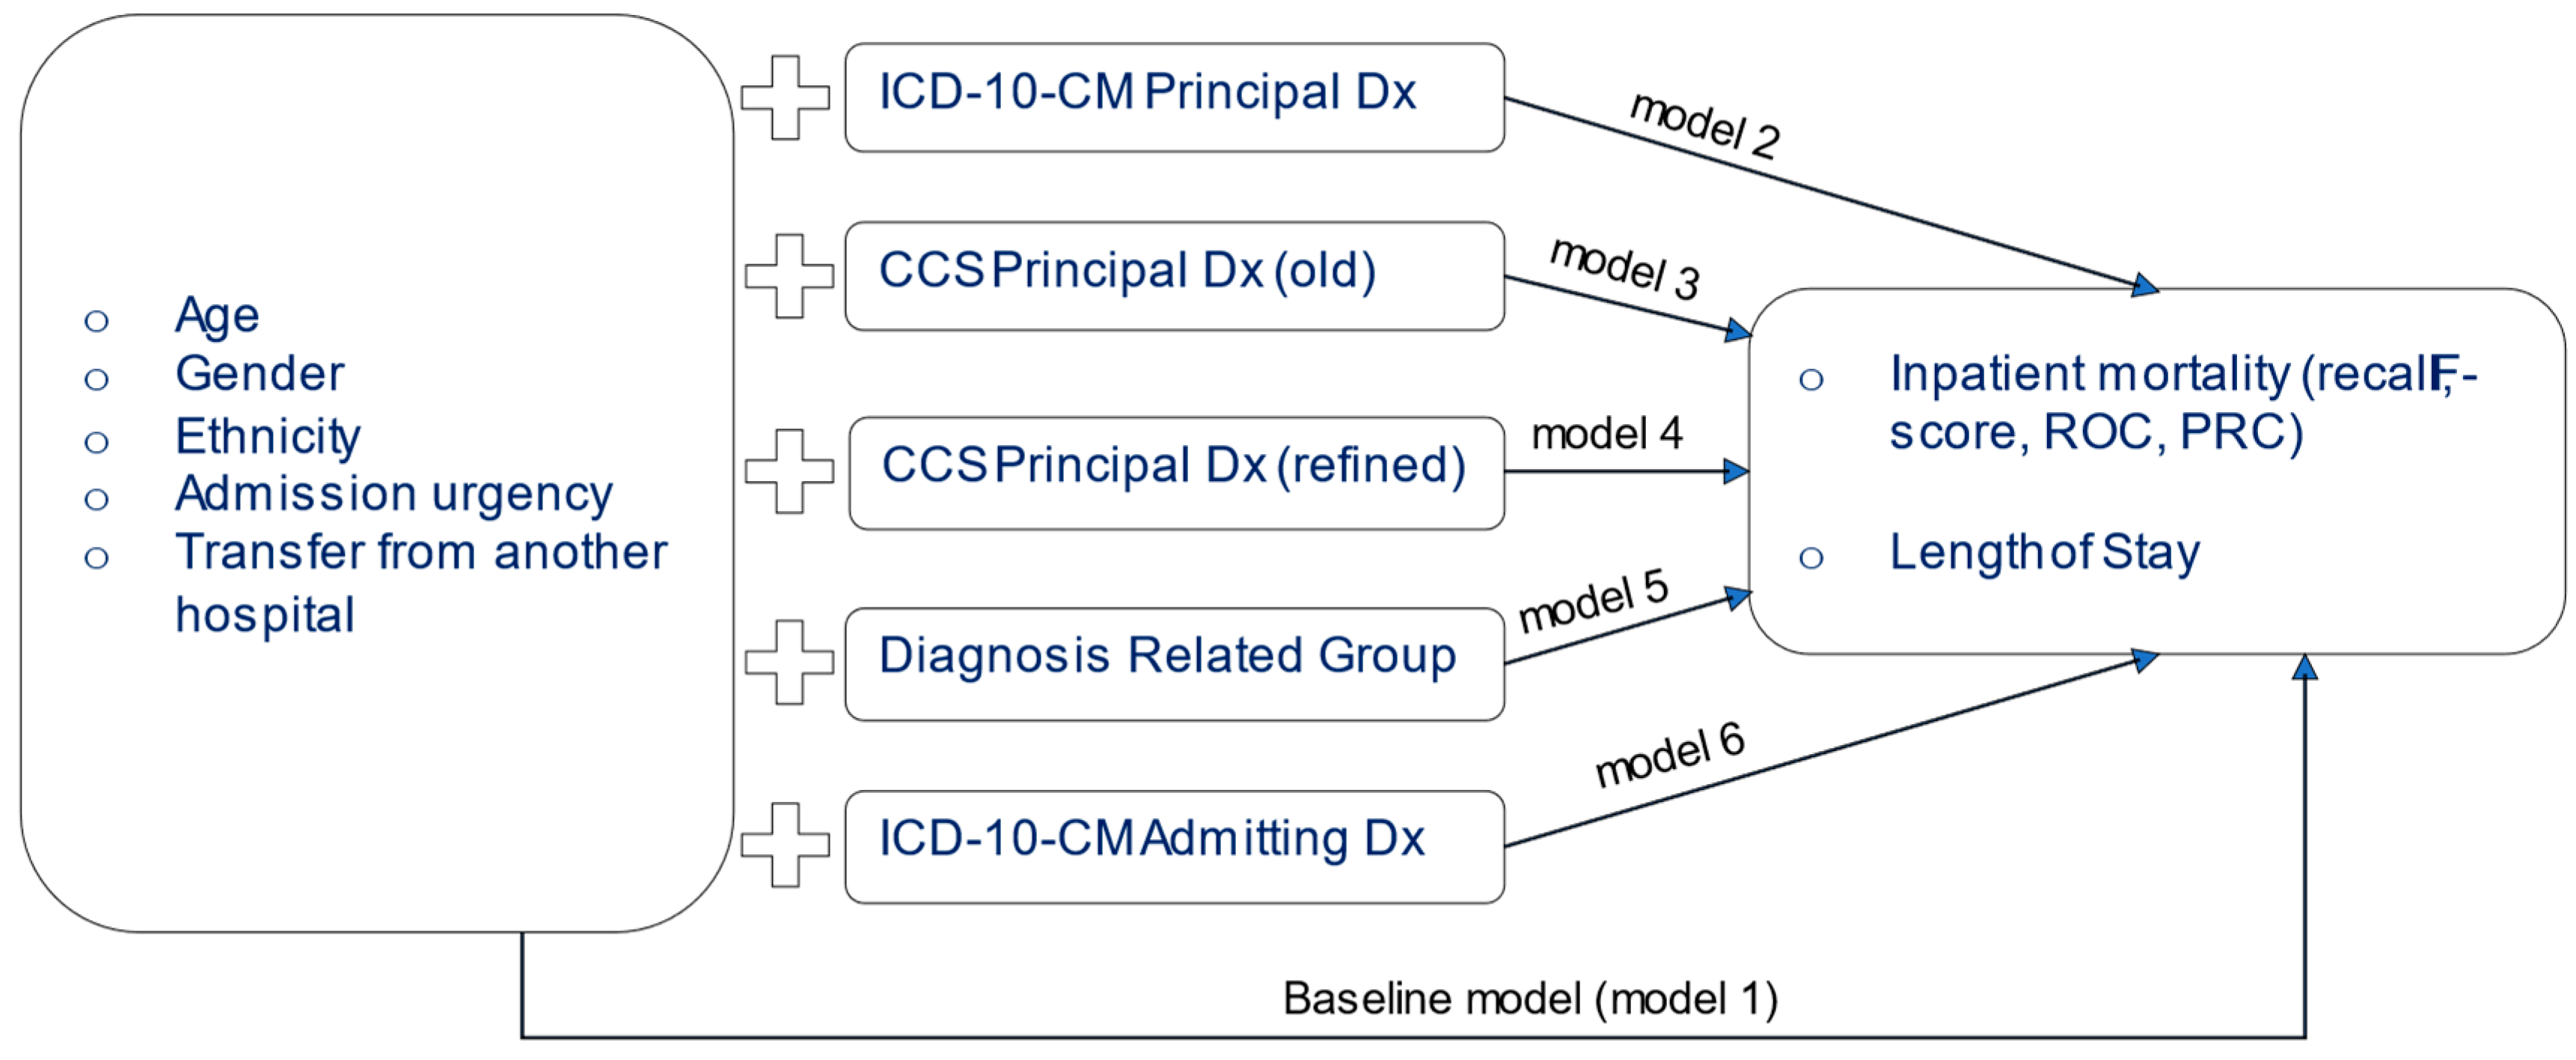
2.3. Pipeline for Data Preparation and Analysis

  • Step 1: The following variables were extracted from the original dataset: ‘age group’, ‘gender’, ‘race’, ‘admission was elective (yes/no)’, ‘transfer from another hospital (yes/no)’, ‘length of stay’, ‘discharge status (alive/dead)’, ‘icd-10-dx principal Dx’, ‘icd-10-cm admitting Dx’, ‘DRG code’.
  • Step 2: The ‘CCS Principal Dx (old)’ and ‘CCS Principal Dx (refined)’ to ICD-10-CM mapping dataset was acquired from the AHRQ website (https://www.hcup-us.ahrq.gov/toolssoftware/ccs/ccs.jsp (accessed on 29 June 2022)).
  • Step 3: The CCS variables were merged with the first dataset to form the target file.
  • Step 4: All categorical control variables were transformed to dichotomous (0/1), and the dataset was inserted into Weka.
  • Step 5: A randomized sample of 50,000 cases was generated using the ReservoirSample algorithm of Weka.
  • Step 6a(i): Using Naïve Bayes models were generated for the outcome ‘discharge status’ using the following parameters: batchSize = 100, numDecimals = 2
Model 1 predictors: only control variables (‘age group’, ‘gender’, ‘race’, ‘admission was elective’, ‘transfer from another hospital’; model 2 predictors: control variables + DRG codes; model 3 predictors: control variables + primary ICD-10-CM codes; model 4 predictors: control variables + admitting ICD-10-CM codes; model 5 predictors: control variables + CCS codes (old); model 6 predictors: control variables + CCS codes (refined)
  • Step 6a(ii): using 10-fold validation, each model was tested and the metrics of recall, PRC, f-score for the outcome of ‘died’ and the ROC were calculated.
  • Step 7b(i) and 7b(ii): The same process was followed using the Random Forest algorithm with the following parameters: bagSize% = 100, batchSize = 100, maxDepth = n/a, numDecimals = 2, numExecuionSlots = 1, numIterations (number of trees) = 100
  • Step 8: Using multiple linear regression, six models were trained for the numerical outcome of Length of Stay. Each model had the exact same predictors as shown in 6a(i). Each model was tested with 10-fold validation and the following metrics were calculated: model fit (R2), mean absolute error, root mean squared error.

3. Results

3.1. Data Description

Table 2 presents descriptive information of the original dataset, prior to the randomized sampling. Since this is a Medicare dataset most patients are 65 years or older. The random sampling (50,000 cases) generated, in each run, similar distributions.

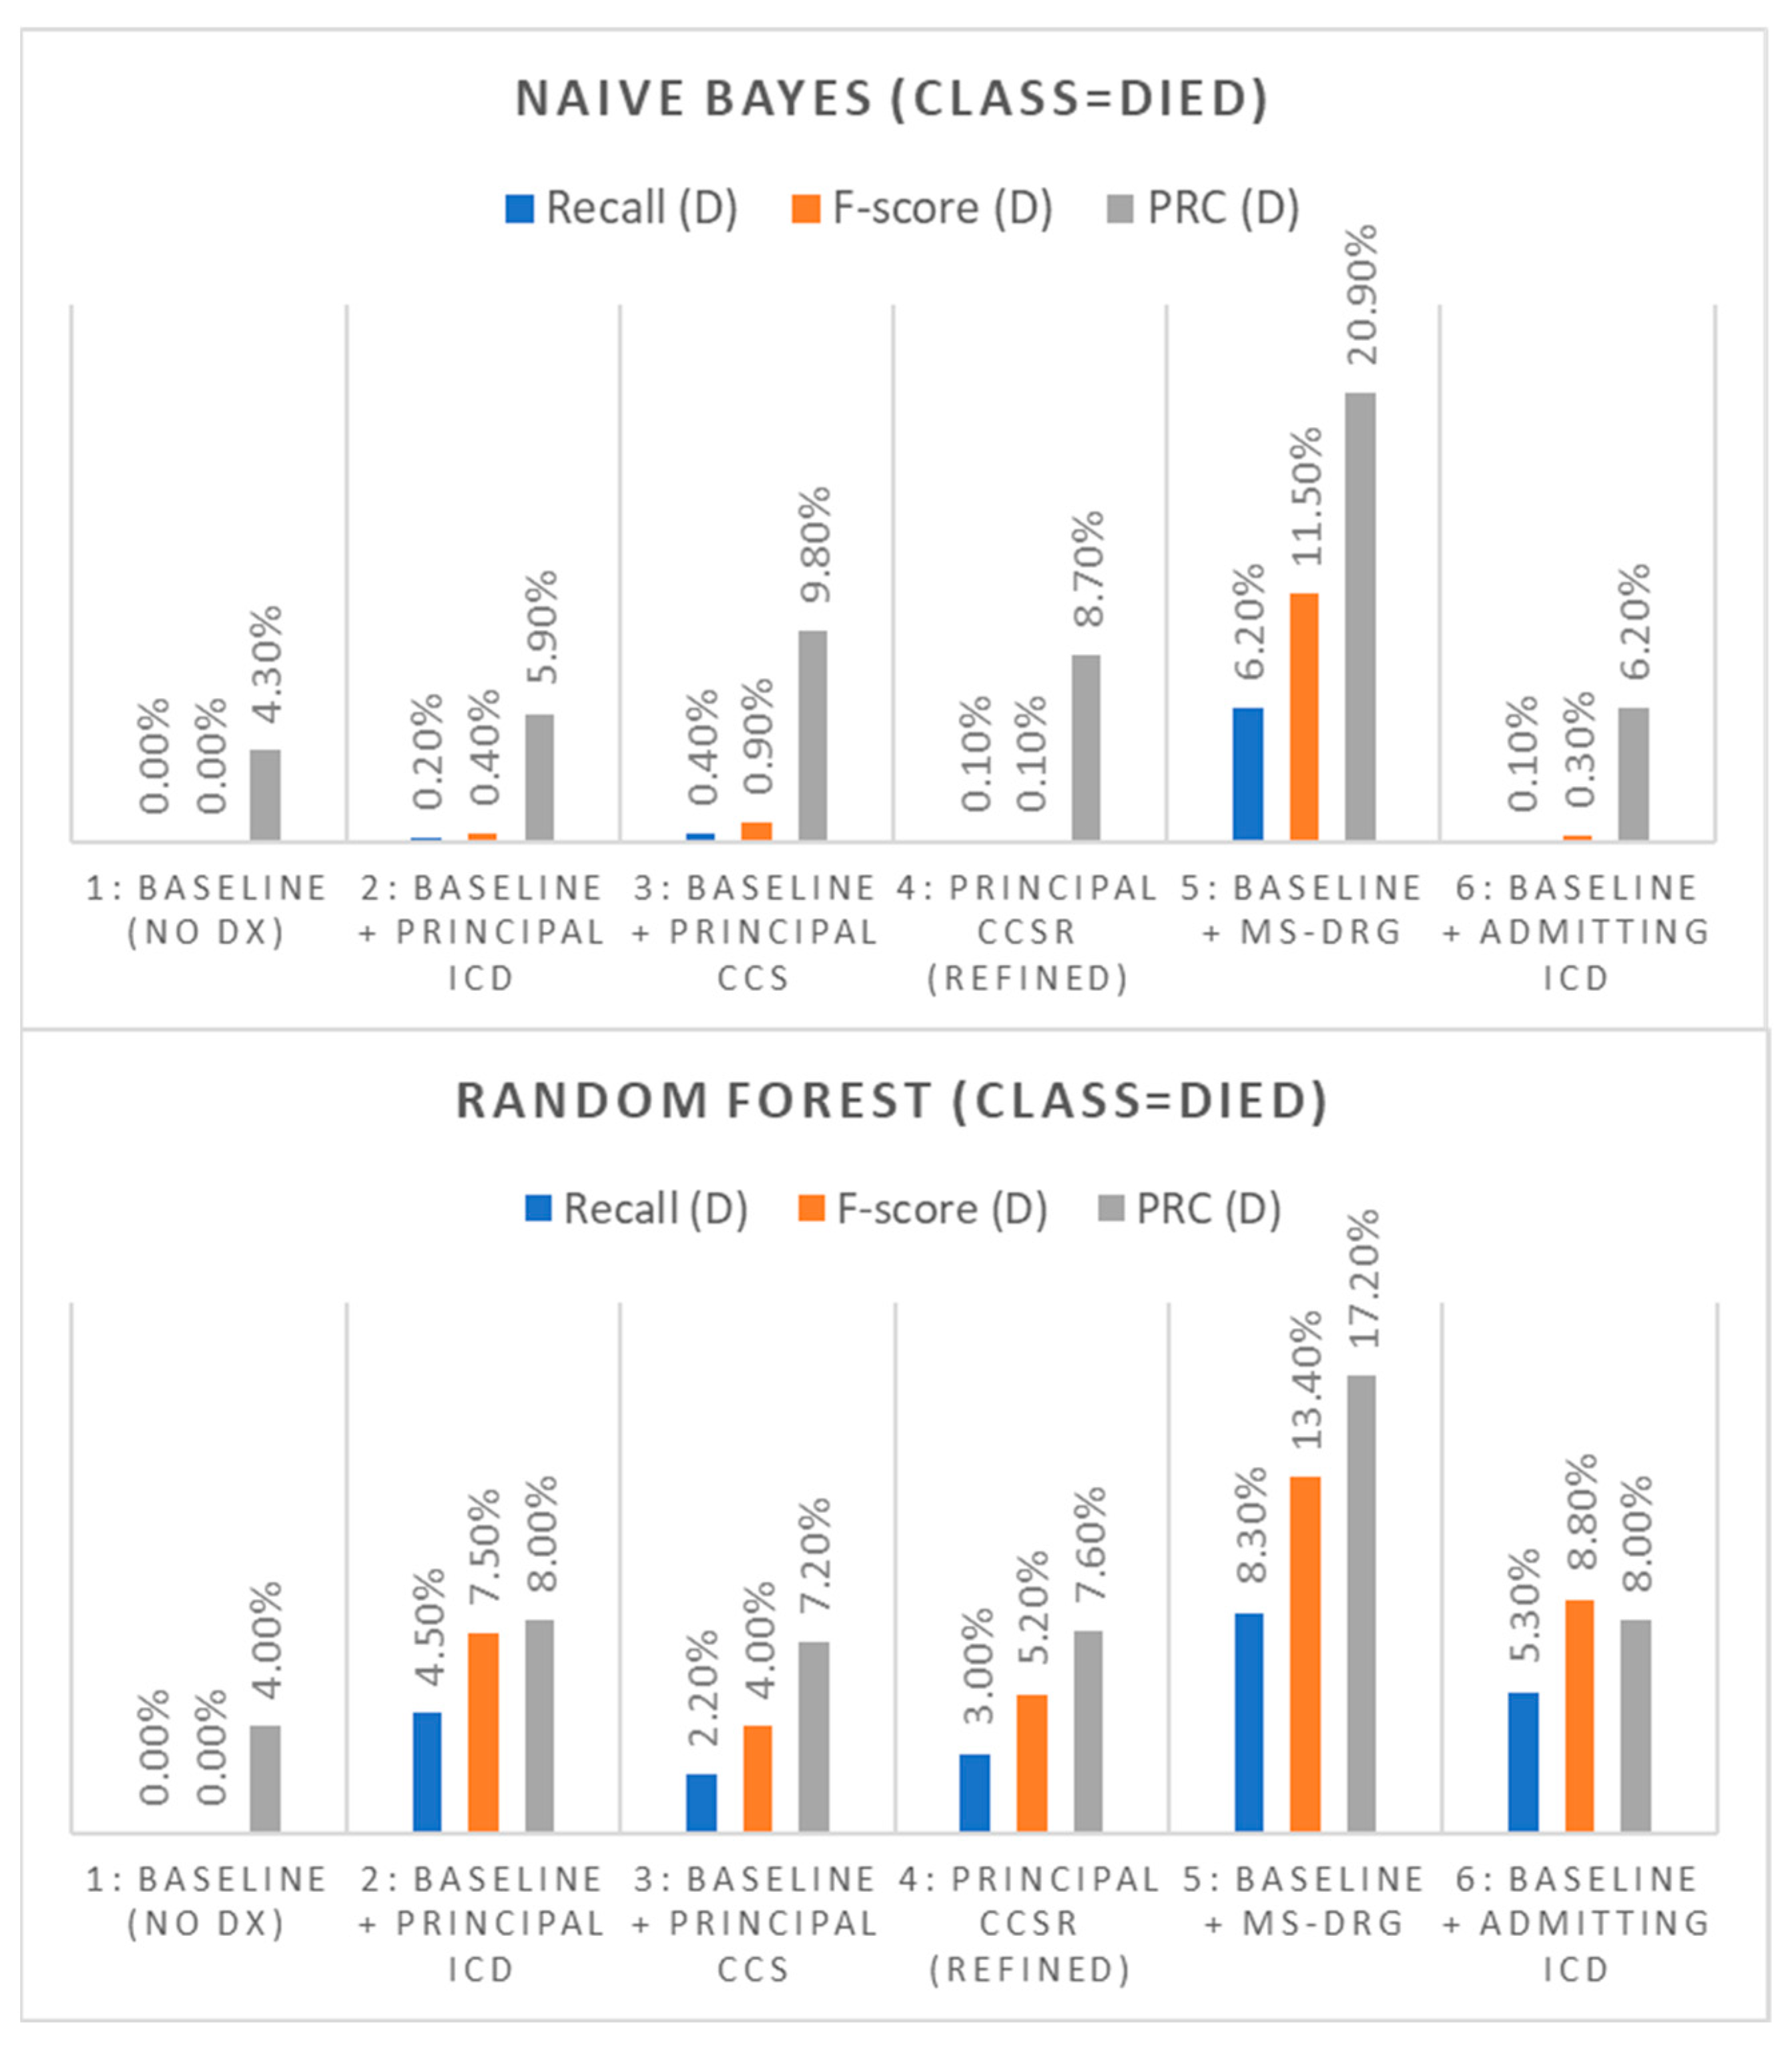
3.2. Prediction of In-Patient Mortality

The baseline model which only used demographic attributes had, as expected, the worst performance. The model had a positive recall rate and F-score of 0.0% in both NB and Random Forest experiments; virtually every inpatient death was misclassified as a non-death. Similarly, the ‘died’ class was found to have a low PRC score of 4.3% (NB) and 4.0% (Random Forest). After establishing the baseline performance, five classification experiments were completed as explained in the experimental setup section. Firstly, we added to the baseline predictors the principal ICD-10-CM Dx feature. The positive recall rate, the F-score and PRC area were only very slightly increased in the case of NB (0.2%, 0.4%, and 5.9%), respectively, while the same run with the use of Random Forest demonstrated slightly better improvement in comparison, specifically, Recall(D) = 4.5%, F-score(D) = 7.5%, and PRC(D) = 8.0%.
In a similar manner, we then replaced the ICD-10-CM feature with the older principal CCS feature as our main predictor. The positive recall rate, the F-score and PRC area metrics were found to be slightly improved than with the principal ICD-10-CM experiment in the case of NB (0.4%, 0.9%, and 9.8%), respectively, while the same run with the use of Random Forest demonstrated slightly worse improvement in comparison to the principal ICD-10-CM predictor (Recall(d) = 2.2%, F-score(d) = 4.0%, PRC(d) = 7.2%). It is interesting how the very much reduced clinical representation of medical Dx that the CCS system represents outperformed the high-dimensionality matrix of ICD-10-CM in the case of NB. In the third experiment we used the refined CCS (CCSR). The positive recall rate, the F-score and PRC areas in the case of NB were found to be 0.1%, 0.1%, and 8.7%, respectively, while the same run with the use of Random Forest presented improved performance (Recall(d) = 3.0%, F-score(d) = 5.2%, PRC(d) = 7.6%). This performance is slightly improved than that of the old CCS system.
The fourth experiment used the admitting Dx code (ICD-10-CM) feature as the main predictor of mortality. The positive recall rate, the F-score and PRC areas were found to be like those of the principal ICD-10 Dx in the case of NB (0.1%, 0.3%, and 6.2%), respectively, while the same run with the use of Random Forest presented improved performance against the principal ICD-10 (Recall(d) = 5.3%, F-score(d) = 8.8%, PRC(d) = 8.0%). This is interesting, since the admitting Dx codes are assigned at the start of the hospitalization before all the lab tests and examinations are completed, with a high degree of physician uncertainty. Despite this, though, it appears that this construct has similar if not better predictive power than the principal ICD-10-CM Dx.
The last experiment used the MS-DRG feature as the main predictor of mortality. The positive recall rate, the F-score and PRC areas were significantly better than in the previous experiments and were found to be increased in the case of NB (Recall(D) = 6.2%, F-score(D) = 11.5%, PRC(D) = 20.9%) and Random Forest (Recall(D) = 8.3%, F-score(D) = 13.4%, PRC(D) = 17.2%). See Table 3 and Figure 2 for a summary of results.

3.3. Prediction of Hospital Length of Stay (LOS)

The second objective of this study is to compare the performance of the above representations of medical Dx’s, in predicting the outcome of LOS. Since LOS is a continuous variable, for all tests, we used the Weka implementation of Multiple Linear Regression (MLR). We first started with the baseline model. As shown on Table 4, the baseline model was found to have an R2 = 6.29%, and a mean absolute error of 3.52 days. The first experiment added to the baseline feature set the principal ICD-10 Dx, and a new MLR model was created. This model had slightly improved performance compared to the baseline (R2 = 10.82%, and a mean absolute error of 3.34 days). The next run used the principal CCS (old version) representation and performed better than in the case of the principal ICD-10-CM, with an increased R2 up to 15.83%, and a further mean absolute error, down to 3.22 days. The new revision of CCS had a marginally improved performance in comparison (R2 = 15.92% and mean absolute error of 3.19 days).
The admitting Dx (ICD-10) feature had an improved performance compared to the principal ICD-10-CM (R2 = 12.94% and mean absolute error of 3.33 days). As in the case of inpatient mortality the MS-DRG construct was also the best predictor of LOS, with an even more reduced mean absolute error of 2.89 days compared to the other constructs and a model fit almost five times higher than the baseline model, explaining 30.38% of the LOS variance (Table 4).

4. Discussion

According to the results, the DRG variable is the best predictor for both outcomes. Using Random Forest there was found that the DRG outperformed the other diagnostic classification systems by two to three times for the outcome of the inpatient mortality. The DRG construct also had a model fit significantly higher for the outcome of LOS (30.38% vs. the principal CCS R2 of 15.92%). The performance of the CCS classification system was close to that of ICD-10-CM for the two outcomes of study, and the recent revision of CCS slightly outperformed its older version.
Health analysts and researchers have been using several representations of medical Dx in health analytics projects. Some of the most popular representations are the MS-DRGs, which are readily available in medical claim datasets. The MS-DRGs were confirmed to have the best performance even outperforming the much higher dimensionality principal ICD-10-CM Dx feature. Although there are only 745 unique MS-DRG codes in our dataset (compared to more than 8000 ICD-10-CM ones) the experiments with the MS-DRG feature produced better prediction of the outcome of inpatient mortality. This is expected to some extent, since MS-DRGs incorporate more than just principal Dx information. MS-DRGs are estimated by scanning the secondary diagnoses from the Electronic Medical Records to find whether the principal concern was also accompanied by comorbidities/complications. MS-DRGs, in that respect, can be used as a useful proxy for disease severity. This benefit of MS-DRGs is at the same time its biggest drawback. MS-DRG’s are calculated post discharge and the MS-DRG information is unknown during the hospital stay. Several studies are designed with the goal to predict outcomes of care during the beginning phases of a hospitalization, and these studies cannot utilize MS-DRGs as predictors. Authors explain that while the capability to predict outcomes such as mortality and LOS in the early stages of admission can provide very useful insights, making such predictions on the first day of a hospitalization is a challenging endeavor [24].
According to the results of our study, the ‘primary ICD-10-CM Dx’ did not outperform the ‘admitting ICD-10-CM Dx’ in terms of predicting the two outcomes of study. In some cases, the results showed that the ‘admitting ICD-10-CM Dx’ can even be a better predictor for the outcome of LOS. This is a finding that needs to be confirmed in follow-up studies. It appears that the initial and easy to recognize medical concern is a very good predictor of hospital outcomes, and can be used as a prognostic tool. This is especially important considering that this information is known very early during hospitalization, when the initial planning for care management usually takes place.
In our study, the use of CCS as predictor improved upon the baseline performance and was only outperformed by the principal ICD-10-CM, by a small margin. Contrary to MS-DRGs, which cannot be used in early on-admission risk estimation models, CCS, including the recent refined edition (CCSR) are readily known as soon as the principal Dx is established. CCS is therefore recommended by the authors of the present study, to be a useful medical Dx classification system for predictive modelling purposes. Deschepper et al. [23] also used Random Forests and found that first three digits of ICD-10 codes (less detailed) may be a better predictor than the fully detailed five-digit code. This may explain the finding of the present study that CCS codes are only marginally worse predictors than the ICD-10-CM. It is finally worth noting that the new refined version of CCS (CCSR) only marginally improves the predictive performance of the two outcomes under study. The authors believe that more research in needed to understand how the refined CCS compares against the old version, in terms of their usefulness in predictive analytics.
Deschepper et al. [23] attempted to predict unplanned readmissions and compared the performance of Random Forests against other machine learning algorithms, with Random Forests demonstrating the best performance. The superiority of Random Forests has been demonstrated in other similar studies [36,37], which are in line with our findings.
There are several studies which attempt to create predictive models for the outcome of impatient mortality, and using, each, one or another Dx constructs. This is the first study which attempted to compare the performance of these Dx constructs and provide to the research community a resource which will provide to them insights when they come to decision about what Dx construct to use in their health analytics paper.
We recommend that future research can focus on the development of prediction oriented medical Dx classification systems, designed with their focus being their capacity to perform well in predicting clinical outcomes. These efforts may utilize existing systems (such as CCS), as their foundation. One approach would be a combined use of the clinically meaningful and human-developed CCS with additional features that are extracted via dimensionality reduction, such as Principal Component Analysis. We would also be interested to see how the classification systems that the study compared perform, if they are examined not for the entire clinical spectrum, but separately for different families of medical conditions.
The authors acknowledge as a limitation of the study that only two outcomes were studied (LOS and mortality), and therefore any conclusions about the appropriateness of the different Dx constructs are only generalizable for these two outcomes. Additionally, this study did not examine diagnosis-specific performance, for example, for which diagnoses the different Dx constructs perform close to the ICD-10-CM and for which there was a greater performance gap. The present study used a randomized sample of 50,000 cases instead of the entire dataset, since Random Forests could not handle the enormous dimensionality of ICD-10-CM for larger samples. We resampled the target dataset several times and determined the maximum data size where Random Forests could be trained and cross-validated in a reasonable amount of time. For the prediction of inpatient mortality, the present study focused on the performance of the ‘died’ class, which is not only the most challenging to predict correctly but is also the class that health systems and clinical decision makers are most interested to know about. The models that we developed had a near-perfect performance for the negative class ‘alive’. We chose not to focus on presenting results for the ‘alive’ and to not draw attention to these non-contextually useful, near-perfect scores. Inpatient mortality, which is the important class in this study, is a hard-to-predict problem, and this work was not designed to develop clinically applicable models, but to rather compare the performance of the various Dx systems (MS-DRG, CCS and CCSR, ICD-10-CM) for two well-studied outcomes of care. In summary, since this study is the first ever effort to quantify the differences in the predictive performance of these Dx classification systems, it is intended to serve as a useful reference in clinical outcome studies.

Author Contributions

Conceptualization, D.Z. and N.D.; methodology, D.Z.; software, D.Z.; validation, D.Z.; formal analysis, D.Z.; investigation, D.Z.; resources, D.Z. and N.D.; data curation, D.Z.; writing—original draft preparation, D.Z.; writing—review and editing, D.Z. and N.D.; visualization, D.Z. All authors have read and agreed to the published version of the manuscript.

Funding

This research received no external funding.

Institutional Review Board Statement

Not applicable.

Informed Consent Statement

Not applicable.

Data Availability Statement

The dataset that the research used in under a Data Use Agreement (DUA) with CMS and can only be shared after permission with CMS. Please feel free to email the author (zikos1d@cmich.edu) for data related questions or about the process to receive permission to use the dataset.

Conflicts of Interest

The authors declare no conflict of interest.

References

  1. Shah, N.; Konchak, C.; Chertok, D.; Au, L.; Kozlov, A.; Ravichandran, U.; McNulty, P.; Liao, L.; Steele, K.; Kharasch, M.; et al. Clinical Analytics Prediction Engine (CAPE): Development, electronic health record integration and prospective validation of hospital mortality, 180-day mortality and 30-day readmission risk prediction models. PLoS ONE 2020, 15, e0238065. [Google Scholar] [CrossRef] [PubMed]
  2. Capobianco, E. Data-driven clinical decision processes: It’s time. J. Transl. Med. 2019, 17, 44. [Google Scholar] [CrossRef] [PubMed] [Green Version]
  3. Konchak, C.W.; Krive, J.; Au, L.; Chertok, D.; Dugad, P.; Granchalek, G.; Livschiz, E.; Mandala, R.; McElvania, E.; Park, C.; et al. From Testing to Decision-Making: A Data-Driven Analytics COVID-19 Response. Acad. Pathol. 2021, 8, 23742895211010257. [Google Scholar] [CrossRef] [PubMed]
  4. Englum, B.R.; Saha-Chaudhuri, P.; Shahian, D.M.; O’Brien, S.M.; Brennan, J.M.; Edwards, F.H.; Peterson, E.D. The impact of high-risk cases on hospitals’ risk-adjusted coronary artery bypass grafting mortality rankings. Ann. Thorac. Surg. 2015, 99, 856–862. [Google Scholar] [CrossRef] [PubMed] [Green Version]
  5. Symum, H.; Zayas-Castro, J. Identifying Children at Readmission Risk: At-Admission versus Traditional At-Discharge Readmission Prediction Model. Healthcare 2021, 9, 1334. [Google Scholar] [CrossRef] [PubMed]
  6. MS-DRG Classifications and Software (CMS.gov). Available online: https://www.cms.gov/Medicare/Medicare-Fee-for-Service-Payment/AcuteInpatientPPS/MS-DRG-Classifications-and-Software (accessed on 29 June 2022).
  7. Mishra, R.; Verma, H.; Aynala, V.B.; Arredondo, P.R.; Martin, J.; Korvink, M.; Gunn, L.H. Diagnostic Coding Intensity among a Pneumonia Inpatient Cohort Using a Risk-Adjustment Model and Claims Data: A US Population-Based Study. Diagnostics 2022, 12, 1495. [Google Scholar] [CrossRef] [PubMed]
  8. Clinical Classifications Software (CCS) for ICD-10-PCS. Available online: https://www.hcup-us.ahrq.gov/toolssoftware/ccs10/ccs10.jsp (accessed on 29 June 2022).
  9. Davies, B.J.; Allareddy, V.; Konety, B.R. Effect of postcystectomy infectious complications on cost, length of stay, and mortality. Urology 2009, 73, 598–602. [Google Scholar] [CrossRef] [PubMed]
  10. Goudie, A.; Dynan, L.; Brady, P.W.; Rettiganti, M. Attributable cost and length of stay for central line–associated bloodstream infections. Pediatrics 2014, 133, e1525–e1532. [Google Scholar] [CrossRef] [Green Version]
  11. De la Garza Ramos, R.; Goodwin, C.R.; Jain, A.; Abu-Bonsrah, N.; Fisher, C.G.; Bettegowda, C.; Sciubba, D.M. Development of a metastatic spinal tumor frailty index (MSTFI) using a nationwide database and its association with inpatient morbidity, mortality, and length of stay after spine surgery. World Neurosurg. 2016, 95, 548–555. [Google Scholar] [CrossRef] [PubMed]
  12. Ramkumar, P.N.; Navarro, S.M.; Frankel, W.C.; Haeberle, H.S.; Delanois, R.E.; Mont, M.A. Evidence-based thresholds for the volume and length of stay relationship in total hip arthroplasty: Outcomes and economies of scale. J. Arthroplast. 2018, 33, 2031–2037. [Google Scholar] [CrossRef] [PubMed]
  13. Sakai, M.; Kou, Y.F.; Shah, G.B.; Johnson, R.F. Tracheostomy demographics and outcomes among pediatric patients ages 18 years or younger—United States 2012. Laryngoscope 2019, 129, 1706–1711. [Google Scholar] [CrossRef]
  14. Kim, V.; Lodaya, K.; Marinaro, X.; Zhang, X.; Hayashida, D.K.; Munson, S.; D’Souza, F. PGI28 Investigating Length of Stay in Gastrointestinal Patient Surgical Clusters in the National Inpatient Sample with Machine Learning. Value Health 2021, 24, S99. [Google Scholar] [CrossRef]
  15. Pathak, R.; Giri, S.; Aryal, M.R.; Karmacharya, P.; Bhatt, V.R.; Martin, M.G. Mortality, length of stay, and health care costs of febrile neutropenia-related hospitalizations among patients with breast cancer in the United States. Support. Care Cancer 2015, 23, 615–617. [Google Scholar] [CrossRef]
  16. Cheng, S.; Essery, S.; Braithwaite, J.; Howes, M. A study using working DRGs to examine variations in length of stay. Health Inf. Manag. J. Health Inf. Manag. Assoc. Aust. 1994, 24, 7–11. [Google Scholar] [CrossRef]
  17. MaWhinney, S.; Brown, E.R.; Malcolm, J.; VillaNueva, C.; Groves, B.M.; Quaife, R.A.; Lindenfeld, J.; Warner, B.A.; Hammermeister, K.E.; Grover, F.L.; et al. Identification of risk factors for increased cost, charges, and length of stay for cardiac patients. Ann. Thorac. Surg. 2000, 70, 702–710. [Google Scholar] [CrossRef] [PubMed]
  18. Liu, Y.; Phillips, M.; Codde, J. Factors influencing patients’ length of stay. Aust. Health Rev. 2001, 24, 63–70. [Google Scholar] [CrossRef] [PubMed] [Green Version]
  19. Rutledge, R.; Osler, T. The ICD-9-based illness severity score: A new model that outperforms both DRG and APR-DRG as predictors of survival and resource utilization. J. Trauma 1998, 45, 791–799. [Google Scholar] [CrossRef]
  20. Omachonu, V.K.; Suthummanon, S.; Akcin, M.; Asfour, S. Predicting length of stay for Medicare patients at a teaching hospital. Health Serv. Manag. Res. 2004, 17, 1–12. [Google Scholar] [CrossRef]
  21. Carr, C.J.; Mears, S.C.; Barnes, C.L.; Stambough, J.B. Length of stay after joint arthroplasty is less than predicted using two risk calculators. J. Arthroplast. 2021, 36, 3073–3077. [Google Scholar] [CrossRef]
  22. Bert, F.; Kakaa, O.; Corradi, A.; Mascaro, A.; Roggero, S.; Corsi, D.; Scarmozzino, A.; Siliquini, R. Predicting Length of Stay and Discharge Destination for Surgical Patients: A Cohort Study. Int. J. Environ. Res. Public Health 2020, 17, 9490. [Google Scholar] [CrossRef]
  23. Deschepper, M.; Eeckloo, K.; Vogelaers, D.; Waegeman, W. A hospital wide predictive model for unplanned readmission using hierarchical ICD data. Comput. Methods Programs Biomed. 2019, 173, 177–183. [Google Scholar] [CrossRef] [PubMed]
  24. Harerimana, G.; Kim, J.W.; Jang, B. A deep attention model to forecast the Length Of Stay and the in-hospital mortality right on admission from ICD codes and demographic data. J. Biomed. Inform. 2021, 118, 103778. [Google Scholar] [CrossRef]
  25. Karnuta, J.M.; Churchill, J.L.; Haeberle, H.S.; Nwachukwu, B.U.; Taylor, S.A.; Ricchetti, E.T.; Ramkumar, P.N. The value of artificial neural networks for predicting length of stay, discharge disposition, and inpatient costs after anatomic and reverse shoulder arthroplasty. J. Shoulder Elb. Surg. 2020, 29, 2385–2394. [Google Scholar] [CrossRef] [PubMed]
  26. Aubert, C.E.; Schnipper, J.L.; Roumet, M.; Marques-Vidal, P.; Stirnemann, J.; Auerbach, A.D.; Zimlichman, E.; Kripalani, S.; Vasilevskis, E.E.; Robinson, E.; et al. Best definitions of multimorbidity to identify patients with high health care resource utilization. Mayo Clin. Proc. Innov. Qual. Outcomes 2020, 4, 40–49. [Google Scholar] [CrossRef] [PubMed] [Green Version]
  27. Radley, D.C.; Gottlieb, D.J.; Fisher, E.S.; Tosteson, A.N. Comorbidity risk-adjustment strategies are comparable among persons with hip fracture. J. Clin. Epidemiol. 2008, 61, 580–587. [Google Scholar] [CrossRef] [PubMed] [Green Version]
  28. Ramkumar, P.N.; Navarro, S.M.; Haeberle, H.S.; Karnuta, J.M.; Mont, M.A.; Iannotti, J.P.; Patterson, B.M.; Krebs, V.E. Development and validation of a machine learning algorithm after primary total hip arthroplasty: Applications to length of stay and payment models. J. Arthroplast. 2019, 34, 632–637. [Google Scholar] [CrossRef]
  29. Center for Medicare & Medicaid Services (CMS), Medicare Claims Data. Available online: https://healthdata.gov/dataset/Center-for-Medicare-Medicaid-Services-CMS-Medicare/buvm-ucbs (accessed on 29 June 2022).
  30. Zikos, D. Session Details: Reasoning Systems and Machine Learning. In PETRA, Proceedings of the 12th ACM International Conference on PErvasive Technologies Related to Assistive Environments, Rhodes Greece, 5–7 June 2019; Association for Computing Machinery: New York, NY, USA, 2019. [Google Scholar]
  31. Das, M.; Dash, R. A Comparative Study on Performance of Classification Algorithms for Breast Cancer Data Set Using WEKA Tool. In Intelligent Systems; Springer: Singapore, 2022; pp. 289–297. [Google Scholar]
  32. Nagwani, N.K. Stream Mining: Introduction, Tools & Techniques and Applications. Data Mining and Machine Learning Applications. Data Min. Mach. Learn. Appl. 2022, 24, 99–124. [Google Scholar]
  33. Bhatia, S.; Malhotra, J. Naïve Bayes Classifier for Predicting the Novel Coronavirus. In Proceedings of the 2021 Third International Conference on Intelligent Communication Technologies and Virtual Mobile Networks (ICICV), Tirunelveli, India, 4–6 February 2021; pp. 880–883. [Google Scholar]
  34. Bayramli, I.; Castro, V.; Barak-Corren, Y.; Madsen, E.M.; Nock, M.K.; Smoller, J.W.; Reis, B.Y. Temporally informed random forests for suicide risk prediction. J. Am. Med. Inform. Assoc. 2022, 29, 62–71. [Google Scholar] [CrossRef]
  35. Röösli, E.; Bozkurt, S.; Hernandez-Boussard, T. Peeking into a black box, the fairness and generalizability of a MIMIC-III benchmarking model. Sci. Data 2022, 9, 24. [Google Scholar] [CrossRef]
  36. Javeed, M.; Jalal, A.; Kim, K. Wearable sensors based exertion recognition using statistical features and random forest for physical healthcare monitoring. In Proceedings of the 2021 International Bhurban Conference on Applied Sciences and Technologies (IBCAST), Islamabad, Pakistan, 12–16 January 2021; pp. 512–517. [Google Scholar]
  37. Mohnen, S.M.; Rotteveel, A.H.; Doornbos, G.; Polder, J.J. Healthcare expenditure prediction with neighbourhood variables—A random forest model. Stat. Politics Policy 2020, 11, 111–138. [Google Scholar] [CrossRef]
Figure 1. Summary of Experimental Design.
Technologies 10 00122 g001
Figure 2. Performance comparison of the Dx code constructs for the outcome of inpatient mortality.
Technologies 10 00122 g002
Table 1. Description of the Dx classification systems and their role in the present study.
Dx Code SystemOriginRemarksRole in the Study
Principal Dx (ICD-10-CM)Developed by WHO and modified by the National Center of Health Statistics. Used in the US since 2015. The principal Dx in ICD-10-CM. This is used as the ground truth of this study. The ground truth of the present study
Admitting Dx (CD-10-CM)See aboveThe initial Dx, which, later, during the hospital stay is replaced by the principal Dx.Learn about the loss in predictive power due to clinical uncertainty
Diagnosis Related Group (MS-DRG)Generated by the ‘Grouper’ software from the ICD-10-CM codes, after the patient is discharged.Encapsulates information from principal and secondary Dx’s that qualify as complications or comorbidities. It has lower dimensionality than ICD-10-CM since it groups several similar ICD-10 codes under the same MS-DRG.Learn about information loss from the lower dimensionality of MS-DRGs and compensation due to the severity information MS-DRGs incorporate
Clinical Classification Software (CCS) old versionDeveloped in the framework of the HCUP project, under the umbrella of AHRQ.A clinical grouping of ICD-10 in ~500 categories. Despite specificity loss, since the grouping was performed with clinical relevance in mind, it is a useful Dx representation.Amount of predictive power lost compared to the ICD-10-CM representation
Clinical Classification Software Refined (CCSR)Recent refined version of CCS, developed in the framework of the HCUP project, under the umbrella of AHRQ.The CCSR for ICD-10-CM diagnoses balances the retention of the clinical concepts included in the old CCS categories and the specificity of ICD-10-CM diagnoses by creating new clinical categories.
(1)
Amount of predictive power lost compared to the ICD-10-CM representation
(2)
comparison of CCSR to the old version of CCS
Table 2. Description of dataset.
Feature NameInformation and Descriptive Statistics
Diagnosis Related Group CodeA total of 745 unique MS-DRG codes
Principal CCS code (old)A total of 251 unique CCS codes
Principal CCSR code (refined CCS)A total of 754 unique CCS code combos
Principal Dx codeA total of 8354 unique ICD-10-CM codes
Admitting Dx codeA total of 7657 unique ICD-10-CM codes
Age group<65 years: 102,721 (24.54%), 65–69 years: 69,527 (16.37%), 70–74 years: 62,244 (14.87%), 75–79 years: 56,414 (13.48%), 80–84 years: 50,575 (12.08%), >84 years: 77,048 (18.41%)
Female patients231,377 (55.28%)
Percent non-white90,313 (21.58%)
Type of admissionEmergency: 288,409 (68.91%), Urgent: 54,390 (12.99%), Elective: 71,859 (17.17%), Other: 3871 (0.9%)
Transferred from another hospital33,417 (7.98%)
Discharged dead10,922 (2.61%)
Length of StayMean = 5.35 days, Std. Dev. = 6.817 days
Table 3. Performance of classification experiments with different Dx code systems as predictors for inpatient mortality.
Recall (D)F-score (D)ROCPRC (D)
Dx Predictor(s)NBRandom ForestNBRandom ForestNBRandom ForestNBRandom Forest
1: Baseline (no Dx)0.0%0.0%n/a0.0%63.7%61.9%4.3%4.0%
2: Baseline + Principal ICD0.2%4.5%0.4%7.5%71.4%71.4%5.9%8.0%
3: Baseline + Principal CCS0.4%2.2%0.9%4.0%77.9%72.0%9.8%7.2%
4: Principal CCSR (refined)0.1%3.0%0.1%5.2%77.5%72.8%8.7%7.6%
5: Baseline + MS-DRG6.2%8.3%11.5%13.4%85.3%78.4%20.9%17.2%
6: Baseline + Admitting ICD0.1%5.3%0.3%8.8%69.3%66.5%6.2%8.0%
Table 4. Regression Analysis to compare the predictive power of Dx code systems for the outcome of inpatient LOS.
Dx Predictor(s)R2Mean abs. err. (days)Root Mean sqr. err.Root Relative sqr. err.
1: Baseline (no Dx info)6.29%3.525.8196.81%
2: Baseline + Principal ICD-1010.82%3.345.9398.84%
3: Baseline + Principal CCS 15.83%3.225.5091.75%
4: Baseline + Principal CCSR (refined)15.92%3.195.5191.82%
5: Baseline + MS-DRG30.38%2.895.0183.49%
6: Baseline + Admitting ICD-10 12.94%3.335.6794.60%
Publisher’s Note: MDPI stays neutral with regard to jurisdictional claims in published maps and institutional affiliations.

