Article

Open-Source Photovoltaic—Electrical Vehicle Carport Designs

by
Nicholas Vandewetering
1,
Koami Soulemane Hayibo
2 and
Joshua M. Pearce
2,3,*
1
Department of Civil & Environmental Engineering, Western University, London, ON N6A 3K7, Canada
2
Department of Electrical & Computer Engineering, Western University, London, ON N6A 3K7, Canada
3
Ivey School of Business, Western University, London, ON N6A 3K7, Canada
*
Author to whom correspondence should be addressed.
Technologies 2022, 10(6), 114; https://doi.org/10.3390/technologies10060114
Submission received: 12 September 2022 / Revised: 27 October 2022 / Accepted: 3 November 2022 / Published: 7 November 2022

Abstract

:
Solar powering the increasing fleet of electrical vehicles (EV) demands more surface area than may be available for photovoltaic (PV)-powered buildings. Parking lot solar canopies can provide the needed area to charge EVs but are substantially costlier than roof- or ground-mounted PV systems. To provide a low-cost PV parking lot canopy to supply EV charging, in this study, we provide a full mechanical and economic analysis of three novel PV canopy systems: (1) an exclusively wood, single-parking-spot spanning system, (2) a wood and aluminum double-parking-spot spanning system, and (3) a wood and aluminum cantilevered system for curbside parking. All three systems can be scaled to any amount of EV parking spots. The complete designs and bill of materials (BOM) of the canopies are provided, along with basic instructions, and are released with an open-source license that will enable anyone to fabricate them. Analysis results indicate that single-span systems provide cost savings of 82–85%, double-span systems save 43–50%, and cantilevered systems save 31–40%. In the first year of operation, PV canopies can provide 157% of the energy needed to charge the least efficient EV currently on the market if it is driven the average driving distance in London, ON, Canada.

1. Introduction

Solar photovoltaic (PV) technology, a long-established sustainable source of electricity [1], has overcome the historic barrier of cost, with rapid declines [2]. PV electricity generation is now often less expensive than conventional power sources [3]. Unsurprisingly, PV technology has driven [4] the penetration of renewable energy into the grid [5]. The growth of low-cost solar power is expected to continue in the short term [5].
This growth is important because although conventional electric loads are declining, demand is expected to grow [6] due to the growth in the popularity of electric vehicles (EVs) [7]. Like PV, plug-in hybrid electric vehicles (PHEV) are becoming increasingly important as the sales of EVs expand to 2.2% of the global vehicle market [8]. This EV market share is set to expand to 30% by 2040 [9], which is identical to BP’s prediction for PV in the same year [10]. The rapid rise of PV to displace both fossil fuels and EV (driving even more electricity demand) presents a challenge with respect to finding appropriate surface area [11]. Studies on roof area for PV [12,13,14] including building-integrated PV (BIPV) [15,16], can account for some of the demand [17]; however, more area is required than that which can be provided by roof surfaces [18].
One interesting method to kill two birds with one stone is to utilize the stranded assets of non-productive parking lot areas as solar farms with solar carports. PV canopies located over parking spaces can enable sustainable electricity production [19,20,21,22,23]. Such solar carports can be used to directly feed electricity to the grid or act as an anchor for a local microgrid [24]. PV can be used for EV charging, in addition to increasing revenue for retail stores [25]. Many studies have investigated the design and optimization of solar systems for EV charging [26] as a core component of a sustainable strategy [27]. EVs can be charged at work under such canopies [28,29,30] and can even be integrated into the grid to overcome intermittency via vehicle-to-grid implementations [31,32,33,34]. Even at-home use of PV and EV charging can create a nanogrid [35]. PV and vehicle-to-grid applications appear viable [36,37,38].
One of the primary reasons that all parking lots are not already covered with PV canopies is the associated capital costs, which are more expensive than conventional ground-mounted PV and roof-mounted PV, primarily due to the capital cost of the structure (or racking) for the PV, which must be up more than six feet above the ground. Current systems are designed almost entirely using galvanized steel or aluminum framing. However, many wooden and steel hybrid canopies designed for single-car parking are available, with capital costs as low as CAD 4995, but are not approved for PV installation [39,40,41]. Most of these systems are built at a five-degree pitch to minimize wind loading and have a minimum clearance of 2.4 m from the ground [42]. Although adequate for most EVs, this clearance may not be suitable for larger planned EVs in the future [43]. These carport systems typically span one to two vehicles before requiring a column, but heavy industrial-level carports have been made to span up to three vehicles [44]. For example, a single-vehicle 4.8 kW system costs CAD 7230.85 (CAD 1.51/W), and a 5 kW system costs CAD 6512.17 (CAD 1.30/W) [45]. A proposed 160 kW project in Alberta exclusively using aluminum for the carports has a structural cost of CAD 230,000, which equates to CAD 1.43 per W [46]. Thus, typical systems currently cost anywhere from CAD 1.30 to 1.50 per W.
A recent successful approach to reducing the capital cost of PV racking for ground-mounted systems is designs using wood [47,48]. In addition to substantial cost advantages in North America, wood is sustainable [49], renewable, and comprises approximately half carbon, so it can be thought of as a carbon sink [50]. As wood requires relatively low energy processing, it has a negative combined embodied energy and carbon relative alternative materials conventionally used for racking. For example, most PV racking is aluminum, and even with a third being recycled material, aluminum has over five times the embodied CO2e/kg of wood [51].
Thus, to provide a low-cost PV parking lot canopy to supply EV charging, in this study, we provide a full mechanical and economic analysis of three novel PV canopy systems with a 25-year expected lifetime to match a standard PV warranty: (1) an exclusively wood, single-parking-spot spanning system, (2) a wood and aluminum double-parking-spot spanning system, and (3) a wood and aluminum cantilevered system. The designs are presented as five- and six-stall builds, but all three systems are entirely scalable to any amount of parking spots as required. The complete designs and bill of materials (BOM) of the canopies are provided, along with basic instructions, and are released with an open-source license that will enable anyone to fabricate them. The BOM costs are compared to the cost of proprietary commercial PV canopies. The PV panels that the canopies are able to hold are simulated, and the solar energy produced is compared to the average electric load for an EV. The results of this study are discussed in the context of using low-cost PV canopies to provide the necessary electricity to charge EVs.

2. Materials and Methods

2.1. Material Properties

No. 2 SPF pressure-treated lumber and ASTM-approved hardware that is easily accessible at typical hardware stores was used for the proposed design. Pressure-treated lumber is known for its effective moisture resistance, high supply in North American economies, and low cost, making it an ideal material for structural use in wet climates. Pressure-treated lumber can last upwards of 40 years, depending on the moisture conditions [52]. The material properties for this species of wood are described by Vandewetering et al. [47], and the following properties summarized in Table 1 are used for the structural analysis of these systems. These designs carefully follow the guidelines of the National Building Code of Canada (NBCC) [53] and the National Design Specification for wood construction [54] to ensure the structures are safe and serviceable for at least 25 years to match common PV warranties.
6061 T6 aluminum is an exceptional corrosion-resistant material with a high strength-to-weight ratio that is widely available in the retail market. To allow for longer spans that are beyond the capacity of pressure-treated lumber, two of the proposed systems utilize 6061 T6 aluminum I beams. The mechanical properties, provided by Metal Supermarkets in London [55], used for analysis are summarized in Table 2. Aluminum Design Code CSA S157-05 [56] is followed with respect to the strength of the aluminum designs.
Using these allowable stress capacities, a structural analysis based on system location can be conducted following the steps shown in Appendix A. The general equations and diagrams can be adapted using any design load calculated in the NBCC to ensure the allowable stresses are not exceeded. This process should be carefully followed for other regions to determine whether the design load must be increased or if it can be decreased. If there is a significant difference between the applied load and the resisting capacity of any member in the structural analysis, then users can select smaller members and recalculate to save material costs. If a structural material capacity listed in [47] is exceeded, then the next size up should be chosen and analyzed to ensure adequate capacity.

2.2. Economic Analysis

A detailed economic analysis based on the bill of materials is conducted. The cost of these systems is based on local purchases, and because the system has the potential to be a DIY system, the labor cost is not factored into the base case study. Future studies can be conducted to compare the labor cost differential (if there is any with more conventional racking structures). The comparison between the cost of the different racking systems is done on a per W basis, which is calculated by dividing the total system cost by the amount of PV power installed onto the system. Because these systems are scalable, a sensitivity analysis is conducted to compare the cost per W of systems with varying sizes. Additionally, because both wood and aluminum are subject to highly varying price fluctuations, sensitivity analyses are conducted on the total system cost based on the commodity prices of the materials of which they are composed. Finally, a sensitivity analysis is performed to account for the price difference depending on the locations in the world based on the local availability of the building materials.

2.3. Design Analysis Assumptions

Many of the design analysis assumptions considered in [47] were used for the systems proposed in the present study. The following assumptions are commonly made in the design of code-compliant structures and are conservative to ensure that a safe and serviceable design is established.
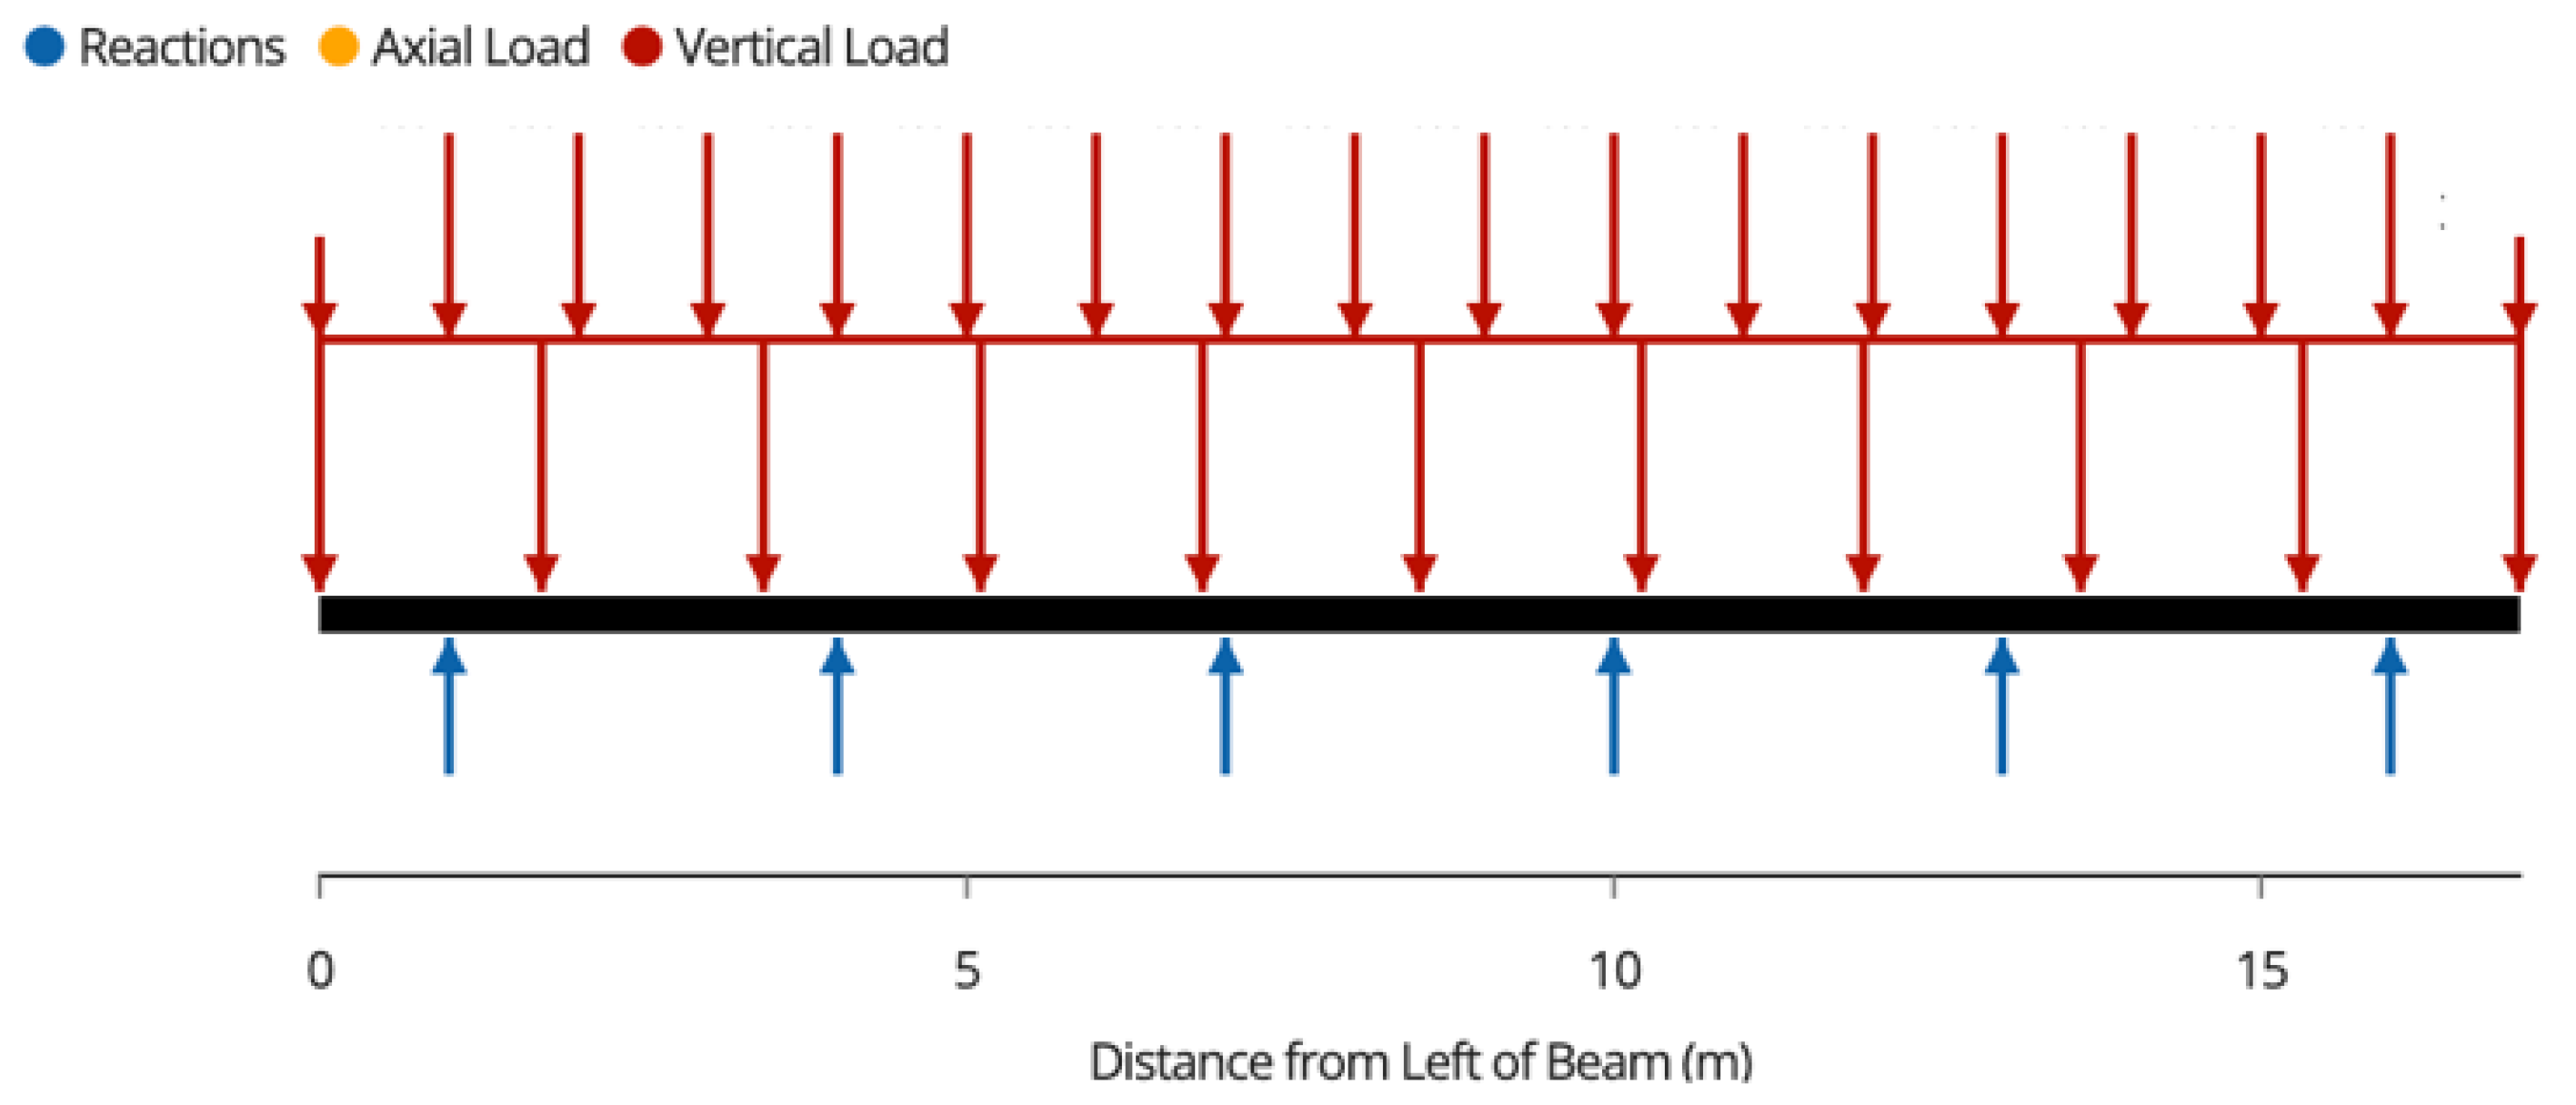
  • All loads act perpendicular to the face of the modules so joists experience the worst-case flexural load;
  • All members are idealized as pins connected with no fixed-end moments, as joist hangers and brackets allow for rotation [57];
  • The wind load and snow load are only applied to the surface of the modules because the accumulation of snow on structural members is practically negligible;
  • The wind load and snow load are assumed to be distributed evenly throughout the surface of the modules because snow and wind accumulation is only considered for large structures, as per NBCC 4.1.6 [51]; and
  • The modules can be idealized as a one-way slab, as the length-to-span ratio is greater than 2 [58].

2.4. Electrical Analysis

A realistic energy production and load-matching analysis is performed to evaluate the contribution of the solar PV installed on the carport to EV charging power. System Advisor Model (SAM) software is used in this study to evaluate the energy production of the PV system [59]. SAM is preferred to other PV simulation software because its results are validated with real-world data, and its operation is open-source [60]. Furthermore, SAM has access to a large database of weather data from satellite measurements and weather stations. The simulation is run for two locations in North America. London, Ontario, Canada, is chosen to represent cold climates with long periods of snow, whereas Los Angeles is selected as a high-solar-flux location that has fewer winter days.

2.4.1. EV Charging Station Load Assumptions

Estimating EV charging station load is challenging, owing to the variety of EV car specifications and charging patterns. The battery capacity EVs currently on the market varies between 16.7 kWh and 118 kWh [61]. Furthermore, the charging time can vary depending on the charge voltage, the vehicle user, and the location where the vehicle is charging. To standardize EV charging station electrical features, North American EV charging standards define three power levels [62]. A level 1 power charge station has a maximum power level of 1.4 kW and a charging time of between 4 and 11 h and is suitable for use in homes or offices. A level 2 station is preferred for offices and public parking, although it can also be installed in homes; it has a power level of 8 kW and a charging time range of 2 to 6 h. The power of a level 3 charging station is either 50 kW or 100 kW and is intended for fast charging of large vehicles, such as public electric buses; it has a fast-charging time ranging from 0.4 to 1 h and 0.2 to 0.5 h for 50 kW and 100 kW stations, respectively. Other types of charging stations exist but are vehicle-specific [63].
Despite the power rating of the charging station, the actual power drawn by EVs depends on the charging state. The charging power profile is not constant and varies with the state of charge of the EV, the charging voltage, and the charging current. An EV charging profile, at the base level, has a constant-current charging mode, followed by a constant-voltage charging mode [64,65]. The authors of a recent paper proposed a percentage load profile curve for EV users for different charging sites, whether home or work, and different days of the week [66]. The load profiles proposed by Zhang et al. were also provided for each gender, but for uniformity of the simulation, the average between male and female EV load profiles is used here. The percentage load profile is applied to the charging stations defined by the North American Standard to obtain load profiles in kW. The load profiles are arranged to form a full year of EV load data for the energy simulation in SAM for each type of charging site, with each week consisting of 5 weekdays and 2 weekends. Details of the load profile estimation are described by Zhang et al. [66].

2.4.2. Solar PV Model Assumptions and Simulation

Solar PV energy production is simulated for a year using realistic weather data, real solar PV modules, and real inverter specifications in SAM. The PV energy is simulated for a single carport (15 modules). A single carport is chosen because the results can be scaled proportionally. As per the dimensions of the carport design, each module has an area of 2 m by 1 m and a power of 410 WDC, accounting for 6.15 kWDC total DC power. The tilt of the PV modules is constrained by the carport mechanical design tilt of 5°. An optimal orientation of due south (azimuth of 180°) is assumed. The detailed input parameters of the SAM simulation are shown in Table 3.
Owing to the complexity of the EV load estimation described previously, two separate simulations are performed. The first simulation focuses on load matching between the proposed PV carport and the different types of charging stations described in Section 2.4.1. The PV simulation is performed hourly, and the results are compared to the EV charging station load profiles. Specifically, the hourly load profile of the charging stations is compared to the hourly energy production for load matching, assuming 24-7 charging of multiple EVs, in order to provide insights with respect to how the PV and EV charging station would interact in time-of-use rate structures or for systems that would store PV-generated electricity in an onsite battery to ensure full self-consumption for EV charging as a function of the type of charger.
In the second simulation, the simplest case in which net metering is in effect (meaning that the prosumer pays only for the net energy used on an annual basis) is analyzed for a single carport used to charge a single EV. The annual energy production of the PV and the annual energy demand of the EV are compared to determine whether the total production of the PV system can cover the EV demand with the support of the grid. This second analysis scenario is centered around a single EV, not the charging station. The annual energy consumed by a single EV is determined by multiplying the energy efficiency (Wh/km) of the vehicle by the average distance driven per year. For example, in London, Ontario, the average annual distance travelled is 16,000 km [68]. To account for the variability of EV energy efficiencies, a sensitivity analysis is run using the efficiencies of EVs currently available on the market (between 109 and 295 Wh/km) [69].

3. Results

All three system types were successfully designed and modeled to exceed Canadian building code and thus has a life expectancy of 25 years, which matches the warranty of the PV modules.

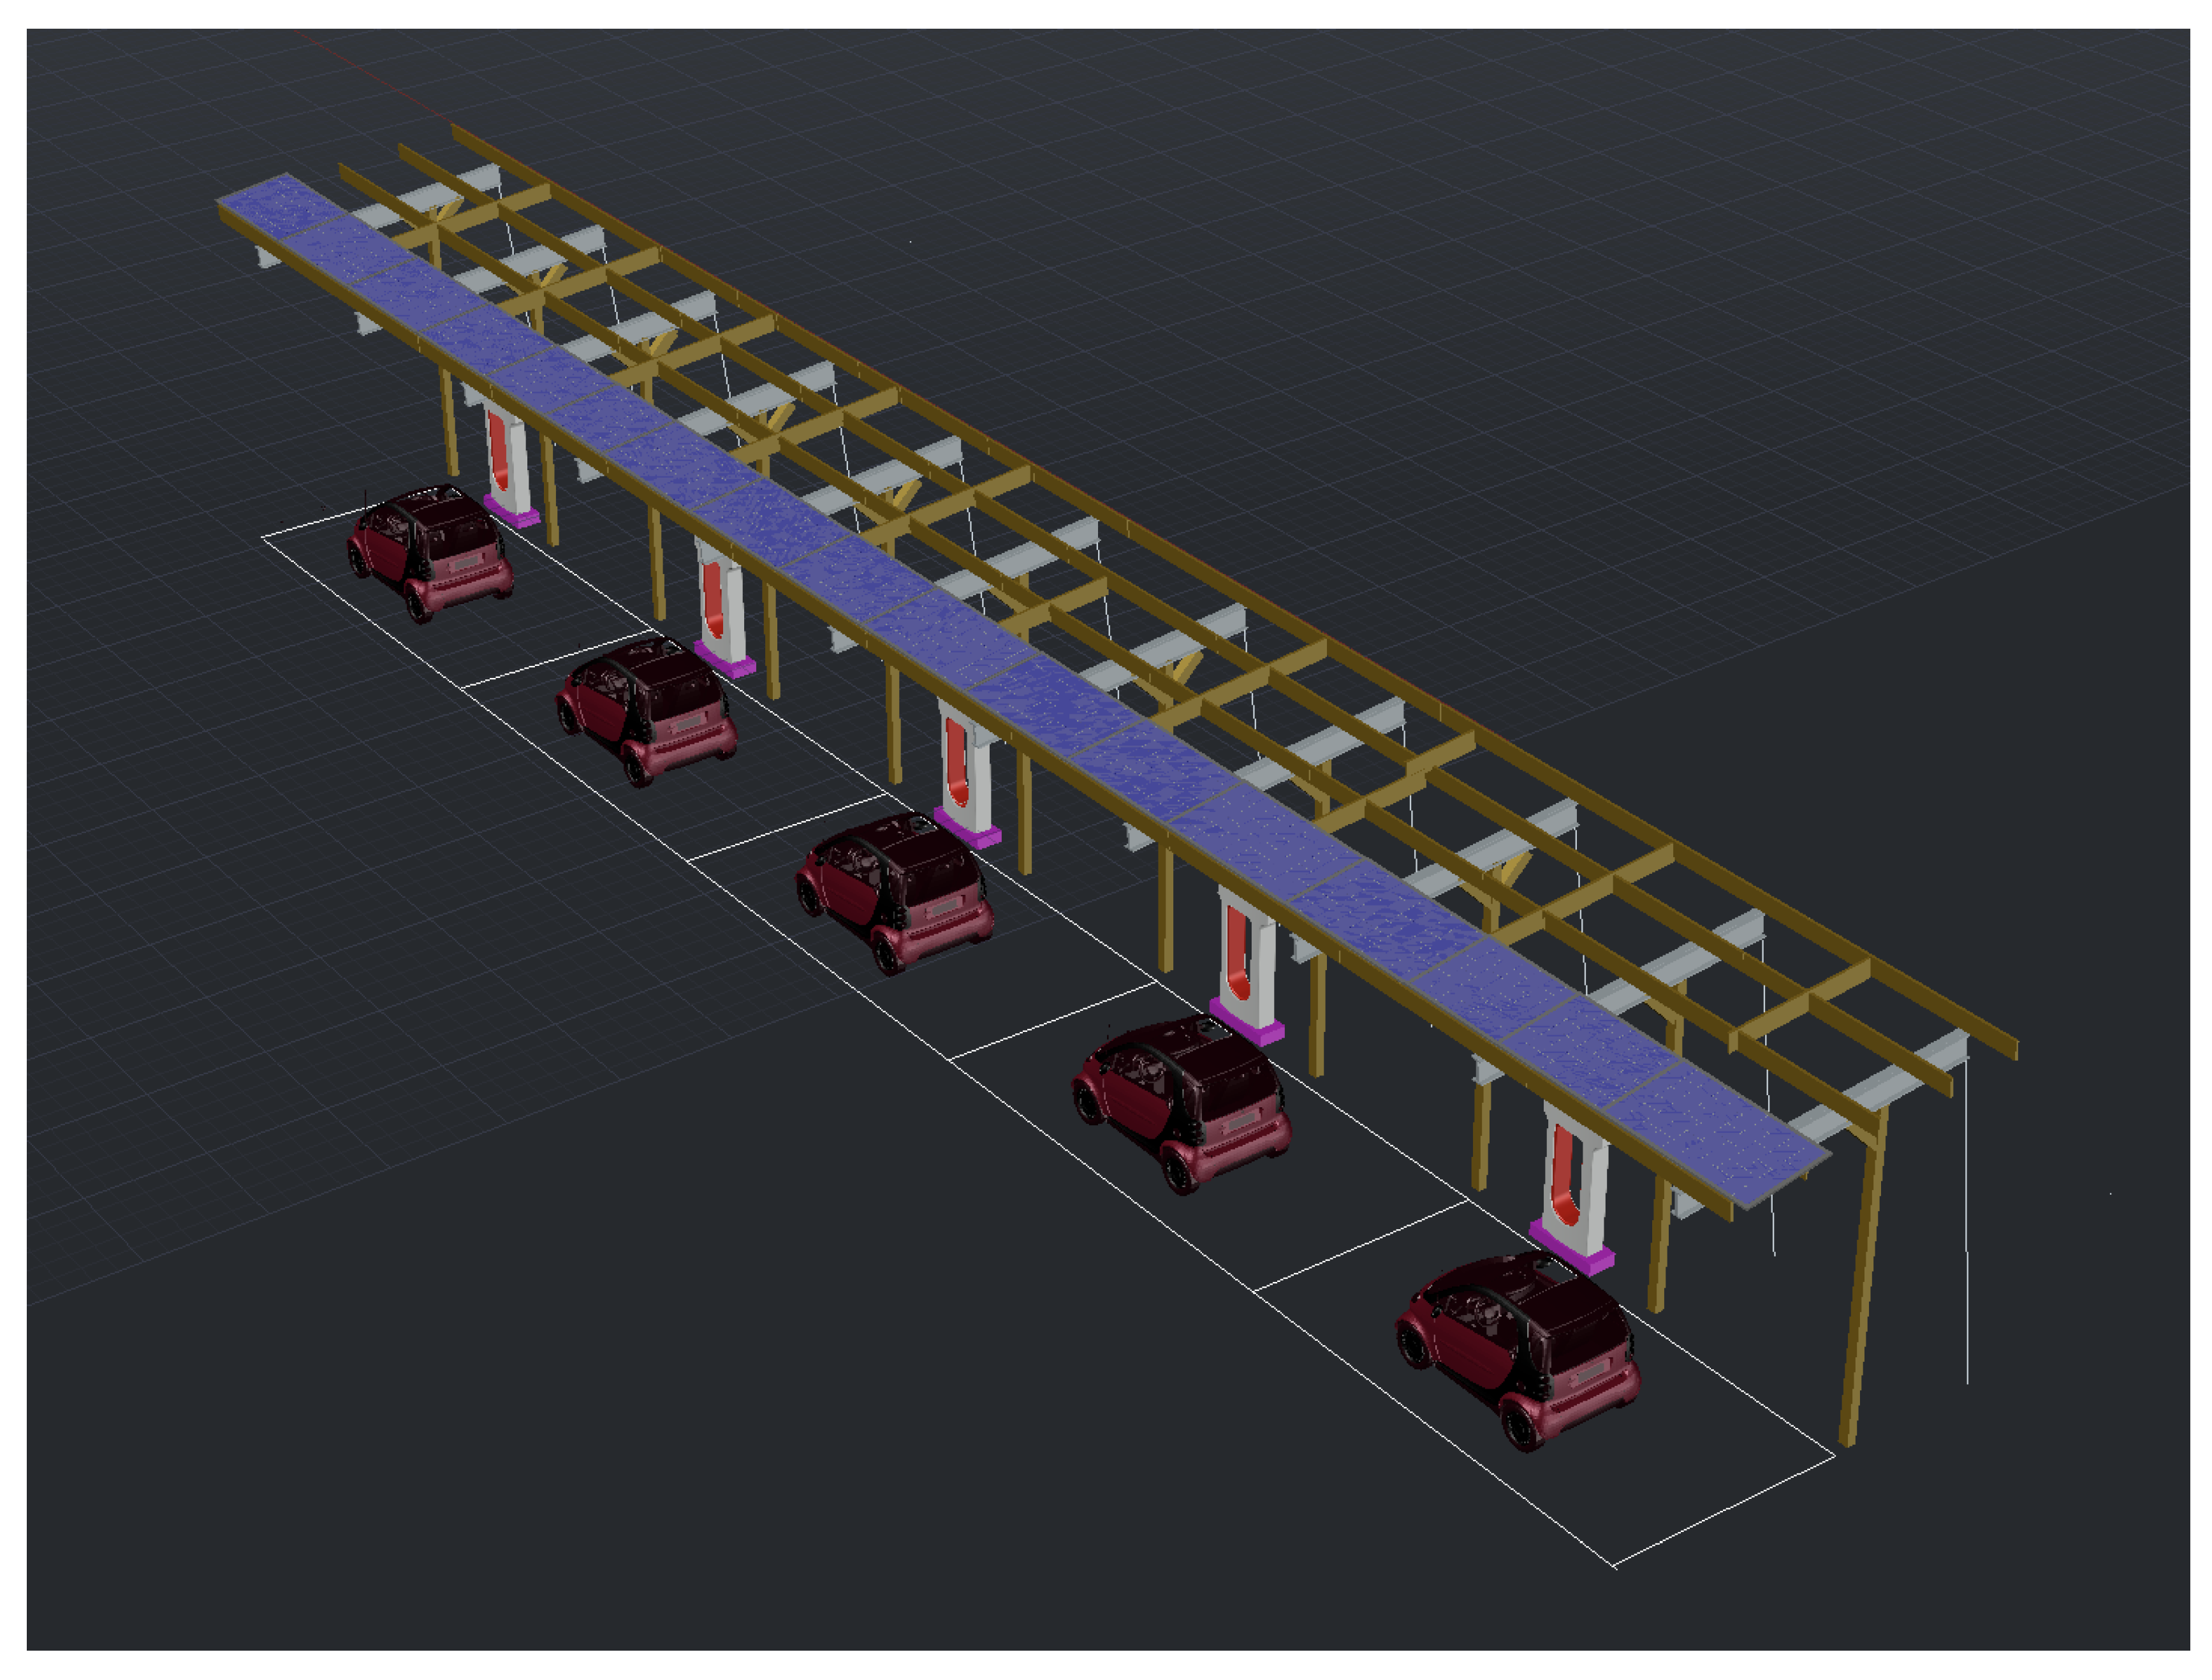
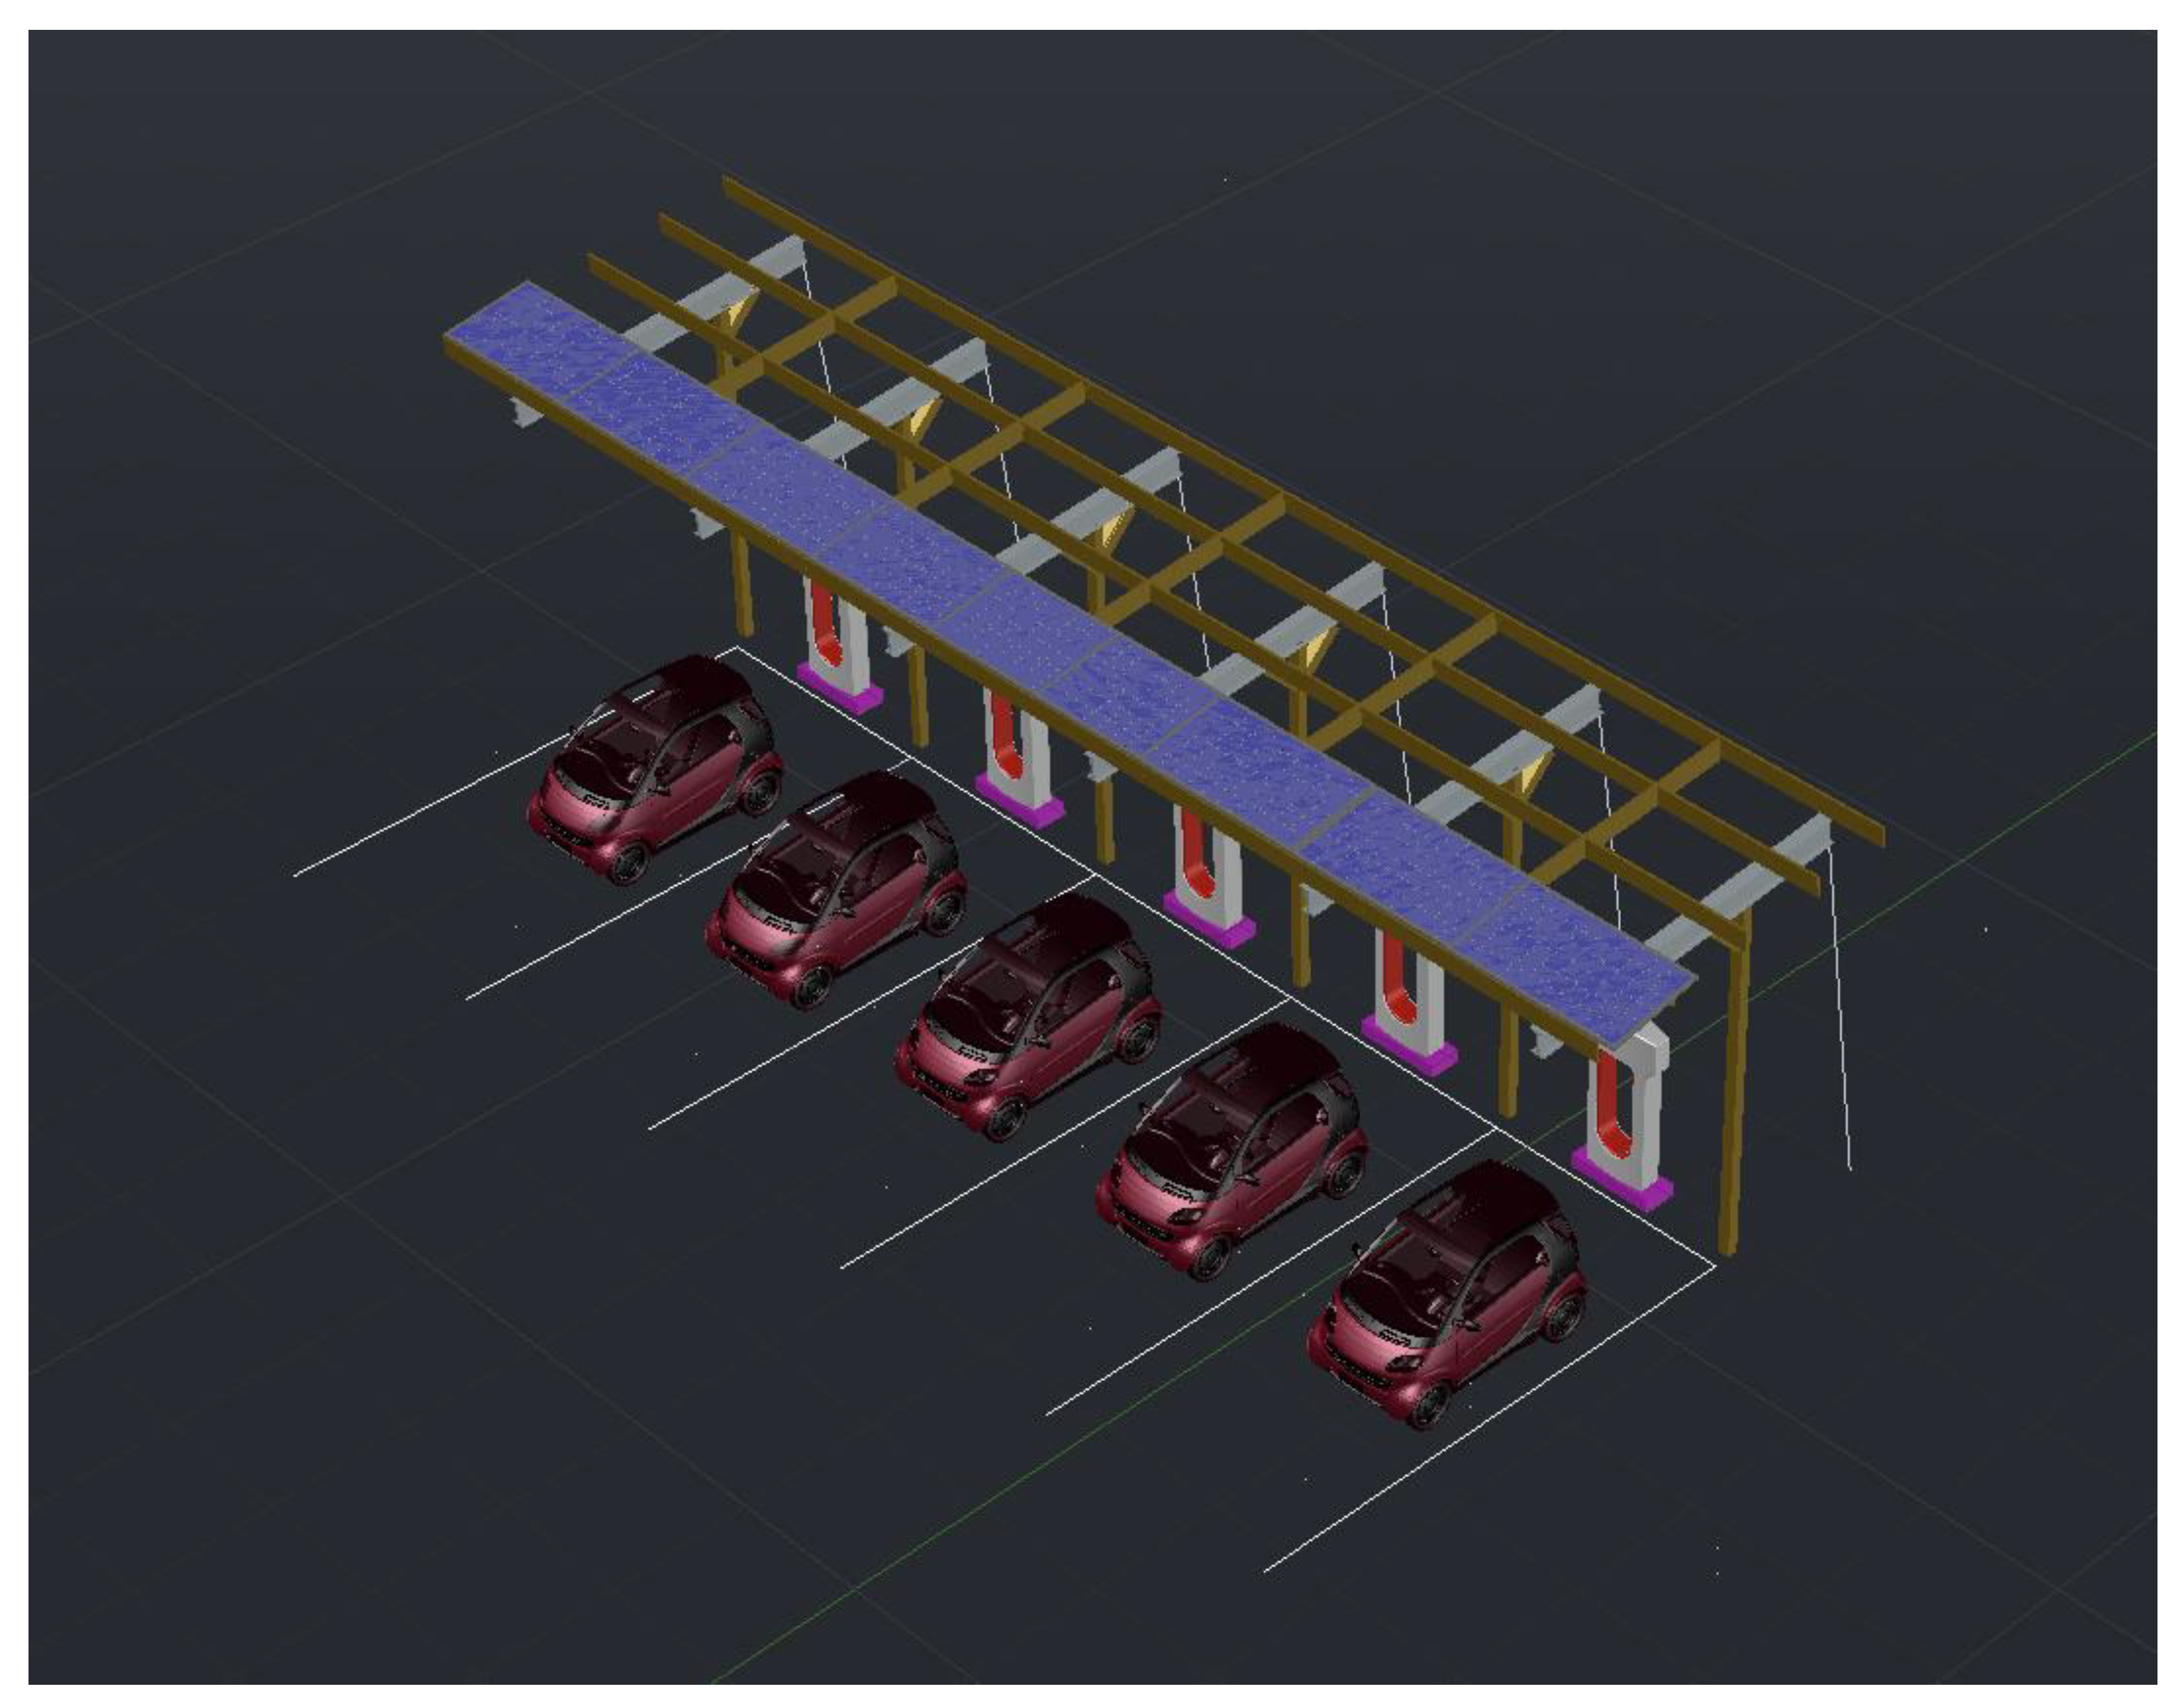
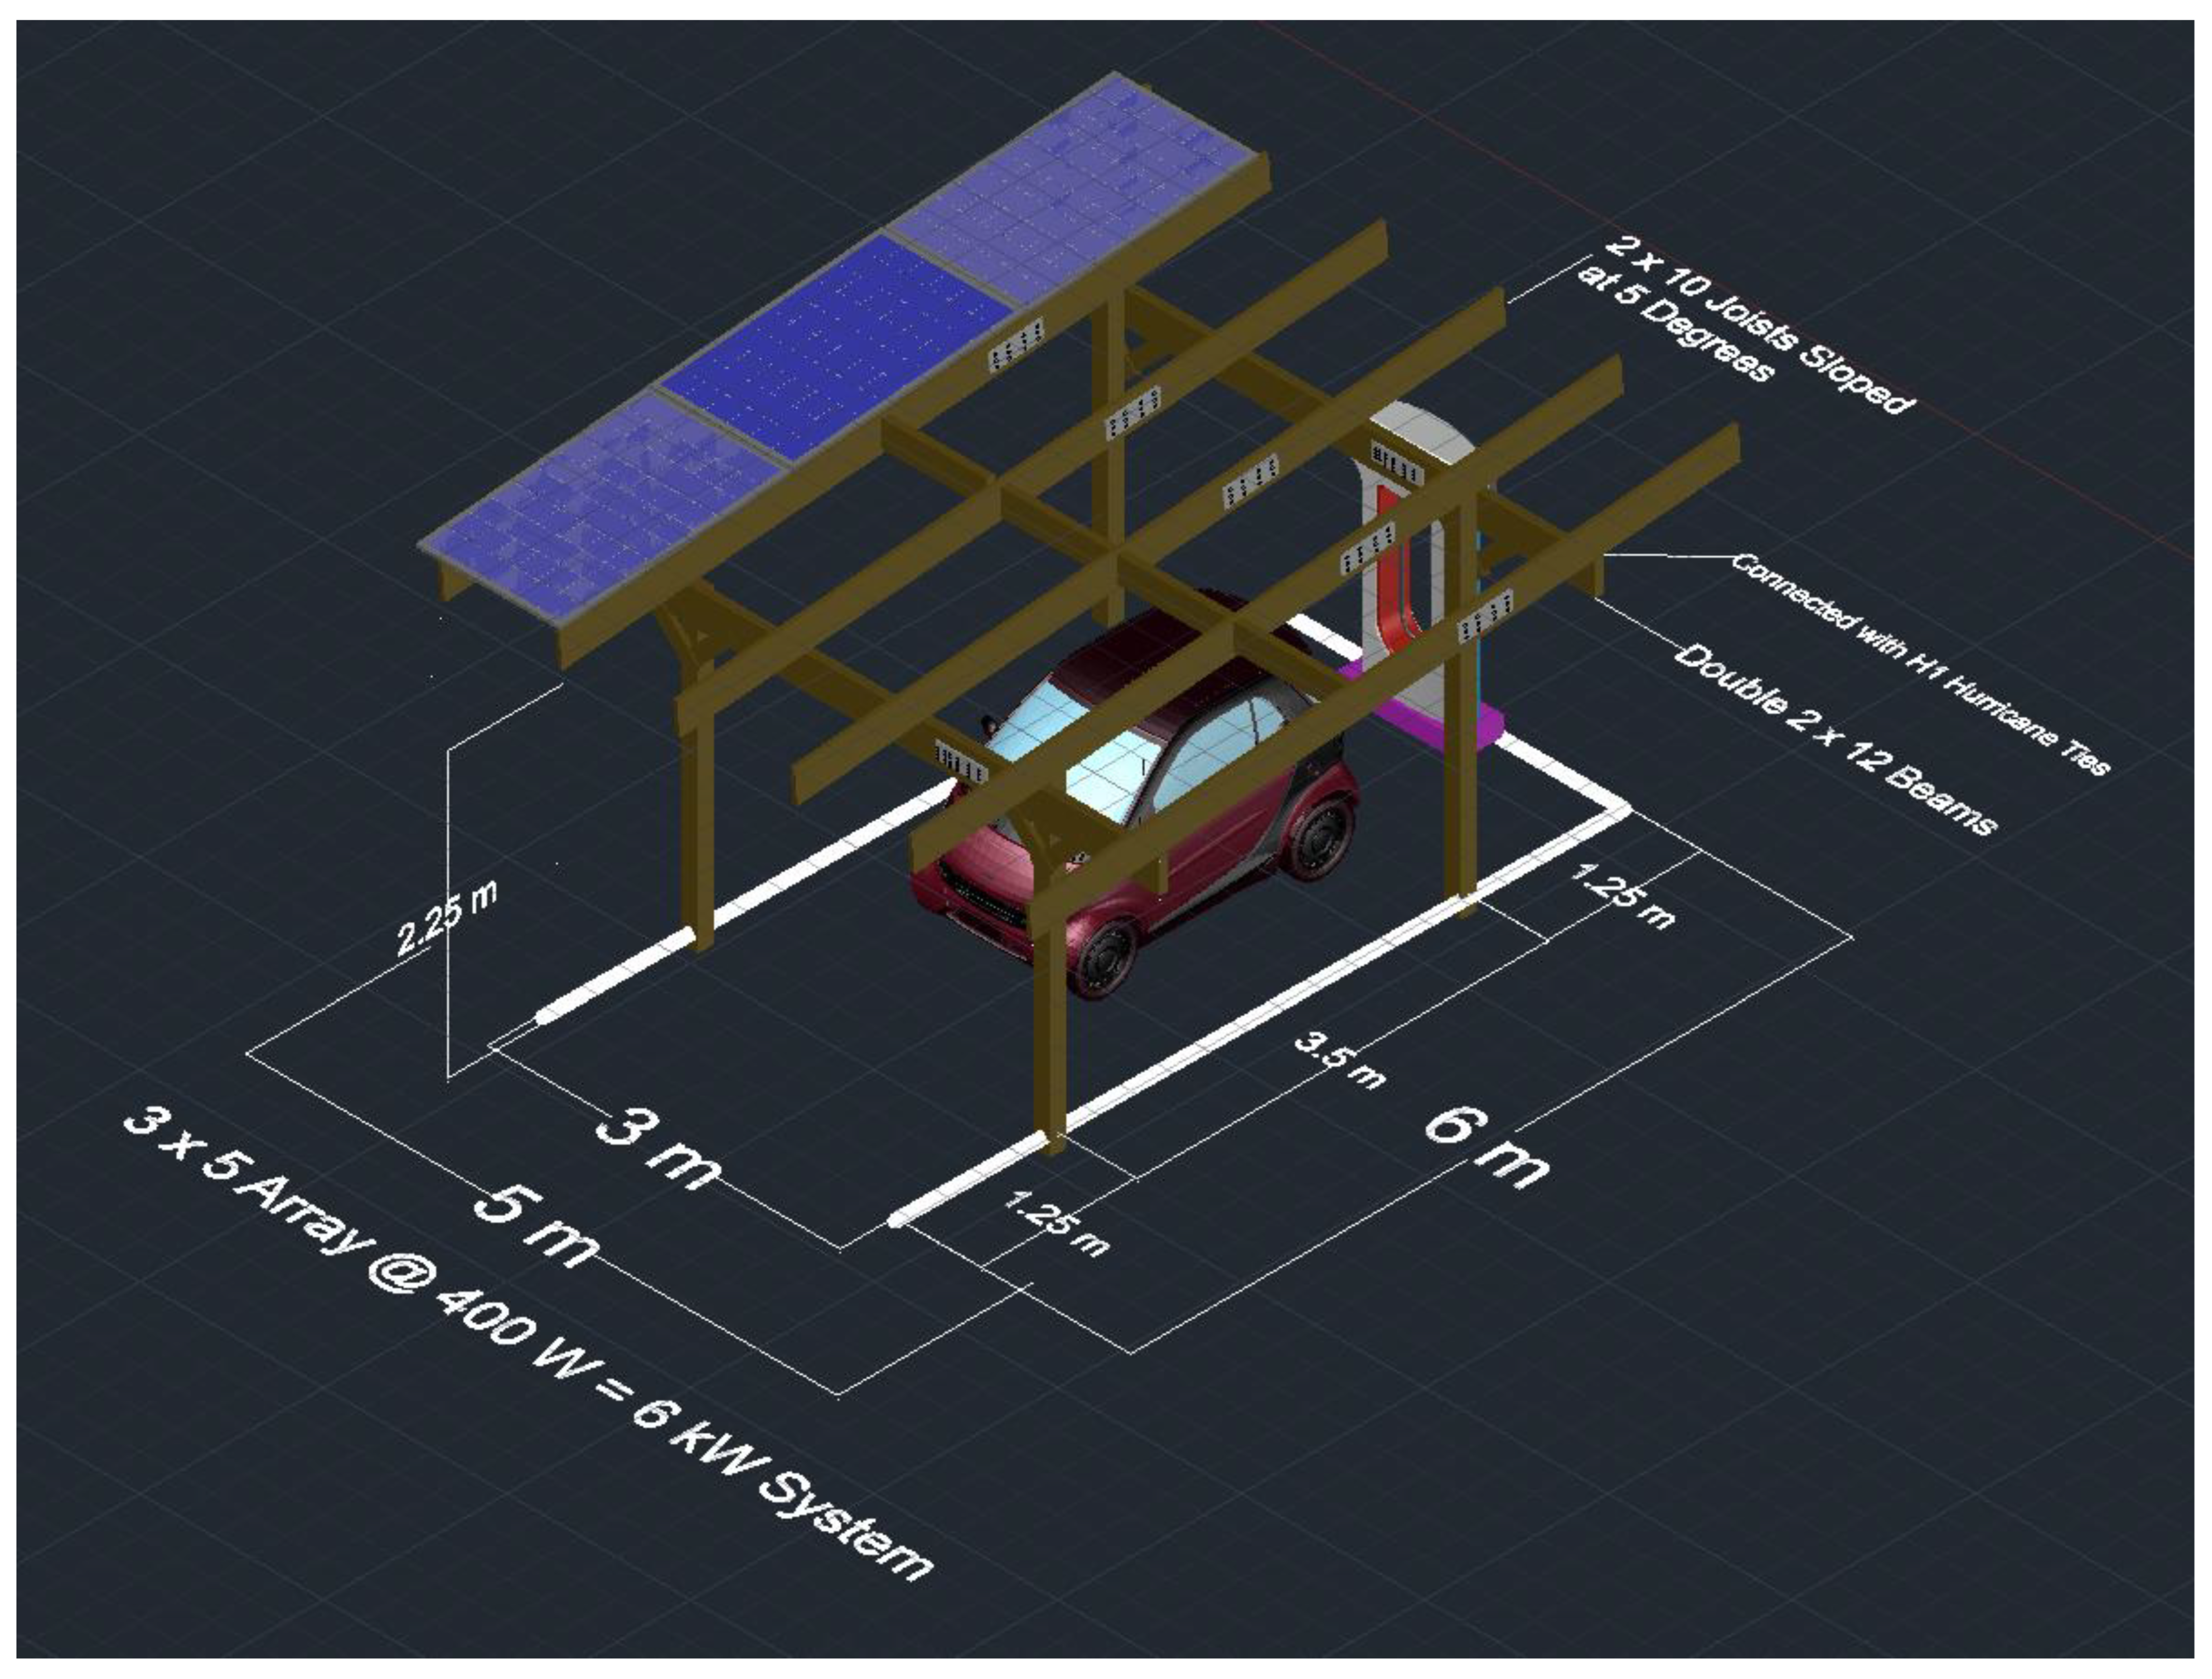
3.1. Single Spanning System

3.1.1. Single Spanning System Bill of Materials

The bill of materials (BOM) of the single-span system is shown in Table 4 in Canadian dollars sourced from Copp’s Build-All, London, and Metal Supermarkets, London.

3.1.2. Single Spanning System Assembly Instructions

To begin, 6 × 6 posts are installed 1.2 m into the ground to penetrate the frost line. Footing sizes are to be calculated using Equation (A2) in Appendix A. The front and back posts are to be cut into 3.10 m and 3.40 m, respectively. Footings are to be made 1.25 m away from the edge of each parking line as outlined in Figure 1.
Then, double 2 × 12 beams are installed onto the posts as shown in Figure 2a. 3/8″ × 10″ galvanized carriage bolts are used for each connection (Figure 2b). To build larger systems, splice joints connect the beams together using mending plates and joist hanger nails (Figure 2c). Splices should be made approximately 20% of a span length away from a post, where the bending moment diagram in Appendix A is roughly 0.
Then, the single 2 × 10 joists are installed with 1 m spacing onto the beams as shown in Figure 3a. Again, splice joints with 3 × 5 mending plates and joist hanger nails are made at 20% of the midspan length. 1 m long 2 × 10 s are placed between the joists to serve as lateral bracing. The joists are connected to the beams via H1 hurricane ties as described in Figure 3b.
Modules are installed directly onto the joists with ¼″ × 2-1/2″ lag screws as shown in the newly proposed Sadat et al. frame design shown in in Figure 4a, or modules can be installed from the side if they adopt the second Sadat et al. frame design [70] as shown in Figure 4b.
If a direct connection cannot be made, extra blocks of wood can be made and installed onto the joists, and carriage bolts, nuts and washers can be installed on the overhanging block as shown in Figure 5.
The finished system is shown in Figure 6. The system can be disassembled in the reverse manner it was built.

3.2. Double Spanning System

3.2.1. Double Spanning System Bill of Materials

The BOM of the two-span system is shown in Table 5 in Canadian dollars sourced from Copp’s Build-All, London, and Metal Supermarkets, London.

3.2.2. Double Span System Assembly Instructions

6 × 6 posts are installed in the same manner as the single span system, but now are spaced 2 parking spots apart. 4 × 8 × 0.270 T1 6061 aluminum beams are connected on top of the posts. Connections are secured with 4 self-tapping screws installed from the bottom flange, down to the bottom of the wood post. Aluminum beams may be available in full lengths, but splice joints can be made to satisfy supply and transportation constraints. Joists and braces are connected in the same manner as the single span system. The final system is shown in Figure 7.

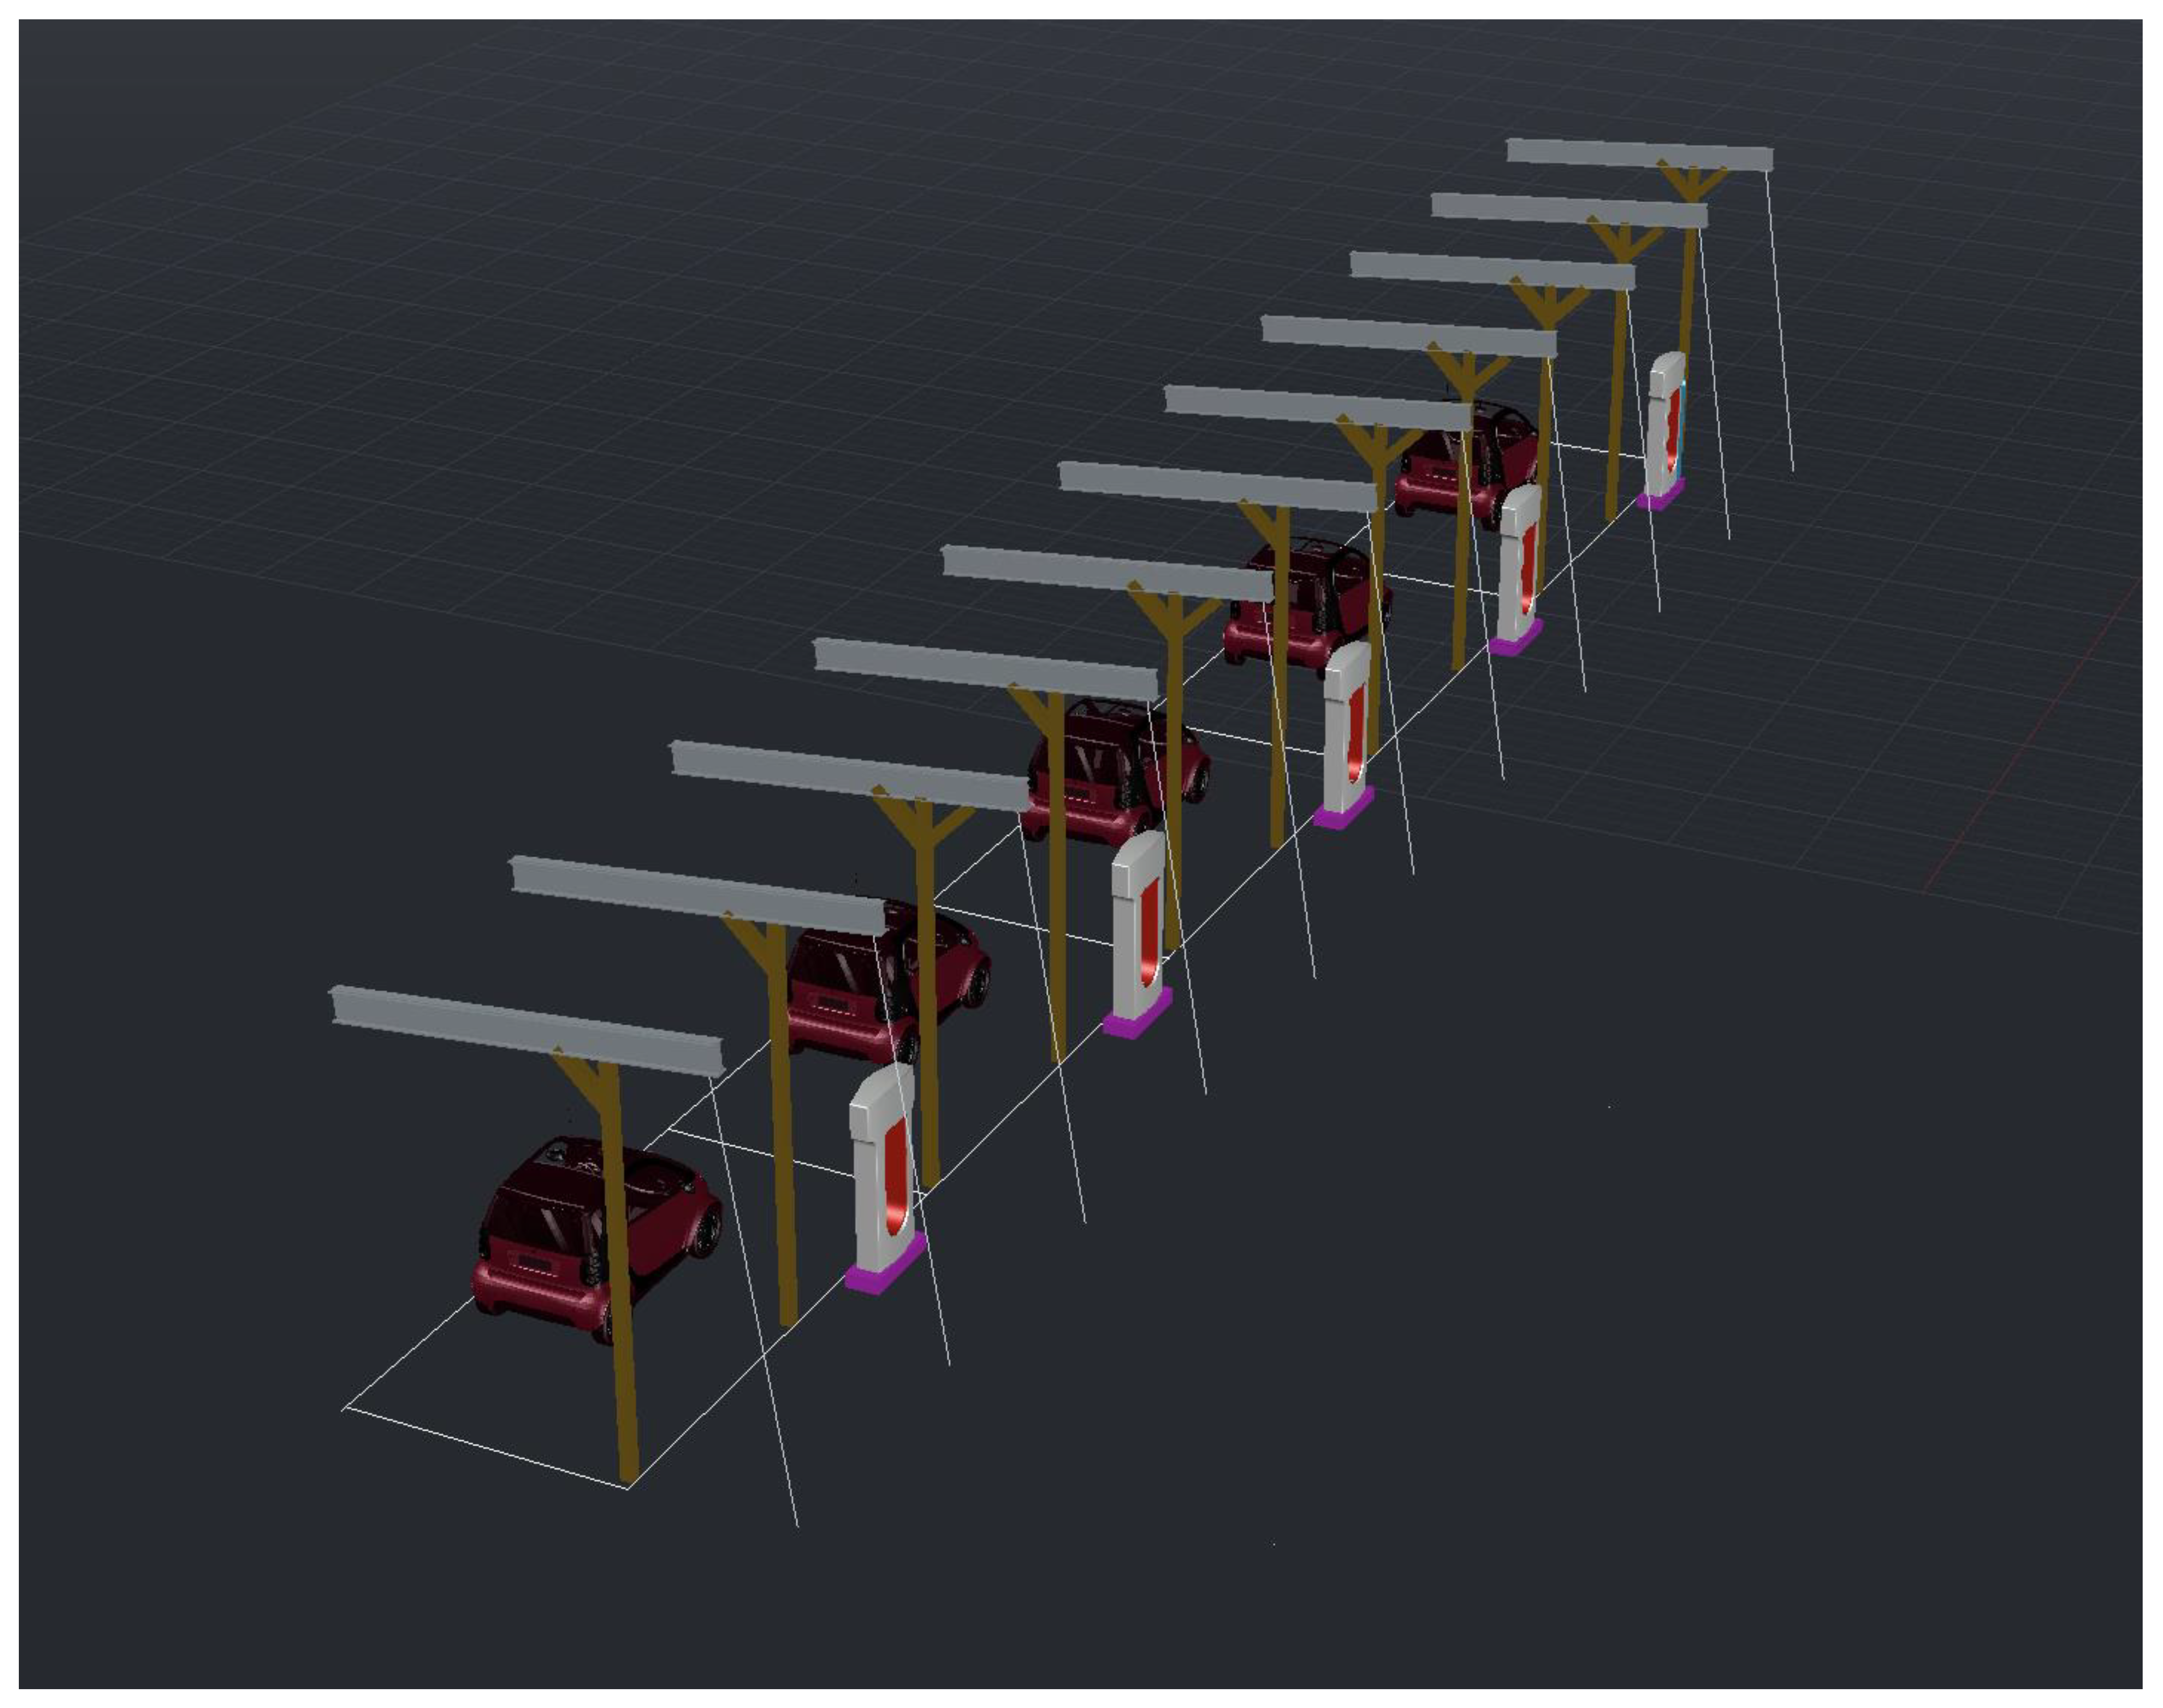
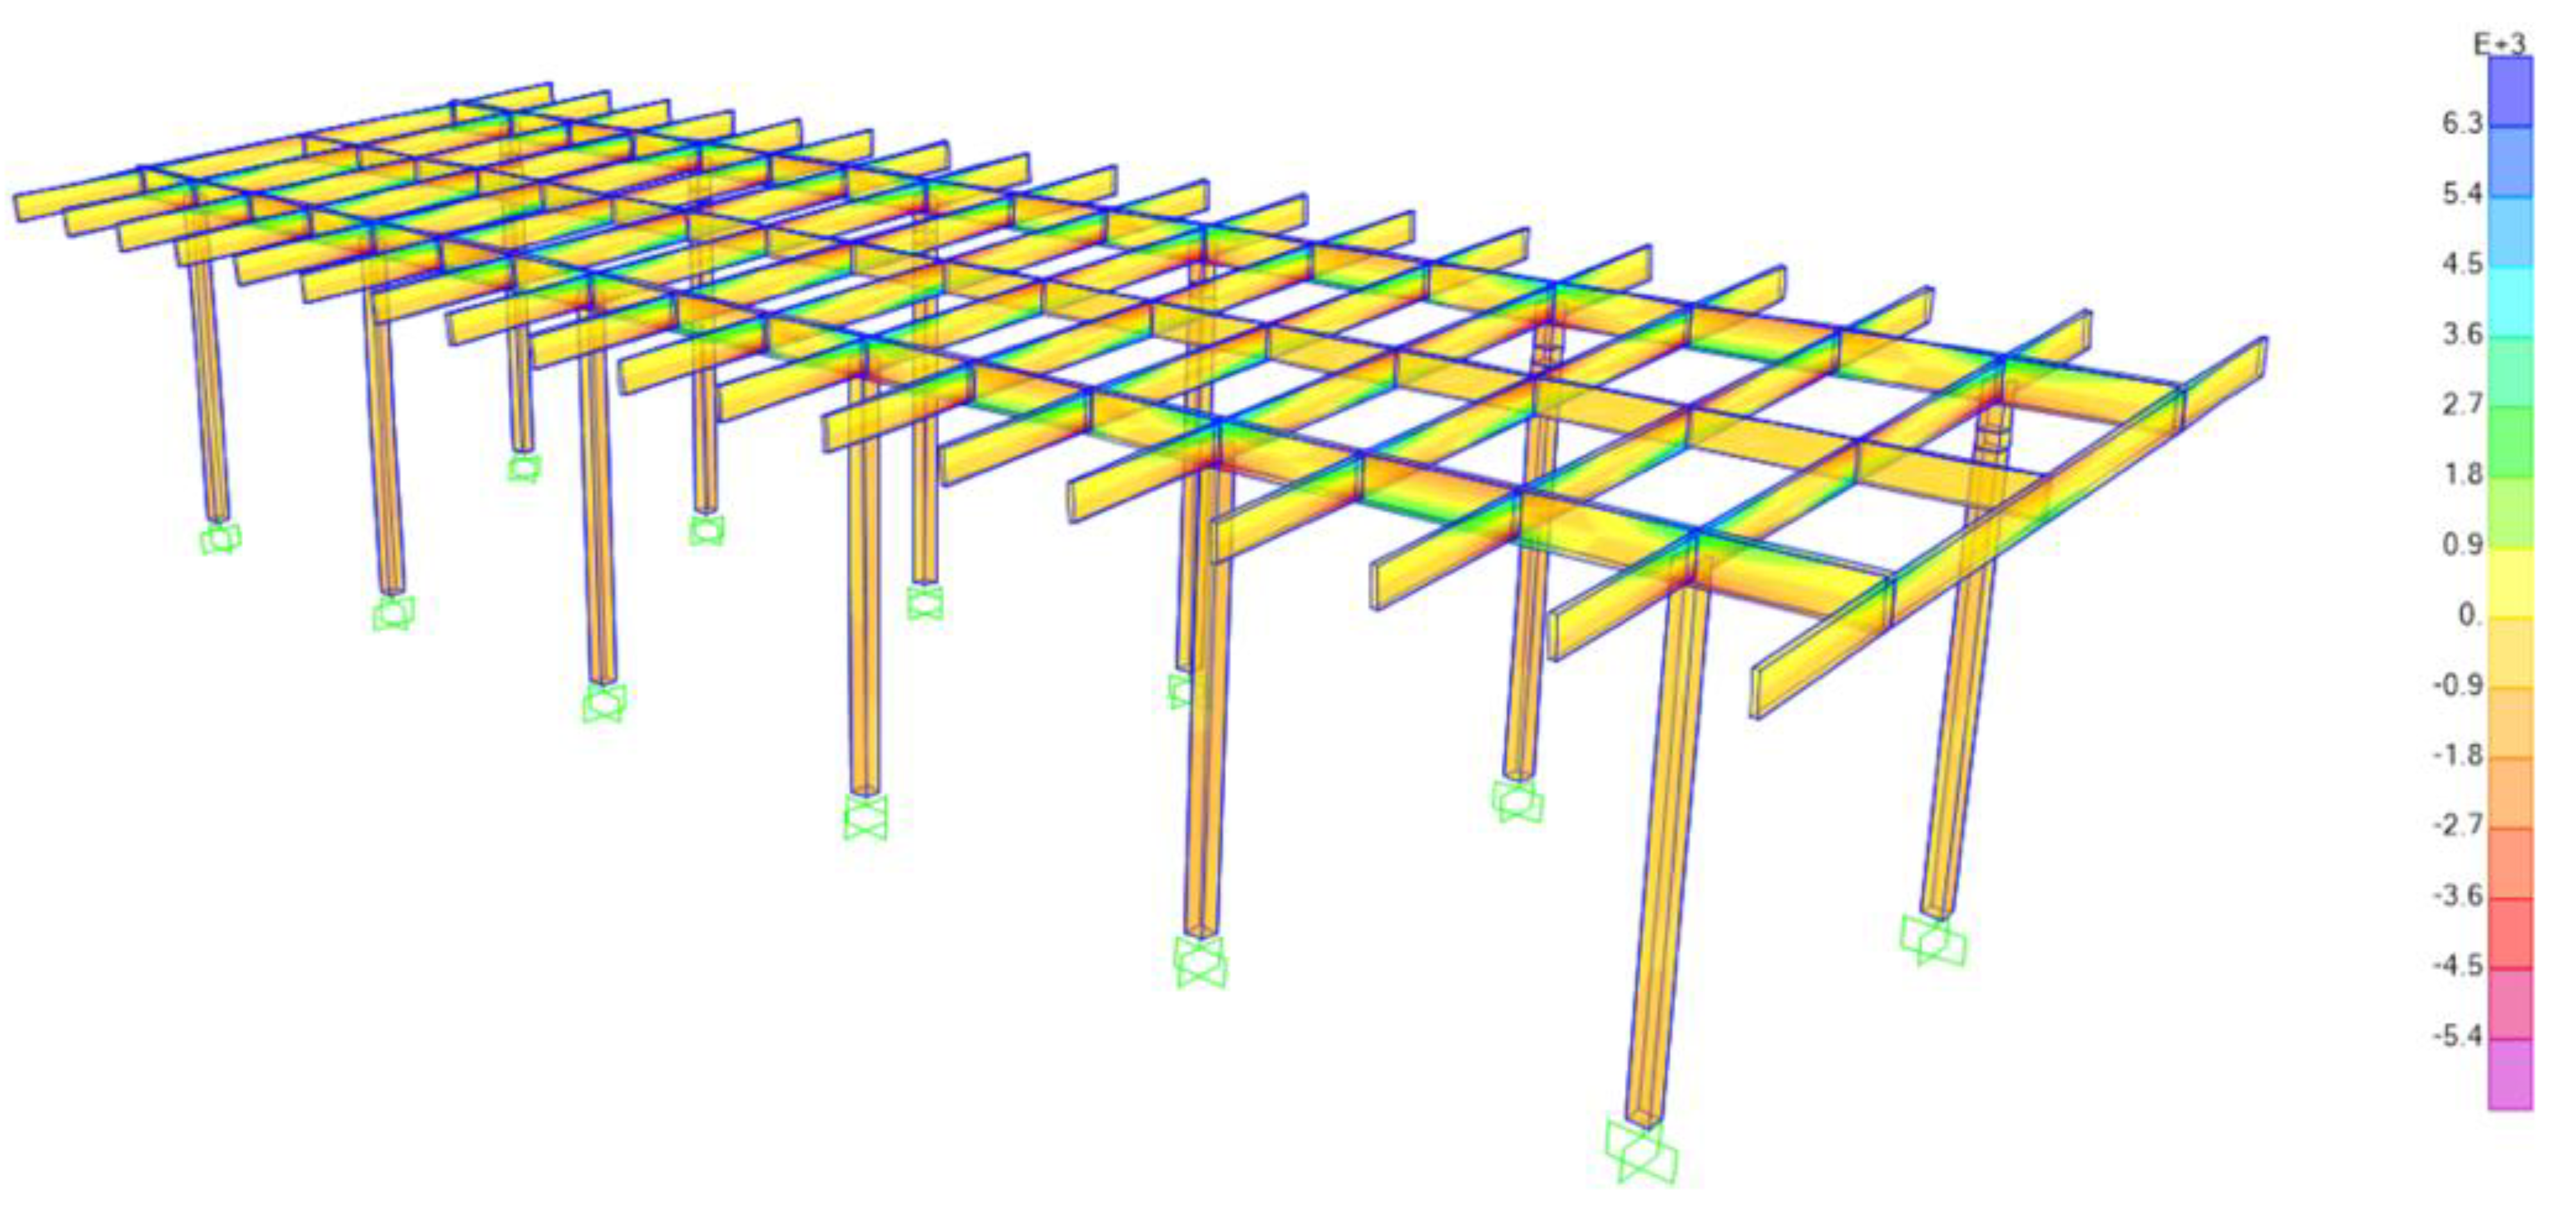
3.3. Cantilevered System

3.3.1. Cantilevered System Bill of Materials

The BOM of the cantilevered system, which is appropriate for on the street parking, is shown in Table 6 in Canadian dollars sourced from Copp’s Build-All, London, and Metal Supermarkets, London.

3.3.2. Cantilevered System Assembly Instructions

For the cantilevered system, 8 × 8 posts are spaced 3 m apart at each parking space corner, with a length of 3.6 m, as shown in Figure 8.
Then, 4 m long 4 × 8 × 0.270 aluminum beams are installed at five degrees on top of each post with self-tapping screws in the same manner as the double-spanning system, as outlined in Figure 9. Then, ¼″ 7 × 19 strand galvanized aircraft cable is installed on the back of the aluminum beam, directly into the ground to prevent tipping. Furthermore, 4 × 4 beams can be screwed onto the 8 × 8 posts to serve as diagonal bracing to support each cantilevered beam. Connect these 4 × 4 beams with self-tapping screws.
Then, 2 × 10 joists are then installed horizontally across the aluminum beams. Splice joints are to be made at 20% of the span length away from each beam. H1 hurricane ties with self-tapping screws are used to connect the ties to the beam, and joist hanger nails are used to connect the ties to the wood. Then, 1 m long lateral braces are installed between each beam. The final cantilevered system is shown in Figure 10. The cables are anchored in the road verge, which is normally a strip of grass located between a roadway (carriageway) and a sidewalk (pavement). This curbside system provides the potential for PV canopies on the sides of streets with only street parking to charge EVs. Substantial future work is needed to investigate the regulatory and legal ramifications of such systems, as the road verge and street are normally owned by the municipality.

3.4. Economic Analysis

3.4.1. System Cost Comparison

The cost per installed W of solar for each system is summarized in Table 7. The double-span system can only be built in multiples of two, so a six-spot system is presented instead of a five-span system. Nevertheless, the systems are broken down into cost per W, making this a fair cost comparison between the systems.

3.4.2. System Size Cost Sensitivity

The total cost and cost per W of installed solar power for varying system sizes is shown in Table 8.

3.4.3. Material Cost Sensitivity Analysis

The price of lumber has been extremely volatile, as shown in Figure 11. In the last decade, the cost of lumber reached record highs during the COVID-19 pandemic, with values as low as 41% and as high as 281% relative to the current price [71]. This means that the installation cost of the single-span wood system could effectively range from CAD 0.09 per W to CAD 0.62 per W. Thus, using wood as a cost-effective alternative to aluminum and steel is highly dependent on the timing of purchase.
The cost of aluminum has also been volatile. Prices have been as low as 60% and as high as 160% of the current price [72], as shown in Figure 12.
Although many other factors, such as labor and transportation, impact the cost of the final product, it is valid to assume that changes in the commodity price of these materials directly translates to changes in the final retail cost. The peaks and troughs between wood and aluminum prices occur nearly at the same time, with the largest spike in early 2022 and the lowest point in early 2020. A summary of the range of price in these systems is outlined in Table 9.

3.4.4. Location Cost Sensitivity Analysis

The cost of these systems is based on the availability of the structural materials in the installation location. Vandewetering et al. indicates that the cost of pressure-treated lumber is noticeably higher on other continents than in North America; a standard 2 × 4 in Togo is about 2.5 times the cost of one in Canada [47]; thus, a wooden system in this region would not be economically practical to build. The cost of aluminum varies according to the import tariffs in place, as well as local availability. China, India, and Canada are examples of countries with the largest aluminum production [73], making I beams extremely affordable in these countries. Locations such as the Bahamas and Bermuda, however, have tariffs of up to 40.2% on raw aluminum [74], making the two-span and cantilevered system relatively less affordable in these regions. These systems are especially cost-efficient in North America, but future work can be done to build similar systems with accessible materials, such as concrete and recycled plastic.

3.4.5. Additional Maintenance Costs

Although all three systems are designed to last 25 years, harsh rainy and snowy climates can cause rapid deterioration, negatively impacting the aesthetic and structural integrity of these systems. The structure should be inspected to ensure that connections remain tight and that members have not permanently deformed. Over time, the pressure-treated coating on wood members can fade; therefore, it is advisable to stain the wood every few years to maintain a strong coat to resist UV and moisture deterioration. Additionally, aluminum can be sprayed with corrosion inhibitors to delay the corrosion process. Overall, wood stains and aluminum sprays create an aesthetically appealing canopy and provide extra years of service life in harsh climates, making it highly advisable to invest in these additional maintenance costs.

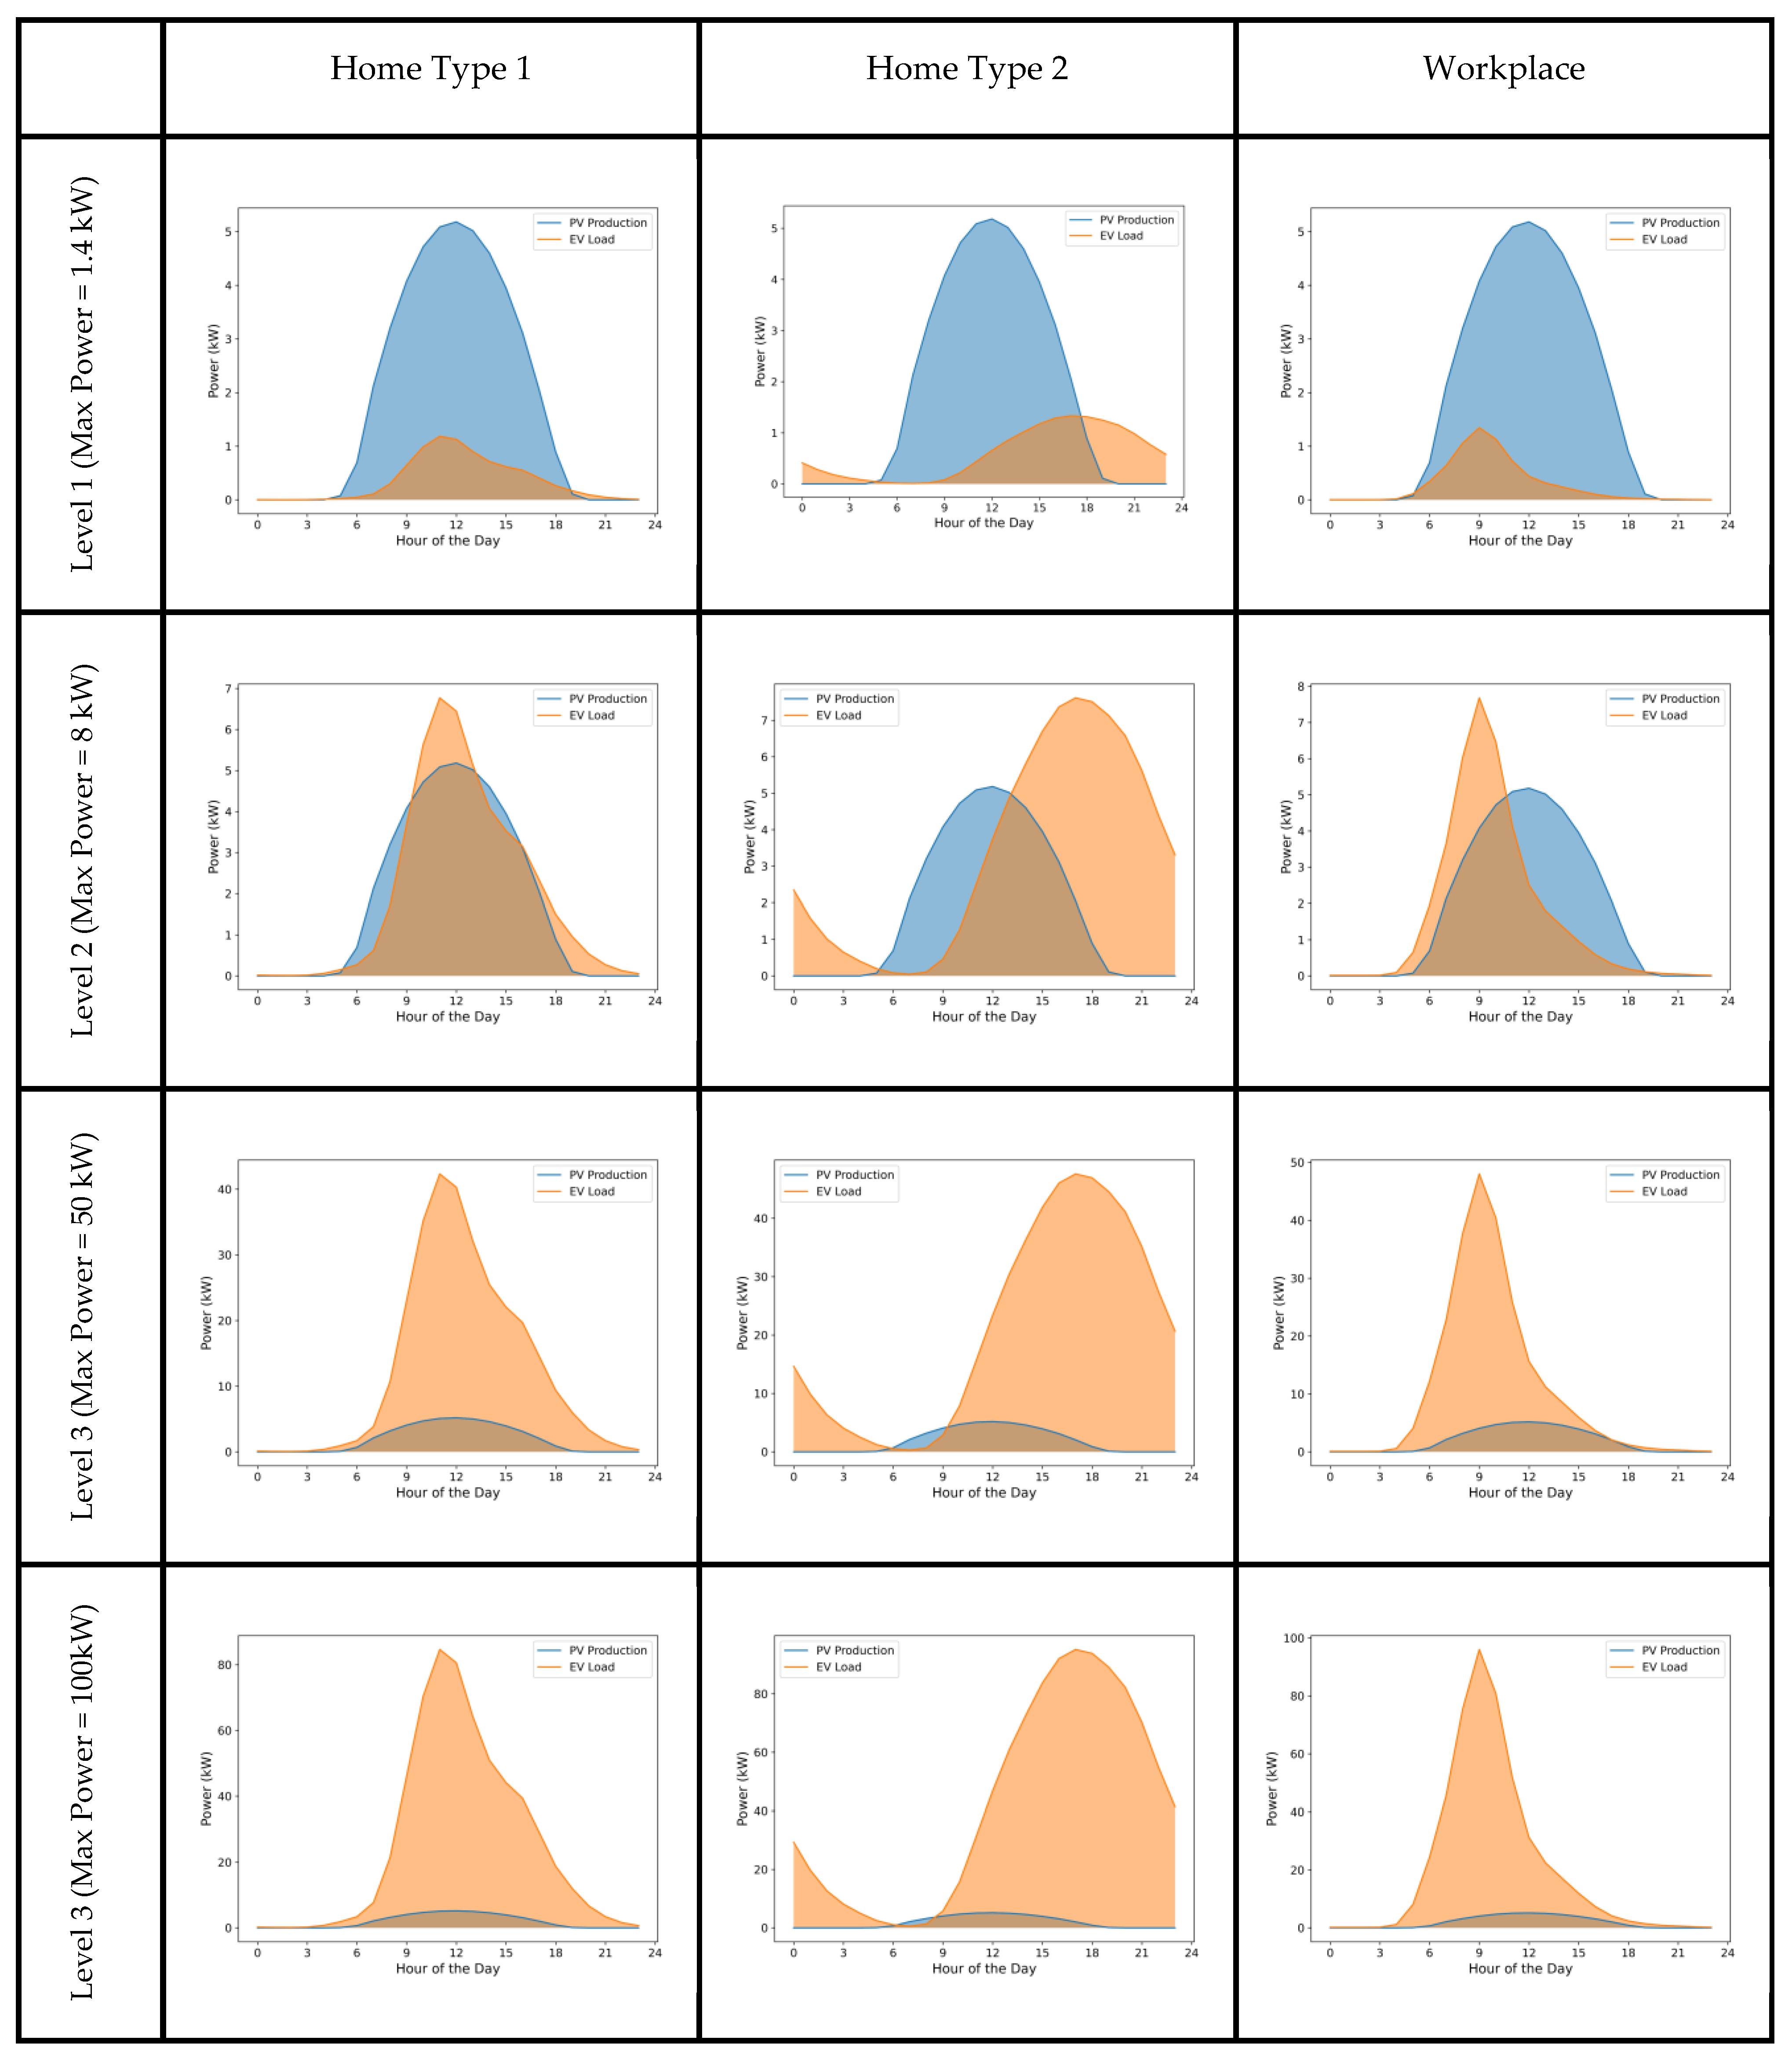
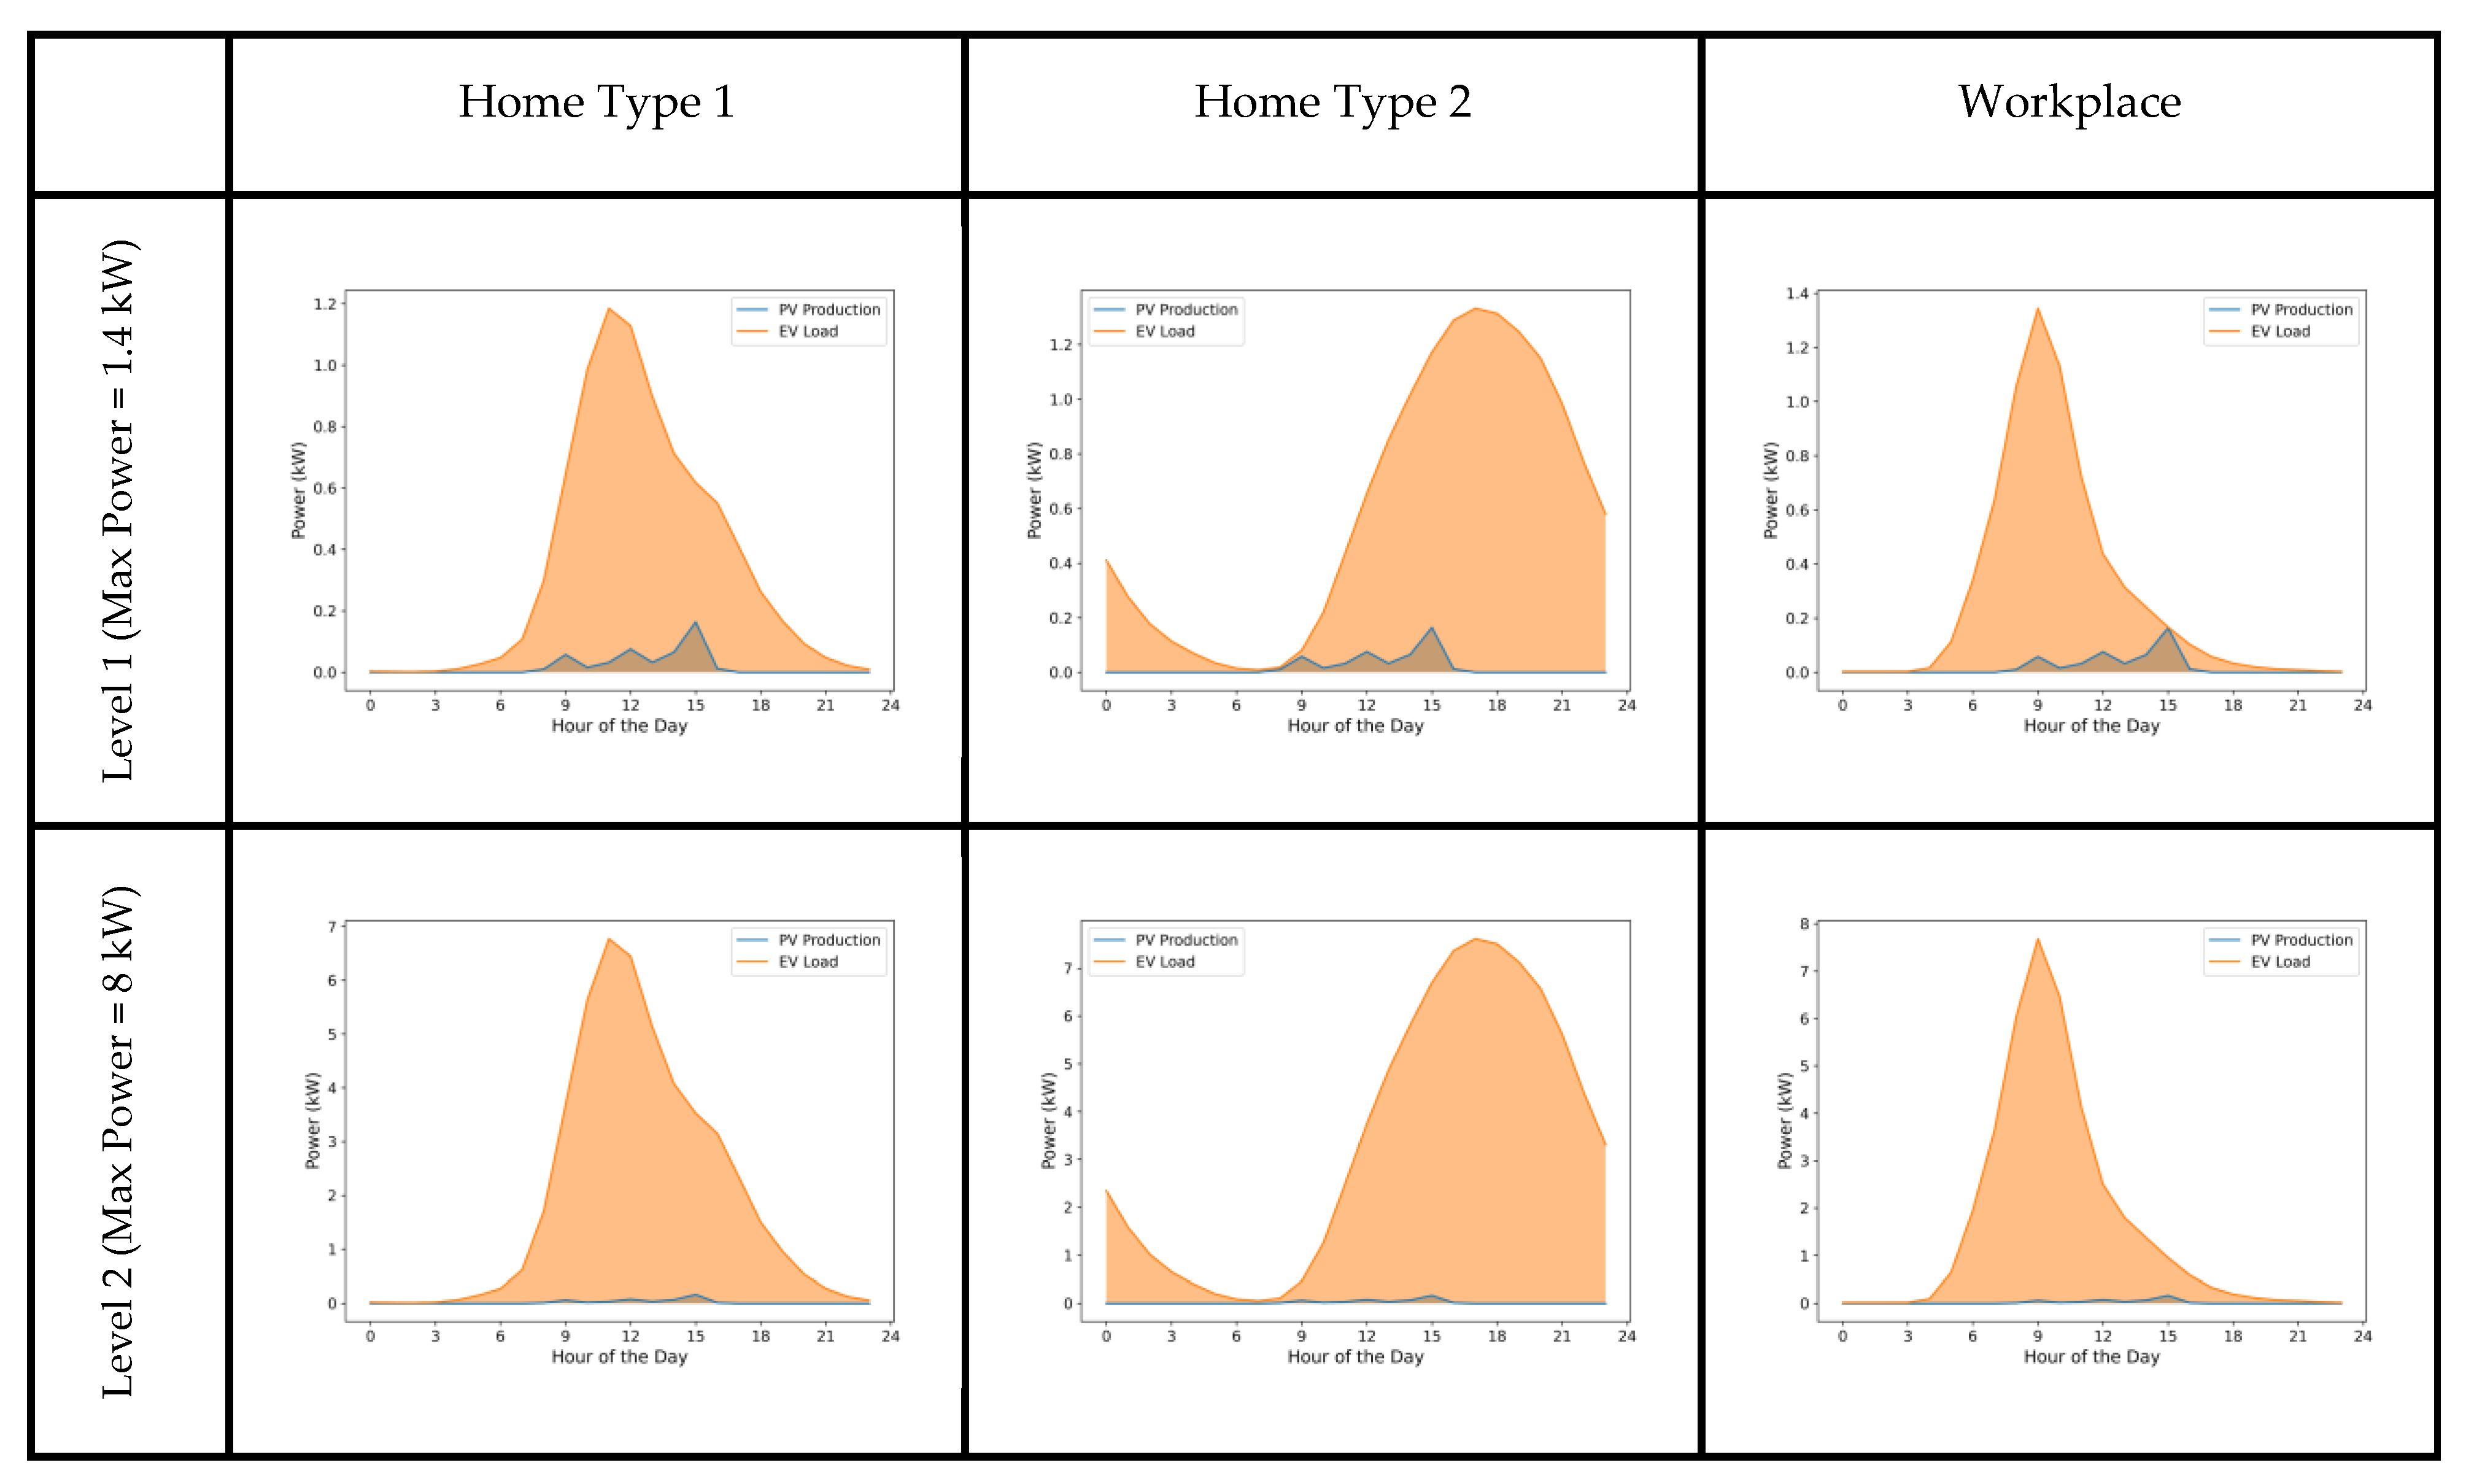
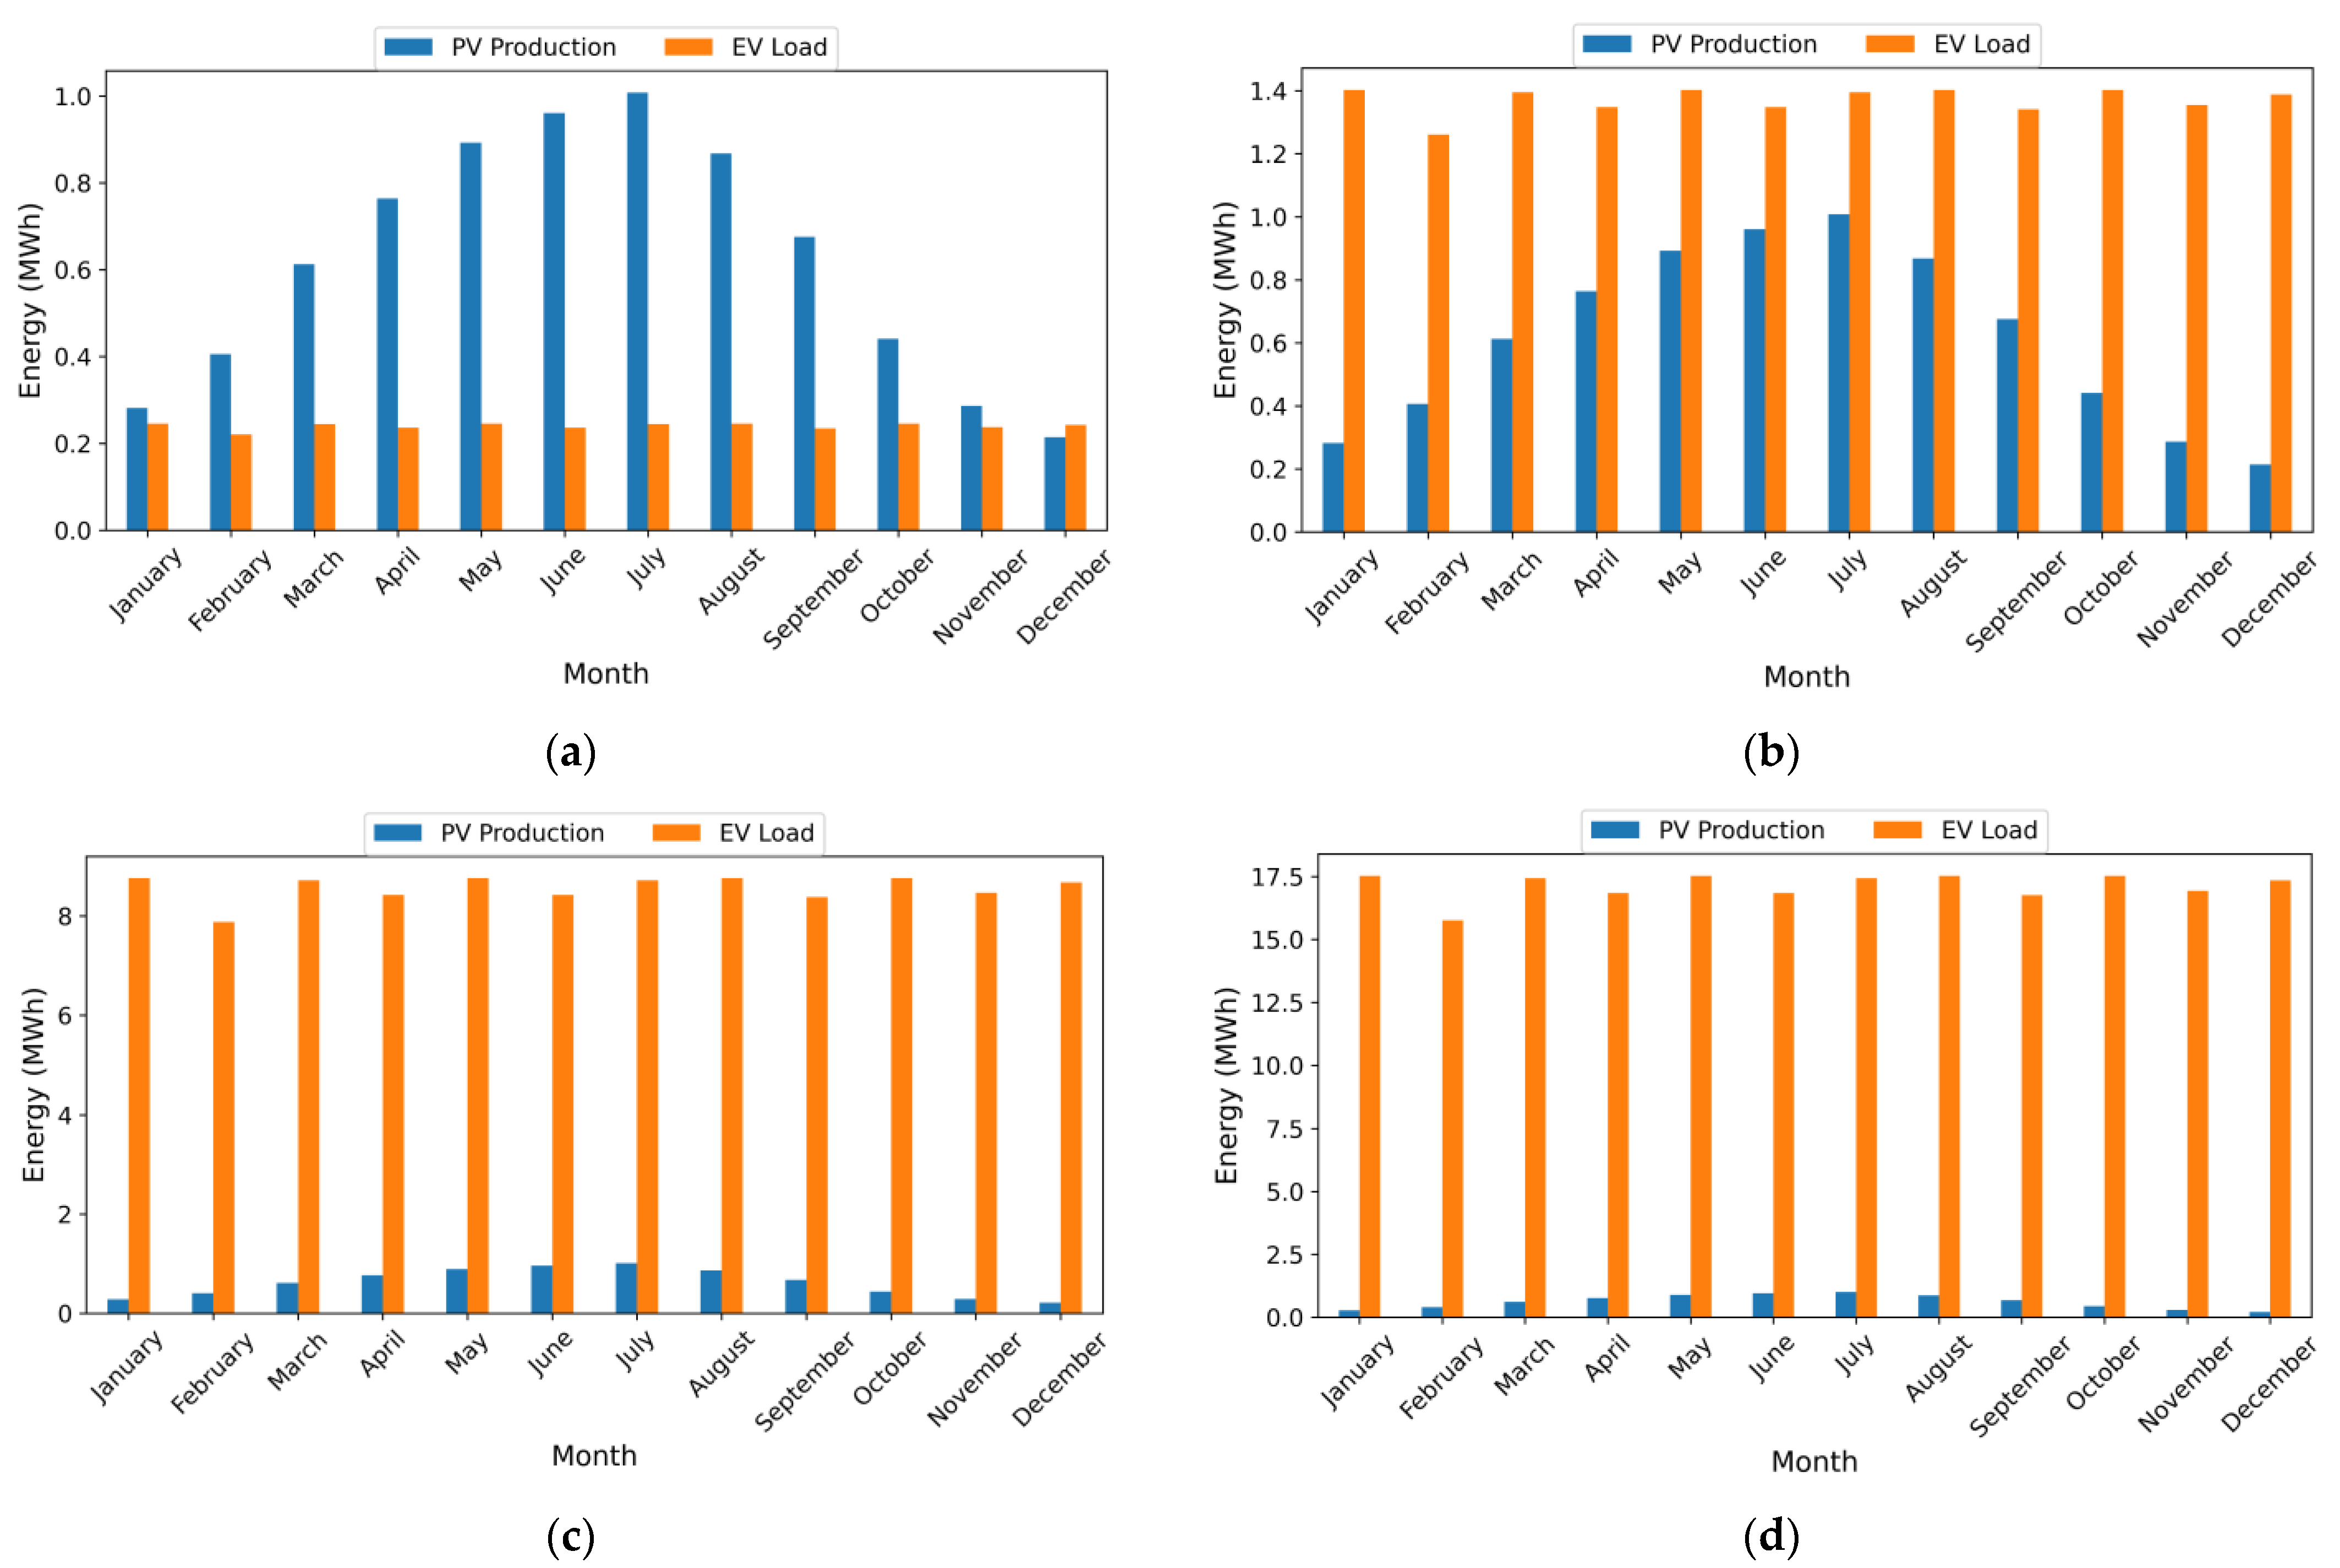
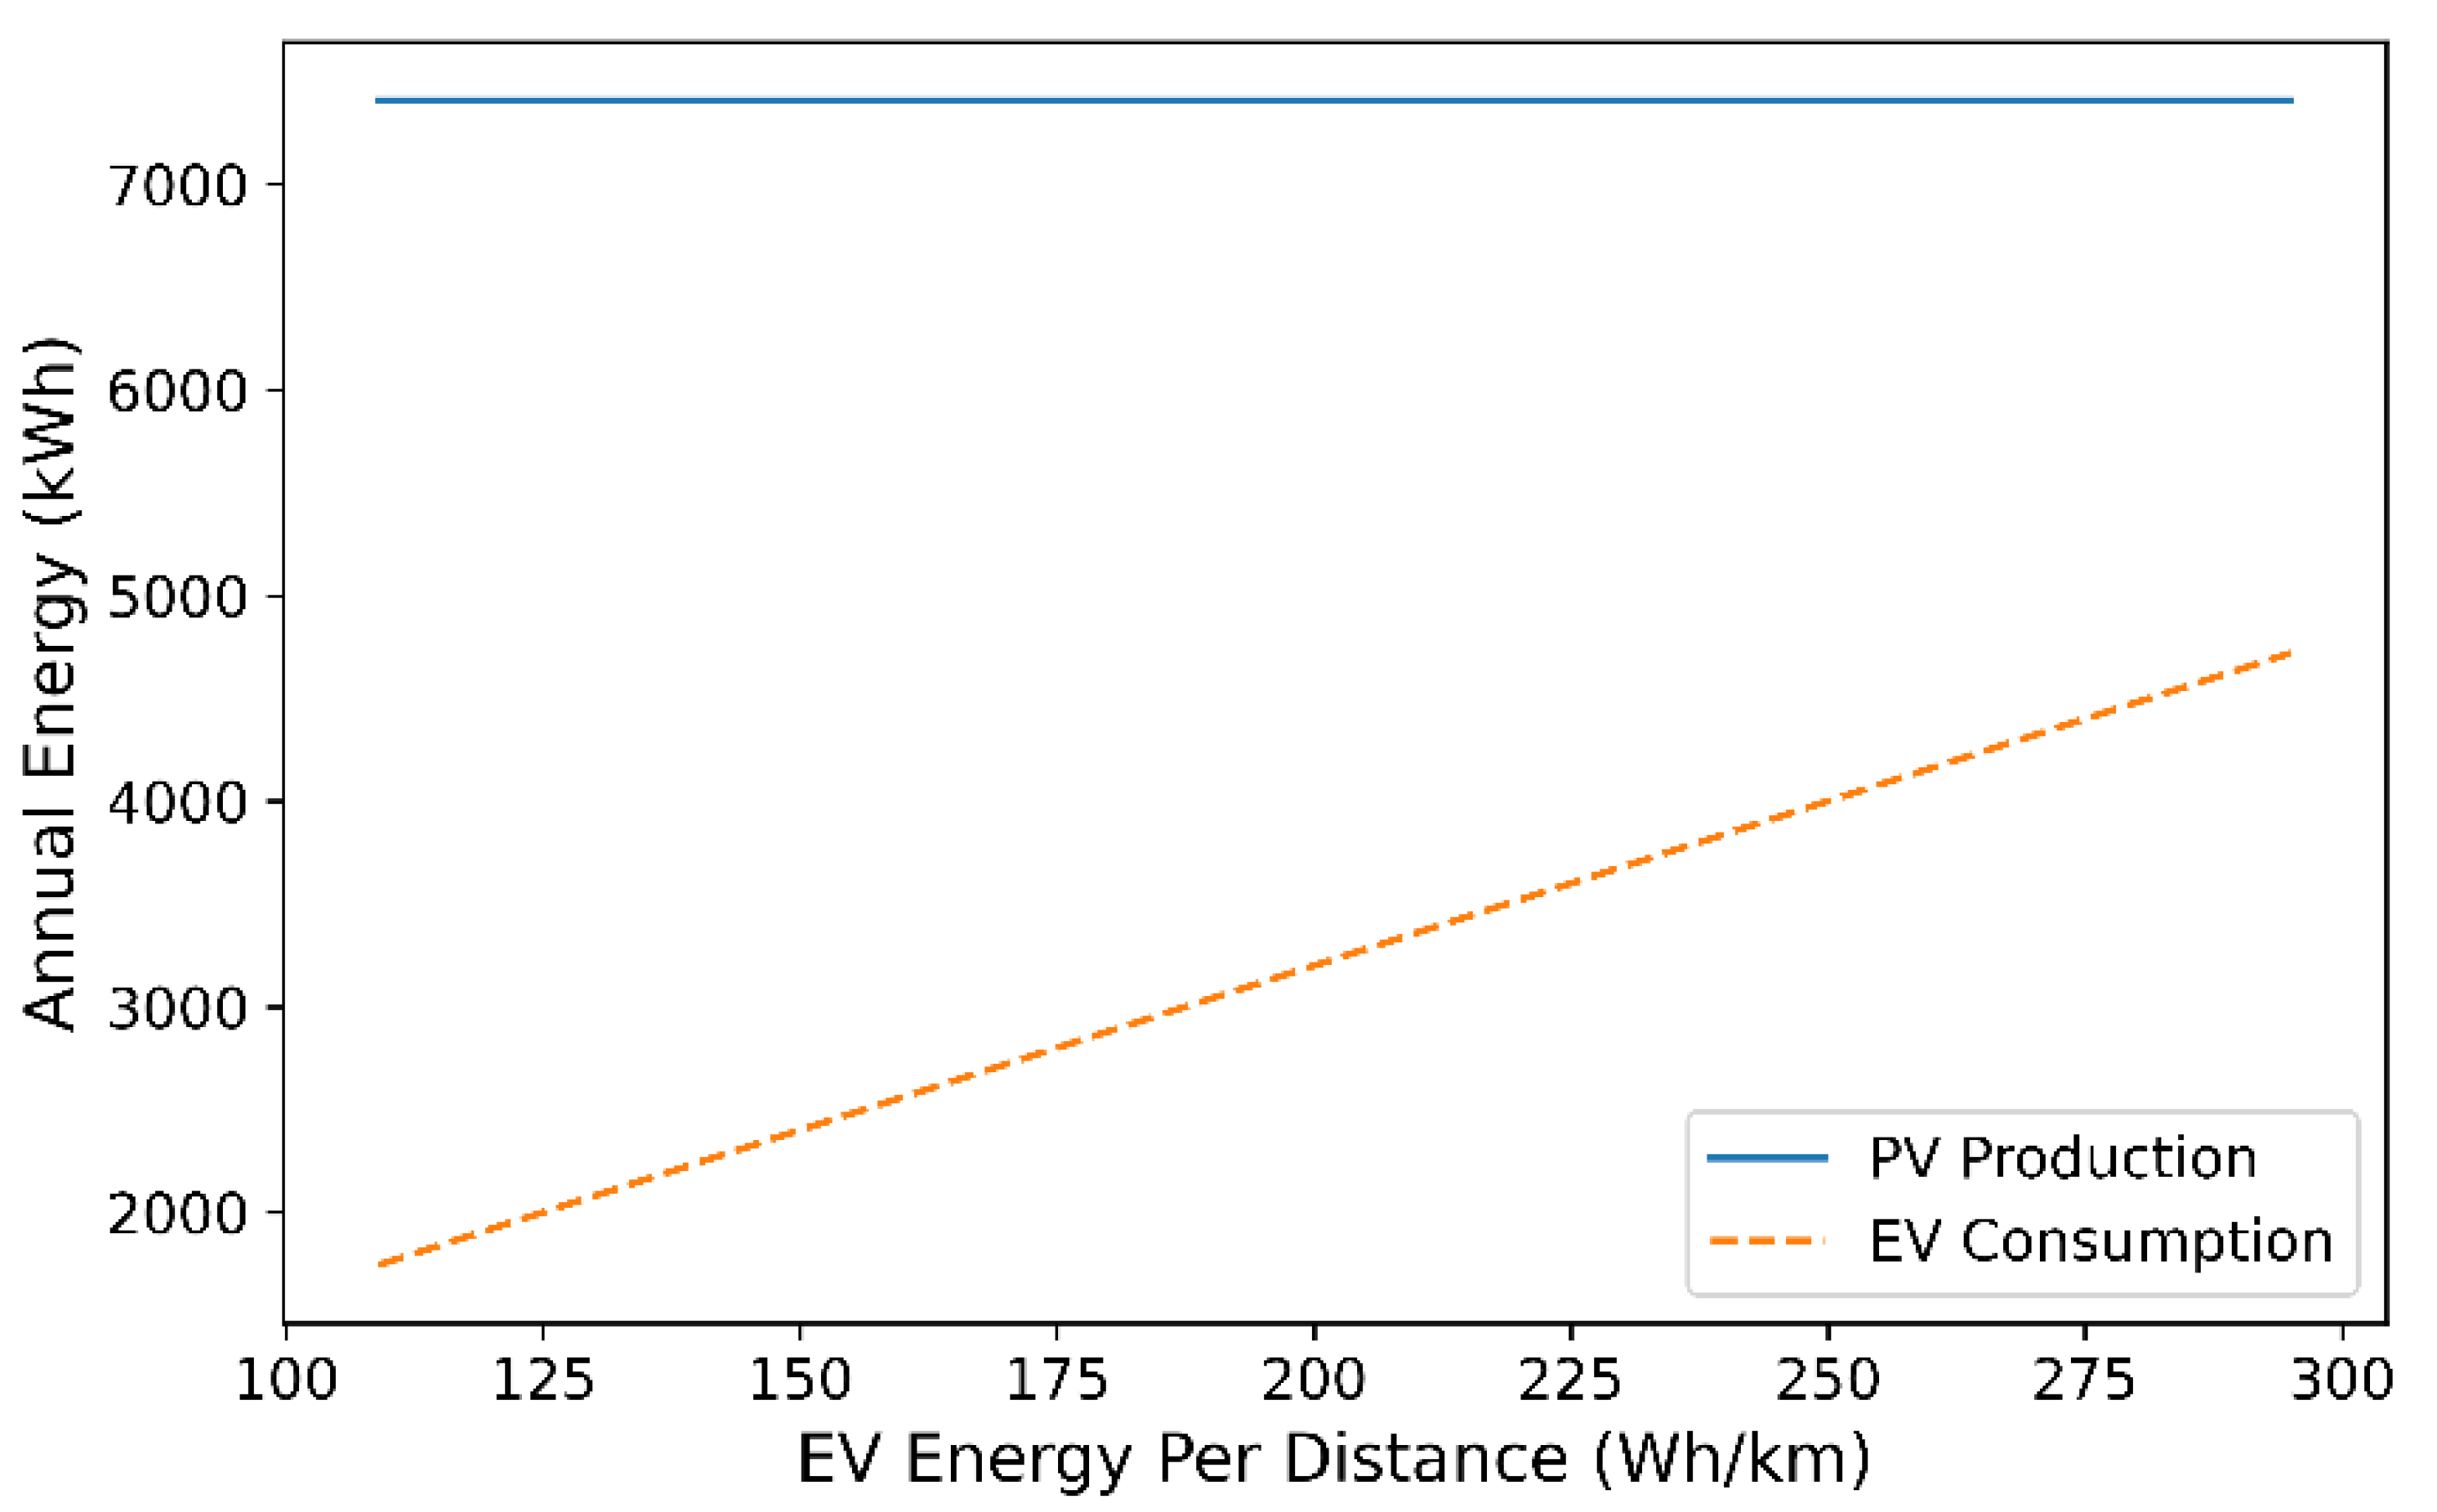
3.5. Energy Analysis Results

To analyze the load match between the PV system and EV charging station, the energy production of the PV system and the load demand of the EV are plotted for different types of charging sites and different charging power levels, as per the North American Standards. Energy analysis is performed on the single-span PV system for a single parking spot located in the city of London, Ontario, Canada. The results are shown for a day with maximum energy production and a day with the lowest energy production in Figure 13 and Figure 14, respectively. “Home Type 1” in Figure 13 and Figure 14 indicates an EV charging station located at a users’ home; users are assumed to return home from work during the middle of the day and to return to work in the afternoon, for example, at an apartment complex. On the other hand, in the “Home Type 2” scenario, the users only return home after 4 pm [66]. In all of these cases, the charger is used for multiple EVs.
Figure 13 shows that for a level 1 type charging station, on a sunny day (26 June), the PV system will produce enough energy to cover the needs of the station running 24 h/day using the load profile proposed by Zhang et al. [66]. In the case of the type 1 home charging station, the peak demand of the EV load matches the peak production of the PV. For the type 2 charger station, however, the peak EV demand is skewed to the right of the peak energy production of the PV. Therefore, for a type 2 home EV charging station, the system will import part of its energy from the grid if being used to charge multiple EVs. Level 2 and level 3 charging stations have the same load-matching profiles as level 1 stations. The main difference is that in the level 3 charging profiles, a single-carport PV system does not possess the instantaneous power to match a high-powered charging station. Therefore, if a level 3 charging station is considered for the proposed carport, more than one carport is needed, and a more sophisticated charging scheme would need to be investigated in future studies to share EV loads between multiple carports. Figure 14 shows the match between the PV system and the EV charging stations for a wintery day with minimum PV energy generation. In this scenario, the PV system is not expected to generate sufficient energy to satisfy the needs of the charging station, and most of the charging energy will be drawn from the grid.
Figure 15 shows the cumulative monthly energy generated by the PV and the monthly energy demand for each power charging station level in the case of a type 1 home. For the level 1 charging station (1.4 kW), the PV system produces more energy than required by the charging station, and a surplus of 4.532 MWh is injected into the grid during the first year of operation. However, for each of the subsequent charging power levels, the PV energy does not cover the charging station needs during the year. Specifically, the charging station draws 9.03 MWh, 95.35 MWh, and 191.12 MWh from the grid in the case of level 2 (8 kW), level 3 (50 kW), and level 3 (100 kW) charging systems, respectively. This shows that the proposed carport design is suitable for a level 1 charging system if multiple EVs with different features are charged throughout the day.
The energy balance shown in Figure 15 is calculated annually for all types of systems (type 1 home, type 2 home, and workplace) and all charging levels (level 1 to level 3). The calculation is performed for two locations: London, ON, and Los Angeles, California. The results are summarized in Table 10.
The results show that in each case, the level 1 type charger (1.4 kW) is suitable for the operation, regardless of the charging site. For a level 1 charger, the PV system has a net positive energy balance. For the other power levels (type 2 and type 3), the system has a net negative balance, as more energy is drawn from the grid, assuming the system is operating full-time using the charging load profiles proposed by Zhang et al. [66]. In terms of the location impact, Los Angeles has a better energy balance compared to London, ON. This result is directly related to the solar irradiation in each location. However, the location impact is not significant in terms of deciding which charging power level to use with the proposed solar PV carport for multiple EVs.
In the case in which the proposed PV carport is used for a single EV in a net-metered system, Figure 16 shows that the annual energy production of the PV system will cover the average yearly energy needs of the EV. In the case of London, Ontario, the results of which are displayed in Figure 16, the average annual energy demand of a single EV varies between 1744 kWh and 4720 kWh, depending on the make and model of the EV. On the other hand, the PV carport generates 7409 kWh annually. This means that the proposed PV carport, when connected to a net metered grid, can produce far more than sufficient energy to charge one EV currently available on the market (depending on the driving behavior and selection of EVs, the carport could charge more than one EV or provide power for the home). However, this amount will fluctuate depending on the driving pattern of the vehicle owner. In the future, if the progression in technology increases EV capacities above 463 Wh/km, then a larger carport would be needed to charge a single EV. Even so, the energy density and efficiencies of PV modules are also increasing and would likely be able to keep up with the increase in EV efficiencies.

4. Discussion

4.1. Benefits

Economically, the proposed systems have a significant advantage over conventional steel and aluminum carports. Given that the cost of typical carport systems designed for PV range from CAD 1.30 to CAD 1.50 per W [45,46,75], the single-span system achieves cost savings of 82–85%, the double-span system achieves cost savings of 43–50%, and the cantilevered system achieves cost savings of 31–40%.
Compared to wooden ground-mounted systems, carport canopies are less costly and more energy efficient, as the cost of ground-mounted systems can be as low as CAD 0.32 per W and are installed at the optimal tilt angle based on geographical location to provide improved energy yield [47]. Future work should be conducted to design carport systems at optimal tilt angles or even allow for varying tilt angles to minimize this difference in efficiency. Nevertheless, the five-degree carport system offers a sleek and practical design with a least 3 m of ground to reduce the consumption of critical land area.
Compared to conventional metal ground-mounted PV racks, small-scale residential racks range in cost from CAD 0.57 per W [76] to CAD 1.27 per W [77]. Commercial metal ground-mounted systems cost CAD 0.71 per W [78]. Thus, users of the single-span wooden system can benefit from significant cost savings with the installation of a carport system compared to standard ground-mounted systems.
Because the proposed systems are ideally DIY builds, the labor costs are excluded. Future work is needed to quantify the construction time required for these systems in order to provide labor costs. In previous projects, labor costs have accounted for approximately 20% of the material costs [46], which can be extrapolated to approximate labor costs for the single-span, double-span, and cantilevered systems of CAD 929.69, CAD 3586.17, and CAD 4624.10, respectively.
A comparison of the sensitivity results presented in Table 6 with the base results presented in Table 5 shows that larger-scale systems are more cost effective than small-scale systems. For example, in the single-span system, cost savings of more than 10% per W are achieved when a 20-stall system is built rather than a 2-stall system because outside posts and joists are structurally and financially inefficient, as they carry half the load of the inside posts. Therefore, when a system is scaled up, the percentage of inefficient outside members decreases, and cost efficiency increases. These efficiencies only include the base material costs. As the system size increases, there may also be opportunities to take advantage of bulk pricing for large systems or to arrange for large purchases and offer kit sales for many small individual systems.
Canopies have the benefit of shading the vehicle, which reduces the users need for air conditioning and can protect children and pets from heat-related deaths resulting from being trapped in vehicles exposed to direct sunlight, even in low outdoor temperatures [79]. Additionally, the coverage of the carport prevents users from needing to clear off ice and snow from their vehicle in the winter months. These secondary benefits of the carport design provide users with additional convenience, comfort, and safety beyond vehicle charging.
PV canopies are also likely to reduce the urban heat island effect caused by dark paved surfaces [80]. Golden et al. [81] found that PV canopies provide an even greater thermal reduction than urban forests.
Moreover, the cantilevered system has the benefit of being reoriented to cover vehicles in a parking lot of the same orientation as the other two systems, as shown in Figure 17. This system orientation is ideal for parking spots on the end of a lot, as the steel cable can obstruct interior parking spots. Additionally, this system can only shade half of the parking spot, with half the energy yield when assembled in this orientation; therefore, we recommend selecting one of the other systems for such applications, unless posts cannot be installed directly into the lot.

4.2. Limitations and Future Work

It may be difficult to install the footings for systems 1 and 2 in existing parking lots. Users will have to rent a jackhammer to cut through the asphalt, then auger through a dense gravel layer before native soil is exposed, resulting in additional labor and equipment costs.
The double-span system is scaled in multiples of two; it is not ideally designed for an odd number of parking spots. A user can decide to build this system for an odd number of spots; in such a scenario, they would build the last span to only cover one spot, although this is an inefficient use of the structural capabilities of the aluminum beams, and the user can expect an increased cost per W for their build.
With the promotion of open-source carport canopies, future work is required to develop open-source EV charging stations so that a completely open-source PV-EV charging system can be developed to further drive the costs of these systems down, making them more accessible to the general public and even home owners. Substantial efforts have been made on this front in the OpenSUSE project [82], in which a 48A/40A model has been made available for USD 600, whereas a kit can be purchased for USD 300 [82].
A single-span, single-car system can easily be built as a DIY design, as shown in Figure 18. The single-car system allows for a 3 × 5 array to be assembled, providing 6 kW of PV power to charge the vehicle. This racking system costs approximately CAD 1565.00, which corresponds to CAD 0.26 per W. The average Canadian cost of modules is CAD 0.91 per W [83,84,85,86,87]. Thus, a single-car system, including the model, kit, and PV modules, could be fabricated in Canada for CAD 8193.83 (CAD 1.36 per W) and in the US for USD 6309.25 or USD 1.05 per W.
Thus, an economical open-source carport PV canopy and EV charger could be constructed using the designs proposed in this study and those from OpenEVSE. Future work is necessary to further investigate the full economics of the system, including the potential to integrate storage and thus use the PV + EV charger as an off-grid system to avoid any interconnection friction and/or anti-distributed solar policies developed by utilities to maintain monopoly profits [88,89,90]. The results of the energy modeling for different EV charger types provide a baseline of data for such analysis, but future work would need to investigate different rate structures for utilities that do not have full annual net metering rate structures. For a completely open-source system, which minimizes costs, further work is needed with respect to open-source charge control and inverters, as well as open-source PV modules.
The economic analysis presented in the present study focuses specifically on the capital cost of the racking system for PV canopies. Future work can be conducted to further investigate a comparative analysis between existing metal-based PV carports and the wood-racking design proposed in this study. For example, installation times can be measured as a function of labor experience. The results of the present study can be applied to a detailed economic analysis to obtain net present value, payback period, and levelized cost of electricity values for complete systems to provide detailed insight into the system economics in a wide range of contexts. In addition, a complete environmental life cycle analysis can be explored in future studies by comparing the environmental impacts of the proposed wood-racking PV canopies to conventional metal carports.

5. Conclusions

In this study, we provided the full BOM, designs, and instructions for the fabrication of three low-cost PV-EV canopy systems, as well as economic and energy simulations and analysis. The results clearly show that the use of wood for PV canopies can substantially reduce the capital costs of the systems, making them potentially attractive investments from the scale of a single carport in a single-family home to covering parking lots of large businesses or institutions. The single-span system achieves cost savings of 82–85%, the double-span system achieves cost savings of 43–50%, and the cantilevered system achieves cost savings of 31–40%. For a DIY prosumer, the coupling of an open-source EV charger kit with the racking designs provided herein can facilitate a grid-tied system for less than CAD 10,000. In addition, the curbside cantilever-based PV canopy provides the potential for both property owners and municipalities to begin to offer on-street PV-powered EV charging in locations with street parking. Including wood as a suitable material for potential PV parking canopies provides some additional value for increased material flexibility to overcome the volatility of building material costs.
The energy analysis performed for a single PV carport can be scaled to any number of solar carports. The energy produced by the proposed carport is compared to the needs of North American Standards EV charging stations supplying multiple vehicles. Level 1 charging stations (1.4 kW) are the most compatible with a single-PV carport, whether the carport is in a residential area or at a workplace. When the carport is used with a level 3 charging station (50 kW or 100 kW), more than one carport is needed, and load sharing must be considered for efficient charging of multiple EVs. In the case in which the carport in connected to a net-metered grid and supplies a single EV, the annual energy generated by the PV is sufficient to power any EV currently available on the market with an average annual mileage.

Author Contributions

Conceptualization, J.M.P.; methodology, N.V. and K.S.H.; software, K.S.H.; validation, N.V. and K.S.H.; formal analysis, J.M.P., N.V. and K.S.H.; investigation, N.V. and K.S.H.; resources, J.M.P.; data curation, N.V. and K.S.H.; writing—original draft preparation, J.M.P., N.V. and K.S.H.; writing—review and editing, J.M.P., N.V. and K.S.H.; visualization, N.V. and K.S.H.; supervision, J.M.P.; funding acquisition, J.M.P. All authors have read and agreed to the published version of the manuscript.

Funding

This research was funded by the Thompson Endowment and the Natural Sciences and Engineering Research Council of Canada.

Data Availability Statement

Data will be made available upon request.

Conflicts of Interest

The authors declare no conflict of interest. The funders had no role in the design of the study; in the collection, analyses, or interpretation of data; in the writing of the manuscript; or in the decision to publish the results.

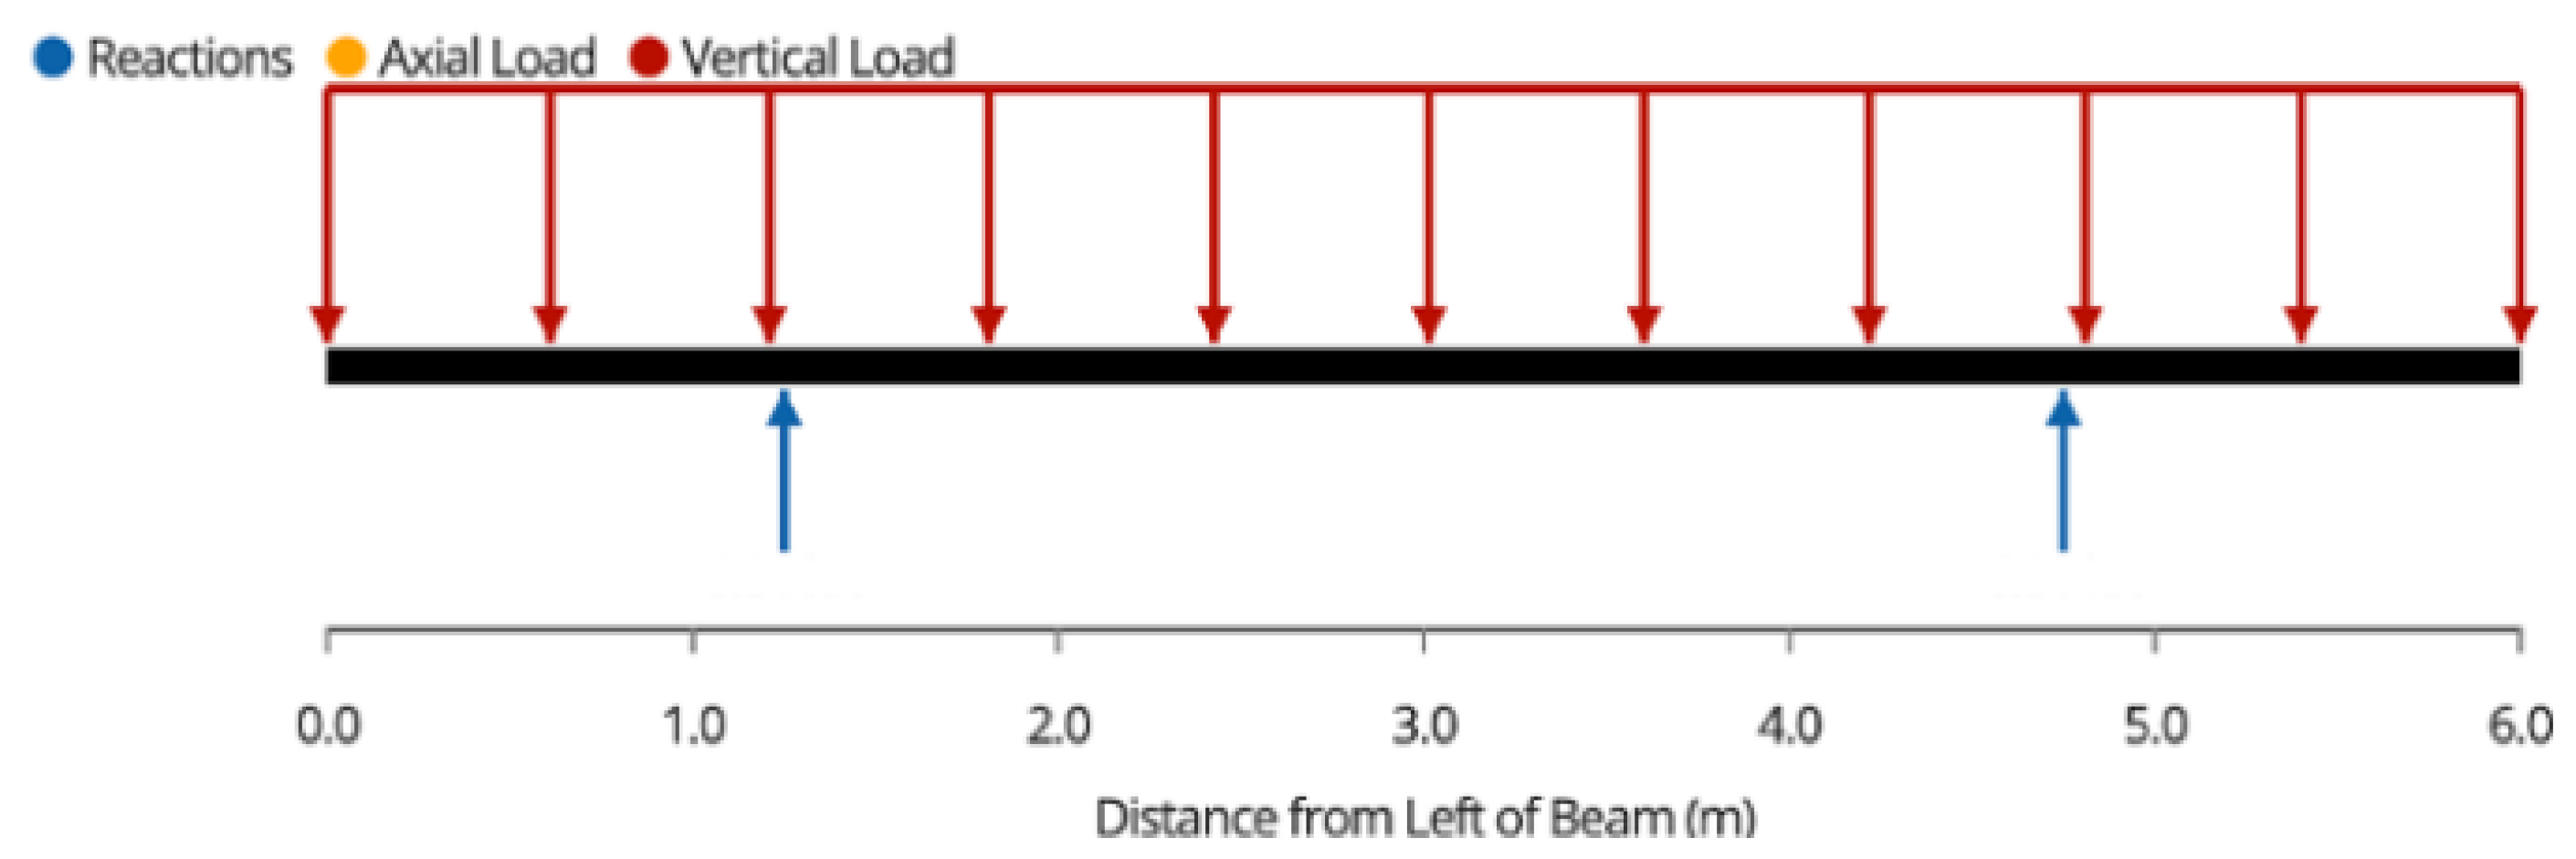
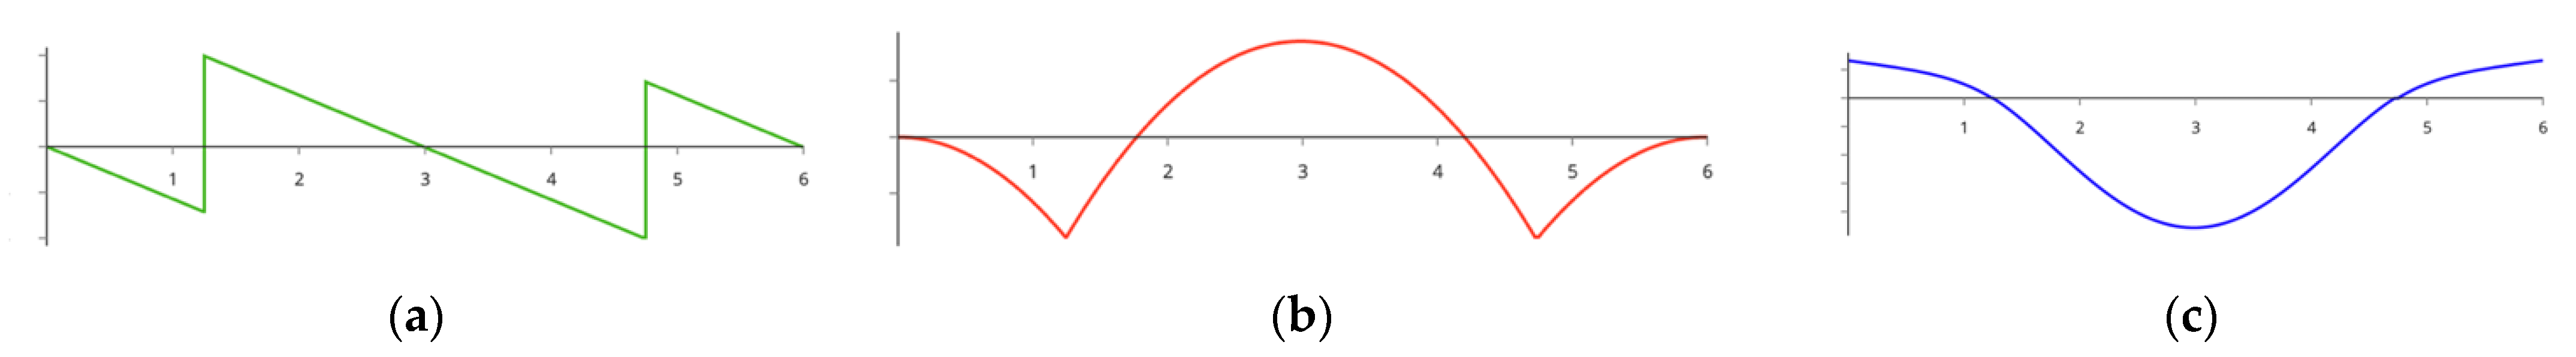
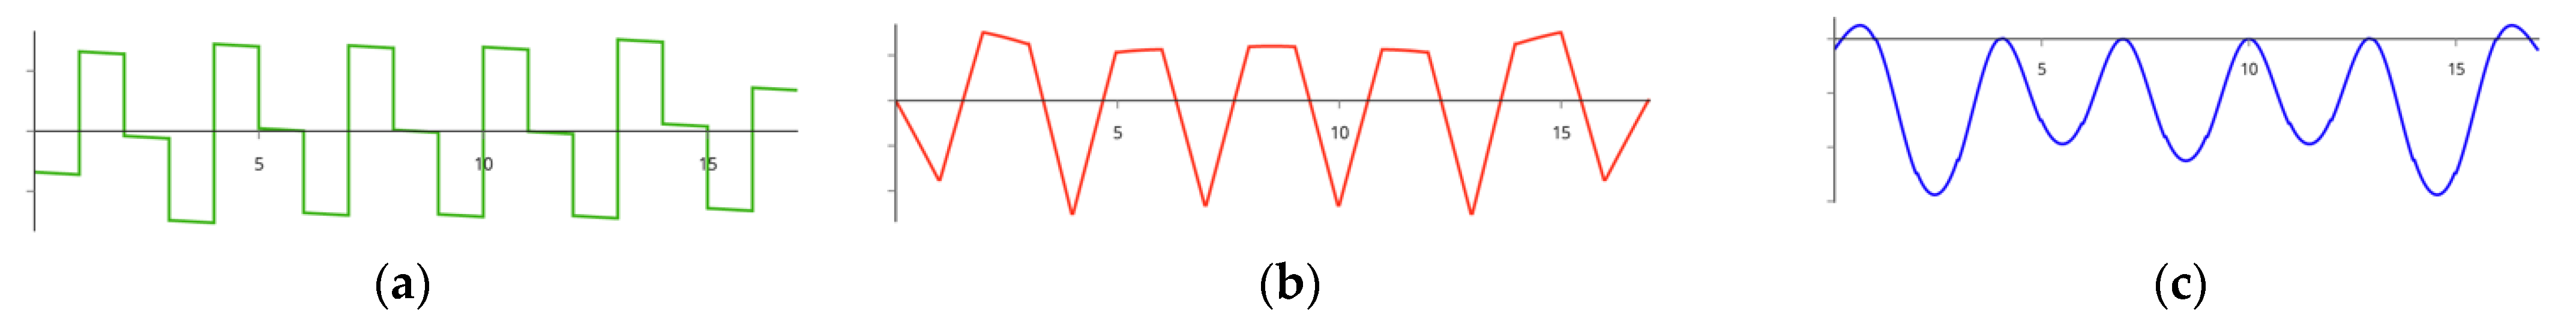
Appendix A. Structural Analysis

According to the process outlined in [47], the factored design load for this canopy system in London, Ontario, is 2.27 kPa.
Once a design load based on location is calculated, the analysis outlined below can be implemented. We recommended the use of an open-source free beam calculator from ClearCalcs [91] to determine critical structural values of complex members when analytical equations cannot be used.
The design load is assumed to be distributed evenly throughout the surface of the modules. Ensure that the modules being used have a higher structural capacity than the calculated design load. The load is then transferred from the panels to the joists. The design load is converted into a uniform distributed load onto each joist by multiplying the design load by the tributary width of each member, which, in this case, is 1 m for inside joists and 0.5 m for outside joists. This is denoted as wf.

Appendix A.1. Single-Span System Analysis

The joists serve as a simply supported beam with two cantilevered ends, as shown in Figure A1.
Figure A1. Single-span joist free-body diagram.
Technologies 10 00114 g0a1
The shear force, bending moment, and deflection diagrams are qualitatively illustrated in Figure A2a–c.
Figure A2. Joist (a) shear force diagram, (b) bending moment diagram, and (c) deflection diagram over the joist length in m.
Technologies 10 00114 g0a2
The maximum structural values of the joists can be solved analytically using the equations listed in Table A1. Values are provided for a design load of 2.27 kPa.
Table A1. Single-span joist load table for London, Ontario.
Maximum ComponentEquationValue
Reaction w f L 2 6.81 kN
Shear w f L 2 w f L C a n t 3.97 kN
Moment w f L C a n t 2 2 1.77 kNm
Deflection 5 w L S p a n 4 384 E I w L C a n t 2 L S p a n 2 16 E I 3.05 mm
where wf is the factored uniform distributed load along the joist, L is the full length of the joist, Lspan is the length between the support reactions, Lcant is the length of the overhanging cantilever end, E is the Young’s Modulus of wood, and I is the strong-axis moment of the inertia of the joist.
The load is then transferred to the beam, which can be accurately depicted as a continuous beam (Figure A3) with a uniform distributed load to serve as the beam’s self-weight, with a series of point loads serving as the joist reactions.
Figure A3. Continuous beam free-body diagram.
Technologies 10 00114 g0a3
The shear force, bending moment, and deflection diagrams are qualitatively illustrated in Figure A4a–c.
Figure A4. Beam (a) shear force diagram, (b) bending moment diagram, and (c) deflection diagram over the beam length in m.
Technologies 10 00114 g0a4
This indeterminate beam can be solved using analytical methods, such as the moment distribution method; however, analytical solutions can be long and tedious. Therefore, we suggest the use of an open-source beam calculator from Clear-Calcs [91] to quickly acquire these values. The results for London, Ontario, are summarized in Table A2.
Table A2. Single-span beam load table for London, Ontario.
Maximum ComponentValue
Reaction21.70 kN
Shear7.61 kN
Moment5.00 kNm
Deflection1.44 mm
After the beam, the load is taken to the posts. The eccentricity between the center of the post and the beam should be taken into consideration to account for extra bending moment, as shown in Figure A5.
Figure A5. Single-span post free-body diagram with eccentric loading.
Technologies 10 00114 g0a5
P represents the reaction force carried from the beam to the post, and e is the distance between the center of the post and the center of the beam. Because this post is experience combines compression and bending, Equation (A1), provided by the National Design Specification for Wood Construction [54], must be checked.
P f c + P e f b 1.00
where fc* is the compressive strength capacity of the post, and fb* is the bending strength capacity. For a design load of 2.27 kPa on 6 × 6 posts, the combination of compression and bending is 0.92, which is adequate for this build.
A finite element analysis (Figure A6) can also be conducted to quickly calculate the stress of each member if no members are overloaded.
Figure A6. Stress contour in kPa of the Single-Span System with a finite element analysis.
Technologies 10 00114 g0a6

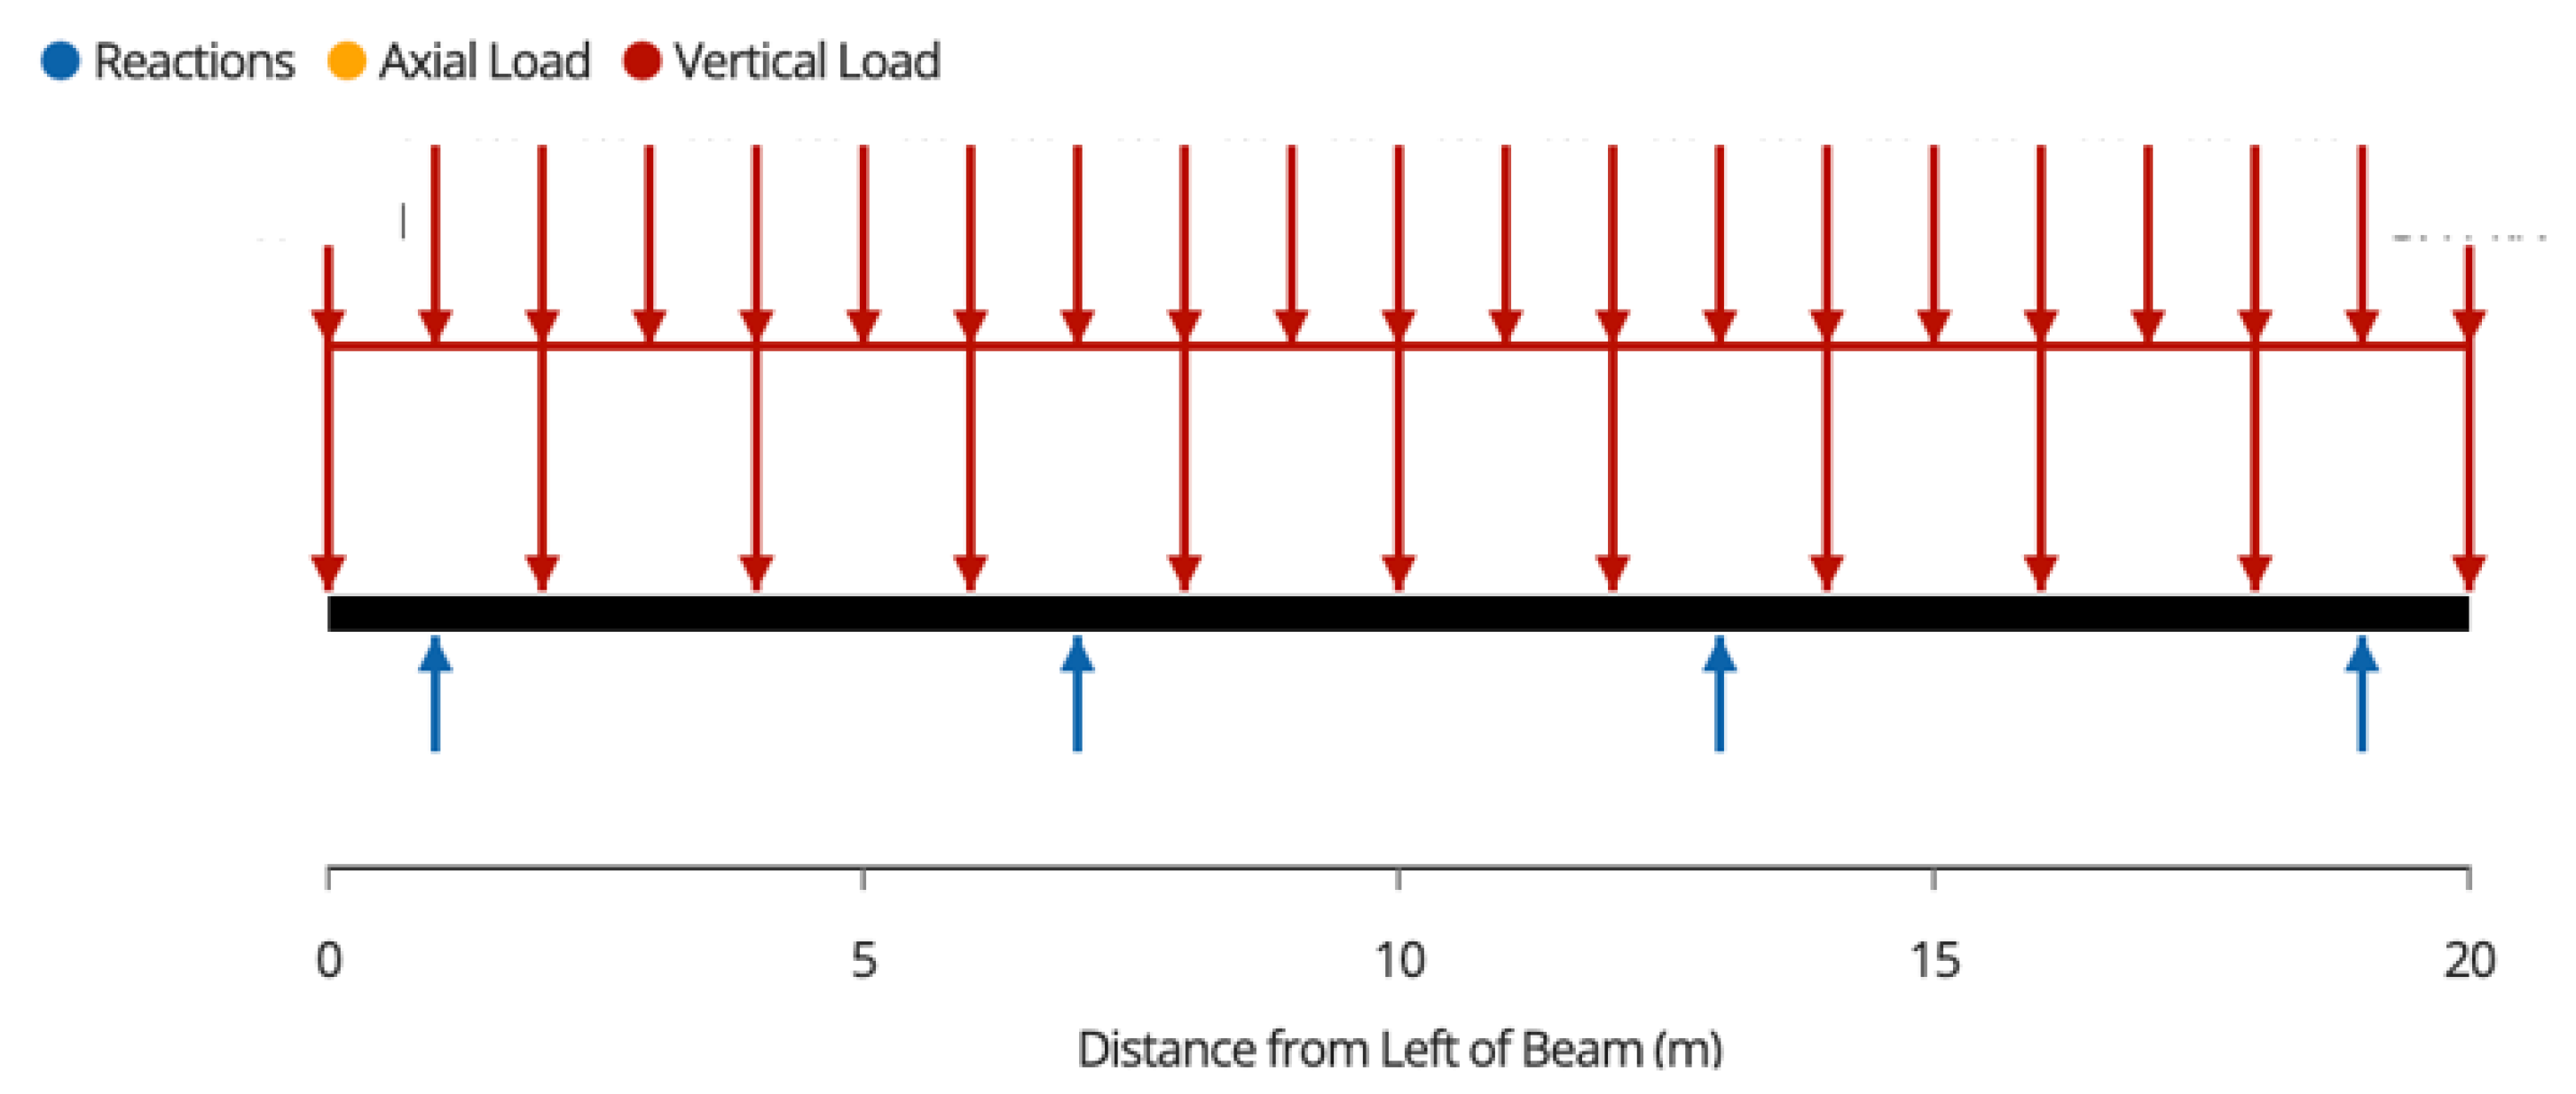
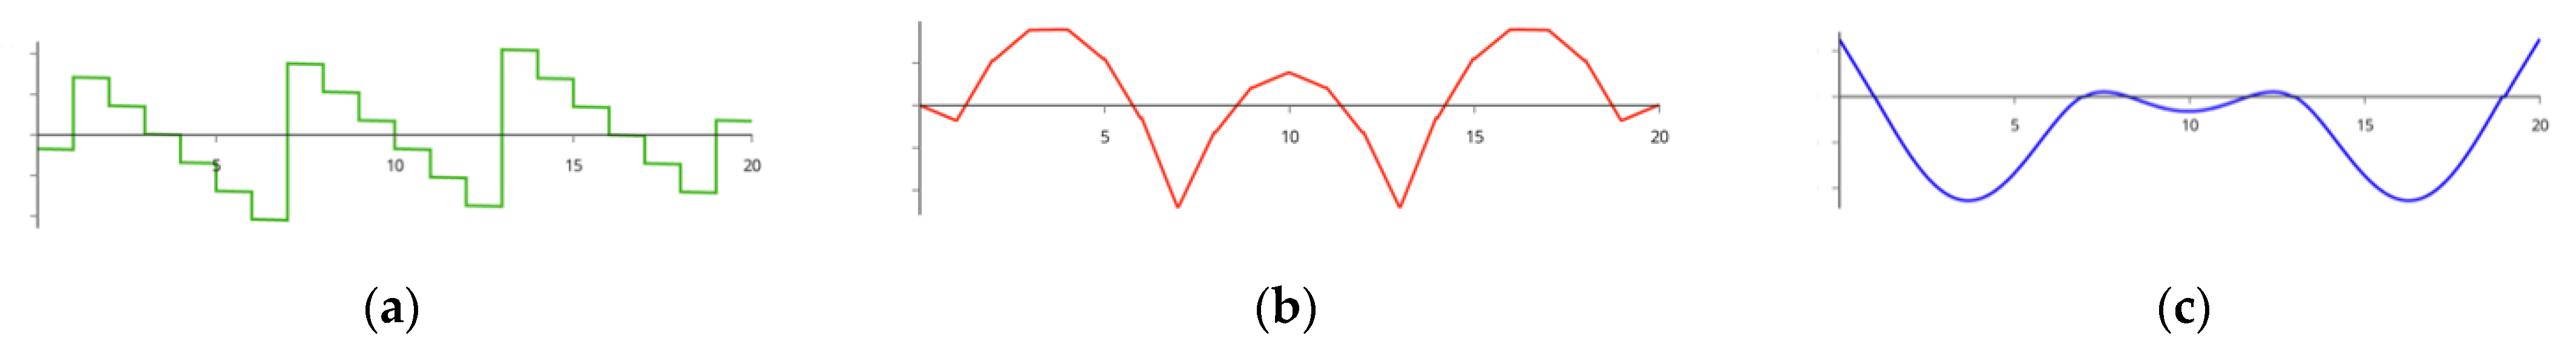
Appendix A.2. Double-Span System Structural Analysis

The joists in this system achieve the same results as those in the single-span system. The beams now have double the span length, as shown in Figure A7.
Figure A7. Double-span beam free-body diagram.
Technologies 10 00114 g0a7
The shear force, bending moment, and deflection diagrams are qualitatively illustrated in Figure A8a–c.
Figure A8. Two-span beam (a) shear force diagram, (b) bending moment diagram, and (c) deflection diagram over the beam length in m.
Technologies 10 00114 g0a8
The results for a design load of 2.27 kPa obtained using an open-source beam calculator are summarized in Table A3.
Table A3. Double-span beam load table for 2.27 kPa.
Maximum ComponentValue
Reaction45.50 kN
Shear21.00 kN
Moment23.90 kNm
Deflection27.07 mm
The posts are analyzed in the same way as the single-span system, but because the aluminum beam sits directly on the posts, eccentric loading must be considered; therefore, the second component of the equation can be ignored.
A finite element analysis (Figure A9) can also be conducted to quickly calculate the stress of each member if no members are overloaded.
Figure A9. Double-span system stress contour in kPa using finite element analysis.
Technologies 10 00114 g0a9

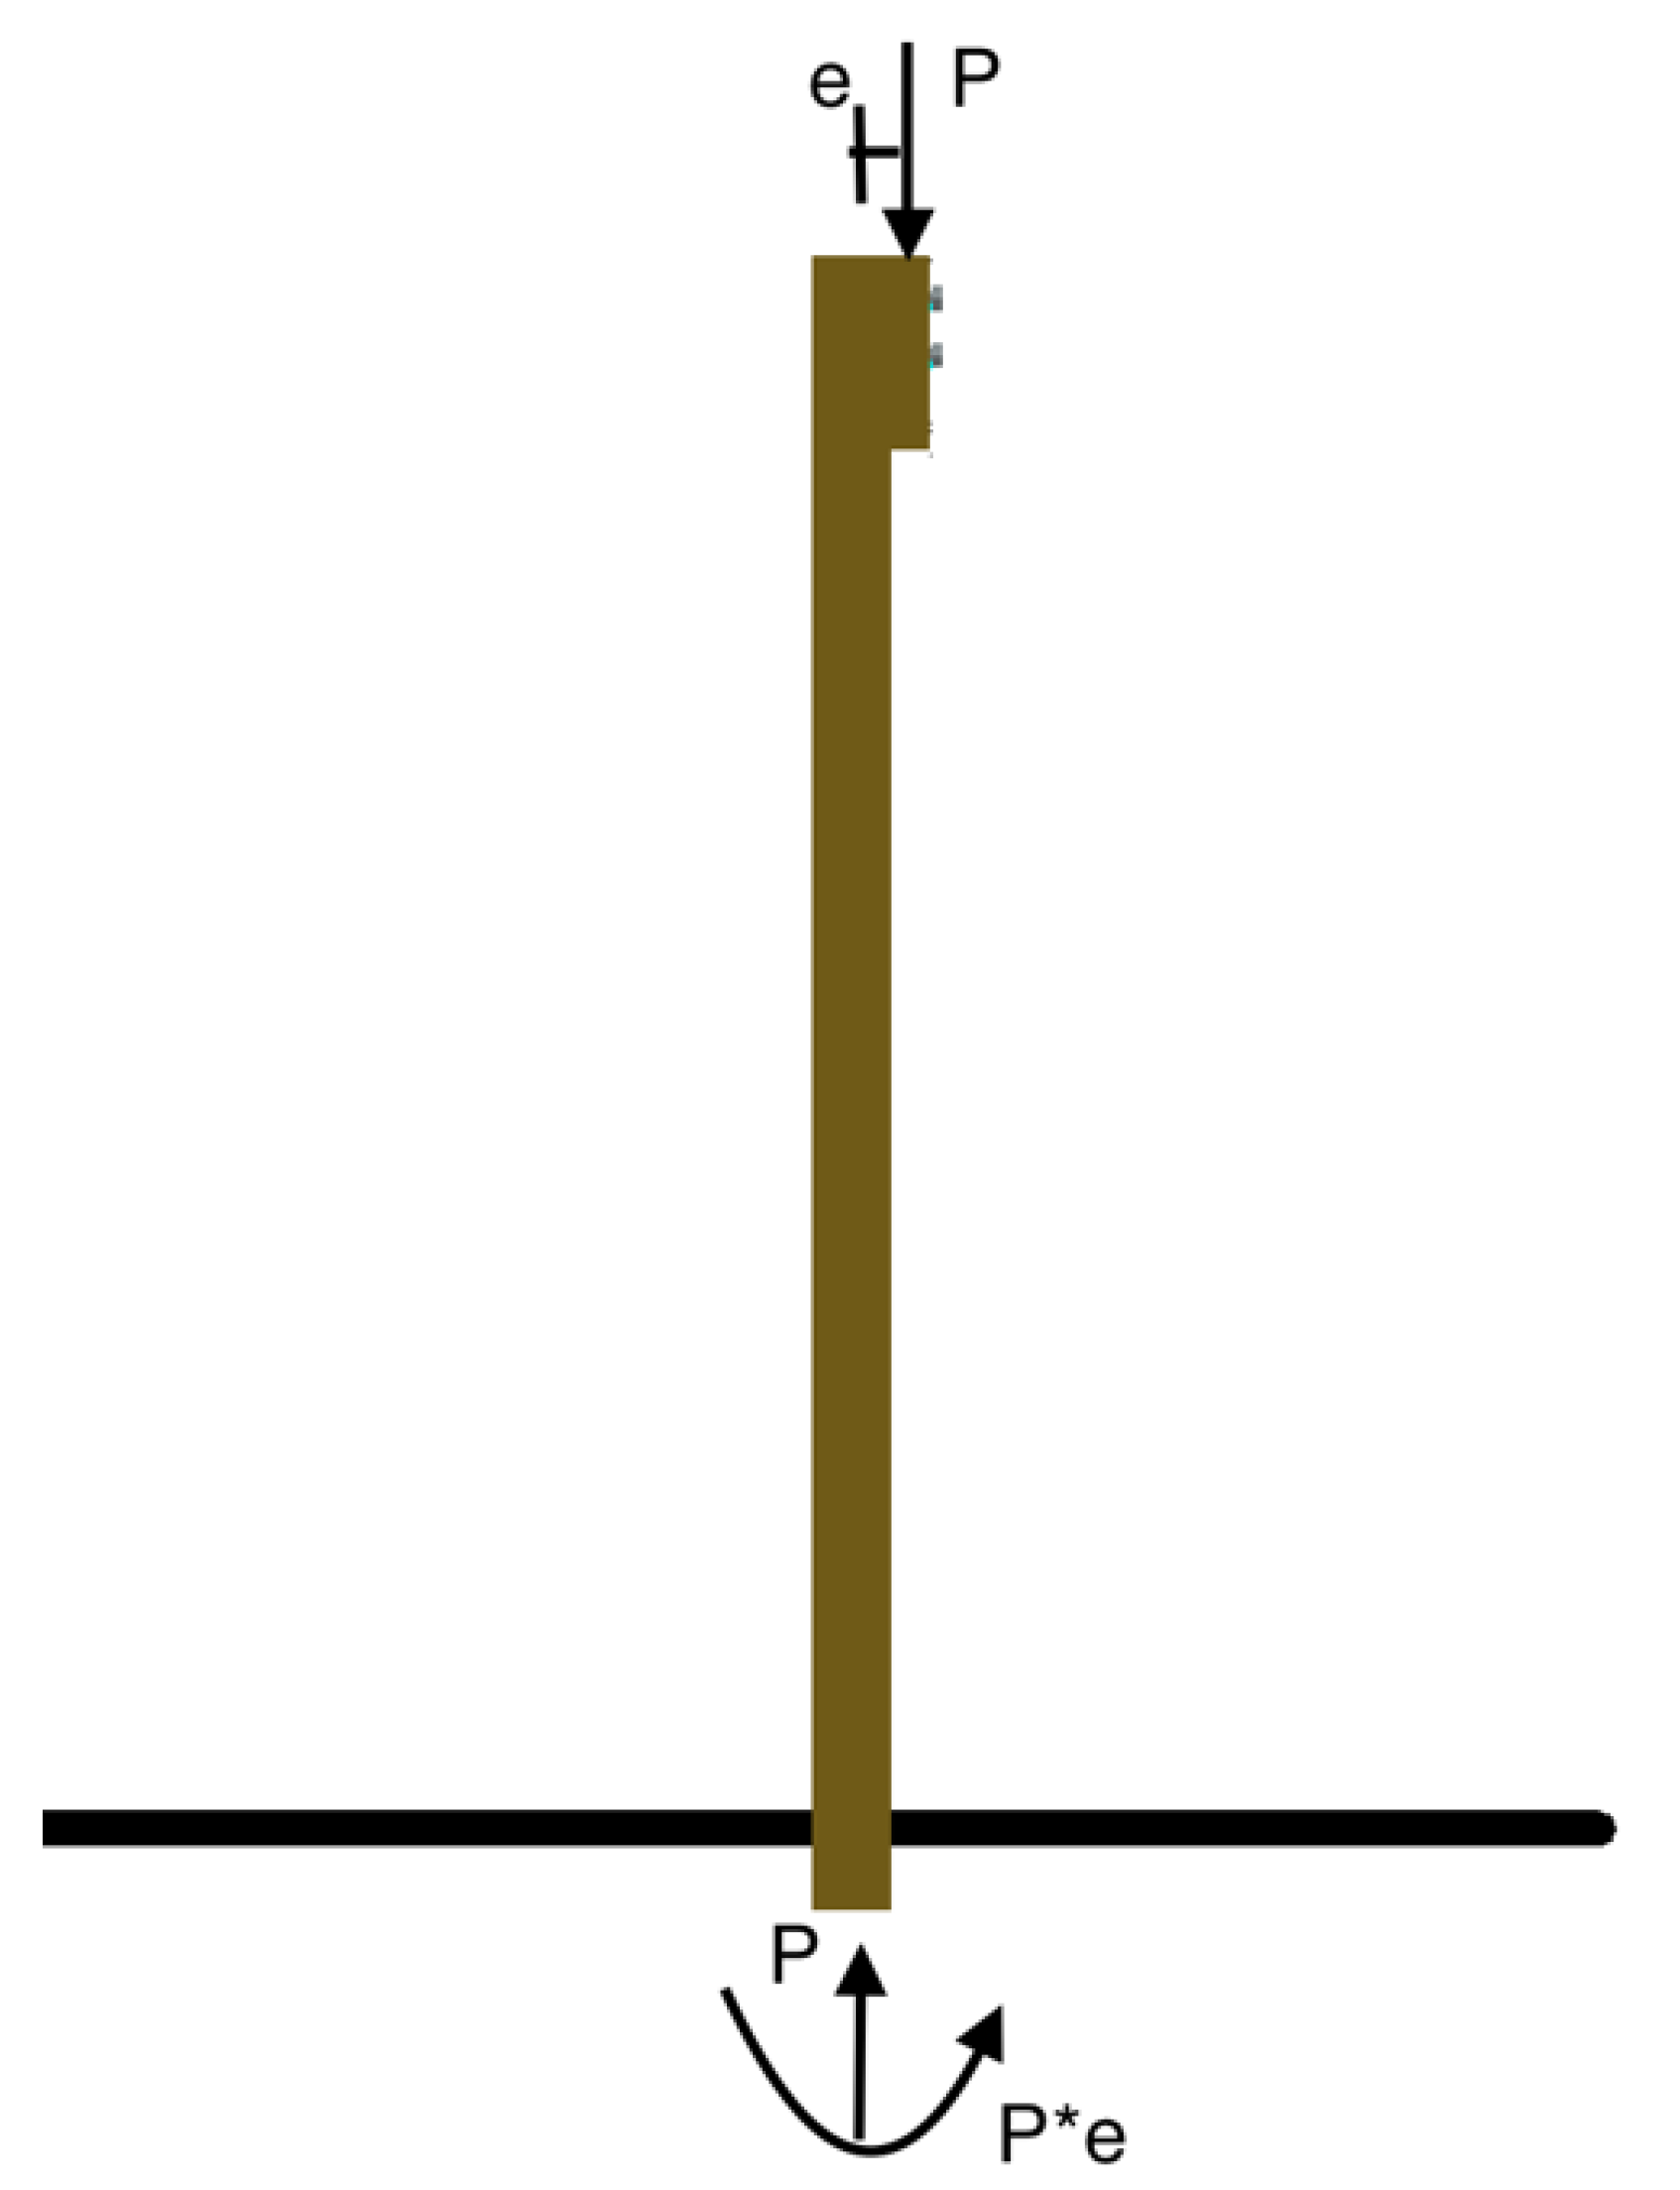
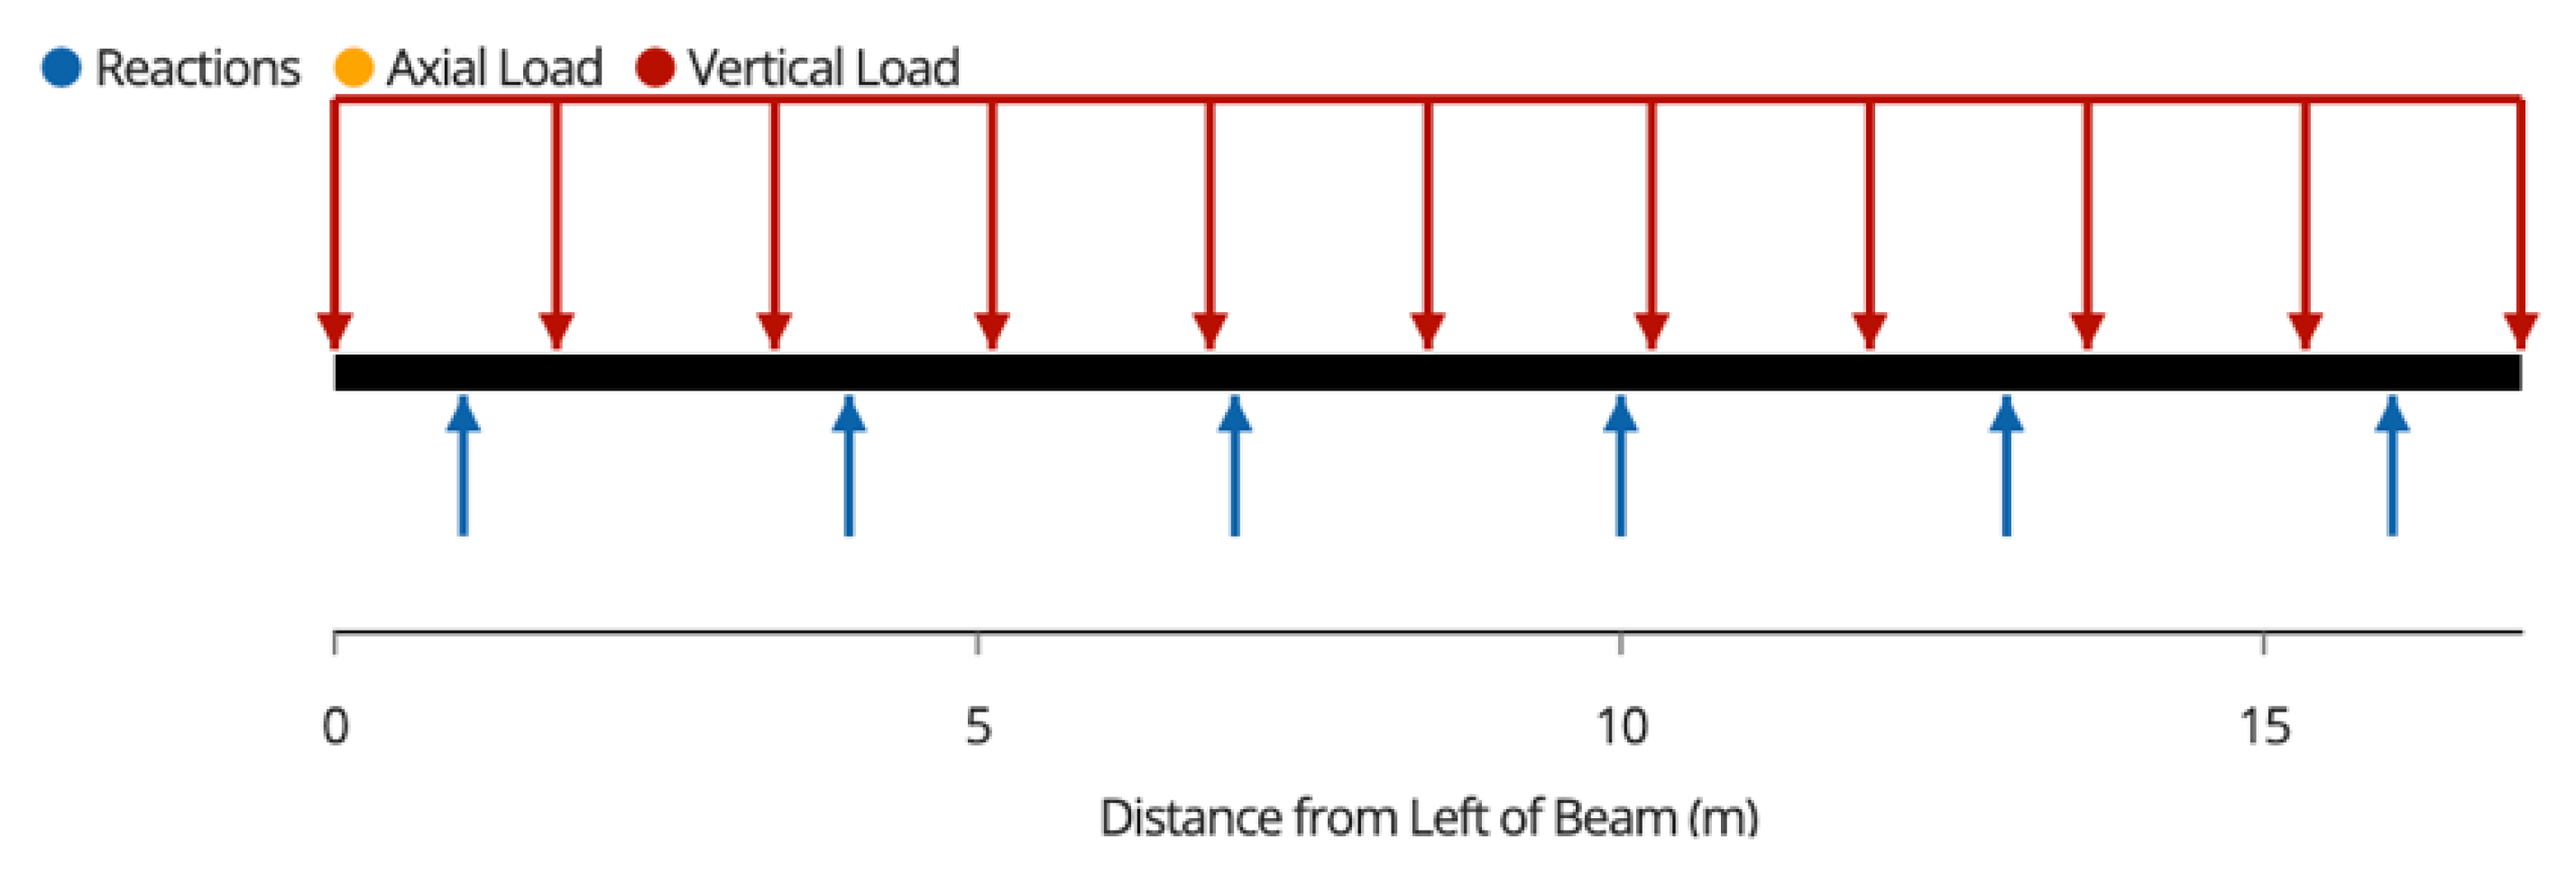
Appendix A.3. Cantilever System Analysis

The joists of the cantilever system exhibit the loading described in the free-body diagram presented in Figure A10.
Figure A10. Cantilevered system joists free-body diagram.
Technologies 10 00114 g0a10
The shear force, bending moment, and deflection diagrams are qualitatively illustrated in Figure A11a–c.
Figure A11. Cantilever joists (a) shear force diagram, (b) bending moment diagram, and (c) deflection diagram over the joist length in m.
Technologies 10 00114 g0a11
The results for a design load of 2.27 kPa obtained using an open-source beam calculator are summarized in Table A4.
Table A4. Cantilevered system joist load table for a design load of 2.27 kPa.
Maximum ComponentValue
Reaction7.11 kN
Shear3.64 kN
Moment1.85 kNm
Deflection1.90 mm
The load is then transferred to the aluminum beams with the free-body shown in Figure A12. The aluminum beams carry five-point loads from the joists, with a uniform distributed load representing its self-weight. Beams are supported by a post, which is pulled down by a steel cable.
Figure A12. Cantilevered system beam free-body diagram.
Technologies 10 00114 g0a12
The shear force, bending moment, and deflection diagrams are qualitatively illustrated in Figure A13a–c.
Figure A13. Cantilever beam (a) shear force diagram, (b) bending moment diagram, and (c) deflection diagram over the beam length in m.
Technologies 10 00114 g0a13
The beam can be analytically solved with the equations shown in Table A5.
Table A5. Cantilevered system beam load table for a design load of 2.27 kPa.
Maximum ComponentEquationValue
Post Reaction 8 R e a c t i o n J o i s t + 2 w o w L 57.70 kN
Cable Tension 4 R e a c t i o n J o i s t + w o w L 28.80 kN
Shear R e a c t i o n J o i s t + w o w L C a n t 32.50 kN
Moment R e a c t i o n J o i s t x + w o w L C a n t 2 2 32.40 kNm
Deflection R e a c t i o n J o i s t x 2 ( 3 L C a n t x ) 6 E I  160.30 mm
1 This is an approximate equation but computes a result within 5% of the true value.
Wow represents the uniform distributed self-weight of the beam, ReactionJoist represents the reaction force listed in Table A4, and x represents the distance between each reaction to the post.
Galvanized aircraft cable is recommended for the back support of the cantilever system. The size of cable can be selected by choosing the size with sufficient breaking strength against tensile loads [92]. For London, Ontario, 1/4″ 7 × 19 strand wire is adequate to carry the load.
A finite element analysis (Figure A14) can also be conducted to quickly calculate the stress of each member if no members are overloaded.
Figure A14. Cantilevered system stress contour in kPa using finite element analysis.
Technologies 10 00114 g0a14
The size of the concrete footing is dependent on the bearing capacity of the soil, which can be easily determined using Table A6, extrapolated from NBCC Table 9.4.4.1 [53].
Table A6. Maximum allowable bearing capacity for various soils as per the NBCC.
Soil Type and ConditionValue (kPa)
Dense Sand or Gravel150
Loose Sand or Gravel50
Dense Silt100
Stiff Clay150
Firm Clay75
Soft Clay40
Till200
Clay Shale300
Sound Rock500
According to the NBCC, sand or gravel can be identified by a picket test in which a 38 mm by 38 mm picket beveled at the end at 45° to a point is pushed into the soil. The soil is then classified dense if someone of average weight cannot push the picket more than 200 mm into the soil and loose if the picket penetrates 200 mm or more. Clay and silt are classified as stiff if it is difficult to indent by thumb pressure, whereas firm classification is denoted if it can be indented by moderate thumb pressure, with soft classification if it can be easily penetrated by thumb pressure. This test must be carried out on undisturbed soil in the wall of a test pit.
These bearing capacity values provided by NBCC are conservative and may result in designing a footing significantly larger than what is required. If users desire, a geotechnical analysis can be conducted to determine the accurate bearing capacity for their soil to design optimized footing sizes; however, this service is subject to high engineering consulting costs.
Once a bearing capacity is determined, the required footing diameter (df) for each post is calculated using Equation (A2):
d f = 4 P L π B c
where Bc is the bearing capacity listed in Table A6, and PL is the post load. The footings should be filled with 30 MPa concrete or other structural mixes to ensure sufficient durability against freeze–thaw cycles [93]. For locations in which freeze–thaw cycles are not critical, a 20 MPa mix can be used, which can be prepared by adding more water to the mix [93].

References

  1. Pearce, J. Photovoltaics—A Path to Sustainable Futures. Futures 2002, 34, 663–674. [Google Scholar] [CrossRef]
  2. Fu, R.; Feldman, D.; Margolis, R. U.S. Solar Photovoltaic System Cost Benchmark: Q1 2018. Renew. Energy 2018, 63. Available online: https://www.osti.gov/dataexplorer/biblio/dataset/1503848 (accessed on 11 September 2022).
  3. Dudley, D. Renewable Energy Will Be Consistently Cheaper Than Fossil Fuels by 2020, Report Claims. Available online: https://www.forbes.com/sites/dominicdudley/2018/01/13/renewable-energy-cost-effective-fossil-fuels-2020/ (accessed on 29 August 2022).
  4. Vaughan, A. Time to Shine: Solar Power Is Fastest-Growing Source of New Energy. Guardian 2017. Available online: https://www.theguardian.com/environment/2017/oct/04/solar-power-renewables-international-energy-agency (accessed on 2 November 2022).
  5. Short-Term Energy Outlook. U.S. Energy Information Administration (EIA). Available online: https://www.eia.gov/outlooks/steo/report/electricity.php (accessed on 29 August 2022).
  6. Global EV Outlook 2019—Analysis. IEA. Available online: https://www.iea.org/reports/global-ev-outlook-2019 (accessed on 29 August 2022).
  7. Electric Revolution: As EV Demand Increases, Can Utilities and Cities Keep Up? Available online: https://www.utilitydive.com/news/electric-revolution-as-ev-demand-increases-can-utilities-and-cities-keep/564585/ (accessed on 29 August 2022).
  8. 2019 Was the Year Electric Cars Grew up—Quartz. Available online: https://qz.com/1762465/2019-was-the-year-electric-cars-grew-up/ (accessed on 29 August 2022).
  9. EVO Report 2022 | BloombergNEF|Bloomberg Finance LP. BloombergNEF. Available online: https://about.bnef.com/electric-vehicle-outlook/ (accessed on 29 August 2022).
  10. Vaughan, A. Renewable Energy Will Be World’s Main Power Source by 2040, Says BP. Guardian 2019. Available online: https://m.geidco.org.cn/pcarticle/1086 (accessed on 11 September 2022).
  11. Ong, S.; Campbell, C.; Denholm, P.; Margolis, R.; Heath, G. Land-Use Requirements for Solar Power Plants in the United States; NREL/TP-6A20-56290; National Renewable Energy Lab.: Golden, CO, USA, 2013; p. 1086349.
  12. Wiginton, L.K.; Nguyen, H.T.; Pearce, J.M. Quantifying Rooftop Solar Photovoltaic Potential for Regional Renewable Energy Policy. Comput. Environ. Urban Syst. 2010, 34, 345–357. [Google Scholar] [CrossRef] [Green Version]
  13. Nguyen, H.T.; Pearce, J.M. Automated Quantification of Solar Photovoltaic Potential in Cities. Int. Rev. Spat. Plan. Sustain. Dev. 2013, 1, 49–60. [Google Scholar] [CrossRef] [Green Version]
  14. Nguyen, H.T.; Pearce, J.; Harrap, R.; Barber, G. The Application of LiDAR to Assessment of Rooftop Solar Photovoltaic Deployment Potential in a Municipal District Unit. Sensors 2012, 12, 4534–4558. [Google Scholar] [CrossRef]
  15. Heinstein, P.; Ballif, C.; Perret-Aebi, L.-E. Building Integrated Photovoltaics (BIPV): Review, Potentials, Barriers and Myths. Green 2013, 3, 125–156. [Google Scholar] [CrossRef]
  16. Biyik, E.; Araz, M.; Hepbasli, A.; Shahrestani, M.; Yao, R.; Shao, L.; Essah, E.; Oliveira, A.C.; del Caño, T.; Rico, E.; et al. A Key Review of Building Integrated Photovoltaic (BIPV) Systems. Eng. Sci. Technol. Int. J. 2017, 20, 833–858. [Google Scholar] [CrossRef]
  17. Duke, R.; Williams, R.; Payne, A. Accelerating Residential PV Expansion: Demand Analysis for Competitive Electricity Markets. Energy Policy 2005, 33, 1912–1929. [Google Scholar] [CrossRef]
  18. Denholm, P.; Margolis, R. Land-Use Requirements and the per-Capita Solar Footprint for Photovoltaic Generation in the United States. Energy Policy 2008, 36, 3531–3543. [Google Scholar] [CrossRef]
  19. Krishnan, R.; Haselhuhn, A.; Pearce, J.M. Technical Solar Photovoltaic Potential of Scaled Parking Lot Canopies: A Case Study of Walmart U.S.A. J. Innov. Sustain. RISUS 2017, 8, 104–125. [Google Scholar] [CrossRef] [Green Version]
  20. Alghamdi, A.; Bahaj, A.; Wu, P. Assessment of Large Scale Photovoltaic Power Generation from Carport Canopies. Energies 2017, 10, 686. [Google Scholar] [CrossRef]
  21. Iringová, A.; Kovačic, M. Design and Optimization of Photovoltaic Systems in a Parking Garage—A Case Study. Transp. Res. Procedia 2021, 55, 1171–1179. [Google Scholar] [CrossRef]
  22. Marques Lameirinhas, R.A.; Torres, J.P.N.; de Melo Cunha, J.P. A Photovoltaic Technology Review: History, Fundamentals and Applications. Energies 2022, 15, 1823. [Google Scholar] [CrossRef]
  23. Design and Optimization of Solar Carport Canopies for Maximum Power Generation and Efficiency at Bahawalpur. Available online: https://search.emarefa.net/en/detail/BIM-1167304-design-and-optimization-of-solar-carport-canopies-for-maximu (accessed on 29 August 2022).
  24. Performance and Analysis of Retail Store-Centered Microgrids with Solar Photovoltaic Parking Lot, Cogeneration, and Battery-based Hybrid Systems. Available online: https://www.researchgate.net/publication/351369632_Performance_and_analysis_of_retail_store-centered_microgrids_with_solar_photovoltaic_parking_lot_cogeneration_and_battery-based_hybrid_systems (accessed on 29 August 2022).
  25. Deshmukh, S.; Pearce, J. Electric Vehicle Charging Potential from Retail Parking Lot Solar Photovoltaic Awnings. Renew. Energy 2021, 169, 608–617. [Google Scholar] [CrossRef]
  26. Bhatti, A.R.; Salam, Z.; Aziz, M.J.B.A.; Yee, K.P. A Comprehensive Overview of Electric Vehicle Charging Using Renewable Energy. Int. J. Power Electron. Drive Syst. 2016, 7, 114. [Google Scholar] [CrossRef]
  27. Erickson, L.E.; Robinson, J.; Brase, G.; Cutsor, J. (Eds.) Solar Powered Charging Infrastructure for Electric Vehicles: A Sustainable Development; CRC Press, Taylor & Francis Group: Boca Raton, FL, USA, 2017; ISBN 978-1-4987-3156-0. [Google Scholar]
  28. Nunes, P.; Figueiredo, R.; Brito, M.C. The Use of Parking Lots to Solar-Charge Electric Vehicles. Renew. Sustain. Energy Rev. 2016, 66, 679–693. [Google Scholar] [CrossRef]
  29. Chandra Mouli, G.R.; Bauer, P.; Zeman, M. System Design for a Solar Powered Electric Vehicle Charging Station for Workplaces. Appl. Energy 2016, 168, 434–443. [Google Scholar] [CrossRef] [Green Version]
  30. Analysis of Energy Capture by Vehicle Solar Roofs in Conjunction|PDF|Photovoltaics|Solar Power. Available online: https://www.scribd.com/document/445304827/Analysis-of-energy-capture-by-vehicle-solar-roofs-in-conjunction (accessed on 29 August 2022).
  31. Kempton, W.; Tomić, J. Vehicle-to-Grid Power Fundamentals: Calculating Capacity and Net Revenue. J. Power Sources 2005, 144, 268–279. [Google Scholar] [CrossRef]
  32. Kempton, W.; Tomić, J. Vehicle-to-Grid Power Implementation: From Stabilizing the Grid to Supporting Large-Scale Renewable Energy. J. Power Sources 2005, 144, 280–294. [Google Scholar] [CrossRef]
  33. Sortomme, E.; El-Sharkawi, M. Optimal Charging Strategies for Unidirectional Vehicle-to-Grid. IEEE Trans. Smart Grid 2011, 2, 131–138. [Google Scholar] [CrossRef]
  34. Chunhua, L.; Chau, K.T.; Wu, D.; Gao, S. Opportunities and Challenges of Vehicle-to-Home, Vehicle-to-Vehicle, and Vehicle-to-Grid Technologies. Proc. IEEE 2013, 101, 2409–2427. [Google Scholar] [CrossRef]
  35. Optimal Integration of a Hybrid Solar-Battery Power Source into Smart Home Nanogrid with Plug-in Electric Vehicle|Request PDF. Available online: https://www.researchgate.net/publication/318831345_Optimal_integration_of_a_hybrid_solar-battery_power_source_into_smart_home_nanogrid_with_plug-in_electric_vehicle (accessed on 29 August 2022).
  36. Fathabadi, H. Novel Solar Powered Electric Vehicle Charging Station with the Capability of Vehicle-to-Grid. Sol. Energy 2017, 142, 136–143. [Google Scholar] [CrossRef]
  37. Tian, W.; Krishnamurthy, M.; Jiang, Y.; Shahidehpour, M. Vehicle Charging Stations with Solar Canopy: A Realistic Case Study within a Smart Grid Environment. Available online: https://sciexplore.ir/Documents/Details/648-833-223-614 (accessed on 29 August 2022).
  38. Lee, S.; Iyengar, S.; Irwin, D.; Shenoy, P. Shared Solar-Powered EV Charging Stations: Feasibility and Benefits. In Proceedings of the 2016 Seventh International Green and Sustainable Computing Conference (IGSC), Hangzhou, China, 7–9 November 2016; IEEE: Piscataway, NJ, USA, 2016; pp. 1–8. [Google Scholar]
  39. Kootenay Steel & Wood Carport. Available online: https://grizzlyshelter.ca/products/kootenay-steel-metal-and-wood-carport (accessed on 17 August 2022).
  40. Kootenay 2 Post Steel and Wood Carport. Available online: https://grizzlyshelter.ca/products/kootenay-2-post-cantilever-carport (accessed on 17 August 2022).
  41. Sunjoy AutoCove 20 Ft. × 11 Ft. Hanover Cedar Wood Carport. Wayfair Canada. Available online: https://www.wayfair.ca/Sunjoy--AutoCove-20-ft.-x-11-ft.-Hanover-Cedar-Wood-Carport-A110000900-L623-K~LKJP3376.html?refid=GX185556028987-LKJP3376&device=c&ptid=1339009412562&targetid=aud-835011428576:pla-1339009412562&network=g&ireid=212428809&gclid=CjwKCAjwo_KXBhAaEiwA2RZ8hHXImEHNrqAC9BYXj0CYJNtn2YxljAk4m4FTPTuhSZOHPi7UZhoTlxoCaF8QAvD_BwE (accessed on 17 August 2022).
  42. Domestic Solar Carport by Polysolar. Available online: https://www.specifiedby.com/polysolar/domestic-solar-carport (accessed on 17 August 2022).
  43. Miller, C. General Motors Will Launch Electric Heavy-Duty Trucks by 2035. Available online: https://www.caranddriver.com/news/a38696855/general-motors-electric-heavy-duty-trucks/ (accessed on 29 August 2022).
  44. Solar Carport. Polar Racking. Available online: https://www.polarracking.com/solar-carport-mounting-system/ (accessed on 11 September 2022).
  45. 6512.17C$ 40% OFF|2 Parking Space 5kw Carport Solar System For Home—Instrument Parts & Accessories. AliExpress. Available online: http://www.aliexpress.com/item/1005004384076086.html?src=ibdm_d03p0558e02r02&sk=&aff_platform=&aff_trace_key=&af=&cv=&cn=&dp= (accessed on 18 August 2022).
  46. Polivchuk, J. Exploring the Feasibility and Costs and Benefits of Solar Carports for the Calgary Parking Authority. 2018. Available online: https://dspace.library.uvic.ca/handle/1828/10402 (accessed on 11 September 2022).
  47. Vandewetering, N.; Hayibo, K.S.; Pearce, J.M. Impacts of Location on Designs and Economics of DIY Low-Cost Fixed-Tilt Open Source Wood Solar Photovoltaic Racking. Designs 2022, 6, 41. [Google Scholar] [CrossRef]
  48. Vandewetering, N.; Hayibo, K.S.; Pearce, J.M. Open-Source Design and Economics of Manual Variable-Tilt Angle DIY Wood-Based Solar Photovoltaic Racking System. Designs 2022, 6, 54. [Google Scholar] [CrossRef]
  49. Lehmann, S. Sustainable Construction for Urban Infill Development Using Engineered Massive Wood Panel Systems. Sustainability 2012, 4, 2707–2742. [Google Scholar] [CrossRef] [Green Version]
  50. Amiri, A.; Ottelin, J.; Sorvari, J.; Junnila, S. Cities as Carbon Sinks—Classification of Wooden Buildings. Environ. Res. Lett. 2020, 15, 094076. [Google Scholar] [CrossRef]
  51. Embodied Carbon Footprint Database. Circular Ecology. Available online: https://circularecology.com/embodied-carbon-footprint-database.html (accessed on 11 September 2022).
  52. Adpearance, I. What You Need to Know about Pressure Treated Wood|AIFP|PDX, OR. Available online: https://www.lumber.com/blog/what-you-need-to-know-about-pressure-treated-wood (accessed on 17 February 2022).
  53. National Research Council of Canada (Ed.) National Building Code of Canada 2015, 14th ed.; National Research Council of Canada: Ottawa, ON, Canada, 2015; ISBN 978-0-660-03633-5.
  54. 2018 NDS. Available online: https://awc.org/publications/2018-nds/ (accessed on 8 March 2022).
  55. Aluminum Beam 6061. Available online: https://www.metalsupermarkets.com/product/aluminum-beam-6061/ (accessed on 10 August 2022).
  56. CSA S157.1-05 Alumninum Design Code. Available online: https://kupdf.net/download/csa-s157-1-05-alumninum-design-code-1_58e2f8b6dc0d60470dda97e4_pdf (accessed on 11 August 2022).
  57. Joist Hangers and End Moments. Structural Engineering General Discussion. Eng-Tips. Available online: https://www.eng-tips.com/viewthread.cfm?qid=339938 (accessed on 10 January 2022).
  58. One Way Slab Design. Daily Civil. 2018. Available online: https://dailycivil.com/one-way-slab-design-how-to-design-one-way-slab-1/ (accessed on 11 September 2022).
  59. Freeman, J.M.; DiOrio, N.A.; Blair, N.J.; Neises, T.W.; Wagner, M.J.; Gilman, P.; Janzou, S. System Advisor Model (SAM) General Description (Version 2017.9.5); National Renewable Energy Lab. (NREL): Golden, CO, USA, 2018.
  60. Milosavljević, D.D.; Kevkić, T.S.; Jovanović, S.J. Review and Validation of Photovoltaic Solar Simulation Tools/Software Based on Case Study. Open Phys. 2022, 20, 431–451. [Google Scholar] [CrossRef]
  61. EV Database. Available online: https://ev-database.org/ (accessed on 29 August 2022).
  62. Falvo, M.C.; Sbordone, D.; Bayram, I.S.; Devetsikiotis, M. Ev Charging Stations and Modes: International Standards. In Proceedings of the IEEE International Symposium on Power Electronics, Electrical Drives, Automation and Motion, Ischia, Italy, 18–20 June 2014. [Google Scholar]
  63. Assessment of Electric Vehicles Concerning Impacts, Charging Infrastructure with Unidirectional and Bidirectional Chargers, and Power Flow Comparisons. Int. J. Energy Res. 2018. Available online: https://onlinelibrary.wiley.com/doi/10.1002/er.4033 (accessed on 29 August 2022).
  64. Li, Y.; Hu, J.; Chen, F.; Liu, S.; Yan, Z.; He, Z. A New-Variable-Coil-Structure-Based IPT System With Load-Independent Constant Output Current or Voltage for Charging Electric Bicycles. IEEE Trans. Power Electron. 2018, 33, 8226–8230. [Google Scholar] [CrossRef]
  65. Chen, Y.; Zhang, H.; Park, S.-J.; Kim, D.-H. A Switching Hybrid LCC-S Compensation Topology for Constant Current/Voltage EV Wireless Charging. IEEE Access 2019, 7, 133924–133935. [Google Scholar] [CrossRef]
  66. Daily Electric Vehicle Charging Load Profiles Considering Demographics of Vehicle Users. ScienceDirect. Available online: https://www.sciencedirect.com/science/article/pii/S0306261920305754?via%3Dihub (accessed on 29 August 2022).
  67. Lg LG410N2C-A5 Manuals|ManualsLib. Available online: https://www.manualslib.com/products/Lg-Lg410n2c-A5-9238432.html (accessed on 29 August 2022).
  68. Average KMs Driven Per Year|How Much Do Canadians Drive? Available online: https://www.thinkinsure.ca/insurance-help-centre/average-km-per-year-canada.html (accessed on 9 September 2022).
  69. EV Database. Available online: https://ev-database.org/cheatsheet/energy-consumption-electric-car (accessed on 9 September 2022).
  70. Sadat, S.A.; Vandewetering, N.; Pearce, J.M. Mechanical and Economic Analysis of Conventional Aluminum Photovoltaic Module Frames, Frames with Side Holes, and Open-Source Downward-Fastened Frames for Non-Traditional Racking. To Be Published. Available online: https://osf.io/preprints/uts48/ (accessed on 11 September 2022).
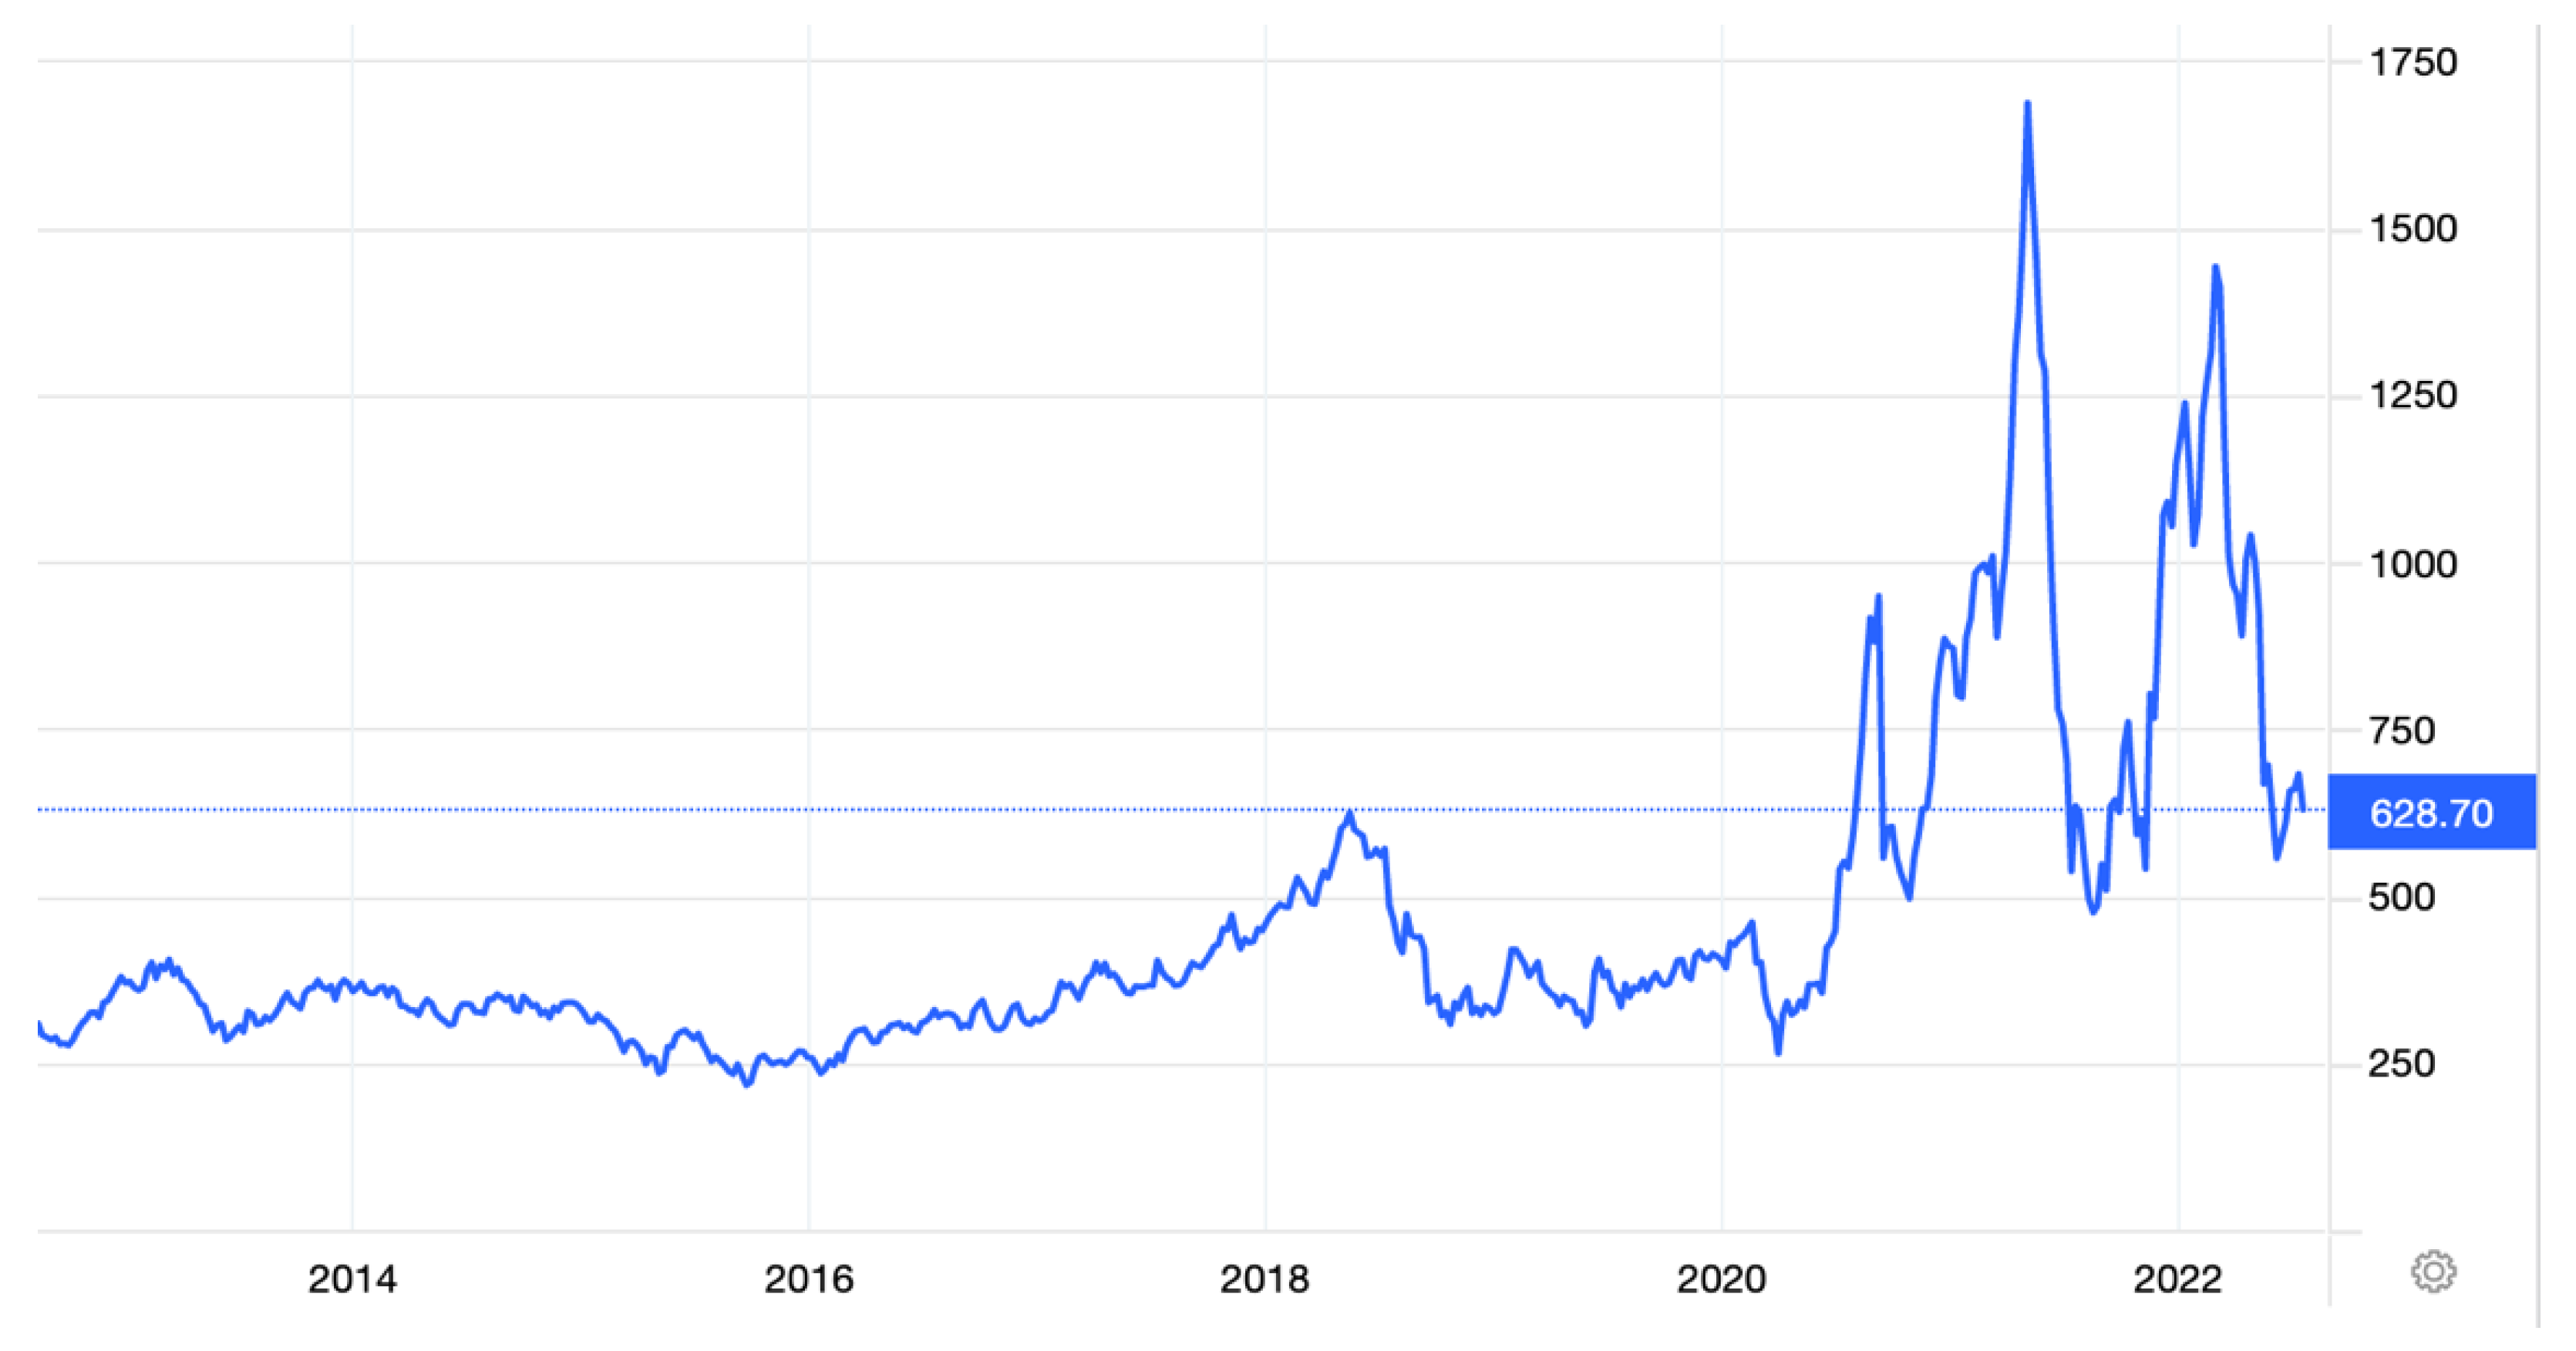
  71. Lumber. 2022 Data-1978-2021 Historical-2023 Forecast-Price-Quote-Chart. Available online: https://tradingeconomics.com/commodity/lumber (accessed on 26 July 2022).
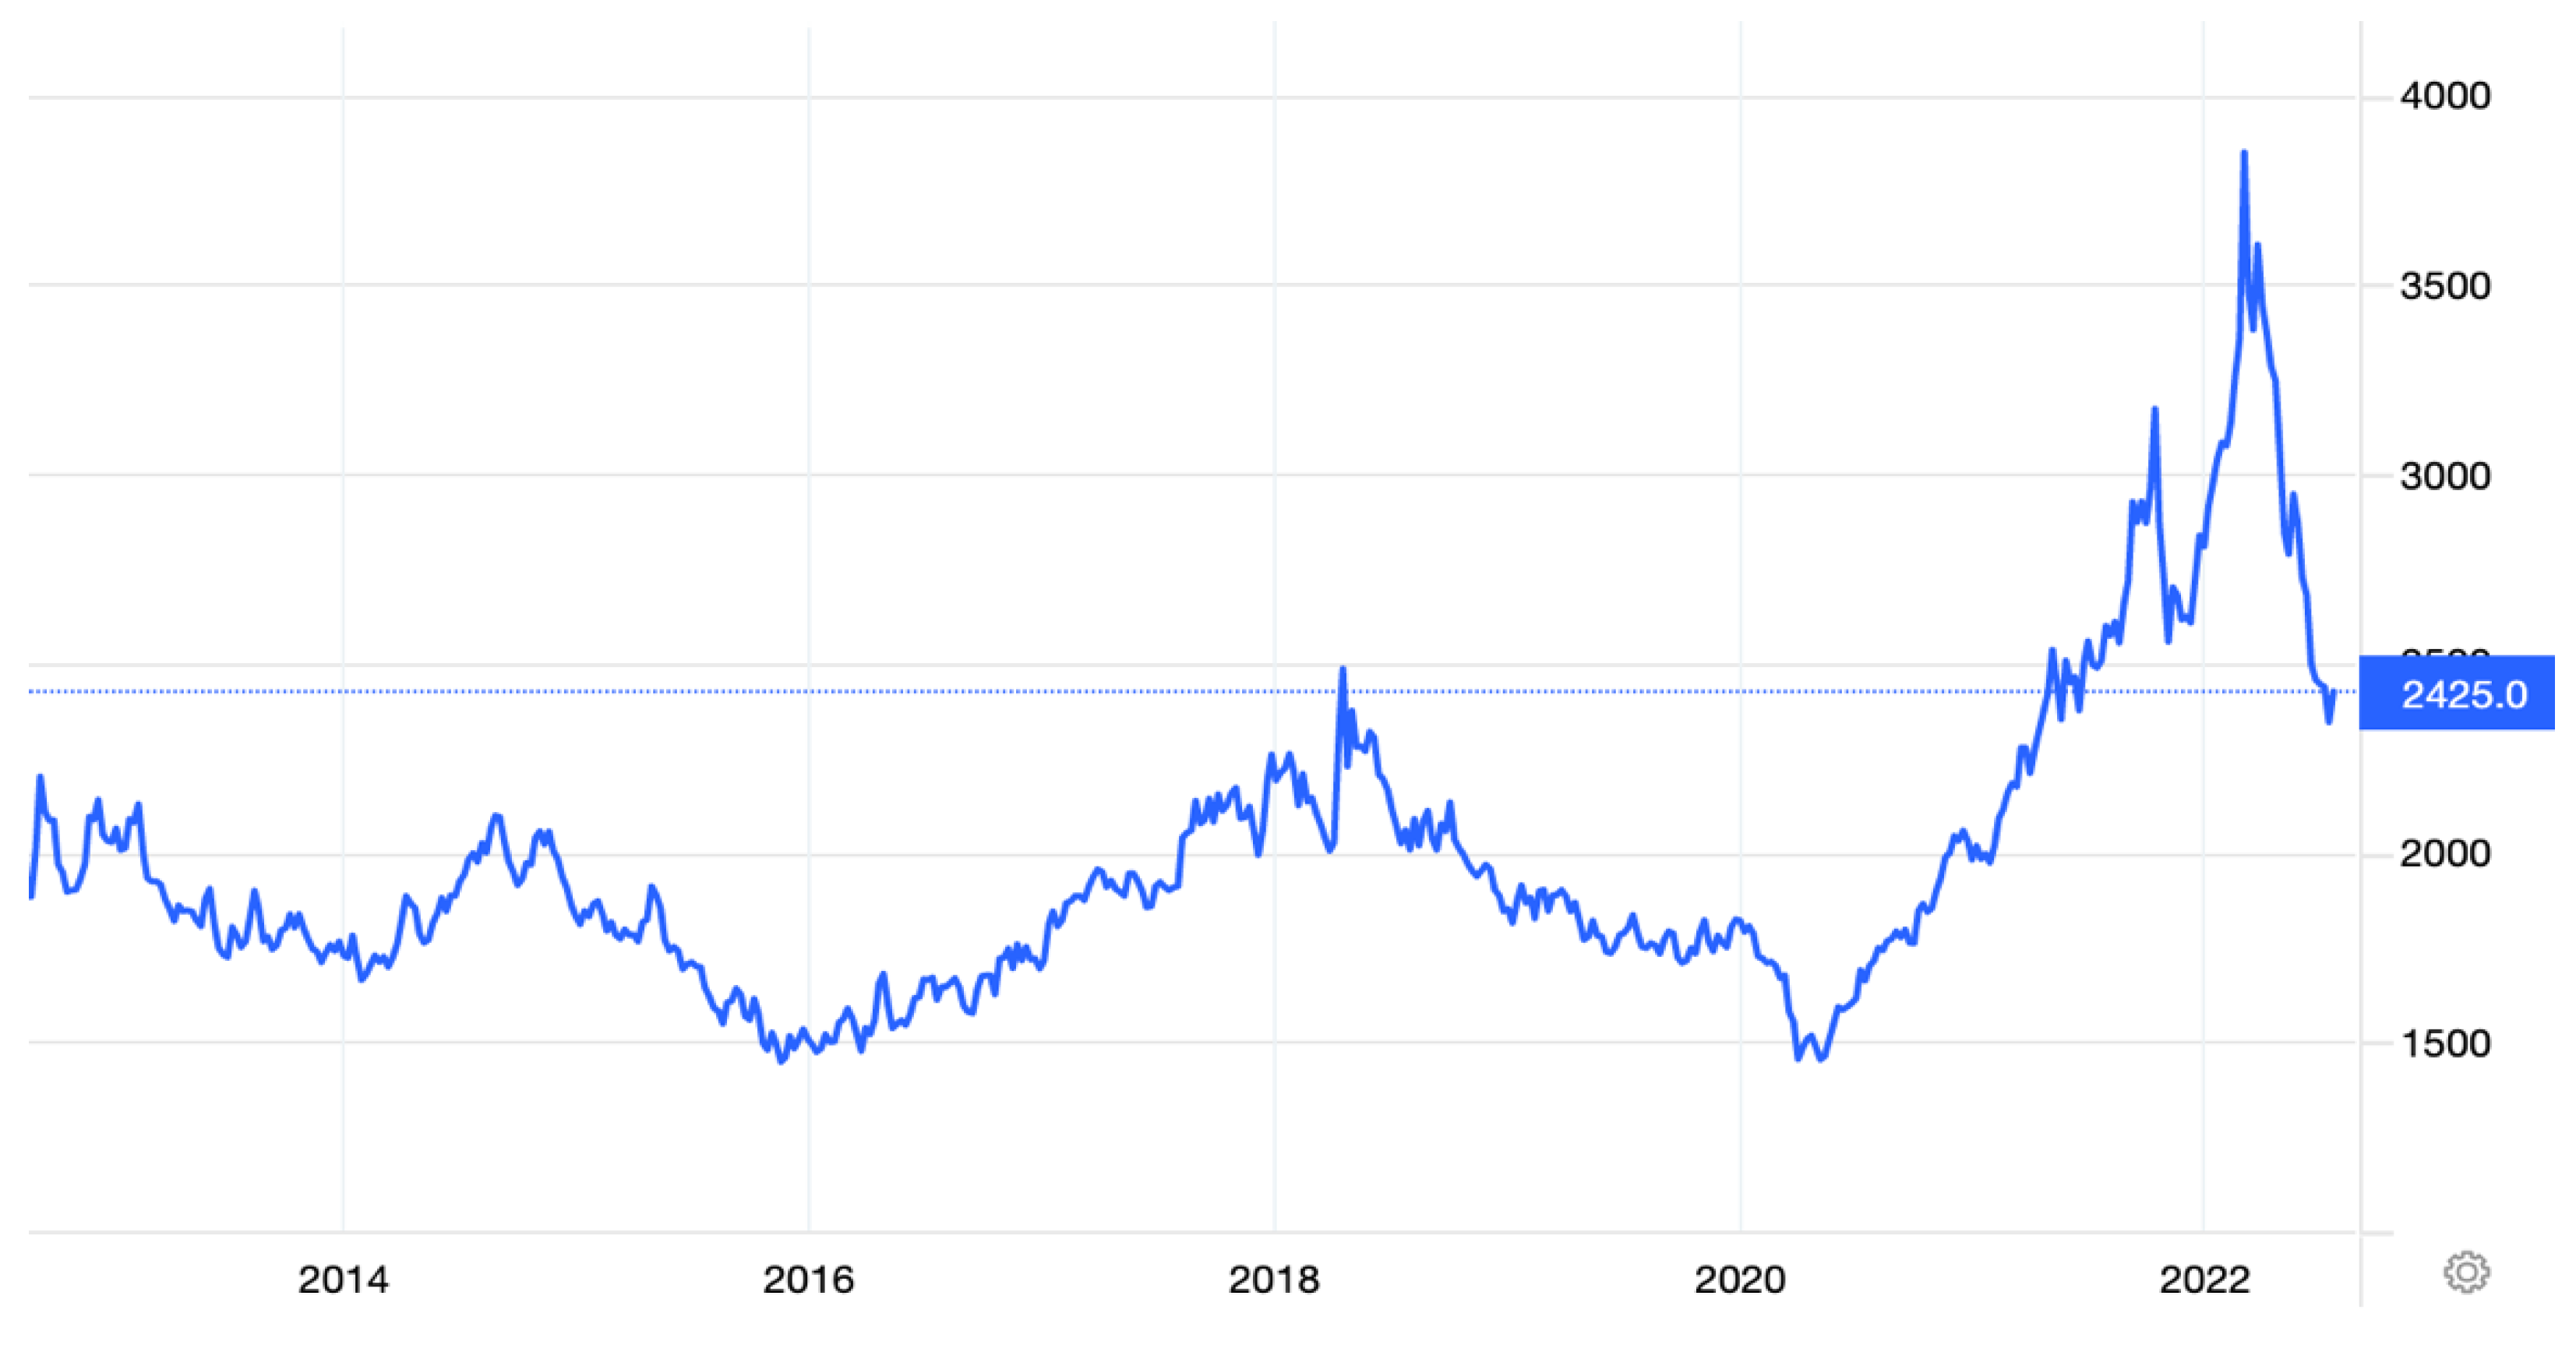
  72. Aluminum. 2022 Data-1989-2021 Historical-2023 Forecast-Price-Quote-Chart. Available online: https://tradingeconomics.com/commodity/aluminum (accessed on 26 July 2022).
  73. Top 10 Aluminum-Producing Countries (Updated 2022). Available online: https://investingnews.com/daily/resource-investing/industrial-metals-investing/aluminum-investing/aluminum-producing-countries/ (accessed on 18 August 2022).
  74. Raw Aluminium|OEC. Available online: https://oec.world/en/profile/hs/raw-aluminium (accessed on 17 August 2022).
  75. New Energy Vehicle Solar Charging Station Wallbox 22Kw Ev Station Ev Battery Charger For Home Use With Mppt Photovoltaic Panels. AliExpress. Available online: https://www.aliexpress.com/item/1005004354876999.html?spm=a2g0o.ppclist.product.2.519cxOEixOEiQQ&pdp_npi=2%40dis%21CAD%21C%24%207%2C230.85%21C%24%207%2C230.85%21%21%21%21%21%402101f6b116607501899558239e7ffc%2112000028877238090%21btf&_t=pvid:d8a0fdbc-3dd2-4032-8f80-d6fe9ba25004&afTraceInfo=1005004354876999__pc__pcBridgePPC__xxxxxx__1660750190 (accessed on 17 August 2022).
  76. Tamarack Solar Top of Pole Mounts for Large Solar Panels. Available online: https://www.altestore.com/store/solar-panel-mounts/top-of-pole-mounts-for-solar-panels/tamarack-solar-top-of-pole-mounts-6072-cell-solar-panels-p40745/ (accessed on 18 August 2022).
  77. TPM3 Pole Mount for Three 60/72 Cell Solar Modules. Available online: https://www.off-the-grid-solar.com/products/tpm3-pole-mount-for-three-60-72-cell-solar-modules (accessed on 18 August 2022).
  78. 12 Solar Panel Ground Mounting Kit IronRidge. Available online: https://sunwatts.com/12-solar-panel-ground-mounting-kit-ironridge/ (accessed on 26 July 2022).
  79. Hot Car Fatalities Are Year-Round Threat. Available online: https://www.consumerreports.org/car-safety/hot-car-fatalities-year-round-threat-to-children-pets-heat-stroke-a2015990109/ (accessed on 29 August 2022).
  80. Golden, J. Photovoltaic Canopies: Thermodynamics to Achieve a Sustainable Systems Approach to Mitigate the Urban Heat Island Hysteresis Lag Effect. Int. J. Sustain. Energy 2006, 25, 1–21. [Google Scholar] [CrossRef] [Green Version]
  81. Golden, J.S.; Carlson, J.; Kaloush, K.E.; Phelan, P. A Comparative Study of the Thermal and Radiative Impacts of Photovoltaic Canopies on Pavement Surface Temperatures. Sol. Energy 2007, 81, 872–883. [Google Scholar] [CrossRef]
  82. OpenEVSE. Electric Vehicle Charging Solutions. Available online: https://www.openevse.com/ (accessed on 29 August 2022).
  83. Canadian Solar 340W Solar Panel|CS1H-340MS—Volts Energies. Available online: https://volts.ca/products/canadian-solar-340w-solar-panel-cs1h-340ms?currency=CAD&utm_medium=product_sync&utm_source=google&utm_content=sag_organic&utm_campaign=sag_organic (accessed on 26 July 2022).
  84. Shingled 680 Watt Solar Panel-Panneau Solaire 680w-All Black 340w Canadian Solar Panels With [CSA Approval], For RV, Boats, Cottages, Camping and All Off-Grid Applications (2). Available online: https://solarpowerstore.ca/products/made-in-canada-shingled-340-watt-solar-panel-panneau-solaire-340w-all-black-340w-canadian-solar-panels-with-csa-approval (accessed on 26 July 2022).
  85. Canadian Solar Bi-Facial CS3W-435MB-AG Solar Panel—Volts Energies. Available online: https://volts.ca/products/canadian-solar-bi-facial-445w-solar-panel-cs3w-445mb-ag?currency=CAD&utm_medium=product_sync&utm_source=google&utm_content=sag_organic&utm_campaign=sag_organic (accessed on 26 July 2022).
  86. Canadian Solar-335W, Monocrystalline Solar PV Module. Raysolar Store. Available online: https://www.raysolar.ca/shop/product/canadian-solar-335w-monocrystalline-solar-pv-module/ (accessed on 11 September 2022).
  87. Canadian Solar-CS1Y-390MS, 390W Mono Perc. Available online: https://www.off-the-grid-solar.com/products/canadian-solar-cs1y-390ms-390w-mono-perc (accessed on 26 July 2022).
  88. Hess, D.J. The Politics of Niche-Regime Conflicts: Distributed Solar Energy in the United States. Environ. Innov. Soc. Transit. 2016, 19, 42–50. [Google Scholar] [CrossRef] [Green Version]
  89. Prehoda, E.; Pearce, J.M.; Schelly, C. Policies to Overcome Barriers for Renewable Energy Distributed Generation: A Case Study of Utility Structure and Regulatory Regimes in Michigan. Energies 2019, 12, 674. [Google Scholar] [CrossRef] [Green Version]
  90. Lee, D.; Hess, D.J. Incumbent Resistance and the Solar Transition: Changing Opportunity Structures and Framing Strategies. Environ. Innov. Soc. Transit. 2019, 33, 183–195. [Google Scholar] [CrossRef]
  91. Free Beam Calculator|ClearCalcs. Available online: https://clearcalcs.com/freetools/beam-analysis (accessed on 11 August 2022).
  92. Galvanized Aircraft Cable 7 × 19, 1/4 in. × 200 Feet. Available online: https://www.bestmaterials.com/detail.aspx?ID=25064 (accessed on 11 August 2022).
  93. Kessy, J.G.; Alexander, M.G.; Beushausen, H. Concrete Durability Standards: International Trends and the South African Context. J. S. Afr. Inst. Civ. Eng. 2015, 57, 47–58. [Google Scholar] [CrossRef]
Figure 1. Single-Span System Post Configuration.
Technologies 10 00114 g001
Figure 2. Single Span System (a) Double 2 × 12 beams installed across posts, (b) 2 3/8″ carriage bolts, and diagonal 2 × 4 braces per connection, and (c) 3 × 5 mending plate with 1-1/2″ joist hanger nails to create splice joint at approximately 20% of the span length.
Technologies 10 00114 g002
Figure 3. Single Span System (a) 2 × 10 joists installed along the beams, spaced 1 m apart, connected with splice joints, and braced with 2 × 10 braces, and (b) joist to beam installation using H1 hurricane ties.
Technologies 10 00114 g003
Figure 4. (a) ¼″ × 2-1/2″ lag screws connections screwed directly to the top of joists, and (b) connections alternatively made to the side of modules into the side of the joists.
Technologies 10 00114 g004
Figure 5. ¼″ × 2-1/2″ carriage bolt, nut, and washer used to secure the connection.
Technologies 10 00114 g005
Figure 6. Finished Single-Span System.
Technologies 10 00114 g006
Figure 7. Completed Double Span System, constructed in the same way as the Single Span System, but with aluminum I beams being installed on top of the 6 × 6 posts with self-tapping screws.
Technologies 10 00114 g007
Figure 8. Post arrangement for the cantilevered system.
Technologies 10 00114 g008
Figure 9. Aluminum beams installed onto 8 × 8 posts angled at five degrees and supported with ¼″ 7 × 19 strand galvanized aircraft cable and diagonal bracing.
Technologies 10 00114 g009
Figure 10. Final cantilevered system.
Technologies 10 00114 g010
Figure 11. Lumber prices in USD in the last decade.
Technologies 10 00114 g011
Figure 12. Aluminum prices in USD in the last decade.
Technologies 10 00114 g012
Figure 13. Load-matching results (kW) between the PV system and EV charging stations supplying multiple EVs, using the load profiles proposed by Zhang et al. [66] for a day with maximum energy production (26 June) in London, Ontario. The three levels of EV charging stations in the North American EV standards are used. Load matching is plotted in different charging locations. In Home Type 1, the EV users return home at noon.
Technologies 10 00114 g013
Figure 14. Load-matching results (kW) between the PV system and EV charging stations supplying multiple EVs, using the load profiles proposed by Zhang et al. [66] for a day with minimum energy production (24 December) in London, Ontario. The first two levels of EV charging stations in the North American EV standards are used. Load matching is plotted in different charging locations. In Home Type 1, the EV users return home at noon.
Technologies 10 00114 g014
Figure 15. Monthly cumulative energy production (MWh) of the PV system and the charging load for the three levels of charging stations in the case of a type 1 home (EV user returns home at noon). (a) Level 1 charging station (1.4 kW). (b) Level 2 charging station (8 kW). (c) Level 3 charging station (50 kW). (d) Level 3 charging station (100 kW).
Technologies 10 00114 g015
Figure 16. Comparison of the annual energy production of a single PV carport using a 20.51% efficient PV (reference efficiency) relative to the average annual energy needs of a single EV in London, Ontario. The value current EVs on the market is used for the EV energy per distance.
Technologies 10 00114 g016
Figure 17. Cantilevered system reoriented for outsides of parking lots.
Technologies 10 00114 g017
Figure 18. Single-car system for home DIY designs.
Technologies 10 00114 g018
Table 1. Mechanical properties of no. 1/2 spruce pine fir lumber as per the National Design Specification.
Material PropertyValue
Density460 kg/m3
Flexural Strength5.44 MPa
Shear Strength0.86 MPa
Tensile Strength2.85 MPa
Compressive Strength7.29 MPa
Young’s Modulus9169.97 MPa
Table 2. Mechanical properties of 6061 T6 aluminum from Metal Supermarkets, London.
Material PropertyValue
Density2767 kg/m3
Yield Strength275 MPa
Ultimate Tensile Strength310 Mpa
Shear Strength206 Mpa
Young’s Modulus68,900 Mpa
Table 3. Modelling parameters for solar PV in SAM.
ParameterValueSource
System TypeResidential/No Economic ModelThis Study
PV ModuleLG Electronics Inc. LG410N2C-A5[67]
Efficiency20.51%
Length2 m
Width1 m
Module TypeMonocrystalline Silicon—Monofacial
Number of Modules15This Study
Tilt Angle5° (design requirement)This Study
Azimuth180°This Study
DC Power Rating6.154 kWDCThis Study
DC-to-AC Ratio1.02This Study
Soiling Losses5%[59]
DC Power Losses4.44%
AC Power Losses 1%
Table 4. Single-span system Bill of Materials.
Member NamePiece 1Cost per Piece 2QuantityCost
2 × 10 Joists
2 × 10 Joists
2″ × 10″ × 14′
2″ × 10″ × 12′
CAD 53.99
CAD 46.28
18
9
CAD 971.82
CAD 416.52
Double 2 × 12 Beams2″ × 12″ × 16′CAD 85.7612CAD 1029.12
Double 2 × 12 Beams2″ × 12″ × 10′CAD 53.604CAD 214.40
Joist Splice Tie Plate3″ × 5″ Mending PlateCAD 2.2524CAD 54.00
Beam Splice Tie Plate3″ × 7″ Mending PlateCAD 2.7912CAD 33.48
Lateral Bracing2″ × 10″ × 14′CAD 53.993CAD 161.97
Joist to Beam TiesH1 Hurricane TiesCAD 2.1934CAD 74.46
Posts6″ × 6″ × 16′CAD 88.7412CAD 1064.88
Post Lateral Diagonals2″ × 4″ × 10′CAD 12.824CAD 51.28
Nuts, Bolts, and Washers3/8″ × 10″CAD 4.5224CAD 108.48
Screws2-1/2″ Deck Screws (1175/pail)CAD 38.991CAD 38.99
D10 Nails1-1/2″ Joist Hanger NailsCAD 4.655CAD 23.25
Module-to-Joist Connection¼″ × 2-1/2″ Carriage Bolt, Nut, and WasherCAD 1.01 3204CAD 206.04
Total Cost with No ConcreteCAD 4448.69
Concrete for Posts30 Mpa Quikrete concreteCAD 5.5536 bagsCAD 199.80
Total Cost:CAD 4648.49
1 All lumber is to be pressure treated, and all hardware is to be hot dipped galvanized. 2 All costs are in Canadian Dollars as of 13 July 2022, before tax. 3 Cost per connection (1 bolt, 1 nut, 1 washer).
Table 5. Two-Span System Bill of Materials.
Member NamePiece 1Cost Per Piece 2QuantityCost
2 × 10 Joists
2 × 10 Joists
2″ × 10″ × 14′
2″ × 10″ × 12′
CAD 53.99
CAD 46.28
21
11
CAD 1133.79
CAD 509.08
T6 6061 Aluminum Beam4″ × 8″ × 0.270″ × 60′CAD 71202CAD 14,240.00
Joist Splice Tie Plate3″ × 5″ Mending PlateCAD 2.2524CAD 54.00
Beam Splice Tie Plate3″ × 7″ Mending PlateCAD 2.7912CAD 33.48
Lateral Bracing2″ × 10″ × 14′CAD 53.995CAD 269.95
Joist to Beam TiesH1 Hurricane TiesCAD 2.1934CAD 74.46
Posts6″ × 6″ × 16′CAD 88.748CAD 709.92
Post Lateral Diagonals4″ × 4″ × 14′CAD 33.892CAD 67.78
Screws2-1/2″ Deck Screws (1175/pail)CAD 38.991CAD 38.99
D10 Nails1-1/2″ Joist Hanger NailsCAD 4.655CAD 23.25
Self-Tapping Screws#10 × 2″ 100 PackCAD 15.091CAD 15.09
Module to Joist Connection¼″ × 2-1/2″ Carriage Bolt, Nut, and WasherCAD 1.01 3204CAD 206.04
Total Cost with No ConcreteCAD 17,375.83
Concrete for Posts30 MPa Quikrete concreteCAD 5.55100 bagsCAD 555.00
Total Cost:CAD 17,930.83
1 All lumber is to be pressure treated, and all hardware is to be hot dipped galvanized. 2 All costs are in Canadian Dollars as of 13 December 2021, before tax. 3 Cost per connection (1 bolt, 1 nut, 1 washer).
Table 6. Cantilever System List of Materials.
Member NamePiece 1Cost per Piece 2QuantityCost
2 × 10 Joists
2 × 10 Joists
2″ × 10″ × 16′
2″ × 10″ × 10′
CAD 61.71
CAD 38.57
30
10
CAD 1851.30
CAD 385.70
T6 6061 Aluminum Beam4″ × 8″ × 0.270″ × 12′CAD 142411CAD 15,664.00
Joist Splice Tie Plate3″ × 5″ Mending PlateCAD 2.2530CAD 67.50
Lateral Bracing2″ × 10″ × 14′CAD 53.9910CAD 539.90
Joist to Beam TiesH1 Hurricane TiesCAD 2.1968CAD 148.92
Posts8″ × 8″ × 16′CAD 214.8811CAD 2363.68
Post Lateral Diagonals6″ × 6″ × 16′CAD 88.744CAD 354.96
Screws2-1/2″ Deck Screws (1175/pail)CAD 38.992CAD 77.98
D10 Nails1-1/2″ Joist Hanger NailsCAD 4.6510CAD 46.50
Self-Tapping Screws#10 × 2″ 100 PackCAD 15.092CAD 30.18
Aircraft Cable5/16″ 7 × 19 GalvanizedCAD 6.6744CAD 293.48
Module to Joist Connection¼″ × 2-1/2″ Carriage Bolt, Nut, and WasherCAD 1.01 3256CAD 258.56
Total Cost with No ConcreteCAD 22,082.66
Concrete for Posts30 MPa Quikrete ConcreteCAD 5.55102 bagsCAD 566.10
Total Cost:CAD 22,648.76
1 All lumber is to be pressure-treated, and all hardware is to be hot-dip-galvanized. 2 All costs are in Canadian dollars as of 13 December 2021, before tax. 3 Cost per connection (one bolt, one nut, and one washer).
Table 7. Cost per W for each system in CAD.
SystemSizeCostCost per W
5 Spot Single Span3 × 17 × 410 W = 20.91 kWCAD 4648.49CAD 0.2223
6 Spot Double Span 13 × 20 × 410 W = 24.60 kWCAD 17,930.83CAD 0.7289
5 Spot Cantilevered16 × 4 × 410 W = 26.24 kWCAD 23,120.51CAD 0.8811
1 This system spans in multiples of two; thus, a six-parking-spot system is used for this analysis.
Table 8. Cost per W for each system in CAD.
SpansParking SpotsSizeCostCost per W
23 × 8 × 410 W = 9.84 kWCAD 2409.16CAD 0.2448
Single103 × 32 × 410 W = 39.36 kWCAD 8696.37CAD 0.2209
203 × 62 × 410 W = 76.26 kWCAD 16,744.87CAD 0.2196
23 × 8 × 410 W = 9.84 kWCAD 7198.93CAD 0.7316
Double 1103 × 32 × 410 W = 39.36 kWCAD 27,664.54CAD 0.7029
203 × 62 × 410 W = 76.26 kWCAD 53,515.80CAD 0.7018
27 × 4 × 410 W = 11.48 kWCAD 10,263.87CAD 0.8941
Cantilevered1031 × 4 × 410 W = 50.84 kWCAD 43247.39CAD 0.8507
2061 × 4 × 410 W = 100.04 kWCAD 81,785.03CAD 0.8175
1 This system spans in multiples of two; thus, a six-parking-spot system is used for this analysis.
Table 9. System cost sensitivity based on material commodity prices in CAD.
SystemCurrent Cost per WLow Cost per W 1High Cost per W 2
Five-Spot Single SpanCAD 0.2223CAD 0.0911CAD 0.5336
Six-Spot Double SpanCAD 0.7289CAD 0.4027CAD 1.2451
Five-Spot CantileveredCAD 0.8811CAD 0.4745CAD 1.6374
1 Assuming a 41% increase in wood price and a 60% increase in aluminum price. 2 Assuming a 240% increase in wood price and a 160% increase in aluminum price.
Table 10. Comparison of the annual energy balance (MWh) of a single PV carport and a charging station (charging multiple EVs) between London, ON, and Los Angeles. The comparison accounts for different charger power levels and different charging sites. Positive values represent energy injected into the grid by the PV system, and negative values represent energy drawn from the grid.
Home Type 1 (MWh)Home Type 2 (MWh)Workplace (MWh)
Charger Power LevelLondon, ONLos
Angeles
London, ONLos
Angeles
London, ONLos
Angeles
Level 1 Charger (1.4 kW)4.57.12.24.74.97.4
Level 2 Charger (8 kW)−9.0−6.5−22.4−19.9−7.0−4.5
Level 3 Charger (50 kW)−95.4−92.8−179.1−176.5−82.9−80.4
Level 3 Charger (100 kW)−198.1−195.6−365.5−362.9−173.3−170.7
Publisher’s Note: MDPI stays neutral with regard to jurisdictional claims in published maps and institutional affiliations.

