Bibliometric Analysis for Working Capital: Identifying Gaps, Co-Authorships and Insights from a Literature Survey


Abstract
:1. Introduction
2. Material and Methods
3. Bibliometric Analysis Covering “Working Capital” on Web of Science and Scopus
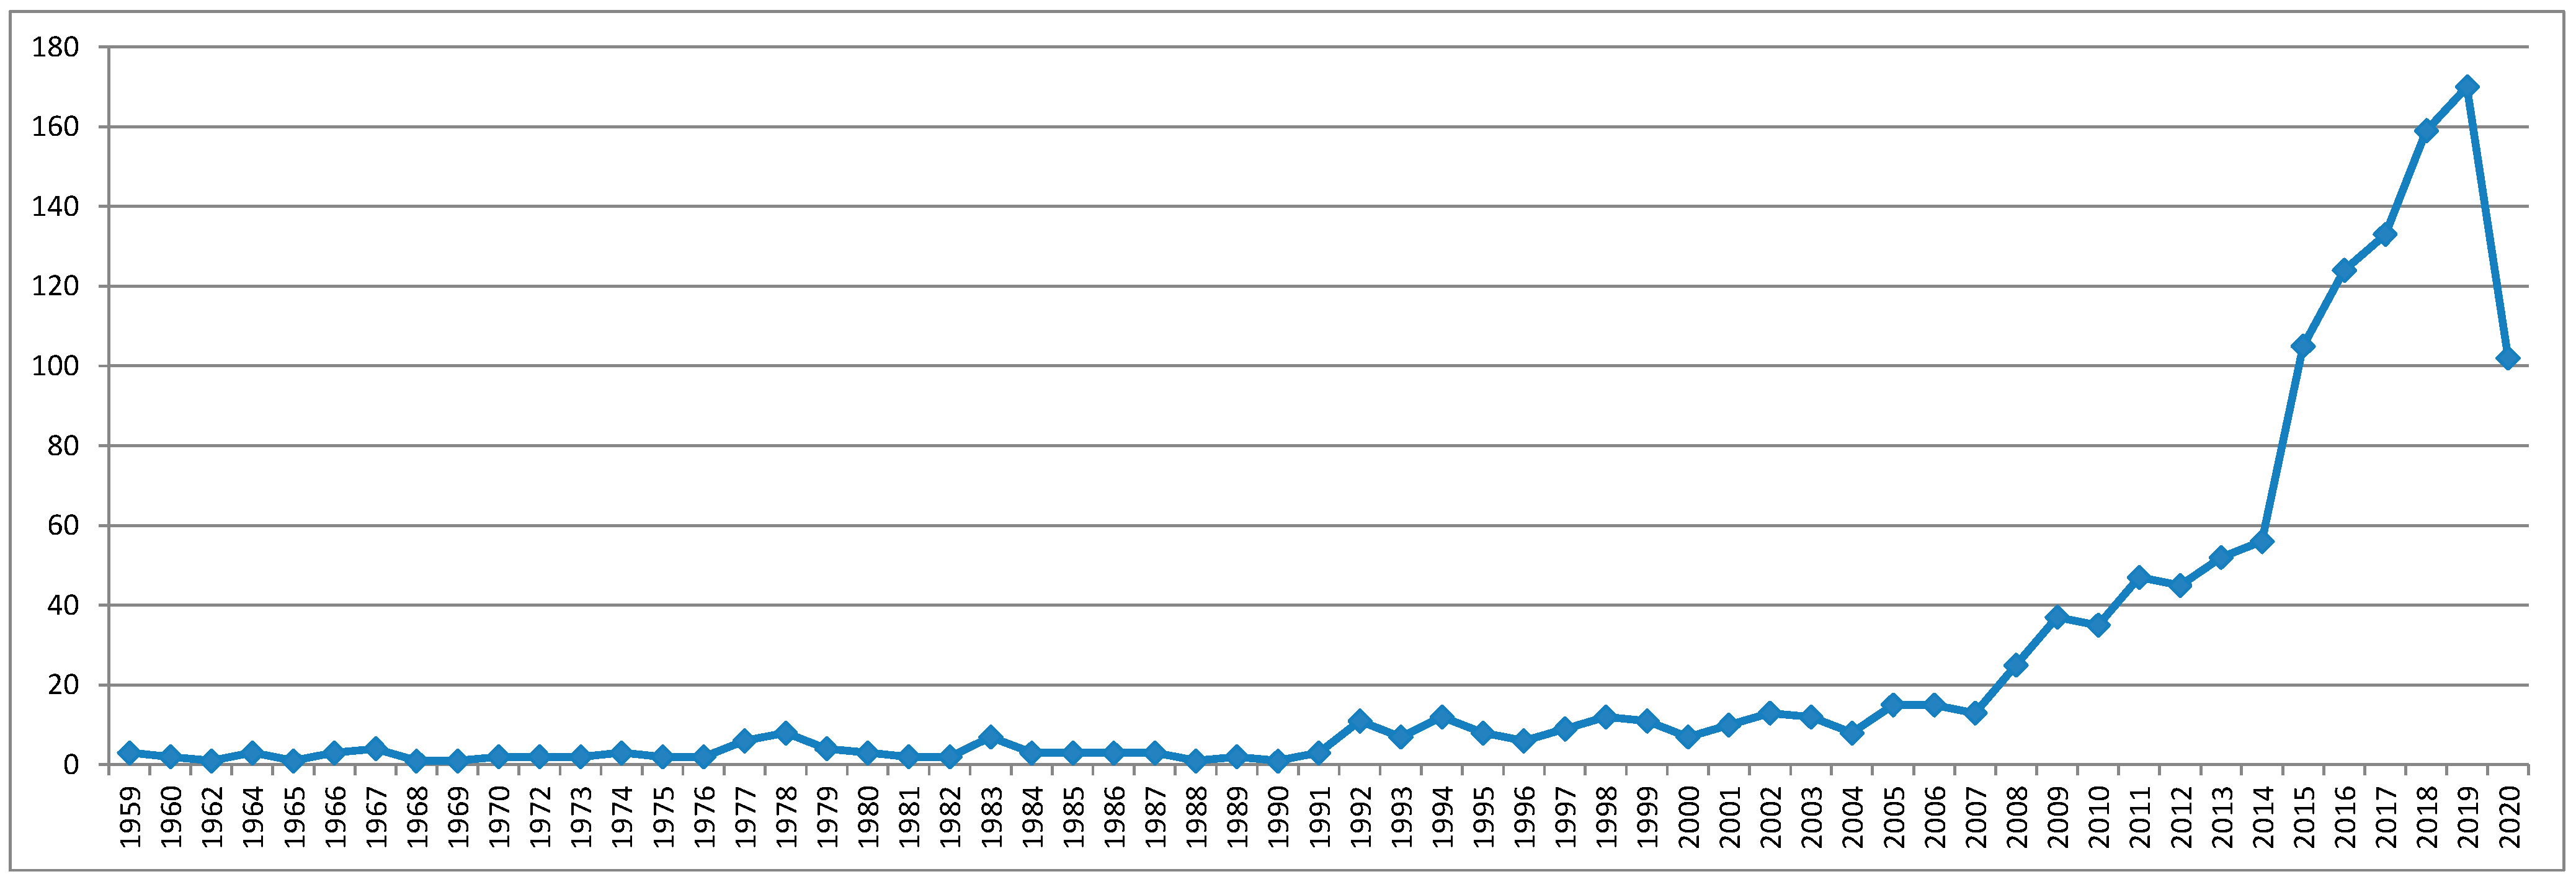
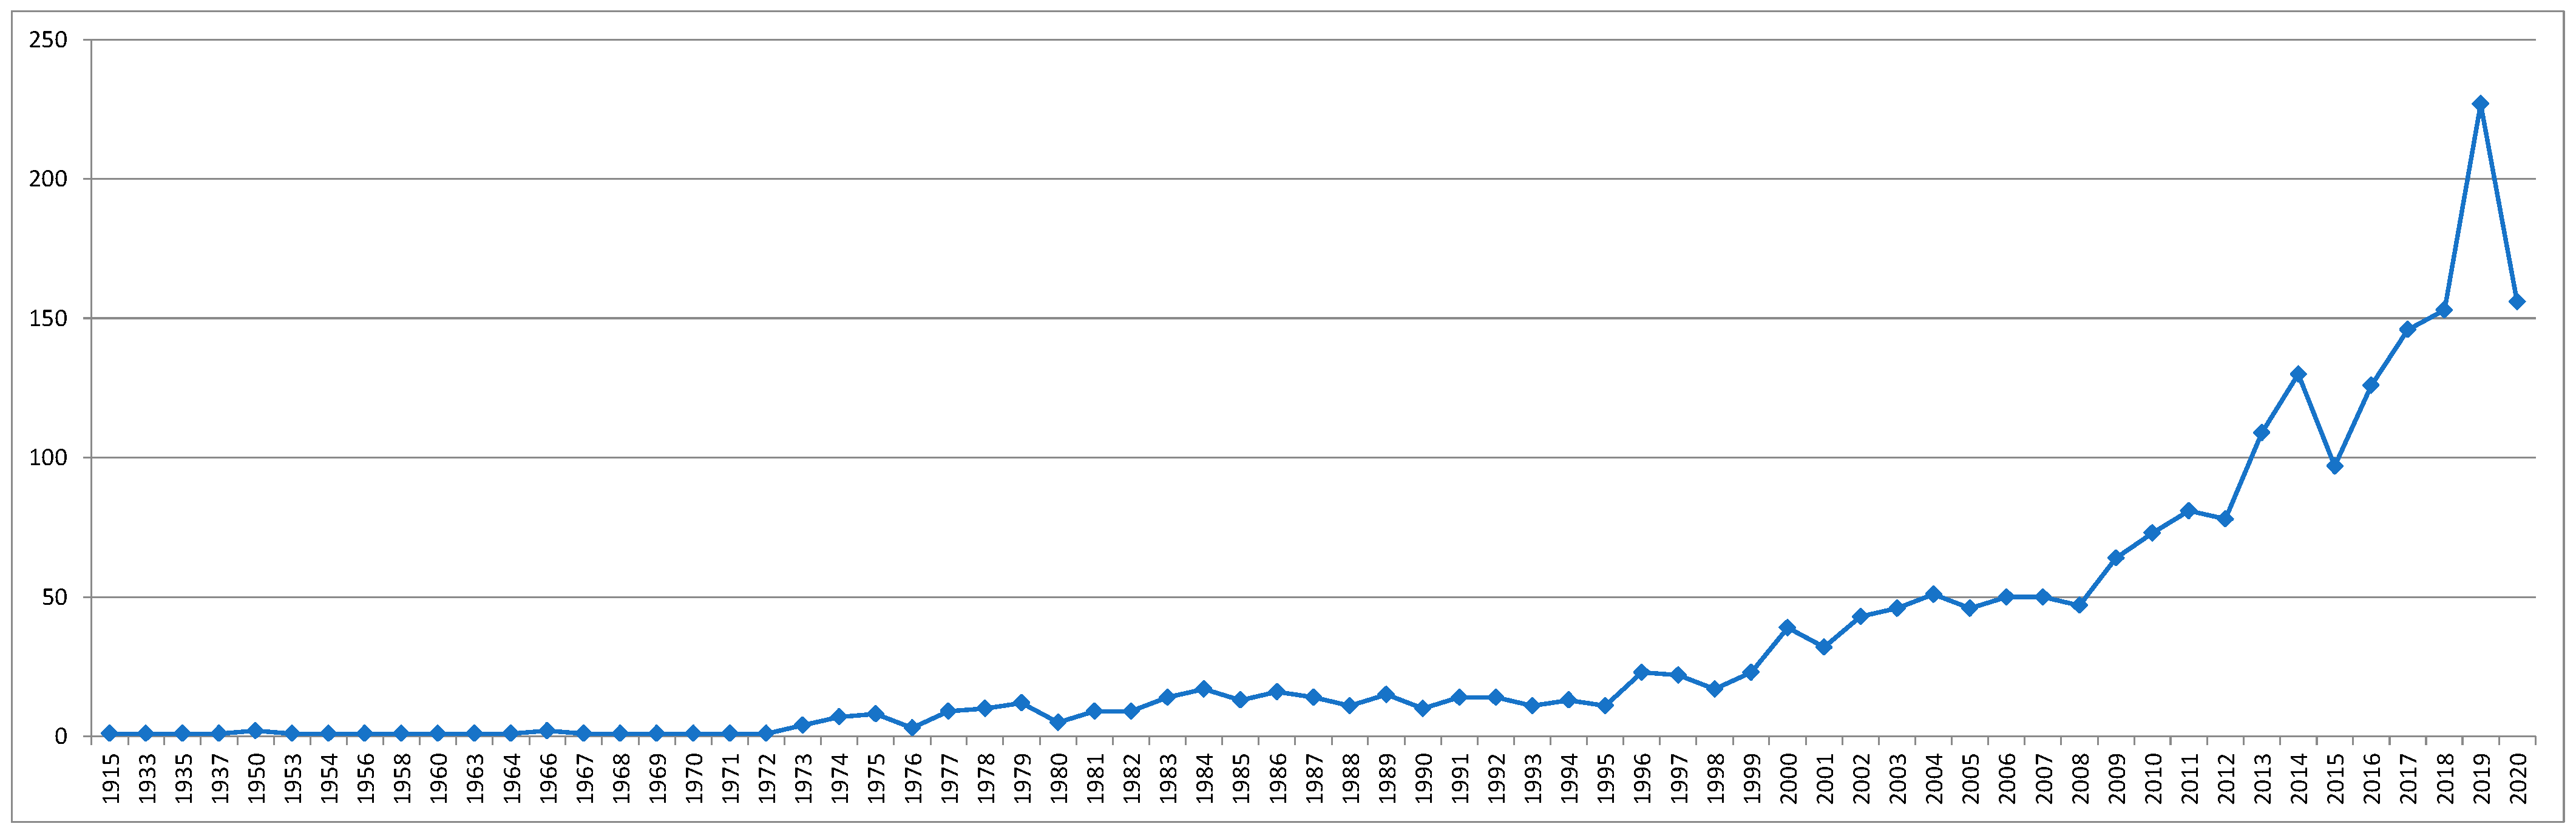
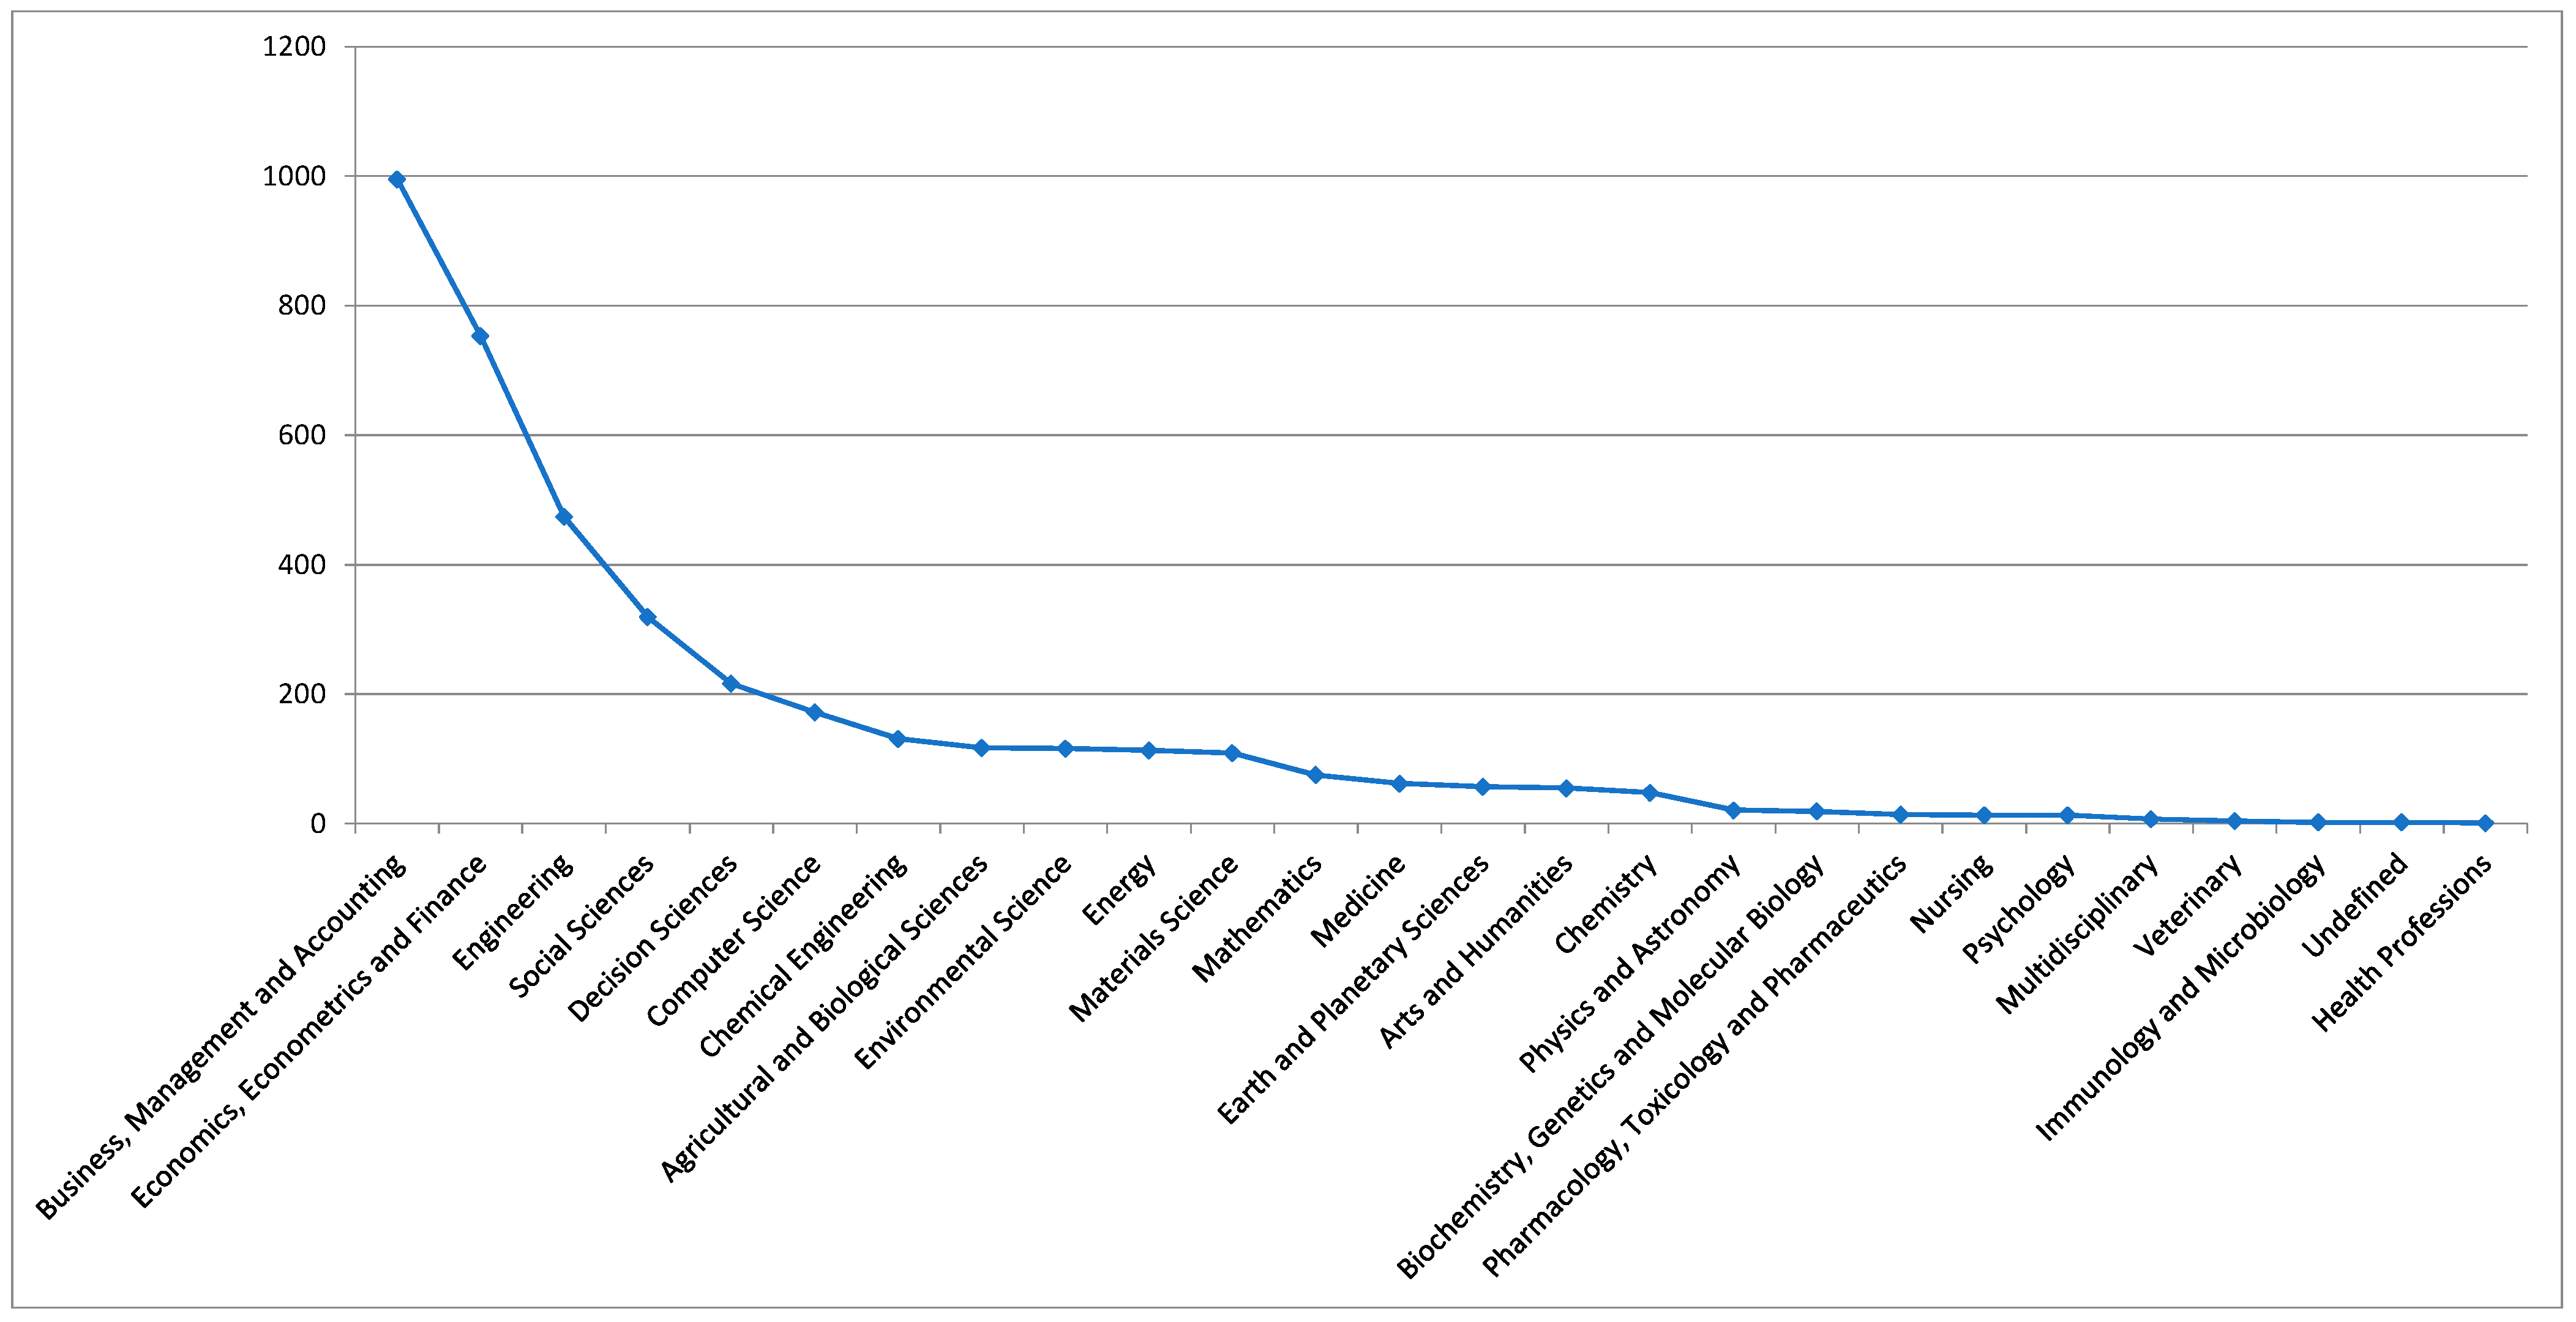
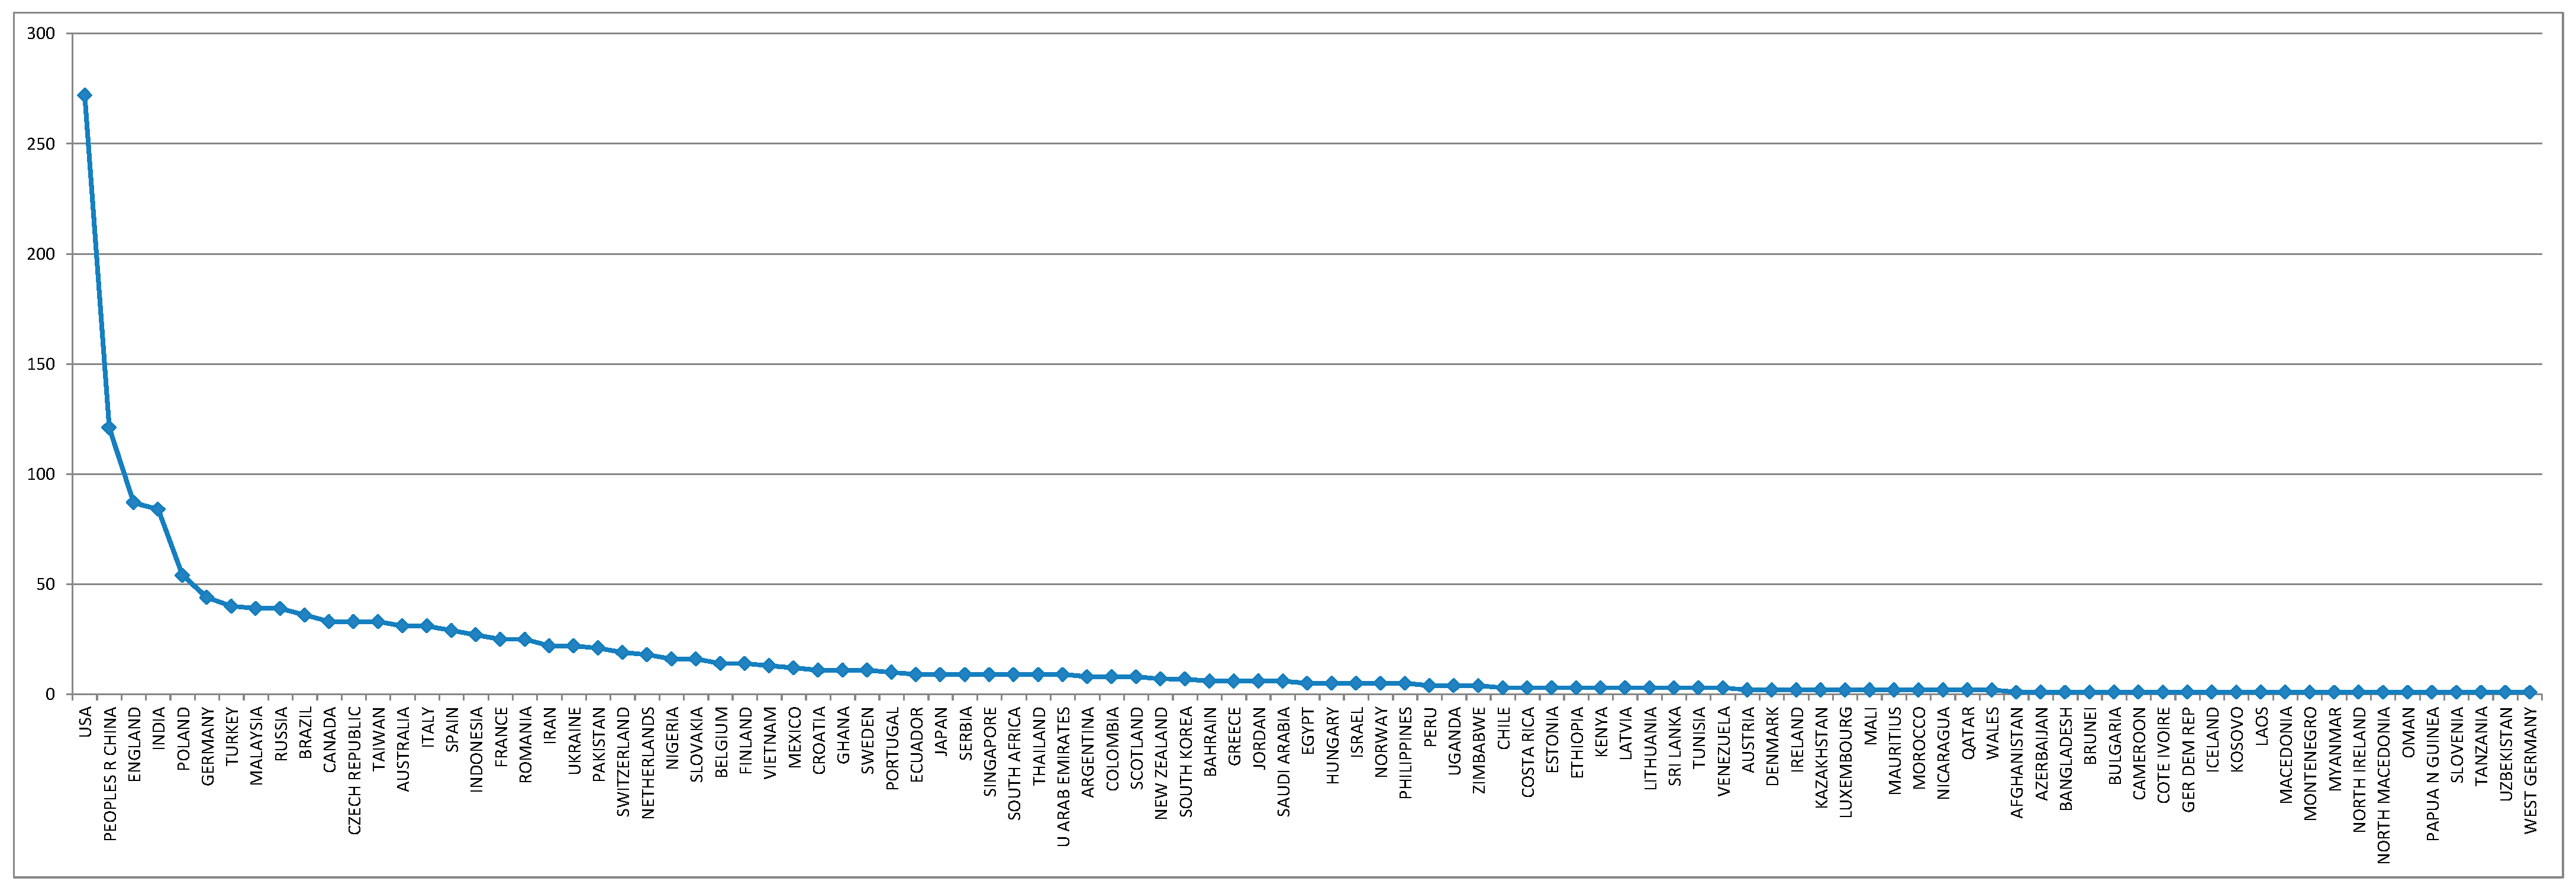
3.1. Benchmarking the Information Available on the Two Scientific Platforms
3.2. Outputs from Bibliographic Data
- -
- Norm. Citations: number of citations of the document weighted by the average number of citations of all documents published in the same year and considered in the data that is supplied by VOSviewer. The normalization adjusts for the fact that older documents have had more time to obtain citations than more recent documents (van Eck and Waltman 2020; VOSviewer 2020);
- -
- Avg. citations: the average number of citations received by the studies in which a keyword appears or the average citations obtained by the documents published by a source, an author, an organization, or a country (van Eck and Waltman 2020; VOSviewer 2020);
- -
- Avg. pub. year: the average publication year of the studies in which a keyword appears or the average publication year of the studies published by a source, an author, an organization, or a country (van Eck and Waltman 2020; VOSviewer 2020);
- -
- -
- Eccentricity: distance from a node to the extreme node from it within the network (Bastian et al. 2009; McTavish 2020; Gephi 2020);
- -
- Closeness centrality: average distance between any two nodes within the network (Bastian et al. 2009; McTavish 2020; Gephi 2020);
- -
- Harmonic closeness centrality: variant of closeness centrality, which was carried out to deal with problems of unconnected graphs (Bastian et al. 2009; McTavish 2020; Gephi 2020);
- -
- Betweenness centrality: quantifies how often a node appears on the shortest path between any two nodes (Bastian et al. 2009; McTavish 2020; Gephi 2020);
- -
- Authority: estimates the value of the content of the node (Bastian et al. 2009; McTavish 2020; Gephi 2020);
- -
- Hub: estimates the value of its links to other nodes (Bastian et al. 2009; McTavish 2020; Gephi 2020);
- -
- Modularity: processes the division of the network into clusters (Bastian et al. 2009; McTavish 2020; Gephi 2020);
- -
- Pageranks: probability of clicking through to each node, given a certain number of casual clicks through links (Bastian et al. 2009; McTavish 2020; Gephi 2020);
- -
- Clustering: measures the connections between nodes (Bastian et al. 2009; McTavish 2020; Gephi 2020);
- -
- Triangles: number of triangles that pass through each node (Bastian et al. 2009; McTavish 2020; Gephi 2020);
- -
- Eigenvector Centrality: measures the node’s importance considering its connections to other nodes (Bastian et al. 2009; McTavish 2020; Gephi 2020).
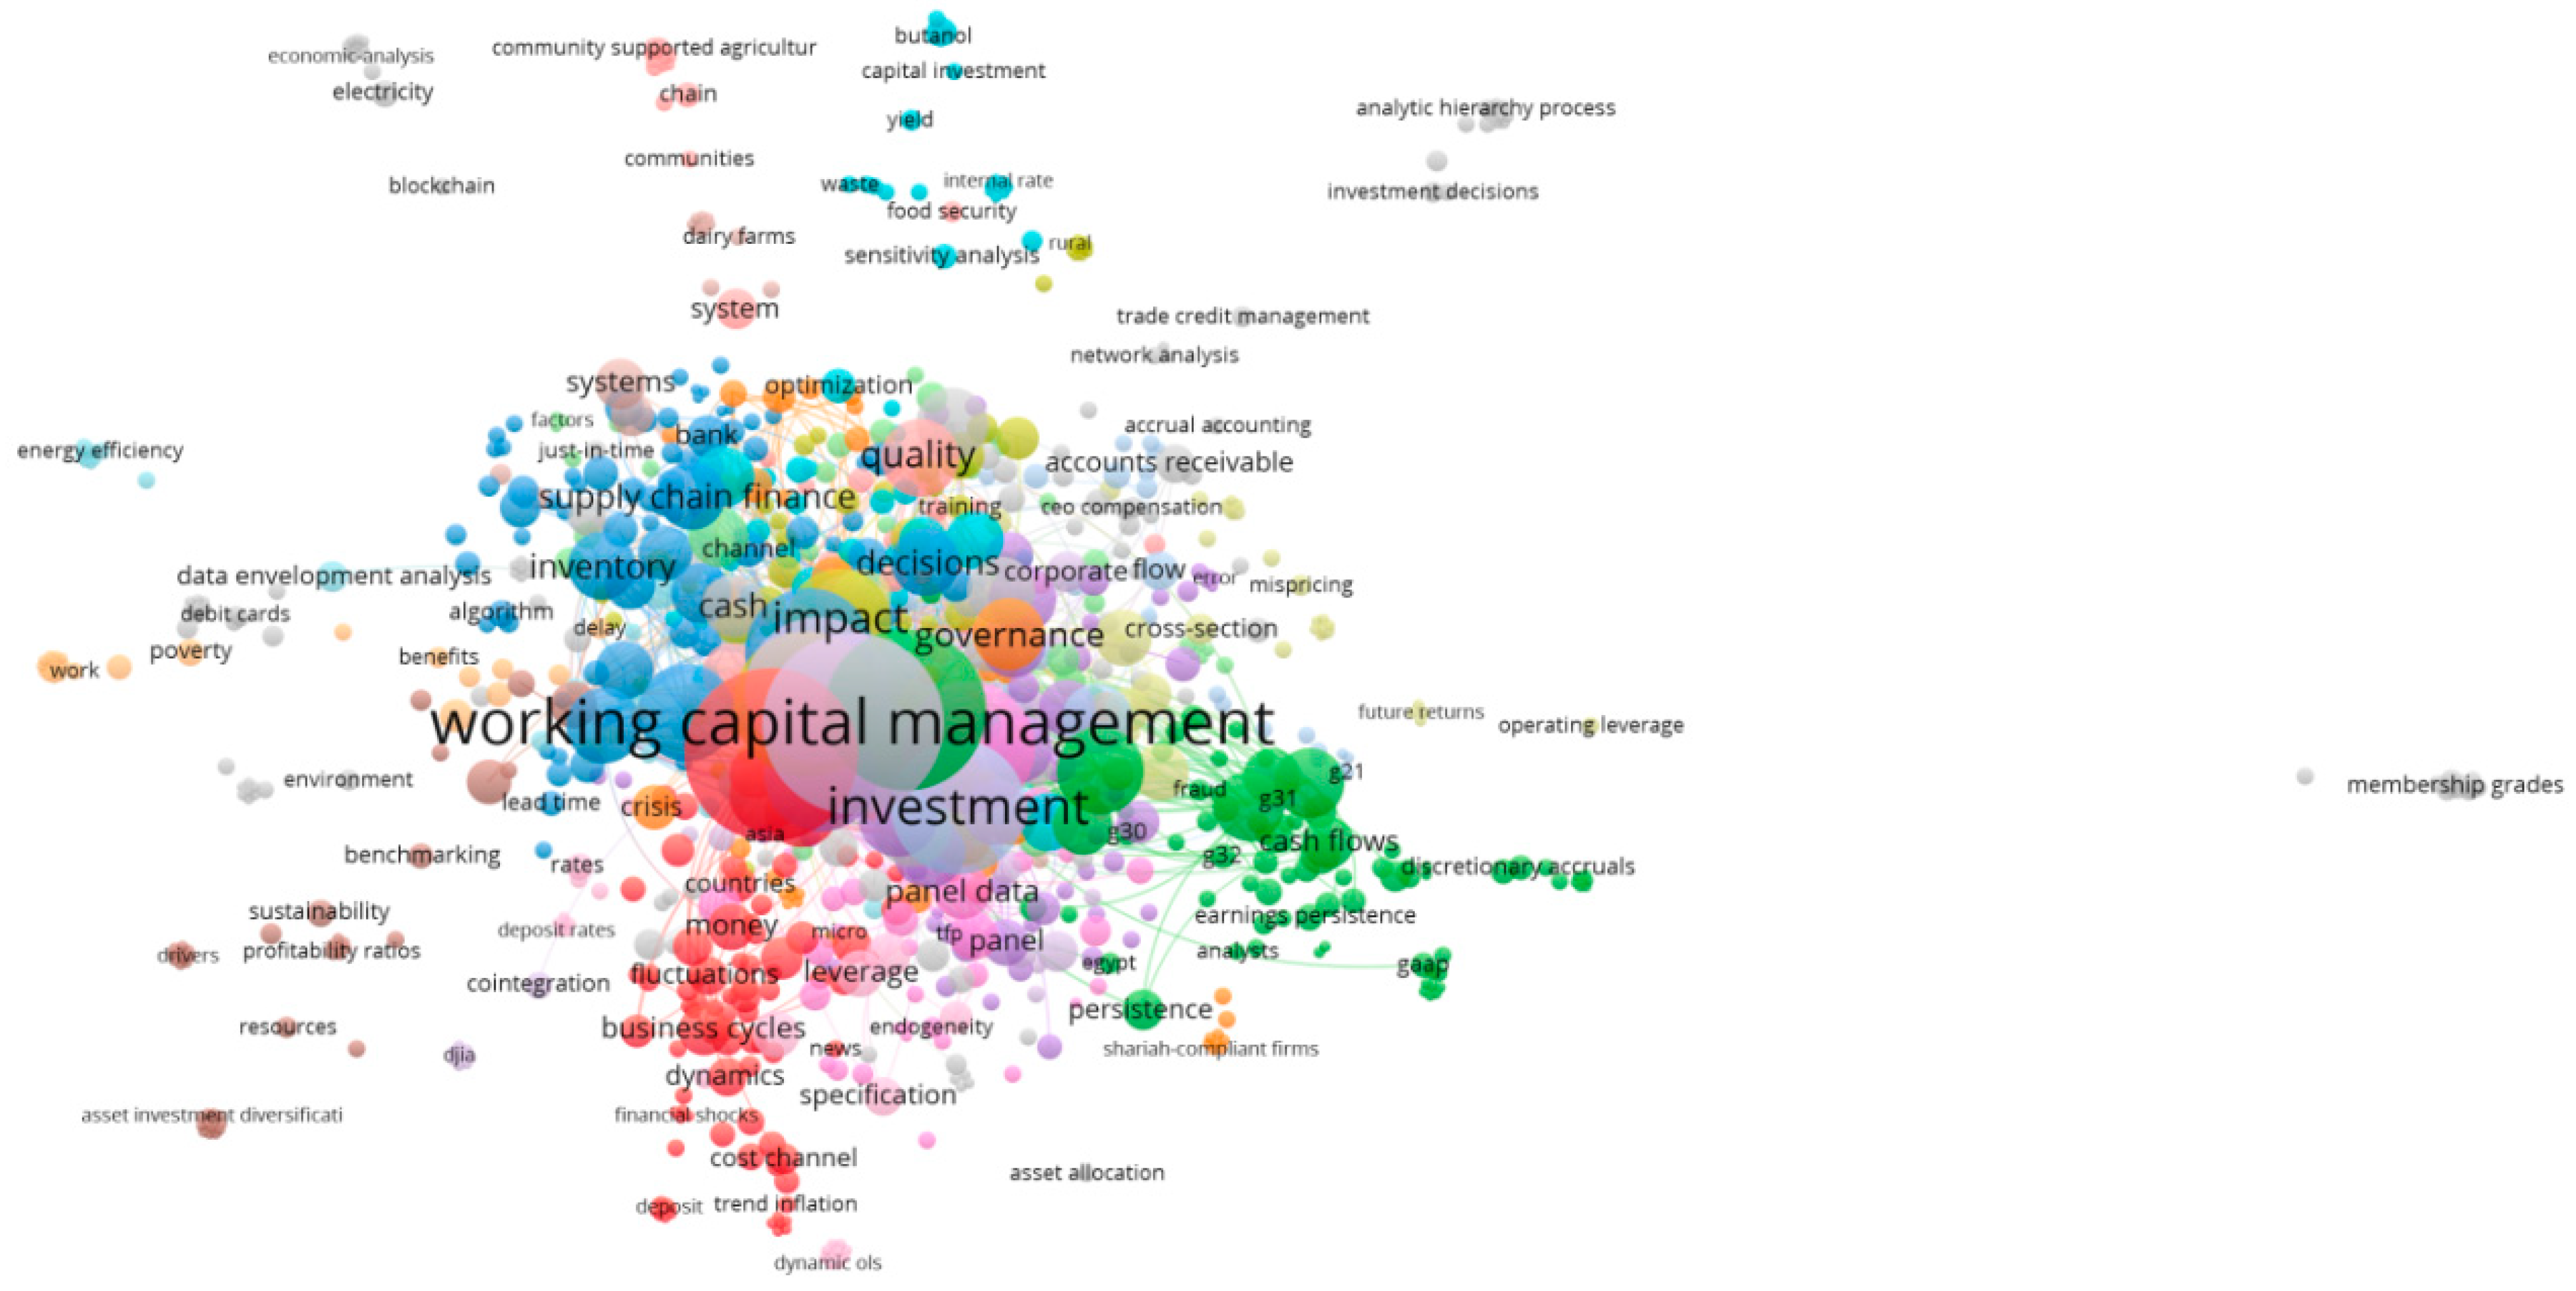
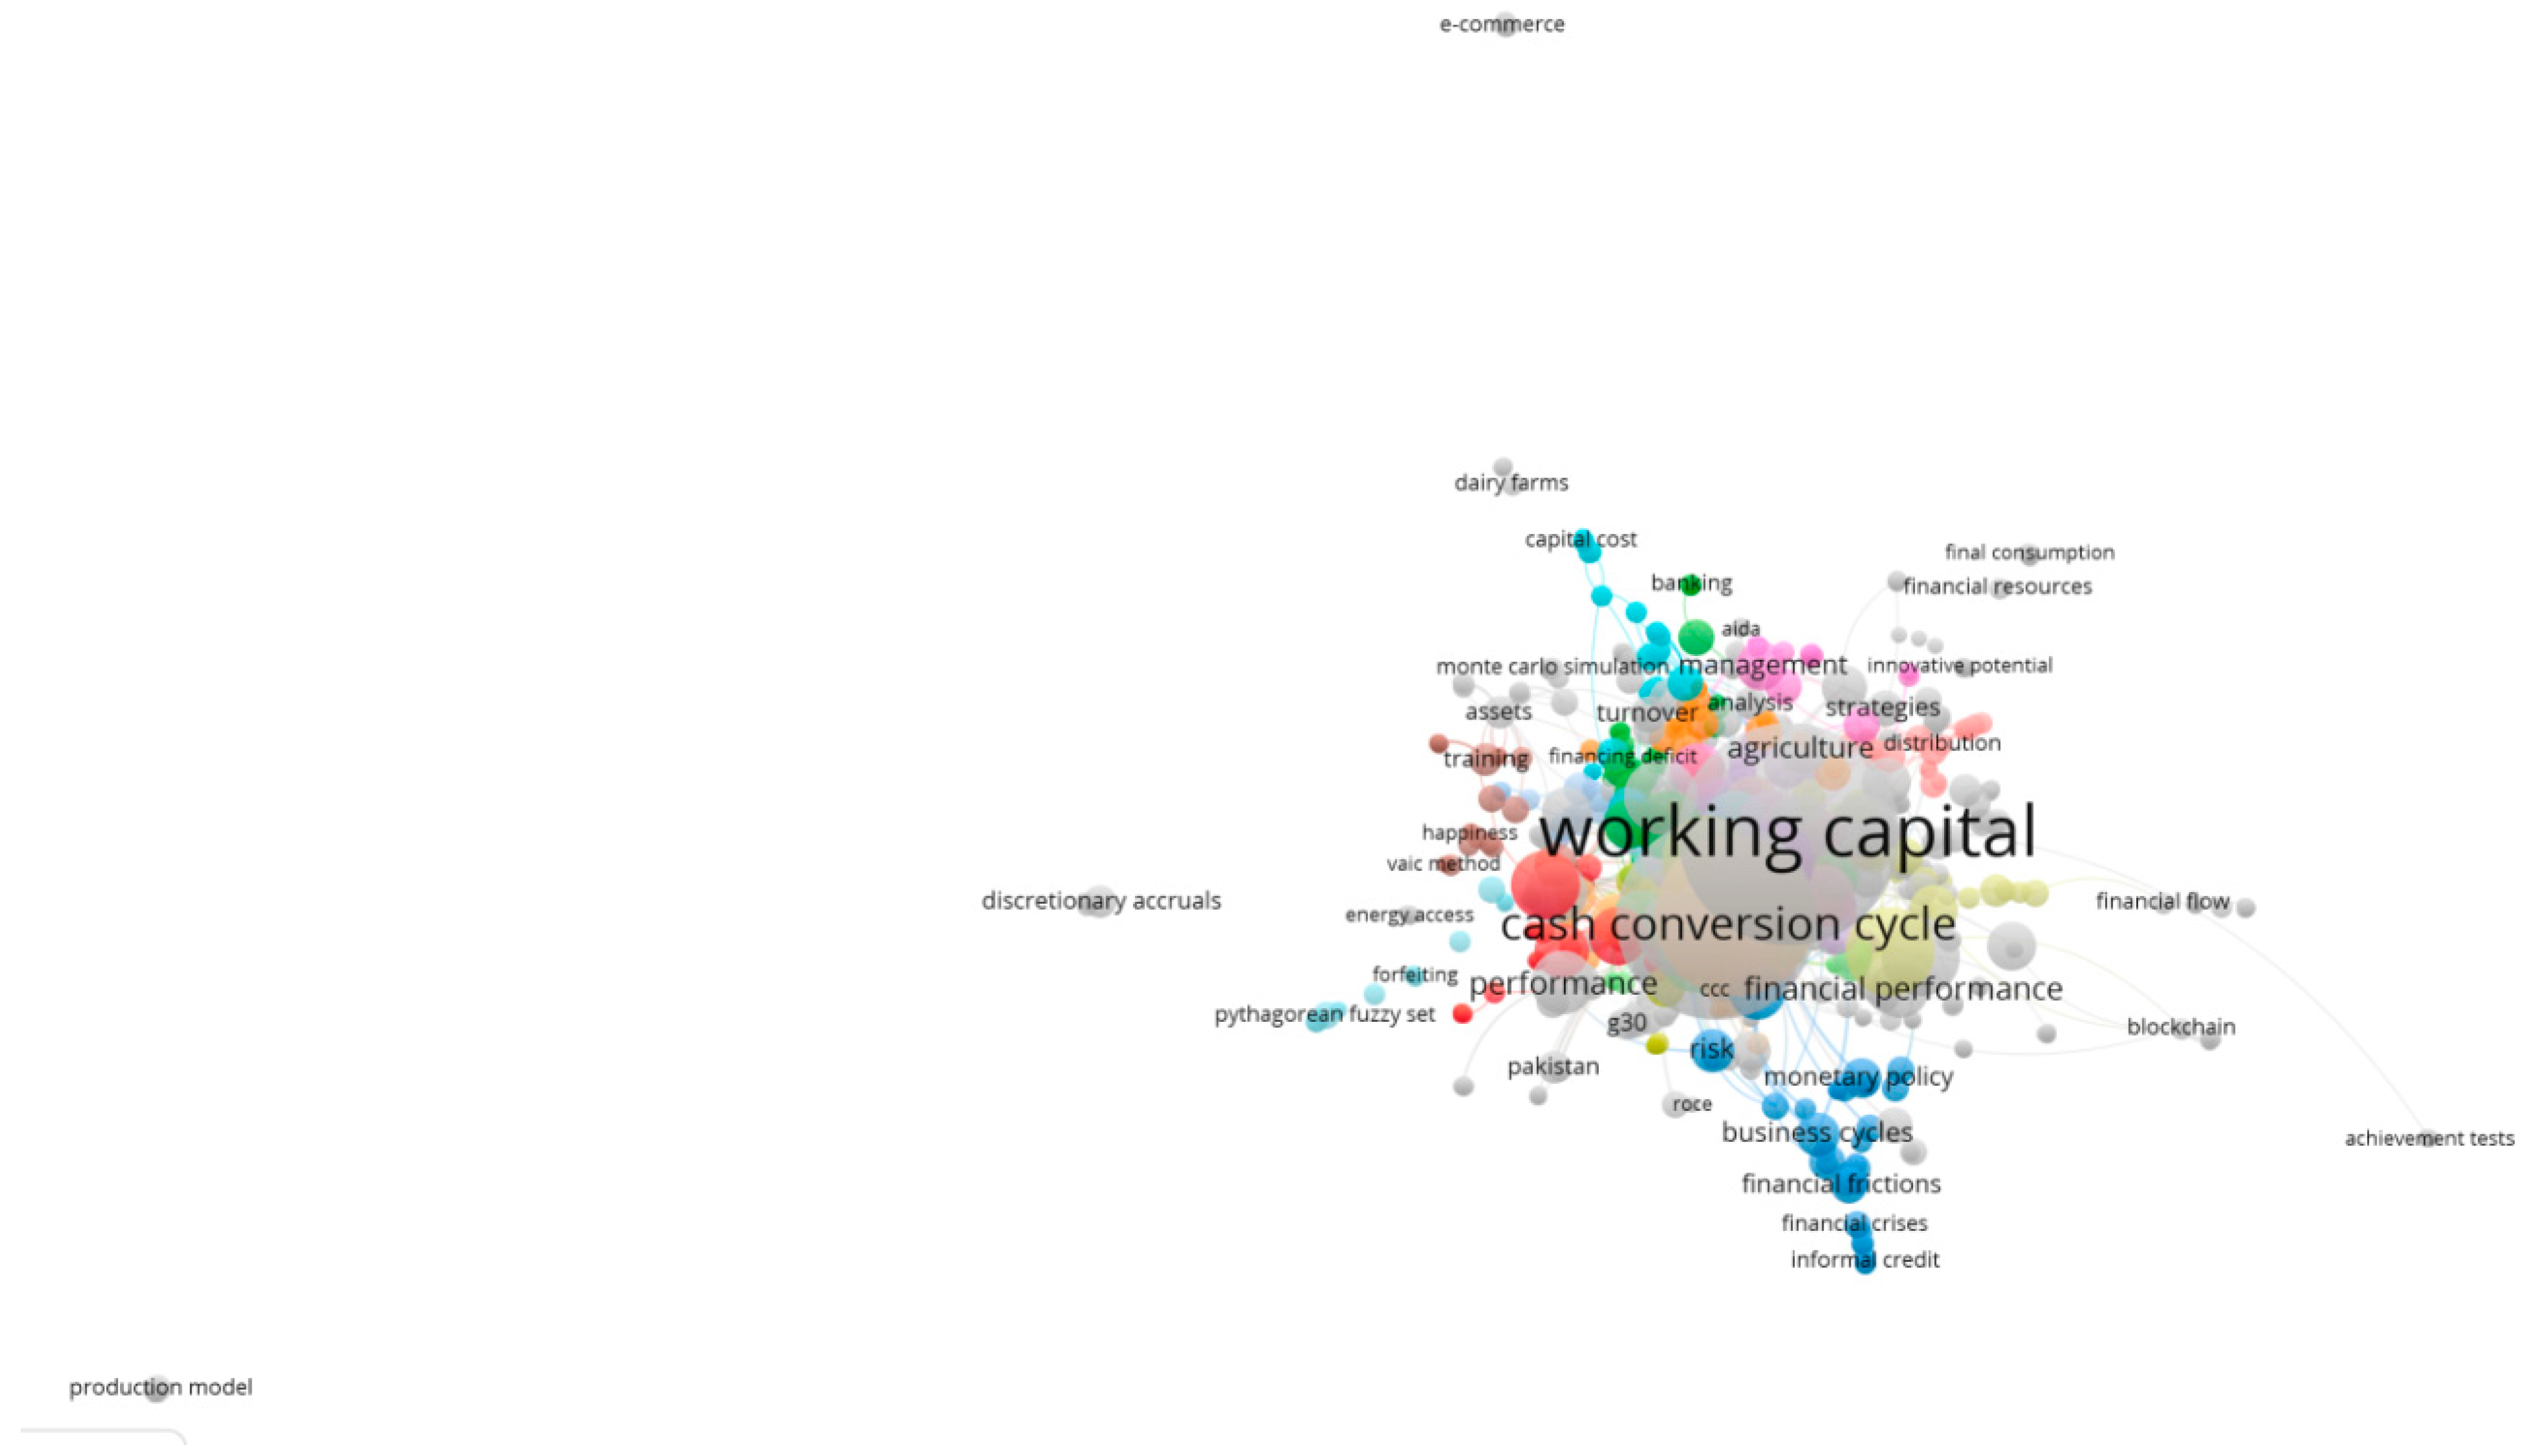
3.2.1. Co-Occurrence Analysis
- Highlighting the main gaps in literature
3.2.2. Co-Authorship Analysis
- The most productive networked authors
- The leader networked organizations
- The most productive networked countries
4. Highlighting Insights Related to the Topics “Working Capital Management” and “Policies”
4.1. Working Capital Dimensions
4.2. Working Capital Management Policies
5. Discussion
6. Conclusions, Practical Implications and Suggestions for Future Research
- -
- What are the main relationships between profitability, financial performance, and the working capital management policies? In practice, are they U-shaped or inverted U-shaped?
- -
- How does globalization and internationalization impact these relationships in several sectors and regions?
- -
- What are the marginal impacts from the several dimensions of the working capital management policies on profitability and financial performance worldwide?
- -
- What are the main relationships of the working capital dimensions with the social and environmental concerns of the firms?
- -
- How do the social and environmental concerns of the firms impact the profitability and the financial performance?
Funding
Institutional Review Board Statement
Informed Consent Statement
Data Availability Statement
Acknowledgments
Conflicts of Interest
References
- Abdulla, Yomna, Viet Anh Dang, and Arif Khurshed. 2020. Suppliers’ Listing Status and Trade Credit Provision. Journal of Corporate Finance 60: 101535. [Google Scholar] [CrossRef]
- Abuhommous, Ala’a Adden. 2017. Partial Adjustment toward Target Accounts Payable Ratio. International Journal of Islamic and Middle Eastern Finance and Management 10: 484–502. [Google Scholar] [CrossRef]
- Abuhommous, Ala’a Adden, and Tareq Mashoka. 2018. A Dynamic Approach to Accounts Receivable: The Case of Jordanian Firms. Eurasian Business Review 8: 171–91. [Google Scholar] [CrossRef]
- Adam, Anokye M., and Edward Quansah. 2019. Effects of Working Capital Management Policies on Shareholders’ Value: Evidence from Listed Manufacturing Firms in Ghana. Panoeconomicus 66: 659–86. [Google Scholar] [CrossRef] [Green Version]
- Adam, Anokye M., Edward Quansah, and Seyram Kawor. 2017. Working Capital Management Policies and Returns of Listed Manufacturing Firms in Ghana. Scientific Annals of Economics and Business 64: 255–69. [Google Scholar] [CrossRef] [Green Version]
- Afrifa, Godfred Adjapong, and Ernest Gyapong. 2017. Net Trade Credit: What Are the Determinants? International Journal of Managerial Finance 13: 246–66. [Google Scholar] [CrossRef]
- Afrifa, Godfred Adjapong, and Stephen Berchie. 2019. Inventory Holding and UK SMEs’ Performance. International Journal of Business Performance Management 20: 16–33. [Google Scholar] [CrossRef]
- Akdogan, Ece C., and Dilek Temiz Dinc. 2019. Managing Working Capital Efficiency in Turkish Agribusinesses and the Impact of Globalization: Insights from an Emerging Market. International Food and Agribusiness Management Review 22: 557–69. [Google Scholar] [CrossRef]
- Aktas, Nihat, Ettore Croci, and Dimitris Petmezas. 2015. Is Working Capital Management Value-Enhancing? Evidence from Firm Performance and Investments. Journal of Corporate Finance 30: 98–113. [Google Scholar] [CrossRef]
- Ali, Shahid, and Muhammad Ramzan Akhtar Khan. 2011. Searching for Internal and External Factors That Determine Working Capital Management for Manufacturing Firms in Pakistan. African Journal of Business Management 5: 2942–49. [Google Scholar]
- Altaf, Nufazil, and Farooq Ahmad Shah. 2018. How Does Working Capital Management Affect the Profitability of Indian Companies? Journal of Advances in Management Research 15: 347–66. [Google Scholar] [CrossRef]
- Anton, Sorin Gabriel, and Anca Elena Afloarei Nucu. 2019. Firm Value and Corporate Cash Holdings. Empirical Evidence from the Polish Listed Firms. E & M Ekonomie a Management 22: 121–34. [Google Scholar] [CrossRef]
- Arcelus, Francisco J., and Gopalan Srinivasan. 1993. Delay of Payments for Extraordinary Purchases. Journal of the Operational Research Society 44: 785–95. [Google Scholar] [CrossRef]
- Azeez, Olaniyi Taiwo, Muhammad Abdul Abubakar, and Fagbemi Temitope Olamide. 2016. Analysis of the Effects of Working Capital Management on Profitability of Listed Nigerian Conglomerate Companies. Fwu Journal of Social Sciences 10: 10–20. [Google Scholar]
- Baker, H. Kent, Satish Kumar, and Harsh Pratap Singh. 2019. Working Capital Management: Evidence from Indian SMEs. Small Enterprise Research 26: 143–63. [Google Scholar] [CrossRef]
- Banos-Caballero, Sonia, Pedro J. Garcia-Teruel, and Pedro Martinez-Solano. 2010. Working Capital Management in SMEs. Accounting and Finance 50: 511–27. [Google Scholar] [CrossRef]
- Banos-Caballero, Sonia, Pedro J. Garcia-Teruel, and Pedro Martinez-Solano. 2012. How Does Working Capital Management Affect the Profitability of Spanish SMEs? Small Business Economics 39: 517–29. [Google Scholar] [CrossRef]
- Barac, Zeljana Aljinovic, and Sasa Muminovic. 2018. Working Capital Management—Efficient Tool for Success of Milk Producers: True or False? New Medit 17: 61–72. [Google Scholar] [CrossRef]
- Bastian, Mathieu, Sebastien Heymann, and Mathieu Jacomy. 2009. Gephi: An Open Source Software for Exploring and Manipulating Networks. Paper presented at Third International AAAI Conference on Weblogs and Social Media, San Jose, CA, USA, May 17–20. [Google Scholar]
- Botoc, Claudiu, and Sorin Gabriel Anton. 2017. Is Profitability Driven by Working Capital Management? Evidence for High-Growth Firms from Emerging Europe. Journal of Business Economics and Management 18: 1135–55. [Google Scholar] [CrossRef] [Green Version]
- Cancino, Christian A., José M. Merigó, and Freddy C. Coronado. 2017. A Bibliometric Analysis of Leading Universities in Innovation Research. Journal of Innovation & Knowledge 2: 106–24. [Google Scholar] [CrossRef]
- Cardoso, Joao, Valter Silva, and Daniela Eusebio. 2019. Techno-Economic Analysis of a Biomass Gasification Power Plant Dealing with Forestry Residues Blends for Electricity Production in Portugal. Journal of Cleaner Production 212: 741–53. [Google Scholar] [CrossRef]
- Chang, Chong-Chuo. 2018. Cash Conversion Cycle and Corporate Performance: Global Evidence. International Review of Economics & Finance 56: 568–81. [Google Scholar] [CrossRef]
- Chauhan, Gaurav Singh. 2019. Are Working Capital Decisions Truly Short-Term in Nature? Journal of Business Research 99: 238–53. [Google Scholar] [CrossRef]
- Chen, Chongyang, and Robert Kieschnick. 2018. Bank Credit and Corporate Working Capital Management. Journal of Corporate Finance 48: 579–96. [Google Scholar] [CrossRef]
- Chen, Ting-Yu. 2018. An Outranking Approach Using a Risk Attitudinal Assignment Model Involving Pythagorean Fuzzy Information and Its Application to Financial Decision Making. Applied Soft Computing 71: 460–87. [Google Scholar] [CrossRef]
- da Silva Macedo, Marcelo Alvaro, and Aloizio Lunga. 2010. Bibliometric and critical mapping of the economical and financial viability analysis of agribusiness projects: An evaluation of the publication in the sober congress in the period 2006–2009. Custos E Agronegocio on Line 6: 67–88. [Google Scholar]
- Dalci, Ilhan, and Hasan Ozyapici. 2018. Working Capital Management Policy in Health Care: The Effect of Leverage. Health Policy 122: 1266–72. [Google Scholar] [CrossRef] [PubMed]
- Damianos Lekkakos, Spyridon, and Alejandro Serrano. 2016. Supply Chain Finance for Small and Medium Sized Enterprises: The Case of Reverse Factoring. International Journal of Physical Distribution & Logistics Management 46: 367–92. [Google Scholar] [CrossRef]
- Falavigna, Greta, and Roberto Ippoliti. 2020. The Impact of Institutional Performance on Payment Dynamics: Evidence from the Italian Manufacturing Industry. Journal of Business Economics and Management 21: 1285–306. [Google Scholar] [CrossRef]
- Falcone, Giacomo, Alfio Strano, Teodora Stillitano, Anna I. De Luca, Nathalie Iofrida, and Giovanni Gulisano. 2015. Integrated Sustainability Appraisal of Wine-Growing Management Systems through LCA and LCC Methodologies. Chemical Engineering Transactions 44: 223–28. [Google Scholar] [CrossRef]
- Fernandez-Lopez, Sara, Adrian Dios-Vicente, and David Rodeiro-Pazos. 2020a. Working Capital Management and Profitability on the Ecologic and Non-Ecologic Cheese Sector in Spain. Revista Espanola De Estudios Agrosociales Y Pesqueros-Reeap 255: 15–45. [Google Scholar]
- Fernandez-Lopez, Sara, David Rodeiro-Pazos, and Lucia Rey-Ares. 2020b. Effects of Working Capital Management on Firms’ Profitability: Evidence from Cheese-Producing Companies. Agribusiness 36: 770–91. [Google Scholar] [CrossRef]
- Fiador, Vera. 2016. Does Corporate Governance Influence the Efficiency of Working Capital Management of Listed Firms Evidence from Ghana. African Journal of Economic and Management Studies 7: 482–96. [Google Scholar] [CrossRef]
- Filbeck, Greg, Xin Zhao, and Ryan Knoll. 2017. An Analysis of Working Capital Efficiency and Shareholder Return. Review of Quantitative Finance and Accounting 48: 265–88. [Google Scholar] [CrossRef]
- Frimpong, Siaw. 2018. Working Capital Management Policies and Value Creation of Listed Non-Financial Firms in Ghana: A Panel FMOLS Analysis. Business and Economic Horizons 14: 725–42. [Google Scholar] [CrossRef]
- Gephi. 2020. Gephi—The Open Graph Viz Platform. 2020. Available online: https://gephi.org/ (accessed on 18 November 2020).
- Heryan, Tomas. 2020. Managers of Tourism Companies Can No Longer Expect Any Financial Support from Company Owners: Different Working Capital Management Due to the Global Financial Crisis. E & M Ekonomie a Management 23: 50–59. [Google Scholar] [CrossRef]
- Hoang, Huan Cong, Qin Xiao, and Saeed Akbar. 2019. Trade Credit, Firm Profitability, and Financial Constraints Evidence from Listed SMEs in East Asia and the Pacific. International Journal of Managerial Finance 15: 744–70. [Google Scholar] [CrossRef]
- Jiang, Wei, Meiting Lu, Yaowen Shan, and Tingting Zhu. 2016. Evidence of Avoiding Working Capital Deficits in Australia. Australian Accounting Review 26: 107–18. [Google Scholar] [CrossRef]
- Kabuye, Frank, Joachim Kato, Irene Akugizibwe, and Nicholas Bugambiro. 2019. Internal Control Systems, Working Capital Management and Financial Performance of Supermarkets. Cogent Business & Management 6: 1573524. [Google Scholar] [CrossRef]
- Kayani, Umar Nawaz, Tracy-Anne De Silva, and Christopher Gan. 2019. A Systematic Literature Review on Working Capital Management—An Identification of New Avenues. Qualitative Research in Financial Markets 11: 352–66. [Google Scholar] [CrossRef]
- Kent Baker, H., Nitesh Pandey, Satish Kumar, and Arunima Haldar. 2020. A Bibliometric Analysis of Board Diversity: Current Status, Development, and Future Research Directions. Journal of Business Research 108: 232–46. [Google Scholar] [CrossRef]
- Kieschnick, Robert, Mark Laplante, and Rabih Moussawi. 2013. Working Capital Management and Shareholders’ Wealth. Review of Finance 17: 1827–52. [Google Scholar] [CrossRef]
- Kieschnick, Robert, and Wendy Rotenberg. 2016. Working Capital Management, the Credit Crisis, and Hedging Strategies: Canadian Evidence. Journal of International Financial Management & Accounting 27: 208–32. [Google Scholar] [CrossRef]
- Linh, Nguyen Thi Phuong, and Sundaresan Mohanlingam. 2018. The Effects of Cash Conversion Cycle on Profitability: An Insight into the Agriculture and Food Industries in Thailand. Asian Journal of Business and Accounting 11: 97–119. [Google Scholar] [CrossRef]
- Lorentz, Harri, Tomi Solakivi, Juuso Toyli, and Lauri Ojala. 2016. Trade Credit Dynamics during the Phases of the Business Cycle—A Value Chain Perspective. Supply Chain Management: An International Journal 21: 363–80. [Google Scholar] [CrossRef]
- Luo, Wei, and Kevin H. Shang. 2019. Technical Note-Managing Inventory for Firms with Trade Credit and Deficit Penalty. Operations Research 67: 468–78. [Google Scholar] [CrossRef]
- Lyngstadaas, Hakim, and Terje Berg. 2016. Working Capital Management: Evidence from Norway. International Journal of Managerial Finance 12: 295–313. [Google Scholar] [CrossRef]
- Maity, Bipasha, Vidya Suresh, and Mehir Kumar Baidya. 2019. Performance of Indian Cement Industry: Drivers, Models and Empirics. Global Economy Journal 19: 1950009. [Google Scholar] [CrossRef]
- Maliwichi, L. L., S. A. Oni, and L. Sifumba. 2011. An Evaluation of the Performance of Small Scale Agribusinesses in Vhembe District of Limpopo Province, South Africa. African Journal of Agricultural Research 6: 3903–10. [Google Scholar]
- Martinho, Vítor Domingues, and Paulo Reis Mourão. 2020. Circular Economy and Economic Development in the European Union: A Review and Bibliometric Analysis. Sustainability 12: 7767. [Google Scholar] [CrossRef]
- Martinho, Vítor João Pereira Domingues. 2018. Interrelationships between Renewable Energy and Agricultural Economics: An Overview. Energy Strategy Reviews 22: 396–409. [Google Scholar] [CrossRef]
- Martinho, Vítor João Pereira Domingues. 2020. Agricultural Entrepreneurship in the European Union: Contributions for a Sustainable Development. Applied Sciences 10: 2080. [Google Scholar] [CrossRef] [Green Version]
- Martinho, Vítor João Pereira Domingues. 2021. Food and Consumer Attitude(s): An Overview of the Most Relevant Documents. Agriculture 11: 1183. [Google Scholar] [CrossRef]
- Masri, Hatem, and Yomna Abdulla. 2018. A Multiple Objective Stochastic Programming Model for Working Capital Management. Technological Forecasting and Social Change 131: 141–46. [Google Scholar] [CrossRef]
- McDaniel, Wm R. 1995. Agency Problems Associated with Managers Having Disincentives to Abandon Investments. Human Resource Management Review 5: 103–27. [Google Scholar] [CrossRef]
- McTavish, Sarah. 2020. Network Graphing with Gephi|Archives Unleashed. 2020. Available online: https://cloud.archivesunleashed.org/derivatives/gephi (accessed on 18 November 2020).
- Merigó, José M., Christian A. Cancino, Freddy Coronado, and David Urbano. 2016. Academic Research in Innovation: A Country Analysis. Scientometrics 108: 559–93. [Google Scholar] [CrossRef]
- Michalski, Grzegorz, Guenter Blendinger, Zoltan Rozsa, Anna Cierniak-Emerych, Maria Svidronova, Jan Buleca, and Hemantkumar Bulsara. 2018. Can We Determine Debt To Equity Levels In Non-Profit Organisations? Answer Based On Polish Case. Inzinerine Ekonomika-Engineering Economics 29: 526–35. [Google Scholar] [CrossRef] [Green Version]
- Migliaccio, Guido, and Luigi Tucci. 2019. Economic Assets and Financial Performance of Italian Wine Companies. International Journal of Wine Business Research 32: 325–52. [Google Scholar] [CrossRef]
- Monastyrenko, Evgenii. 2017. Eco-Efficiency Outcomes of Mergers and Acquisitions in the European Electricity Industry. Energy Policy 107: 258–77. [Google Scholar] [CrossRef]
- Motylska-Kuzma, Anna. 2017. The Financial Decisions of Family Businesses. Journal of Family Business Management 7: 351–73. [Google Scholar] [CrossRef]
- Mourao, Paulo Reis, and Vítor Domingues Martinho. 2020. Forest Entrepreneurship: A Bibliometric Analysis and a Discussion about the Co-Authorship Networks of an Emerging Scientific Field. Journal of Cleaner Production 256: 120413. [Google Scholar] [CrossRef]
- Moussa, Amr Ahmed. 2018. The Impact of Working Capital Management on Firms’ Performance and Value: Evidence from Egypt. Journal of Asset Management 19: 259–73. [Google Scholar] [CrossRef]
- Nastiti, Pambayun Kinasih Yekti, Apriani Dorkas Rambu Atahau, and Supramono Supramono. 2019. Working Capital Management Policy: Female Top Managers and Firm Profitability. Central European Management Journal 27: 107–27. [Google Scholar] [CrossRef]
- Nguyen, An Thanh Hong, and Tuan Van Nguyen. 2018. Working Capital Management and Corporate Profitability: Empirical Evidence from Vietnam. Foundations of Management 10: 195–206. [Google Scholar] [CrossRef] [Green Version]
- Nobanee, Haitham, and Mehroz Nida Dilshad. 2021. A Bibliometric Analysis on Working Capital Management: Current Status, Development, and Future Directions. Academy of Strategic Management Journal 20. Available online: https://www.abacademies.org/abstract/a-bibliometric-analysis-on-working-capital-management-current-status-development-and-future-directions-11053.html (accessed on 25 November 2021).
- Orobia, Laura Aseru, Kesseven Padachi, and John C. Munene. 2016. Why Some Small Businesses Ignore Austere Working Capital Management Routines. Journal of Accounting in Emerging Economies 6: 94–110. [Google Scholar] [CrossRef]
- Pais, Maria Amelia, and Paulo Miguel Gama. 2015. Working Capital Management and SMEs Profitability: Portuguese Evidence. International Journal of Managerial Finance 11: 341–58. [Google Scholar] [CrossRef]
- Paul, Salima Yassia, Cherif Guermat, and Susela Devi. 2018. Why Do Firms Invest in Accounts Receivable? An Empirical Investigation of the Malaysian Manufacturing Sector. Journal of Accounting in Emerging Economies 8: 166–84. [Google Scholar] [CrossRef]
- Pena Sanchez, Antonio Rafael, Mercedes Jimenez Garcia, and Jose Ruiz Chico. 2018. The Regional Distribution of the Enterprise Working Capital in Spain: Determining Factors. Revista De Estudios Regionales 113: 71–100. [Google Scholar]
- Pham, Kien Xuan, Quang Ngoc Nguyen, and Cong Van Nguyen. 2020. Effect of Working Capital Management on the Profitability of Steel Companies on Vietnam Stock Exchanges. Journal of Asian Finance Economics and Business 7: 741–50. [Google Scholar] [CrossRef]
- Poluyanov, Vladimir Petrovich, and Ntaliya Sergeevna Palamarchuk. 2017. Integrated Assessment of the Policy of Working Capital Management in Housing and Utilities Enterprises. Ekonomika Regiona-Economy of Region 13: 489–99. [Google Scholar] [CrossRef]
- Prempeh, Kwadwo Boateng, and Godfred Peprah-Amankona. 2020. Does Working Capital Management Affect Profitability of Ghanaian Manufacturing Firms? Zagreb International Review of Economics & Business 23: 1–18. [Google Scholar] [CrossRef]
- Rauscher, Simone, and John R. C. Wheeler. 2012. The Importance of Working Capital Management for Hospital Profitability: Evidence from Bond-Issuing, Not-for-Profit US Hospitals. Health Care Management Review 37: 339–46. [Google Scholar] [CrossRef] [PubMed]
- Repisky, Jozef. 2013. Scenario Model of Investment Project in Vineyards. East London-South Africa. Proceedings from VIII. International Conference on Applied Business Research (Icabr 2013). Available online: http://www.icabr.com/fullpapers/icabr2013.pdf (accessed on 18 November 2020).
- Riaz, Yasir, Yasir Shahab, Robina Bibi, and Shumaila Zeb. 2016. Investment-Cash Flow Sensitivity and Financial Constraints: Evidence from Pakistan. South Asian Journal of Global Business Research 5: 403–23. [Google Scholar] [CrossRef]
- Sabki, Sharmilawati, Woei-Chyuan Wong, and Angappan Regupathi. 2019. Sme Liquidity and Its Determinants. International Journal of Business and Society 20: 111–24. [Google Scholar]
- Scopus. 2020. Scopus Database. 2020. Available online: https://www.scopus.com/search/form.uri?display=basic (accessed on 18 November 2020).
- Shah, Said, Jamil Anwar, and S. A. F. Hasnu. 2018. Does Location Matter in Determining Firms’ Performance? A Comparative Analysis of Domestic and Multinational Companies. Journal of Asia Business Studies 12: 253–72. [Google Scholar] [CrossRef]
- Simon, Sunday, Norfaiezah Sawandi, and Mohamad Ali Abdul-Hamid. 2019. Working Capital Management and Firm Performance: The Moderating Effect of Inflation Rates. Pertanika Journal of Social Science and Humanities 27: 235–57. [Google Scholar]
- Singh, Harsh Pratap, Satish Kumar, and Sisira Colombage. 2017. Working Capital Management and Firm Profitability: A Meta-Analysis. Qualitative Research in Financial Markets 9: 34–47. [Google Scholar] [CrossRef]
- Tahir, Mohammad, and Melati Binti Ahmad Anuar. 2016. The Determinants of Working Capital Management and Firms Performance of Textile Sector in Pakistan. Quality & Quantity 50: 605–18. [Google Scholar] [CrossRef]
- Talezari, Maryam, Mansur Garkaz, and Jomadoordi Gorganlidavaji. 2015. Review Paper: Cash Conversion Cycle and Profitability in Companies. Journal of Current Research in Science 3: 49–53. [Google Scholar]
- van Eck, Nees Jan, and Ludo Waltman. 2020. VOSviewer Manual. Leiden: Universiteit Leiden, p. 53. [Google Scholar]
- Vieira, Elisabete Simoes, Maria Elisabete Neves, and Antonio Gomes Dias. 2019. Determinants of Portuguese Firms Financial Performance: Panel Data Evidence. International Journal of Productivity and Performance Management 68: 1323–42. [Google Scholar] [CrossRef]
- VOSviewer. 2020. VOSviewer—Visualizing Scientific Landscapes. VOSviewer. 2020. Available online: https://www.vosviewer.com// (accessed on 18 November 2020).
- Vukovic, Bojana, Mirko Andric, and Dejan Jaksic. 2017. The Impact of Working Capital Management on Company’s Profitability: Empirical Evidence from Serbia. Custos E Agronegocio on Line 13: 333–49. [Google Scholar]
- Wang, Zanxin, Minhas Akbar, and Ahsan Akbar. 2020. The Interplay between Working Capital Management and a Firm’s Financial Performance across the Corporate Life Cycle. Sustainability 12: 1661. [Google Scholar] [CrossRef] [Green Version]
- Web of Science. 2020. Web of Science (Core Collection). 2020. Available online: https://apps.webofknowledge.com/WOS_GeneralSearch_input.do?product=WOS&search_mode=GeneralSearch&SID=F42kRKIwDE8BIWomQpC&preferencesSaved= (accessed on 18 November 2020).
- Yao, Haibo, and Yiling Deng. 2018. Managerial Incentives and Accounts Receivable Management Policy. Managerial Finance 44: 865–84. [Google Scholar] [CrossRef]
- Yazdanfar, Darush, and Peter Ohman. 2016. The Impact of Trade Credit Use on Firm Profitability: Empirical Evidence from Sweden. Journal of Advances in Management Research 13: 116–29. [Google Scholar] [CrossRef]
- Zabolotnyy, Serhiy, and Timo Sipilainen. 2020. A Comparison of Strategies for Working Capital Management of Listed Food Companies from Northern Europe. Agricultural and Food Science 29: 239–49. [Google Scholar] [CrossRef]


| Keyword | Occurrences | Avg. Pub. Year | Avg. Citations |
|---|---|---|---|
| working capital management | 196 | 2016.695 | 5.893 |
| working capital | 182 | 2015.551 | 7.132 |
| performance | 155 | 2016.463 | 15.994 |
| profitability | 128 | 2016.832 | 5.391 |
| management | 127 | 2016.207 | 17.063 |
| investment | 110 | 2016.129 | 15.646 |
| determinants | 104 | 2017.180 | 9.490 |
| trade credit | 99 | 2016.862 | 14.172 |
| firms | 77 | 2016.355 | 10.416 |
| impact | 65 | 2017.629 | 7.185 |
| liquidity | 65 | 2014.785 | 21.877 |
| cash conversion cycle | 62 | 2017.123 | 5.226 |
| model | 57 | 2013.895 | 11.930 |
| policy | 49 | 2014.348 | 13.816 |
| information | 46 | 2014.304 | 48.783 |
| Keyword | Occurrences | Avg. Pub. Year | Avg. Citations |
|---|---|---|---|
| working capital | 182 | 2015.551 | 7.132 |
| working capital management | 148 | 2016.247 | 6.831 |
| profitability | 95 | 2016.753 | 3.926 |
| cash conversion cycle | 52 | 2016.896 | 5.750 |
| liquidity | 39 | 2015.692 | 4.308 |
| smes | 30 | 2016.517 | 8.167 |
| supply chain finance | 29 | 2017.759 | 11.655 |
| financial constraints | 27 | 2016.962 | 10.889 |
| trade credit | 27 | 2017.080 | 11.074 |
| supply chain management | 23 | 2014.044 | 16.957 |
| firm performance | 22 | 2017.474 | 2.091 |
| cash flow | 21 | 2014.381 | 13.667 |
| net working capital | 19 | 2016.105 | 2.947 |
| earnings management | 18 | 2009.278 | 111.778 |
| panel data | 18 | 2017.438 | 4.444 |
| Author | Documents | Citations | Norm. Citations | Avg. Citations | Avg. Pub. Year |
|---|---|---|---|---|---|
| Karri, Timo | 3 | 37 | 2.618 | 12.333 | 2014.667 |
| Pirttila, Miia | 3 | 37 | 2.618 | 12.333 | 2014.667 |
| Schupp, Florian | 2 | 35 | 4.480 | 17.500 | 2015.500 |
| Talonpoika, Anna-maria | 2 | 7 | 1.068 | 3.500 | 2016.000 |
| Ancarani, Alessandro | 1 | 5 | 2.930 | 5.000 | 2019.000 |
| Cannella, Salvatore | 1 | 5 | 2.930 | 5.000 | 2019.000 |
| Di mauro, Carmela | 1 | 5 | 2.930 | 5.000 | 2019.000 |
| Fominguez, Roberto | 1 | 5 | 2.930 | 5.000 | 2019.000 |
| Lind, Lotta | 1 | 30 | 1.550 | 30.000 | 2012.000 |
| Monto, Sari | 1 | 7 | 1.068 | 7.000 | 2016.000 |
| Viskari, Sari | 1 | 30 | 1.550 | 30.000 | 2012.000 |
| Authors | Degree | Eccentricity | Closeness Centrality | Harmonic Closeness Centrality | Betweenness Centrality | Authority | Hub | Modularity_Class | Pageranks | Clustering | Triangles | Eigencentrality |
|---|---|---|---|---|---|---|---|---|---|---|---|---|
| Ancarani, Alessandro | 4 | 3 | 0.556 | 0.667 | 0 | 0.243 | 0.243 | 0 | 0.082 | 1.000 | 6 | 0.522 |
| Cannella, Salvatore | 4 | 3 | 0.556 | 0.667 | 0 | 0.243 | 0.243 | 0 | 0.082 | 1.000 | 6 | 0.522 |
| Di Mauro, Carmela | 4 | 3 | 0.556 | 0.667 | 0 | 0.243 | 0.243 | 0 | 0.082 | 1.000 | 6 | 0.522 |
| Dominguez, Roberto | 4 | 3 | 0.556 | 0.667 | 0 | 0.243 | 0.243 | 0 | 0.082 | 1.000 | 6 | 0.522 |
| Schupp, Florian | 8 | 2 | 0.833 | 0.900 | 24 | 0.473 | 0.473 | 0 | 0.150 | 0.429 | 12 | 1.000 |
| Karri, Timo | 6 | 2 | 0.714 | 0.800 | 7 | 0.372 | 0.372 | 1 | 0.117 | 0.600 | 9 | 0.779 |
| Lind, Lotta | 4 | 2 | 0.625 | 0.700 | 0 | 0.309 | 0.309 | 1 | 0.080 | 1.000 | 6 | 0.645 |
| Monto, Sari | 3 | 3 | 0.476 | 0.583 | 0 | 0.189 | 0.189 | 1 | 0.065 | 1.000 | 3 | 0.395 |
| Pirttila, Miia | 6 | 2 | 0.714 | 0.800 | 7 | 0.372 | 0.372 | 1 | 0.117 | 0.600 | 9 | 0.779 |
| Talonpoika, Anna-maria | 3 | 3 | 0.476 | 0.583 | 0 | 0.189 | 0.189 | 1 | 0.065 | 1.000 | 3 | 0.395 |
| Viskari, Sari | 4 | 2 | 0.625 | 0.700 | 0 | 0.309 | 0.309 | 1 | 0.080 | 1.000 | 6 | 0.645 |
| Organizations | Documents | Citations | Norm. Citations | Avg. Citations | Avg. Pub. Year |
|---|---|---|---|---|---|
| Natl Bur Econ Res | 8 | 385 | 11.931 | 48.125 | 2008.625 |
| Univ Illinois | 8 | 440 | 12.379 | 55.000 | 2000.625 |
| Amer Univ | 6 | 23 | 8.598 | 3.833 | 2018.167 |
| Boston Univ | 6 | 279 | 6.012 | 46.500 | 2002.667 |
| Purdue Univ | 6 | 72 | 10.501 | 12.000 | 2005.333 |
| Univ Michigan | 6 | 2908 | 26.603 | 484.667 | 2008.000 |
| Univ Oxford | 6 | 186 | 15.330 | 31.000 | 2010.200 |
| Univ Texas Austin | 6 | 90 | 9.286 | 15.000 | 2014.167 |
| Capital Univ Econ and Business | 5 | 9 | 7.916 | 1.800 | 2019.000 |
| Harvard Univ | 5 | 836 | 18.980 | 167.200 | 2003.200 |
| Hunan Univ | 5 | 89 | 28.092 | 17.800 | 2017.000 |
| INSEAD | 5 | 39 | 5.366 | 7.800 | 2009.000 |
| NBER | 5 | 1185 | 50.120 | 237.000 | 2011.800 |
| Shanghai Jiao Tong Univ | 5 | 386 | 34.306 | 77.200 | 2015.400 |
| Univ Bahrain | 5 | 8 | 3.908 | 1.600 | 2015.000 |
| Organizations | Degree | Eccentricity | Closeness Centrality | Harmonic Closeness Centrality | Betweenness Centrality | Authority | Hub | Modularity | Pageranks | Clustering | Triangles | Eigencentrality |
|---|---|---|---|---|---|---|---|---|---|---|---|---|
| _Class | ||||||||||||
| MIT | 18 | 11 | 0.167 | 0.252 | 2795.000 | 0.277 | 0.277 | 2 | 0.008 | 0.575 | 88 | 1.000 |
| CEPR | 16 | 10 | 0.195 | 0.287 | 4457.000 | 0.034 | 0.034 | 5 | 0.012 | 0.258 | 31 | 0.254 |
| Natl Bur Econ Res | 16 | 7 | 0.248 | 0.318 | 11,248.967 | 0.000 | 0.000 | 6 | 0.017 | 0.150 | 18 | 0.094 |
| NBER | 15 | 10 | 0.205 | 0.288 | 2780.517 | 0.005 | 0.005 | 5 | 0.013 | 0.248 | 26 | 0.151 |
| Capitaland | 13 | 12 | 0.144 | 0.209 | 0.000 | 0.266 | 0.266 | 2 | 0.005 | 1.000 | 78 | 0.925 |
| CIMB | 13 | 12 | 0.144 | 0.209 | 0.000 | 0.266 | 0.266 | 2 | 0.005 | 1.000 | 78 | 0.925 |
| Citibank NA | 13 | 12 | 0.144 | 0.209 | 0.000 | 0.266 | 0.266 | 2 | 0.005 | 1.000 | 78 | 0.925 |
| DBS | 13 | 12 | 0.144 | 0.209 | 0.000 | 0.266 | 0.266 | 2 | 0.005 | 1.000 | 78 | 0.925 |
| Energy Exchange Chicago | 13 | 12 | 0.144 | 0.209 | 0.000 | 0.266 | 0.266 | 2 | 0.005 | 1.000 | 78 | 0.925 |
| First Natl Bank Chicago | 13 | 12 | 0.144 | 0.209 | 0.000 | 0.266 | 0.266 | 2 | 0.005 | 1.000 | 78 | 0.925 |
| Gasprom Bank | 13 | 12 | 0.144 | 0.209 | 0.000 | 0.266 | 0.266 | 2 | 0.005 | 1.000 | 78 | 0.925 |
| Gen Elect | 13 | 12 | 0.144 | 0.209 | 0.000 | 0.266 | 0.266 | 2 | 0.005 | 1.000 | 78 | 0.925 |
| HSBC | 13 | 12 | 0.144 | 0.209 | 0.000 | 0.266 | 0.266 | 2 | 0.005 | 1.000 | 78 | 0.925 |
| Lindlakers | 13 | 12 | 0.144 | 0.209 | 0.000 | 0.266 | 0.266 | 2 | 0.005 | 1.000 | 78 | 0.925 |
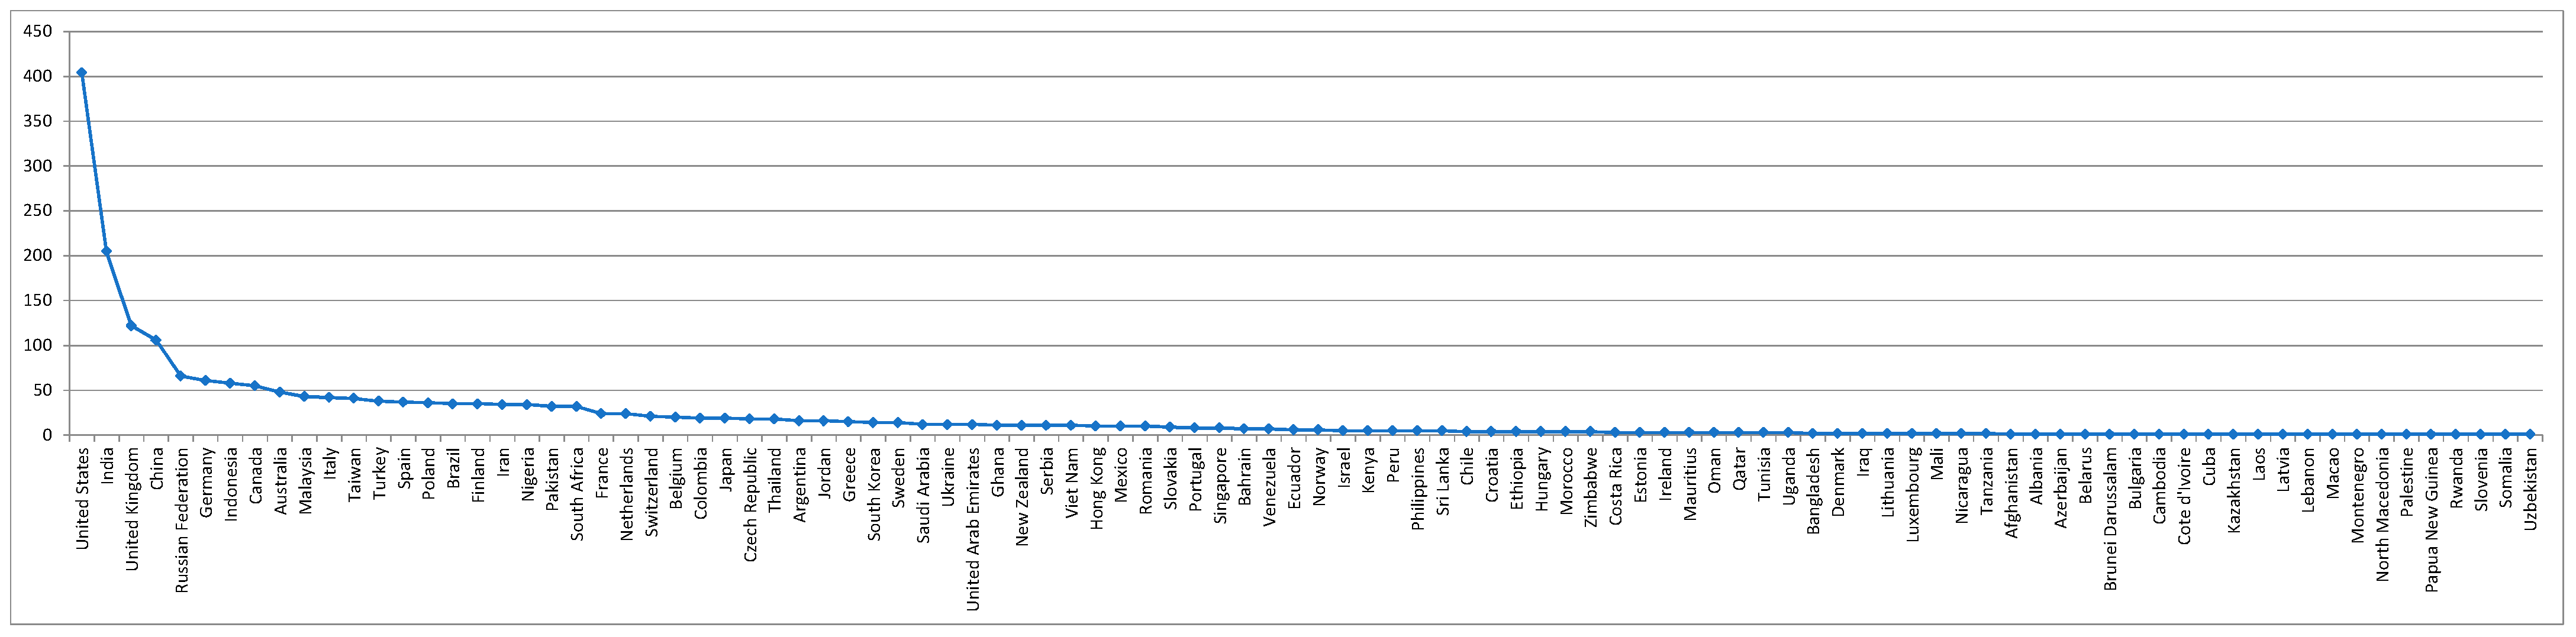
| Countries | Documents | Citations | Norm. Citations | Avg. Citations | Avg. Pub. Year |
|---|---|---|---|---|---|
| USA | 242 | 9560 | 412.128 | 39.504 | 2007.328 |
| Peoples R China | 121 | 1105 | 203.690 | 9.132 | 2015.731 |
| England | 84 | 1331 | 118.020 | 15.845 | 2010.305 |
| India | 81 | 295 | 74.246 | 3.642 | 2015.893 |
| Poland | 52 | 235 | 33.613 | 4.519 | 2016.173 |
| Germany | 41 | 694 | 67.568 | 16.927 | 2014.195 |
| Malaysia | 39 | 100 | 23.507 | 2.564 | 2016.744 |
| Russia | 39 | 26 | 3.608 | 0.667 | 2016.513 |
| Turkey | 39 | 74 | 11.623 | 1.897 | 2014.595 |
| Brazil | 36 | 117 | 13.347 | 3.250 | 2014.528 |
| Czech Republic | 33 | 44 | 11.197 | 1.333 | 2014.606 |
| Taiwan | 33 | 328 | 40.831 | 9.939 | 2013.031 |
| Australia | 31 | 580 | 38.295 | 18.710 | 2011.774 |
| Canada | 31 | 156 | 42.854 | 5.032 | 2014.500 |
| Italy | 31 | 520 | 77.213 | 16.774 | 2014.677 |
| Countries | Degree | Eccentricity | Closeness Centrality | Harmonic Closeness Centrality | Betweenness Centrality | Authority | Hub | Modularity | Pageranks | Clustering | Triangles | Eigencentrality |
|---|---|---|---|---|---|---|---|---|---|---|---|---|
| _Class | ||||||||||||
| England | 36 | 4 | 0.598 | 0.695 | 838.421 | 0.331 | 0.331 | 3 | 0.062 | 0.176 | 93 | 0.944 |
| USA | 35 | 3 | 0.612 | 0.709 | 866.528 | 0.351 | 0.351 | 1 | 0.064 | 0.178 | 106 | 1.000 |
| Australia | 29 | 4 | 0.549 | 0.628 | 351.230 | 0.272 | 0.272 | 0 | 0.041 | 0.239 | 66 | 0.836 |
| Argentina | 21 | 3 | 0.527 | 0.597 | 212.882 | 0.248 | 0.248 | 3 | 0.033 | 0.322 | 55 | 0.705 |
| Peoples R China | 21 | 3 | 0.530 | 0.608 | 154.159 | 0.284 | 0.284 | 0 | 0.036 | 0.371 | 78 | 0.802 |
| Germany | 19 | 4 | 0.503 | 0.584 | 168.075 | 0.242 | 0.242 | 3 | 0.034 | 0.333 | 57 | 0.687 |
| Malaysia | 18 | 3 | 0.513 | 0.584 | 368.275 | 0.219 | 0.219 | 0 | 0.035 | 0.314 | 48 | 0.619 |
| France | 15 | 4 | 0.497 | 0.558 | 77.626 | 0.218 | 0.218 | 0 | 0.024 | 0.527 | 48 | 0.615 |
| India | 13 | 4 | 0.494 | 0.553 | 257.653 | 0.145 | 0.145 | 2 | 0.026 | 0.244 | 19 | 0.420 |
| Finland | 12 | 4 | 0.485 | 0.541 | 42.520 | 0.200 | 0.200 | 0 | 0.021 | 0.606 | 40 | 0.558 |
| Russia | 12 | 4 | 0.485 | 0.541 | 149.395 | 0.199 | 0.199 | 0 | 0.021 | 0.606 | 40 | 0.561 |
| Belgium | 11 | 4 | 0.473 | 0.530 | 105.801 | 0.168 | 0.168 | 3 | 0.021 | 0.473 | 26 | 0.479 |
| Canada | 10 | 4 | 0.446 | 0.502 | 42.724 | 0.129 | 0.129 | 1 | 0.017 | 0.417 | 15 | 0.368 |
| Saudi Arabia | 10 | 4 | 0.470 | 0.522 | 37.924 | 0.167 | 0.167 | 0 | 0.018 | 0.711 | 32 | 0.464 |
Publisher’s Note: MDPI stays neutral with regard to jurisdictional claims in published maps and institutional affiliations. |
© 2021 by the author. Licensee MDPI, Basel, Switzerland. This article is an open access article distributed under the terms and conditions of the Creative Commons Attribution (CC BY) license (https://creativecommons.org/licenses/by/4.0/).
Share and Cite
Martinho, V.J.P.D. Bibliometric Analysis for Working Capital: Identifying Gaps, Co-Authorships and Insights from a Literature Survey. Int. J. Financial Stud. 2021, 9, 72. https://doi.org/10.3390/ijfs9040072
Martinho VJPD. Bibliometric Analysis for Working Capital: Identifying Gaps, Co-Authorships and Insights from a Literature Survey. International Journal of Financial Studies. 2021; 9(4):72. https://doi.org/10.3390/ijfs9040072
Chicago/Turabian StyleMartinho, Vítor João Pereira Domingues. 2021. "Bibliometric Analysis for Working Capital: Identifying Gaps, Co-Authorships and Insights from a Literature Survey" International Journal of Financial Studies 9, no. 4: 72. https://doi.org/10.3390/ijfs9040072