Article

Unraveling the Dynamics of Intellectual Capital, Firm Performance, and the Influential Moderators—BIG4 Auditors and Group Affiliation

by
Swati Mohapatra
* and
Jamini Kanta Pattanayak
Department of Management Studies and Industrial Engineering, Indian Institute of Technology (Indian School of Mines), Dhanbad 826004, Jharkhand, India
*
Author to whom correspondence should be addressed.
Int. J. Financial Stud. 2024, 12(1), 29; https://doi.org/10.3390/ijfs12010029
Submission received: 24 December 2023 / Revised: 20 February 2024 / Accepted: 4 March 2024 / Published: 20 March 2024

Abstract

:
The importance of intellectual capital (IC) in past decades unfolds several dimensions of firm performance (FP). Still, the contradictory and inconclusive relationship between IC and FP in the literature motivates the researchers to explore further and understand the empirical connection using both linear and curvilinear approaches. Using the fixed-effect panel regression models on a sample of 795 non-financial firms of India from the financial years 2004–2005 to 2020–2021, this study reveals that, undoubtedly, the IC enhances the FP up to a certain threshold, and with any marginal investment, IC reduces the FP by forming the inverted U-shaped curve. Interestingly, the presence of BIG4 auditors in Indian firms helps to increase the FP with the help of IC, even for the group-affiliated firms. Thus, this study aligns with both value creation and cost concern perspectives and implies that management and regulatory bodies may adopt a balanced approach while enhancing the FP through IC, as the result suggests that investment in IC will not endlessly improve the FP in the Indian context.

1. Introduction

The knowledge and organizational resources of the current competitive business environment have received substantial attention in the voyage of global competitiveness in the twenty-first century (Egbu 2004; Ramezan 2011), which created a new era in intangible resources management or intellectual capital (IC) that build a foundation for sustainable competitive advantages at the firm level (Barney 1991; Drucker 1993). Thus, IC is regarded as the bedrock of modern business since it supports organizational success and growth by optimally combining intellectual and physical resources to achieve greater productivity, firm performance, and value creation (Drucker 1993; Stewart 1997; Sveiby 1997; Zack 1999; Tan et al. 2008). Surprisingly, the key reason for the IC attributing to improved firm performance (FP) is the creation of competitive advantages for a firm among peers (Bontis 2001; Tan et al. 2008) that propels the social and economic development of a nation, and therefore, it occupies the priority position in the organizational hierarchy for corporate value and improved FP (Abeysekera and Guthrie 2005; Stewart 1997). The literature describes the importance of IC on FP from two different schools of thought, i.e., cost concern and value creation (Grassmann 2021; Zhang et al. 2020).
The cost concern theory endorses that corporate investment causes cash outlay and reduces the FP. In contrast, the value creation perspective proposes that corporate investment enhances the FP by building competitive advantages and stakeholder relationships (Grassmann 2021; Zhang et al. 2020). A similar phenomenon is also observed in the IC literature where investment in IC increases FP (Bayraktaroglu et al. 2019; Bozbura 2004), but excess investment in IC results in cash outflows and lower FP (Asif et al. 2020; Xu et al. 2022). Therefore, the literature suggests that the linear relationship (i.e., positive or negative) between IC and FP may not be that visible in reality, as an increase in investment in IC is unlikely to increase the FP endlessly (Asif et al. 2020; Xu et al. 2022). The firms are faced with resource constraints and limits on the expertise of firms to effectively manage resources, beyond which pursuing IC could be burdensome. Thus, the entire scenario points towards a curvilinear relationship rather than a linear one. Further, the curvilinear relationship consists of two groups, viz., U-shaped (inverted U-shaped) relationship, based on the premise that an investment (spending) may increase (decrease) FP up to a threshold limit (Grassmann 2021; Sun et al. 2019). The extant literature explains the U-shaped relationship from the “too little of a good thing” effect perspective, where a firm needs to spend a minimal amount to increase the FP (Grassmann 2021; Sun et al. 2019). In contrast, the inverted U-shaped relationship can be explained through the “too much of a good thing” effect (Grassmann 2021) and has been supported by the extant literature (Asif et al. 2020; Xu and Zhang 2021; Xu et al. 2022). The scholarly work of Pierce and Aguinis (2013) describes the “too much of a good thing” effect in the field of management. They advocate that the positive relationship between dependent and independent variables is always not monotonic. After reaching the context-specific inflection point, this relationship transits from positive to negative and forms a curvilinear pattern. Hence, the positive relationship between IC and FP need not necessarily follow the monotonic path and can take the shape of curvilinearity due to the excessive investment in IC, resulting in a huge cash outflow, and may have an adverse effect on FP (Asif et al. 2020; Xu and Zhang 2021; Xu et al. 2022).
In view of the previous literature (Asif et al. 2020; Xu and Zhang 2021; Xu et al. 2022) examining the non-linear link between IC and financial performance or competitiveness, this study attempts to add to the existing literature in the following ways. First, this study examines the IC and FP relationship using cost concern and value creation perspectives. The research used resource-based theory (RBT) and stakeholder theory to conclude the relationship between IC and FP. Second, this study examines the prospect of interference of firm-specific aspects in IC and FP, which has not yet been investigated. Researchers strongly recommend that firm-level attributes, such as firm size, profitability, ownership structure, and many more, play important roles in shaping the IC (Bozzolan et al. 2006; 
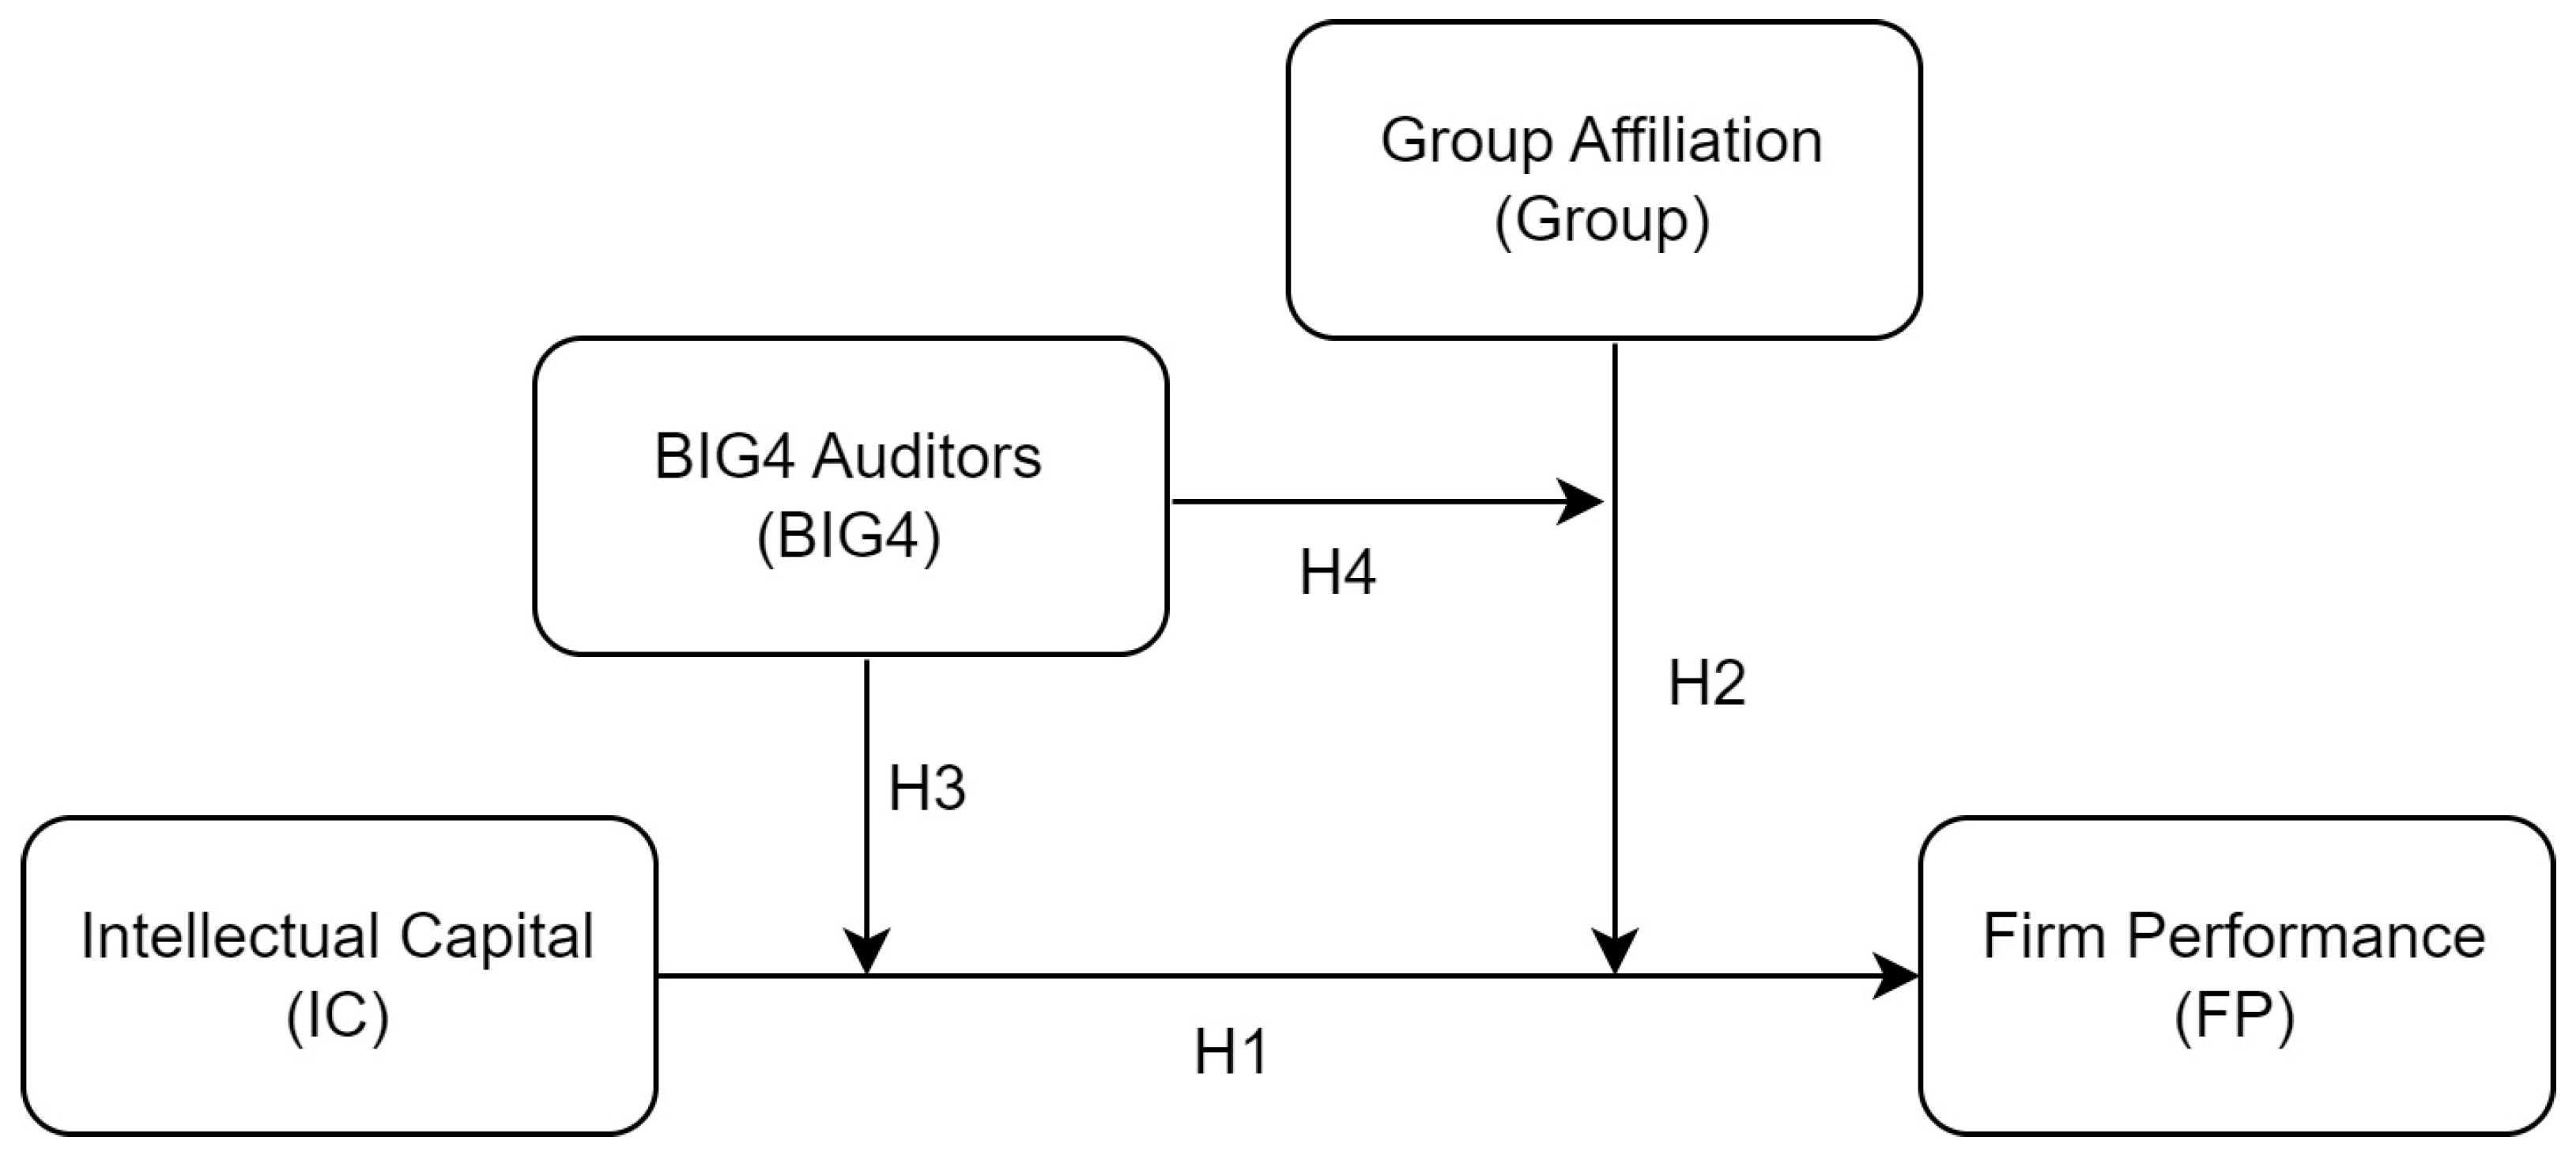
Whiting and Woodcock 2011). However, the influence of ownership structure and the presence of BIG4 auditors exhibit a significant role in both IC and FP (Bamiatzi et al. 2014; Cerbioni and Parbonetti 2007; Purkayastha et al. 2022). The ownership structure in the Indian environment is highly complex due to the dominance of business group firms (Mohapatra and Mishra 2021; Purkayastha et al. 2022). Although the group affiliation has certain benefits, like access to organizational assets and internal capital from the parent company that helps improve the FP, the same is coupled with disadvantages, such as principal–principal agency conflict, i.e., conflict of interest between major and minority shareholders. Most interestingly, the severity of principal–principal agency conflict due to group affiliation is more prevalent in emerging economies like China, India, South Korea, Thailand, and Russia (Purkayastha et al. 2022; Young et al. 2008).
Similarly, the role of auditors, especially BIG4 auditing firms, is more critical in the Indian scenario due to past corporate scandals (Al-ahdal and Hashim 2022). Those corporate collapses trigger the importance of BIG4 auditors for better audit quality and governance (Al-ahdal and Hashim 2022; Dezoort et al. 2001; Fan and Wong 2005). Hence, the group affiliation and presence of BIG4 auditors emerge as influential moderators due to their severity in the Indian context. Thus, this study expects that the relationship between IC and FP may not be similar in the presence or absence of group affiliation and BIG4 auditors. Third, the presence of BIG4 auditors in group-affiliated firms and their impact on the IC and FP relationship is still in a dilemma, as none of the previous research explored these dimensions in any context. However, in the Indian scenario, the large client base of the BIG 4 auditors due to economies of scale (Johl et al. 2016), as well as the preference of affiliated firms for BIG4 auditors in emerging economies with an aim for better audit quality (Ocak et al. 2021), create a base for further exploration in the Indian context. In addition to these, the innovative environment, internal resource sharing, functional stability in group-affiliated firms (Bamiatzi et al. 2014; Claessens et al. 2006; Hsieh et al. 2010), and their approach toward BIG4 auditing firms (Johl et al. 2016; Ocak et al. 2021) may create a synergy that may boost both IC and FP. So, this study finds it worth examining to investigate the role of BIG4 auditors in group-affiliated firms for impacting the FP through IC. Therefore, it suggests a possible moderated moderation relationship in the Indian context.
In addition to the above characteristics of the Indian scenario for positioning the present research, the reporting practices of Indian companies further distinguish this research. The Indian Accounting Standards (Ind AS 1)1 for preparing financial statements are not the same as the International Financial Reporting Standards (IFRS), as India adopted the converged version of IFRS after considering the operationalization of Indian firms. For example, IFRS permits the compilation of two distinct statements or a single statement of profit and loss and comprehensive income, whereas Ind AS 1 only allows the preparation of a single profit and loss statement. In a similar vein, IFRS principles permit organizations to categorize expenses according to their function or nature, whereas Ind AS 1 permits entities to recognize expenses in accordance with their nature only. Similarly, the Indian Accounting Standards (Ind AS 110) also state that the firm has to prepare a consolidated financial statement when it controls one or more subsidiaries or affiliated entities so that it may help the stakeholders understand the business operation of parent and affiliated companies. In addition to the abovementioned situation, IC reporting remains optional in India due to the lack of specific accounting standards. While Ind AS 38 does address intangible assets, its main purpose is to establish principles for the accounting treatment of intangible assets that are developed internally or externally. Despite the absence of a compulsory reporting requirement, prominent Indian corporations such as Reliance Industries, TCS, and ITC have adopted the practice of including their IC as an integral element in their annual reports. So, the above dynamics relating to IC and the unique Indian setting due to distinct accounting practices and complex ownership structure (Mohapatra and Mishra 2021; Purkayastha et al. 2022) motivate this study to investigate deeper to examine the identified research gaps.
After considering the sample firms from the National Stock Exchange (NSE) India and examining the linear and curvilinear relationship with group affiliation and BIG4 auditors as moderation and moderated moderation, this study contributes to the literature in the following ways. First, it reconciles the positive linear relationship between IC and FP with an inverted U-shaped curvilinear approach. It claims that the IC will enhance FP, but after a certain point, the additional investment in IC will gradually decrease the overall FP. Thus, our findings provide further recommendations to managers intending to use the IC to yield a better FP, especially in the Indian scenario. Second, this study strengthens the existing literature by advocating the role of group affiliation and BIG4 auditors in the Indian context in shaping the IC and FP relationship. Third, our research claims that the presence of BIG4 auditors in affiliated firms produces different results in IC and FP. So, the management of IC in affiliated firms where BIG4 auditors are present may be more critical for FP than non-BIG4-audited firms. So, this study could assist academia and researchers in conceptualizing and hypothesizing the IC and FP relationship and help them understand the importance of group affiliation and BIG4 auditors in emerging economies, subsequently opening up the possibility of doing comparable investigations in other developing countries. This study also concentrates on policy implications, arguing that policymakers need to perceive the IC as a strategic asset for long-term growth and FP. Similarly, our findings may assist policymakers in promoting or facilitating a knowledge-sharing culture, in which Indian enterprises support human capital, corporate stakeholder relationships, and structural viability for improved FP. Furthermore, this study’s findings can be used as a road map for corporations, academics, and policymakers to manage the IC effectively to improve FP.
The structure of this study is organized as follows. The Section 2 outlines the institutional settings, while the Section 3 examines the relevant literature and formulates the research hypothesis. The Section 4 describes the data and methodology, the Section 5 delivers the results and discussion, and the Section 6 concludes this study.

2. Institutional Settings

The disclosure of IC is the new identity in annual reports for Indian corporations, as its journey has taken a significant step since 1997, when Reliance Industries, Shree Cement, and Balrampur Chini Mills took proactive steps to include the components of IC in their annual reports. Despite the absence of a legal necessity for IC disclosure, successive periods witnessed the adoption of the IC as an integral component of annual reports by several Indian corporations due to the core attributes of IC that emerge in firm value and performance (Clarke et al. 2011; Oppong and Pattanayak 2019).
Researchers identified that the management and reporting of IC in Indian firms enhances the FP and successfully contributes to productivity and value creation (Nadeem et al. 2017; Oppong and Pattanayak 2019; Vishnu and Gupta 2014). Hence, the popularity and growth of IC in the corporate arena have become more visible and significant due to its contribution to competitive advantages (Kamath 2008) and in preserving the growth trajectory of a firm (Ordóñez de Pablos 2003). In addition to these, the diverse work culture, complex ownership structure, and dominance of human-intensive industries in the Indian corporate environment make IC more valuable and enriching over the long run (Kumar 2013; Kuknor and Bhattacharya 2021). Therefore, the role of IC in Indian firms is considered a successful value driver for better performance.
In addition to the IC, the dominance of business group firms in the Indian economy (Mohapatra and Mishra 2021; Purkayastha et al. 2022; Singh et al. 2007) and the large client base of BIG4 auditing firms have started influencing firm-level decisions and corporate investment. Their presence can significantly change the IC and financial performance. Therefore, this study also explores the IC and FP relationship from the perspective of group affiliation and BIG4-audited firms.

3. Review of Literature and Hypothesis Development

3.1. Literature Review

The influence of corporate expenditure on FP is explained by two primary schools of thinking in the literature: cost concern and value creation (Sun et al. 2019; Zhang et al. 2020). According to the cost concern school of thought, a business investment necessitates a cash outlay that reduces company value and affects FP (Grassmann 2021; Zhang et al. 2020). Because maintaining IC requires significant effort and expense, proponents of the cost concern school of thought argue that doing so reduces company value and impacts FP. Therefore, researchers find that stockholders are less interested in IC because of the firm’s financial disadvantage (Ramírez and Ponce 2013). Although the IC involves huge investments, it also brings competitive advantages to the firm (Bayraktaroglu et al. 2019; Stewart 1997; Tan et al. 2008). So, the value-creation attributes of the IC are viewed as assets with the potential to generate future economic benefits, leading to improved FP and business value (Margolis and Walsh 2001; Pedrini 2007). Consequently, the past literature provides evidence that IC and FP are positively related in many organizational and geographical contexts (Nadeem et al. 2017; Vishnu and Gupta 2014; Xu and Li 2022). Therefore, IC’s impact positively contributes to the FP across several industries and nations (Bayraktaroglu et al. 2019; Clarke et al. 2011; Nadeem et al. 2017; Vishnu and Gupta 2014).

3.2. Hypothesis Development

This study comprises resource-based and stakeholder theory to build the conceptual framework for IC and FP in the Indian context. Resource-based theory (RBT) creates a basis for understanding the importance of IC in corporate value creation. As per the RBT theory, the success and growth of a firm depend on the efficient management of its resources, i.e., both tangible and intangible (Wernerfelt 1984). However, the dominance of intangible or knowledge resources (i.e., IC) in creating organizational capabilities (Juma and Payne 2004) is more relevant in the modern era due to the ultimate achievement of competitive advantages and FP (Bayraktaroglu et al. 2019; Marr et al. 2003). Similarly, the inclusion of stakeholder theory strengthens the broad strand of literature and highlights that an organization should perform the activities expected by its stakeholders to protect the interests of all parties (Freeman 1984; Freeman and Mcvea 2005). Hence, researchers claim that the organization is accountable for disclosing the IC beyond its financial information to achieve a better FP (Guthrie et al. 2004).
Against this backdrop, some of the literature asserts that the aforementioned relationship is not necessarily linear, with results showing that a rise in IC investment does not exponentially enhance FP past a certain threshold (Xu and Zhang 2021). Therefore, the studies corroborate the curvilinear relationship between IC and FP, which may be the right approach for examining the empirical relationship. Hence, as discussed earlier, we have used the cost concern and value creation schools of thought to summarize the curvilinear relationship into U-shaped and inverted U-shaped curves. Further, the U-shaped relationship is accompanied by the “too little of a good thing” effect, where a minimal investment is required to enhance FP. In contrast, the inverted U-shaped curve advocates for the “too much of a good thing” effect and claims that no investment or expenditure will boost performance indefinitely, as after a threshold, additional investment decreases the FP (Sun et al. 2019; Trumpp and Guenther 2017). The “too much of a good thing” effect asserts that the benefits of antecedents can cause adverse effects when they are taken too far (Pierce and Aguinis 2013). As per this effect, exceeding or investing beyond the inflection point or threshold limit is always undesirable due to economic waste or undesirable outcomes (Poole and Van de Ven 1989; Pierce and Aguinis 2013). The particular scenario has been seen in IC and FP contexts, where too much investment in IC causes economic disadvantages or cost burdens, causing a negative effect on FP (Asif et al. 2020; Xu and Zhang 2021; Xu et al. 2022). Thus, we expect a curvilinear relationship between IC and FP. This study formulates the following hypothesis in light of the previous discussion and theories.
Hypothesis 1.
Intellectual capital has a curvilinear relationship with firm performance.
The relationship between IC and FP is also subject to the influence of firm characteristics, as the literature finds that the influential role of ownership structure and extensive control in group-affiliated firms creates principal–principal agency conflicts and impacts the FP and corporate disclosure practices (Bamiatzi et al. 2014; Kim and Yi 2006; Terlaak et al. 2018; Whiting and Woodcock 2011). The stakeholder theory highlights that a firm can minimize information asymmetry and agency conflicts by disclosing more information, including IC (Cerbioni and Parbonetti 2007), so that it will not only address the principal–principal agency issues in the emerging economies but also control the dominance of the parent company over group-affiliated firms (Purkayastha et al. 2022; Young et al. 2008). In addition to the significant control in group affiliation, it also provides some benefits in terms of internal capital sharing and functional stability that closely impact the FP (Bamiatzi et al. 2014; Claessens et al. 2006). So, the evidence from the literature asserts that group affiliation may be a value-enabling factor for better FP (Bamiatzi et al. 2014; Popli and Ladkani 2020). Hence, we argue on the basis of the preceding discussion and stakeholder theory that there is no doubt that group affiliation significantly influences the FP. Thus, in light of ownership concentration in emerging economies and agency cost, we examine the following hypothesis in the context of group affiliation.
Hypothesis 2.
Group affiliation has a negative moderating effect on intellectual capital and firm performance.
The emerging economies witnessed that the role of BIG4 auditors has extended from traditional audit practices to adhering to corporate disclosure practices (DeAngelo 1981; Hossain et al. 1995) that ultimately guide the firms to publish more IC information (Whiting and Woodcock 2011). The influence of BIG4 auditors in emerging economies has a prominent role, as they ensure a higher level of assurance and credibility that ultimately affects the FP (Badriyah et al. 2015; Jermias and Gani 2014) due to upholding their reputation in the marketplace (Chow and Wong-Boren 1987). Hence, the positive relationship between BIG4 and FP is quite apparent in the modern literature, as they symbolize the value relevance, reliability of accounting information, and access to capital (Beisland et al. 2018; Lee and Lee 2013). Interestingly, the ultimate positive impact of the presence of BIG4 auditors on FP is consistent, irrespective of the ownership structure (Mohapatra and Mishra 2021). Hence, we hypothesize the following.
Hypothesis 3.
BIG4 auditors have a positive moderating effect on intellectual capital and firm performance.
The above scenario of BIG4 auditors and the proposed relationships would provide appropriate elucidations when this study examines the role of BIG4 auditors in group-affiliated firms in impacting FP. The literature asserts that the presence of BIG4 auditors in affiliated firms improves the earnings quality due to superior audit quality (Ocak et al. 2021), and at the same, it may also help the affiliated firms to leverage the explicit control of the parent organization. Therefore, the evidence shows that affiliated firms are more inclined to appoint BIG4 auditors (Johl et al. 2016; Ocak et al. 2021). All those phenomena indicate a possible moderated moderation relationship of BIG4 auditors in group-affiliated firms that can exist between IC and FP. Hence, this study formulates the following hypothesis for the moderated moderation of BIG4 auditors in the Indian context. We provide the theoretical model of this study in Figure 1.
Hypothesis 4.
The presence of BIG4 auditors in group-affiliated firms has a moderated moderation effect on intellectual capital and firm performance.

4. Data and Methodology

4.1. Sample

This study has selected a representative sample of non-financial listed firms from the National Stock Exchange (NSE) in India from the financial years 2004–2005 to 2020–2021. This study gathered information from the CMIE ProwessIQ database and annual reports. Following the prior literature, we excluded financial companies from our sample due to divergent financial reporting procedures (Berzkalne and Zelgalve 2014; Hejazi et al. 2016). Similarly, after removing the firms with missing financial data, the final sample resulted in 795 non-financial companies. Further, we classified our sample firms into different industries as per the first two-digit National Industrial Classification (NIC) code. The industry-wise sample classification is reported in Table 1.

4.2. Measurement of Firm Performance (FP)

Firm performance (FP) typically includes both financial and market measures. Although the literature considers the market risk or volatility along with the performance variables (Fullana et al. 2022), this study only considers the fundamental proxies for measuring sample firms’ financial and market performance. The literature extensively used the return on assets (ROA) for financial performance and Tobin’s Q ratio (TQ) for market performance (Bennouri et al. 2018; Nadeem et al. 2017; Vishnu and Gupta 2014). Hence, in line with the previous literature, this study uses both ROA and TQ as dependent variables in the empirical analysis. We measure ROA as the net income divided by the average total assets and TQ as the market value of total assets divided by the book value of total assets.

4.3. Measurement of Intellectual Capital (IC)

We estimate the IC using the modified version of Pulic (1998) value-added intellectual coefficients (VAIC) model. The VAIC model advocates that a firm can generate value from its physical and intellectual capital (Pulic 1998). Hence, the model includes three components to measure the IC, i.e., human capital efficiency (HCE), structural capital efficiency (SCE), and capital employed efficiency (CEE). The computation of IC starts with estimating value added (VA) using the difference between total revenue and total expenses, excluding the employee cost (Clarke et al. 2011; Tan et al. 2008). The exclusion of employee cost as an expense while computing VA is consistent with the earlier literature that claims that employee cost is an investment for a firm rather than an expense (Clarke et al. 2011). However, the researchers criticize Pulic’s VAIC model, as it does not include a firm’s relational capital (RC) (Nazari and Herremans 2007; Vishnu and Gupta 2014). The past literature asserts that relational capital is an integral element of IC (Bontis 2001; Bozbura 2004). Hence, Nazari and Herremans (2007) argue that the VAIC model developed by Pulic (1998) needs an expansion to include the relational capital and present a modified version of VAIC (MVAIC) to measure the IC. Subsequently, several studies used the MVAIC model in their empirical studies to represent the relational capital efficiency along with the core components of VAIC (Bayraktaroglu et al. 2019; Nazari and Herremans 2007; Ulum et al. 2014; Vishnu and Gupta 2014). Therefore, the research used the MVAIC model to measure the IC and presented the computation process below.
V A = T o t a l   r e v e n u e T o t a l   e x p e n s e s   e x c l u d i n g   e m p l o y e e   c o s t s
H C E = V A H u m a n   c a p i t a l   ( H C ) = V A T o t a l   e m p l o y e e   c o s t s
S C E = S t r u c t u r a l   c a p i t a l   ( S C ) V A = V A H C V A
C E E = V A C a p i t a l   e m p l o y e d   ( C E ) = V A T o t a l   a s s e t s I n t a n g i b l e   a s s e t s
R C E = R e l a t i o n a l   C a p i t a l   ( R C ) V A = T o t a l   s e l l i n g   a n d   m a r k e t i n g   e x p e n s e s V A
M V A I C = H C E + S C E + C E E + R C E

4.4. Moderators and Control Variables

This study uses dummy variables for group affiliation and BIG4 auditors, i.e., moderators, for the empirical analysis. The firms belonging to any business groups in India have assigned the values 1 and 0 otherwise. Similarly, the presence of BIG4 auditors in our sample firms has obtained the values 1 and 0 otherwise. In addition to these, we use some firm-specific control variables in this study, and measurements of those variables are reported in Appendix A. Following the prior literature (Fan and Wong 2005; Jo et al. 2015; Trumpp and Guenther 2017), this study winsorizes all variables except dummies to remove the outliers from the models.

4.5. Empirical Models

This research has employed fixed-effect panel regression models with industry and year dummies to test our research hypothesis and used STATA software (version 14) to perform the empirical analysis.
To examine the first hypothesis, we use the following models:
F P i t = α + β 1 M V A I C i t + β 2 G r o u p i t + β 3 B I G 4 i t + β 4 E T R i t + β 5 F i r m   A g e i t + β 6 L e v e r a g e i t + β 7 S G R O W i t + β 8 N E i t + T = 1 T β t Y e a r t + N = 1 N β j I n d u s t r y j + u i t
F P i t = α + β 1 M V A I C i t + β 2 M V A I C i t 2 + β 3 G r o u p i t + β 4 B I G 4 i t + β 5 E T R i t + β 6 F i r m   A g e i t + β 7 L e v e r a g e i t + β 8 S G R O W i t + β 9 N E i t + T = 1 T β t Y e a r t + N = 1 N β j I n d u s t r y j + u i t
i = 1, 2, …, n and t = 1, 2, …, T are the firm and year, respectively.
Equation (7) examines the linear relationship between IC and FP, while Equation (8) examines the curvilinear relationship. Additionally, we examine additional tests, like the slope and U or Inverted U tests, to validate our findings.
Similarly, this study has incorporated moderators, i.e., group affiliation and BIG4 auditors, in linear and curvilinear models to test Hypotheses 2 to 4. This study also explored the scope for moderated moderation to check how the BIG4 auditors in affiliated firms influence the IC and FP relationship. We follow Hayes’ (2017) proposed regression-based model to check the moderated moderation in linear and curvilinear models.

5. Results and Discussion

5.1. Descriptive Statistics and Correlation Coefficients

This study presents the descriptive statistics and correlation coefficients matrix in Table 2. It shows that the average financial performance of Indian firms is 0.056 or 5.6% of average total assets, whereas the mean market performance (TQ) is 1.442, which indicates a higher market value than the book values of assets of sample firms. Similarly, the mean value of MVAIC of our sample firms is 4.230, and the total number of affiliated firms is 48% of the total sample, which shows the domination of business group houses in the Indian economy. Our descriptive statistics also show that BIG4 auditors have an immense role in the Indian market, as they audit 31% of total firm–year observations. Similarly, we report the descriptive statistics of other control variables in Table 2.
We report the correlation coefficients between all variables in Table 2. It shows that none of the correlation coefficients between independent variables are more than 0.7, indicating no multicollinearity issues in our context. In addition to these, our untabulated variance inflation factor (VIF) score is less than 5, which rejects the chances of multicollinearity. The correlation coefficients reveal a positive and statistically significant association between IC and FP, while the group affiliation has a significant positive relationship with market performance. However, the presence of BIG4 auditors is beneficial for both financial and market performance in the Indian context, as they posit a positive correlation. Similarly, the BIG4 and group affiliation have a positive association, indicating that group-affiliated firms prefer to appoint BIG4 auditors in the Indian scenario. Similarly, the correlation between other variables is reported in Table 2.

5.2. Intellectual Capital and Firm Performance

We present the empirical results of the linear connection between IC and FP in Table 3. Consistent with the prior literature (Clarke et al. 2011; Hejazi et al. 2016; Vishnu and Gupta 2014), this study claims that more IC improves the firm’s financial and market performance, indicating that the essence of IC is far more prevalent in the Indian context. Additionally, this study includes different industries, including knowledge-based and traditional manufacturing firms, and complements the earlier studies in the Indian context (Maji and Goswami 2016; Vishnu and Gupta 2014) by asserting that IC creates value and enhances the FP of both knowledge-based and traditional manufacturing firms. Moreover, our findings support the earlier argument and assert that more involvement in IC helps firms create competitive advantages, resulting in better performance (Clarke et al. 2011; Marr et al. 2003). We present the linear relationship between IC and FP in Figure 2, which shows a positive trend for both ROA and TQ.
This study presents the results of the curvilinear relationship between IC and FP using Equation (8) in Table 4 to test our first hypothesis. Examining curvilinear relationships between variables is more complex than linear models since the sign of the coefficients determines whether the link between explanatory and dependent variables is U-shaped or inverted U-shaped. Positive (negative) and significant coefficients of the squared term of the independent variable indicate a U-shaped (inverted U-shaped) relationship (Haans et al. 2016; Xu and Zhang 2021). Apart from the significant coefficients, researchers have employed some additional tests to support the U or inverted U relationship, e.g., slope test, slope difference test, and t-statistics (Haans et al. 2016).
Hence, this study examining curvilinear relationships is subject to two additional requirements. First, the extreme point must fall within the data range. Second, for the inverted U-shaped (U-shaped) connection, the slope at the lower end must be positive and significant (negative and significant). In contrast, the slope at the upper end must be negative and significant (positive and significant). The statistics of additional conditions are reported in Table S1.
After analyzing the additional tests and regression coefficients, this study finds an inverted U-shaped relationship between MVAIC and FP, including both ROA and TQ. Hence, the findings support Hypothesis 1 and claim that IC has a curvilinear relationship with the FP of Indian firms. Figure 2 also depicts the same and shows that investment in IC enhances the FP up to a threshold, and further investment reduces the FP beyond the threshold point and forms an inverted U-shaped curve. Our findings are consistent with the cost concern school of thought and “too much of a good thing” effect (Grassmann 2021; Zhang et al. 2020) by claiming that investment in IC may not endlessly increase the FP in the Indian context, as the positive association between IC and FP will cease to exist beyond the maximum point. The results claim that after a certain point, the efficiencies of IC in Indian firms decline due to economic disadvantages, such as the cost burden of IC investment, resulting in an adverse impact on FP (Xu et al. 2022). Similarly, management may face difficulties in managing intangible resources, e.g., the positive relationship between IC and FP turns negative after the inflection point and claims that the good effect of IC on FP ceases to exist when firms make excess investments in IC (Pierce and Aguinis 2013; Xu and Zhang 2021; Yao et al. 2019).

5.3. Moderating Effect of Group Affiliation on IC and FP Relation

We examine the moderating effect of group affiliation to test our Hypothesis 2 and present the results in Table 3 and Table 4. The empirical analysis for moderation and moderated moderation follows several steps, as Dawson and Richter (2006) and Hayes (2017) suggested. First, we examined the statistical significance of the coefficients of interaction terms and subsequently performed additional tests to validate the moderation and moderated moderation effects. We checked for the simple slope test and slope difference and their statistical significance. Then, we estimated the ratio (t-statistics) between the slope difference (∆Slope) and standard error of slope difference (SE∆Slope) and checked whether that statistically differs from zero or not. All these additional tests are reported in Tables S2 and S3.
The moderation analysis of group affiliation between IC and FP reveals that the impact of IC on financial performance is higher in standalone firms compared to business group firms. However, the relationship is the opposite for market performance. Hence, we obtained mixed results for the moderation of group affiliation, indicating one of the most influential moderators in the Indian context. Moreover, our result supports Hypothesis 2 for financial performance and rejects it for market performance. Our finding contradicts the earlier literature that advocates that affiliated firms obtain support from the parent company in terms of better management and internal capital, which may improve the FP (Bamiatzi et al. 2014; Claessens et al. 2006). However, in emerging economies, there is a possibility of tunneling of profit among affiliated firms (Kim and Yi 2006). In addition to these, the investment in IC may not yield the benefit in the same period, as it requires time to convert the investment into revenue. Thus, our findings endorse that the transfer of resources, tunneling of profit, or timing of cash flow may be a cause for the negative relationship between IC and the financial performance of group-affiliated firms. However, the scenario of market performance may react differently, as investment IC is considered a source for the potential growth of a firm due to competitive advantages (Bayraktaroglu et al. 2019; Clarke et al. 2011). Hence, investors may perceive it as a positive sign and impact the market performance positively. Figure 3 also shows a similar result for our Hypothesis 2 and claims that the financial performance of standalone firms improves with the additional investment in IC. However, the market performance of affiliated firms is comparatively better than standalone firms with investment in IC due to the potential for growth opportunities (Bayraktaroglu et al. 2019; Clarke et al. 2011).
The moderation of group affiliation in curvilinear relationships reveals that the interaction of group affiliation with the squared MVAIC shows a positive and significant relationship for ROA. However, this study presents the joint effect of IC on FP with and without the moderator variable of group affiliation in Figure 3 to illustrate the relationship in detail. The figure exemplifies that firms belonging to business groups enhance their financial performance up to a certain point by investing in IC. After the maximum point, additional investment may require more cash outflow in affiliated firms, reducing overall performance. Thus, our results confirm the “too much of a good thing” effect and claim that the joint benefits of both IC and group affiliation may not increase the performance beyond the inflection point due to economic disadvantages and managerial inefficiencies in managing intangible resources (Pierce and Aguinis 2013; Xu et al. 2022). Although group affiliation has some internal benefits in the Indian context (Mohapatra and Mishra 2021; Purkayastha et al. 2022), their presence will not provide better FP beyond the threshold limit of IC investment due to higher associated costs. Hence, the relationship between IC and FP in the presence of group affiliation establishes an inverted U-shaped relationship. However, comparing the IC and ROA relationship with non-group-affiliated firms reveals that affiliated firms have more ROA than non-group-affiliated firms, either at very little or huge investment in IC. However, the benefit from IC is relatively equal for both affiliated and non-affiliated firms in the middle range of IC investment (Figure 3). The scenario is somehow different for market performance. Group-affiliated firms’ market performance is better than non-affiliated firms with additional investment in IC. However, the empirical results for the moderation effect of group affiliation with IC for TQ remain positive and insignificant even if the graphical presentation shows a similar inverted U-shaped relationship between them. Hence, group affiliation fails to moderate market performance in curvilinear relationships.

5.4. Moderation Effect of BIG4 Auditors on IC–FP Relationship

The moderating effect of BIG4 auditors asserts that the presence of BIG4 auditors with greater IC has an influential role in FP, including ROA and TQ. Hence, our results support Hypothesis 3 and argue that the presence of BIG4 auditors enhances audit quality and results in fair financial reporting, better assurance, and trust among stakeholders (Rahman et al. 2019), ultimately enhancing the FP. Especially in emerging countries, the inclusion of BIG4 auditors carries a positive connotation for stakeholders, as their presence is associated with the communication of reliable information by a firm; consequently, their presence has a positive impact on both financial and market performance (Farooq and Kacemi 2011; Hassoun and Aloui 2017). Thus, it may be the cause for the positive relationship between IC and FP in the Indian scenario. We also present the moderation of BIG4 auditors on IC and FP in Figure 4. The linear graph shows that having BIG4 auditors improves financial and market performance compared to non-BIG4-audited firms.
The interaction of BIG4 auditors with the squared term of MVAIC in the curvilinear relationship is negative at the 1% significance level for both ROA and TQ, indicating a strong moderation impact of BIG4 auditors in the Indian context. However, to illustrate the connections of moderator variables in the curvilinear relationship, we present the joint effect of BIG4 auditors in Figure 4.
Figure 4 demonstrates that the financial and market performance of sample firms, with BIG4 firms as external auditors, increase in consonance with the increase in investment in IC up to the extremum point. After reaching that point, further investment in IC diminishes the FP, even with the presence of BIG4 auditors. Thus, our result confirms the “too much of a good thing” effect and forms an inverted U-shaped relationship between IC and FP with the moderation effect of BIG4 auditors. The empirical findings claim that despite the huge dominance of BIG4 auditors in the Indian context due to their significant contribution to the management of Indian firms (Al-ahdal and Hashim 2022; Johl et al. 2016), the higher cost burden in excessive IC investment decreases the good effect of BIG4 auditors in FP after a certain point (Grassmann 2021; Xu and Zhang 2021; Xu et al. 2022). The detailed analysis of graphs reveals that the performance of firms with fewer IC and BIG4 auditors is comparatively less than that of non-BIG4-audited firms in the early stage. It may be due to the cost burden for the firm due to the appointment of BIG4 auditors that decreases the FP, which is consistent with the cost concern school of thought (Grassmann 2021; Sun et al. 2019). However, the additional investment in IC and the presence of BIG4 auditors create a competitive advantage and enhance FP (Clarke et al. 2011; Hassoun and Aloui 2017; Marr et al. 2003). Hence, in line with the earlier literature (Badriyah et al. 2015; Mohapatra and Mishra 2021), our study confirms that the presence of BIG4 not only monitors the business activities but also guides the firms to generate more value or wealth over the period.

5.5. Moderated Moderation of BIG4 Auditors on IC and FP Relationship

This study examines Hypothesis 4 of moderated moderation of BIG4 auditors in group-affiliated firms to check whether their presence improves the FP with the help of IC or not. Thus, the empirical model incorporated a three-way interaction of IC, BIG4 auditors, and group affiliation. The results reported in Table 3 reveal that the interaction effect of BIG4 and group affiliation negatively impacted FP, but the inclusion of IC completely changed the scenario. Our results find that IC also enhances the performance of affiliated firms when they appoint BIG4 firms as their auditors. Thus, the empirical findings support Hypothesis 4 and suggest that the presence of BIG4 auditors improves audit quality and enhances the accountability of affiliated firms. Hence, the role of IC in the affiliated firms is more crucial, as it improves the FP by appointing the BIG4 auditors. The literature also confirms that the presence of BIG4 auditors encourages firms to engage in more IC (Whiting and Woodcock 2011). Therefore, the importance of IC in the Indian scenario is far more prevalent and carries significant weight in group-affiliated firms.
We also present moderated moderation in Figure 5a, and our graph reveals that the presence of BIG4 auditors in affiliated firms improves both the financial and market performance. Thus, this study strongly recommends that affiliated firms may appoint BIG4 auditing firms to enhance their FP. All our moderation and moderated moderation analyses fulfill the additional tests reported in Tables S2 andS3, which validates our findings in the Indian context. However, we present the results of moderated moderation in curvilinear relationships in Table 4. Although our earlier findings in linear relationships reveal a positive moderated moderation effect, this relationship is not significant in curvilinear relationships. Therefore, our findings strongly suggest that the moderated moderation of BIG4 and group affiliation is possible in the linear relationship, not in the curvilinear one. However, we have illustrated the aforementioned relationship in Figure 5b for better understanding and clarity. The graph demonstrates that a group-affiliated firm’s market performance is better in the presence of BIG4 auditors by investing in IC. But for financial performance, affiliated firms have better advantages either in lower or higher investment in IC. So, the presence of BIG4 auditors in affiliated firms undoubtedly brings significant changes in the Indian context. Therefore, the importance of IC, along with the individual role of BIG4 auditors and group affiliation in the Indian context, cannot be understated.

5.6. Robustness Checks

This study performs some robustness checks to validate the findings. In line with the prior literature, we have used alternative proxies to measure financial and market performance (Andersson et al. 2019; Bayraktaroglu et al. 2019; Pal and Soriya 2012). The literature uses the market-to-book value (MB) ratio to measure a firm’s market performance and estimate it as the market price divided by the book value per share (Bayraktaroglu et al. 2019; Pal and Soriya 2012). Similarly, the return on capital employed (ROCE) is also adopted as a proxy for the financial performance of a firm (Andersson et al. 2019; Tirumalsety and Gurtoo 2021). We have also run the empirical models using the MB ratio and ROCE as our dependent variables and present the results in Table 5 and Table 6.
Our analysis reveals a similar finding between IC and alternative performance proxies in the linear and curvilinear relationships. In addition to these, the results for moderation analysis with alternative proxies also show a similar relationship to our previous findings. We also perform another robustness check to validate our findings. We exclude the IC-intensive firms from our sample, as the literature strongly argues that some industries are proactive in IC management, like information and communication, computer programming and accessories, pharmaceuticals, accommodation, textile, wearing apparel, electronics, automotive, construction, and electrical and electronics (Hatane et al. 2021; Kamath 2008; Scafarto et al. 2016; Vishnu and Gupta 2014; Wang 2008; Yu et al. 2015). Therefore, including those firms in the sample may mislead our generalized outcomes. Thus, we re-ran the regression models excluding the IC-intensive firms and report the results in Table 7. After employing different robustness checks, this study finally validates the empirical findings are robust in the Indian context.

6. Conclusions

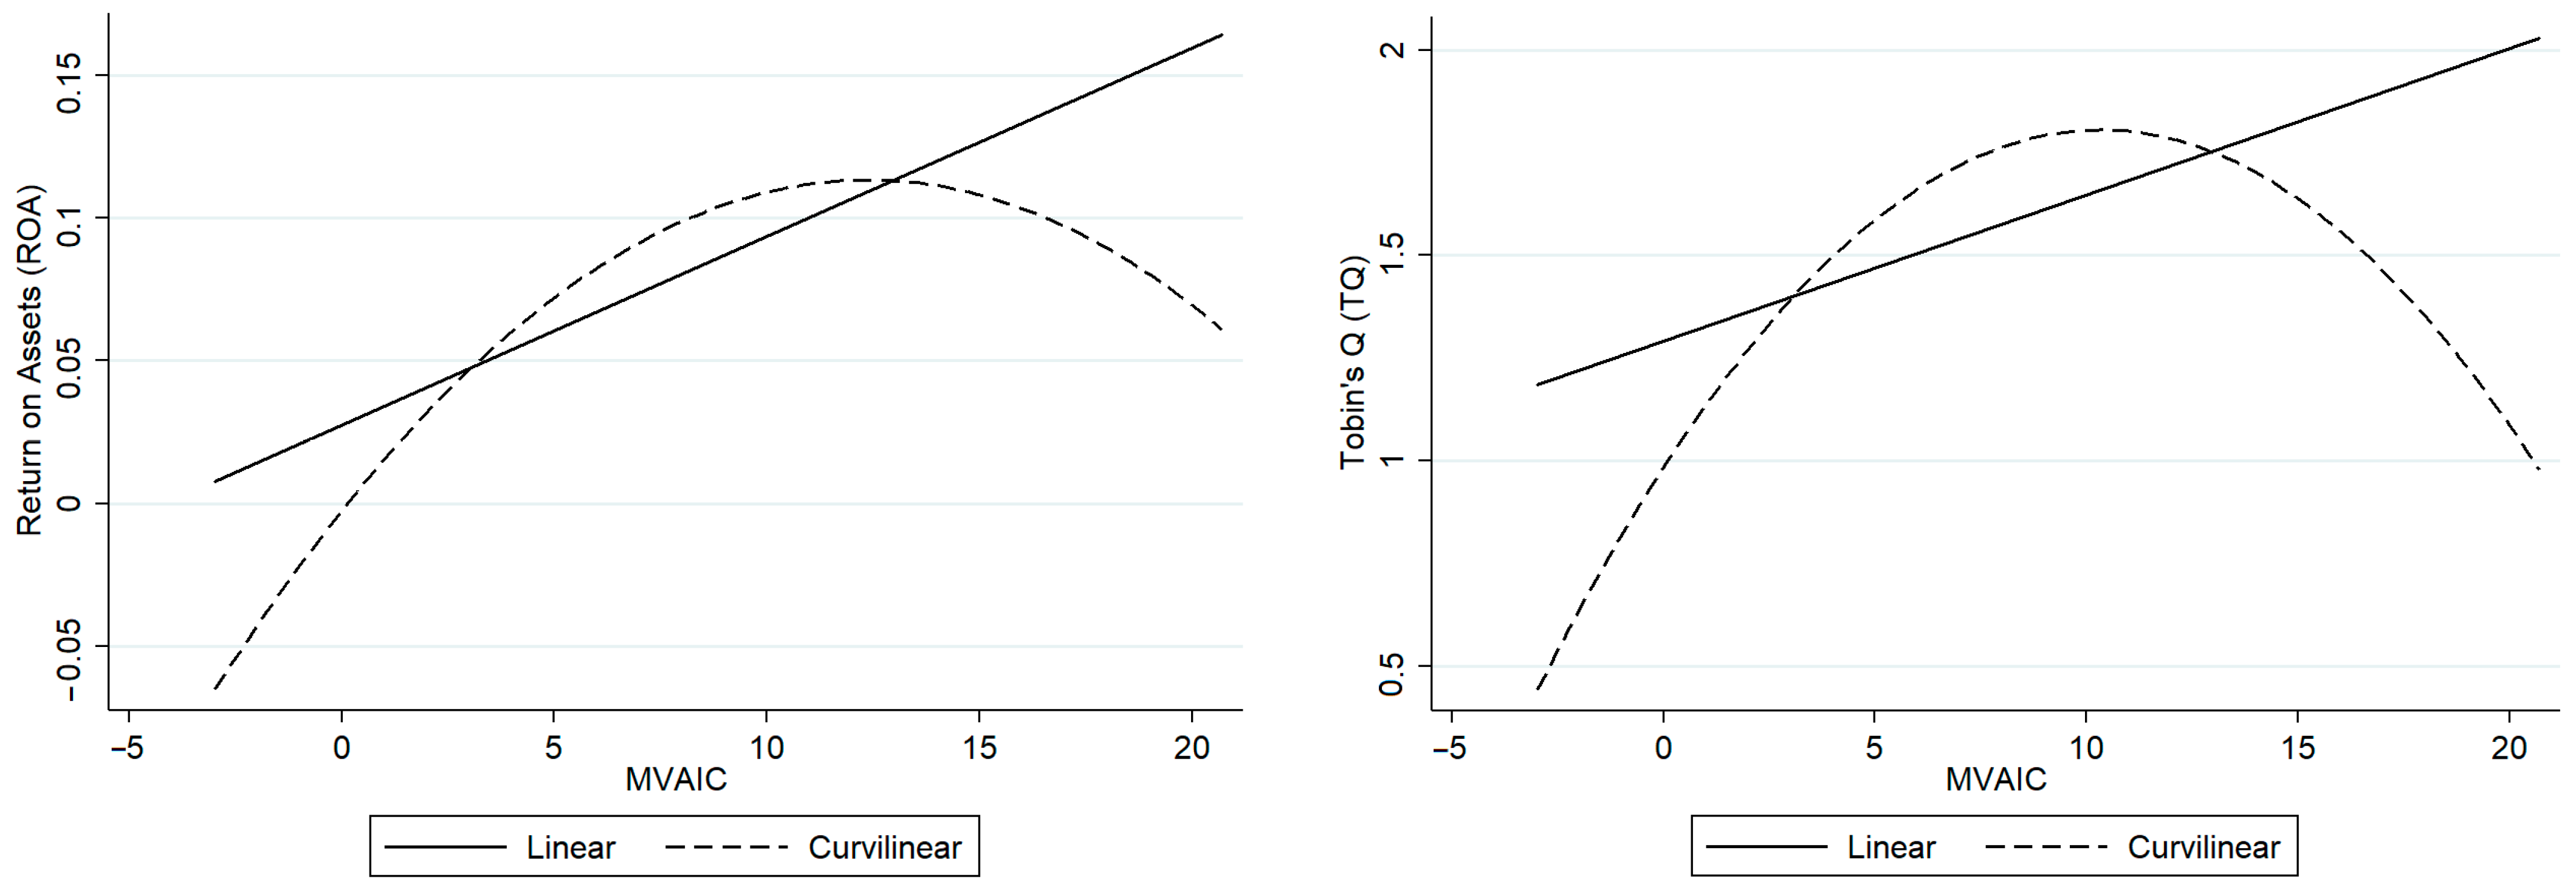
The present study extends the IC and FP literature by examining linear and curvilinear relationships. Further, it considers the influential role of BIG4 auditors and business group affiliation in the Indian scenario and uses them as moderating factors to examine the IC and FP relationship. To the best of our knowledge, this is the first ever study in the Indian context exploring linear and curvilinear relationships between IC and FP with moderation and moderated moderation effects.
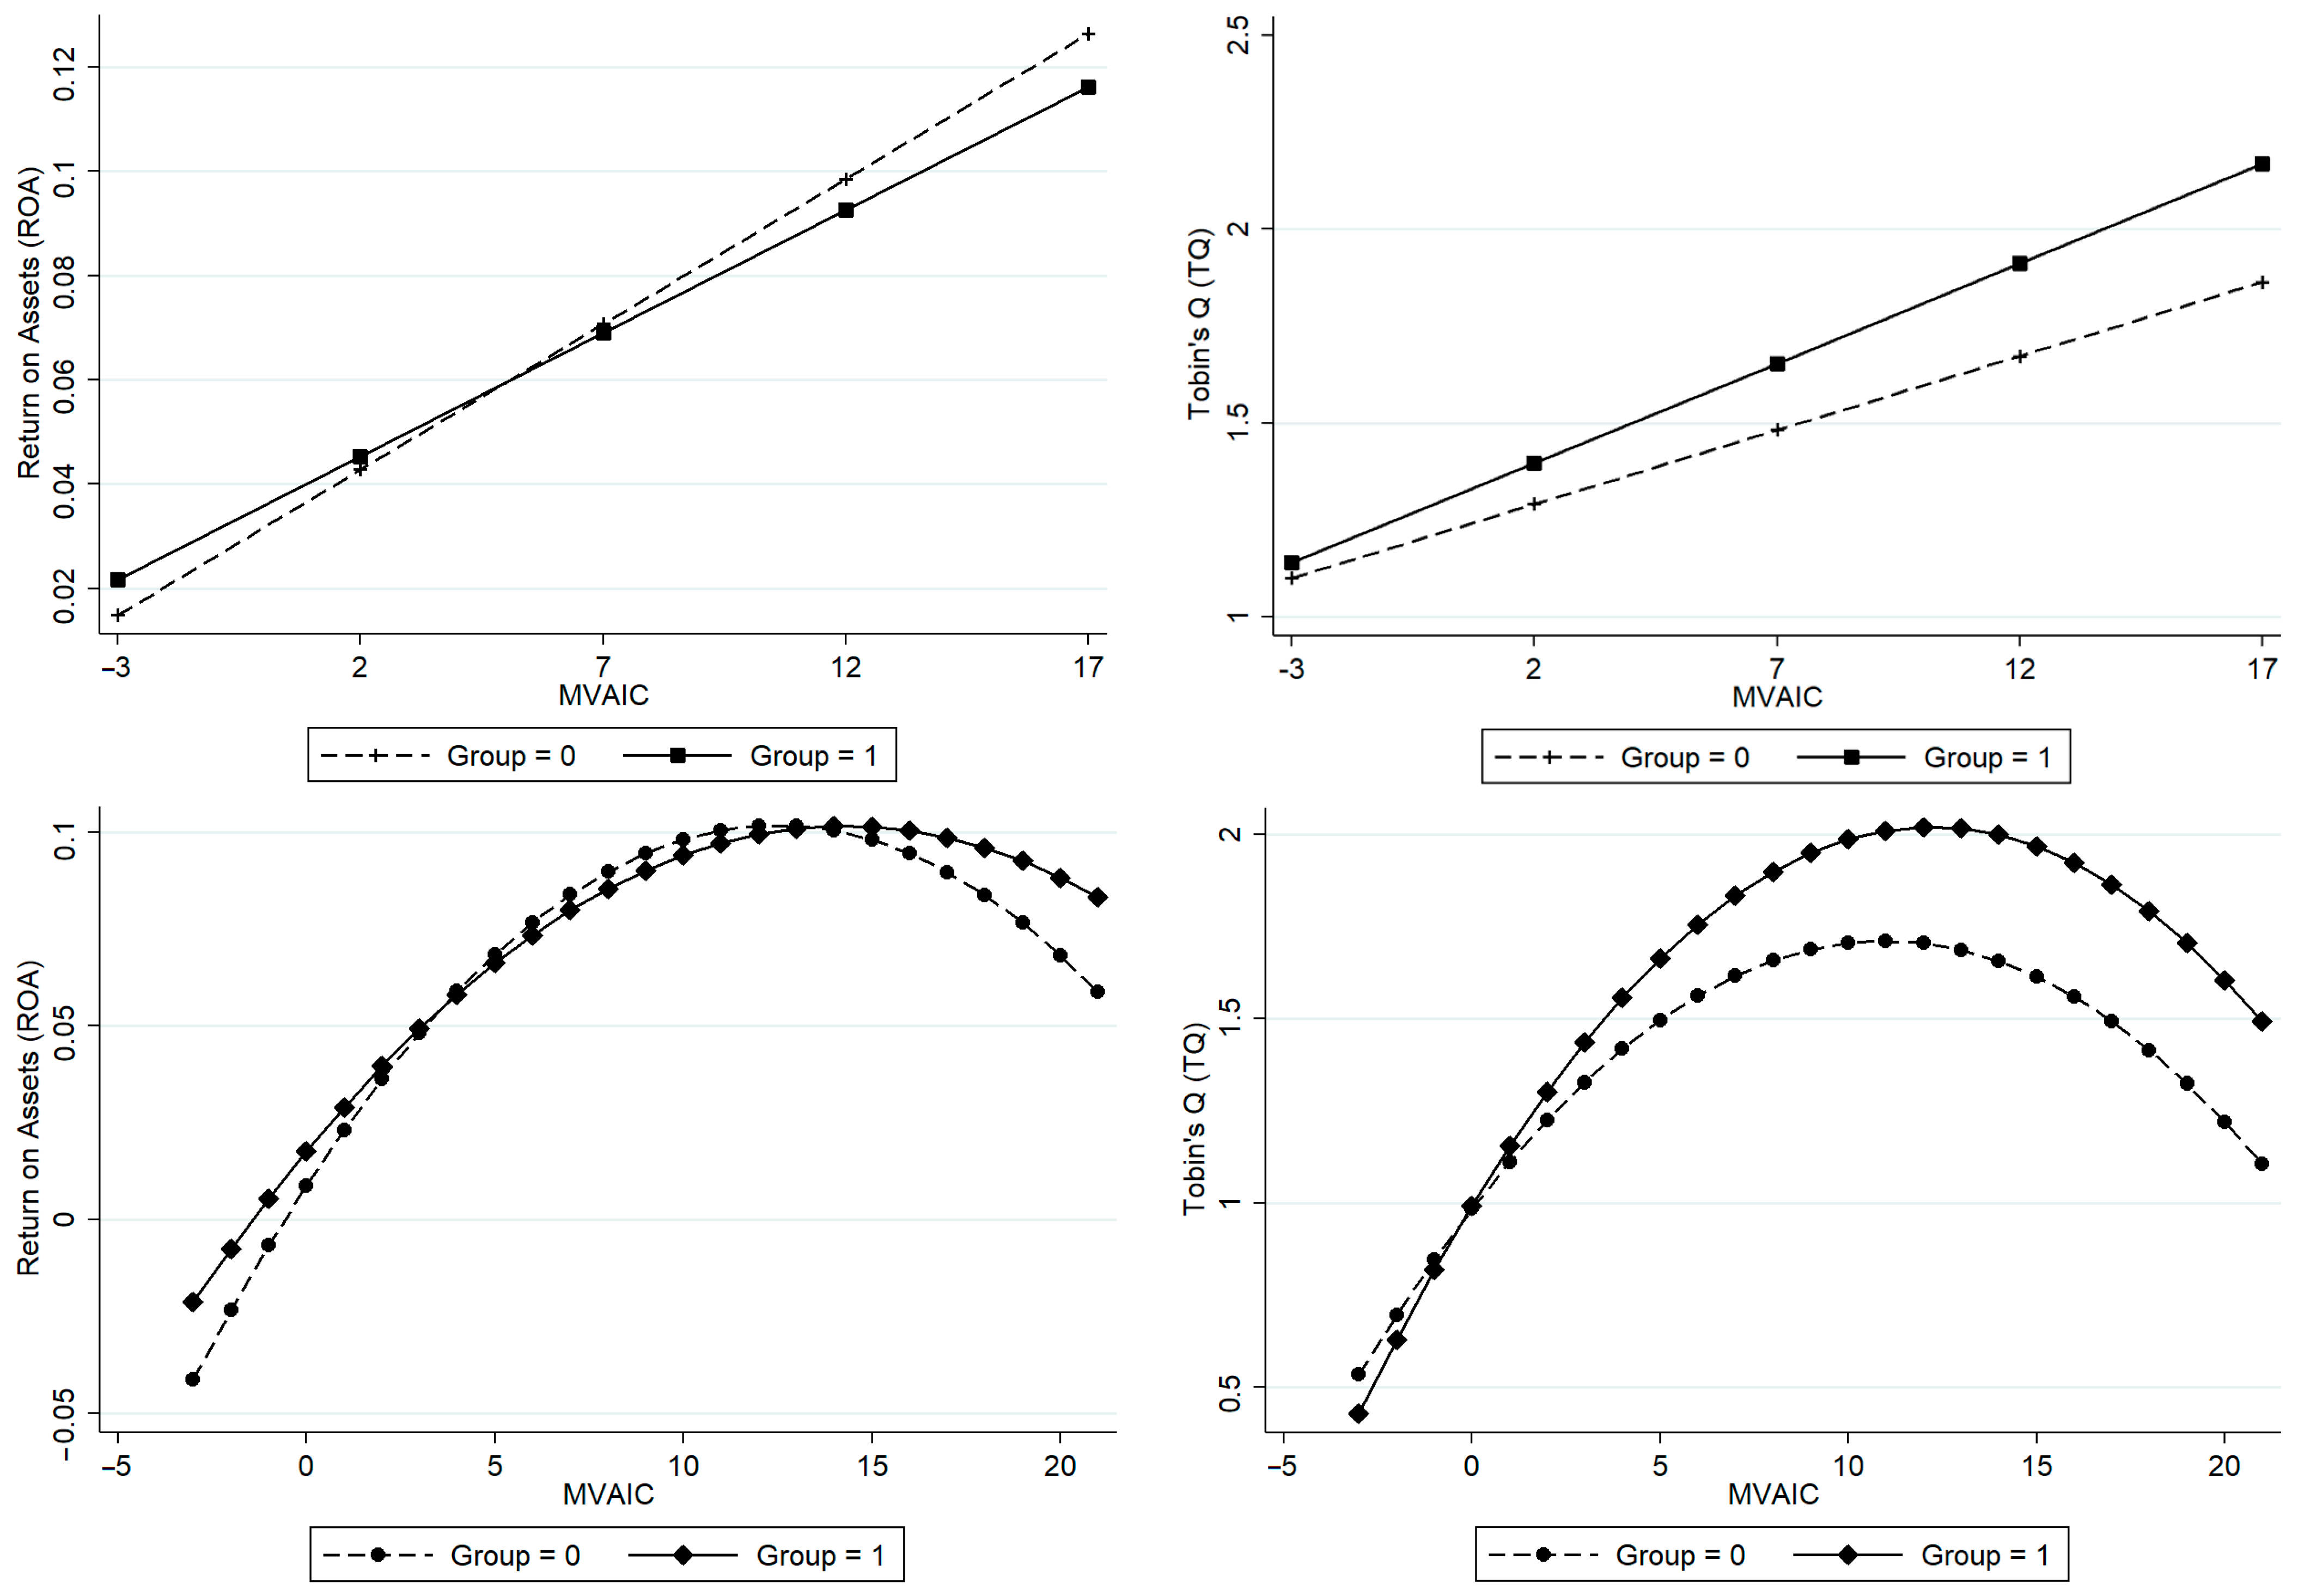
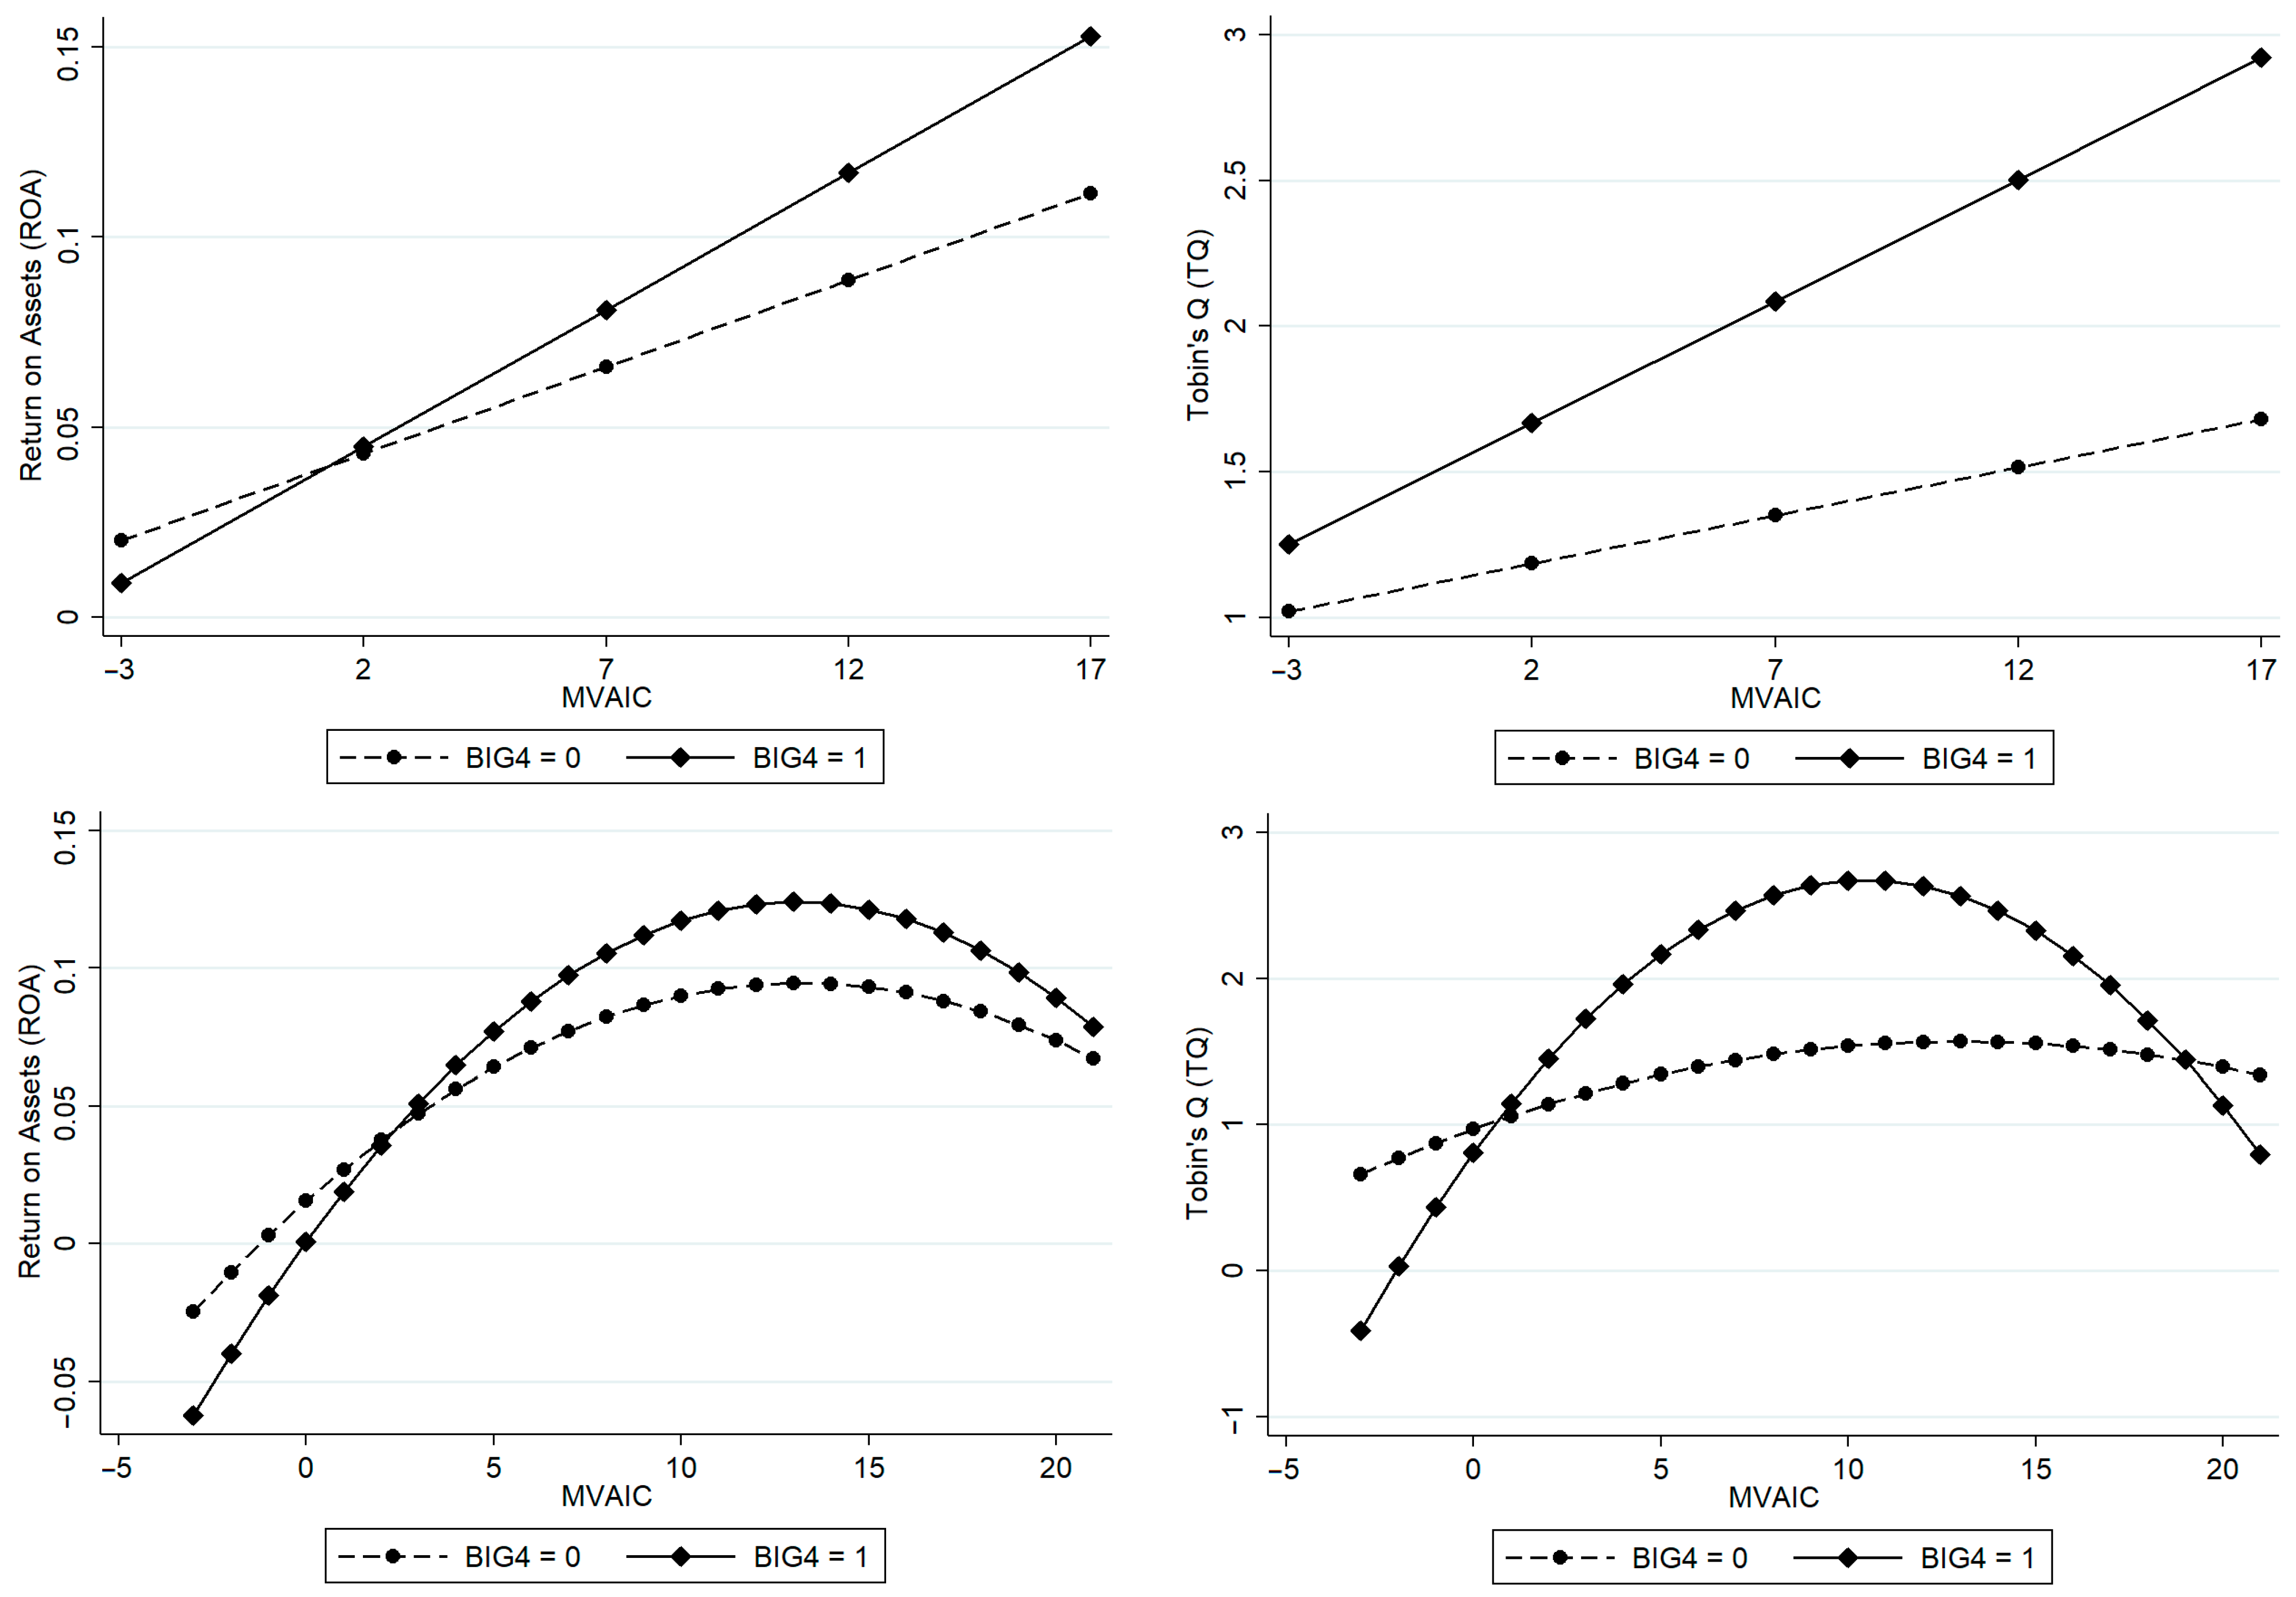
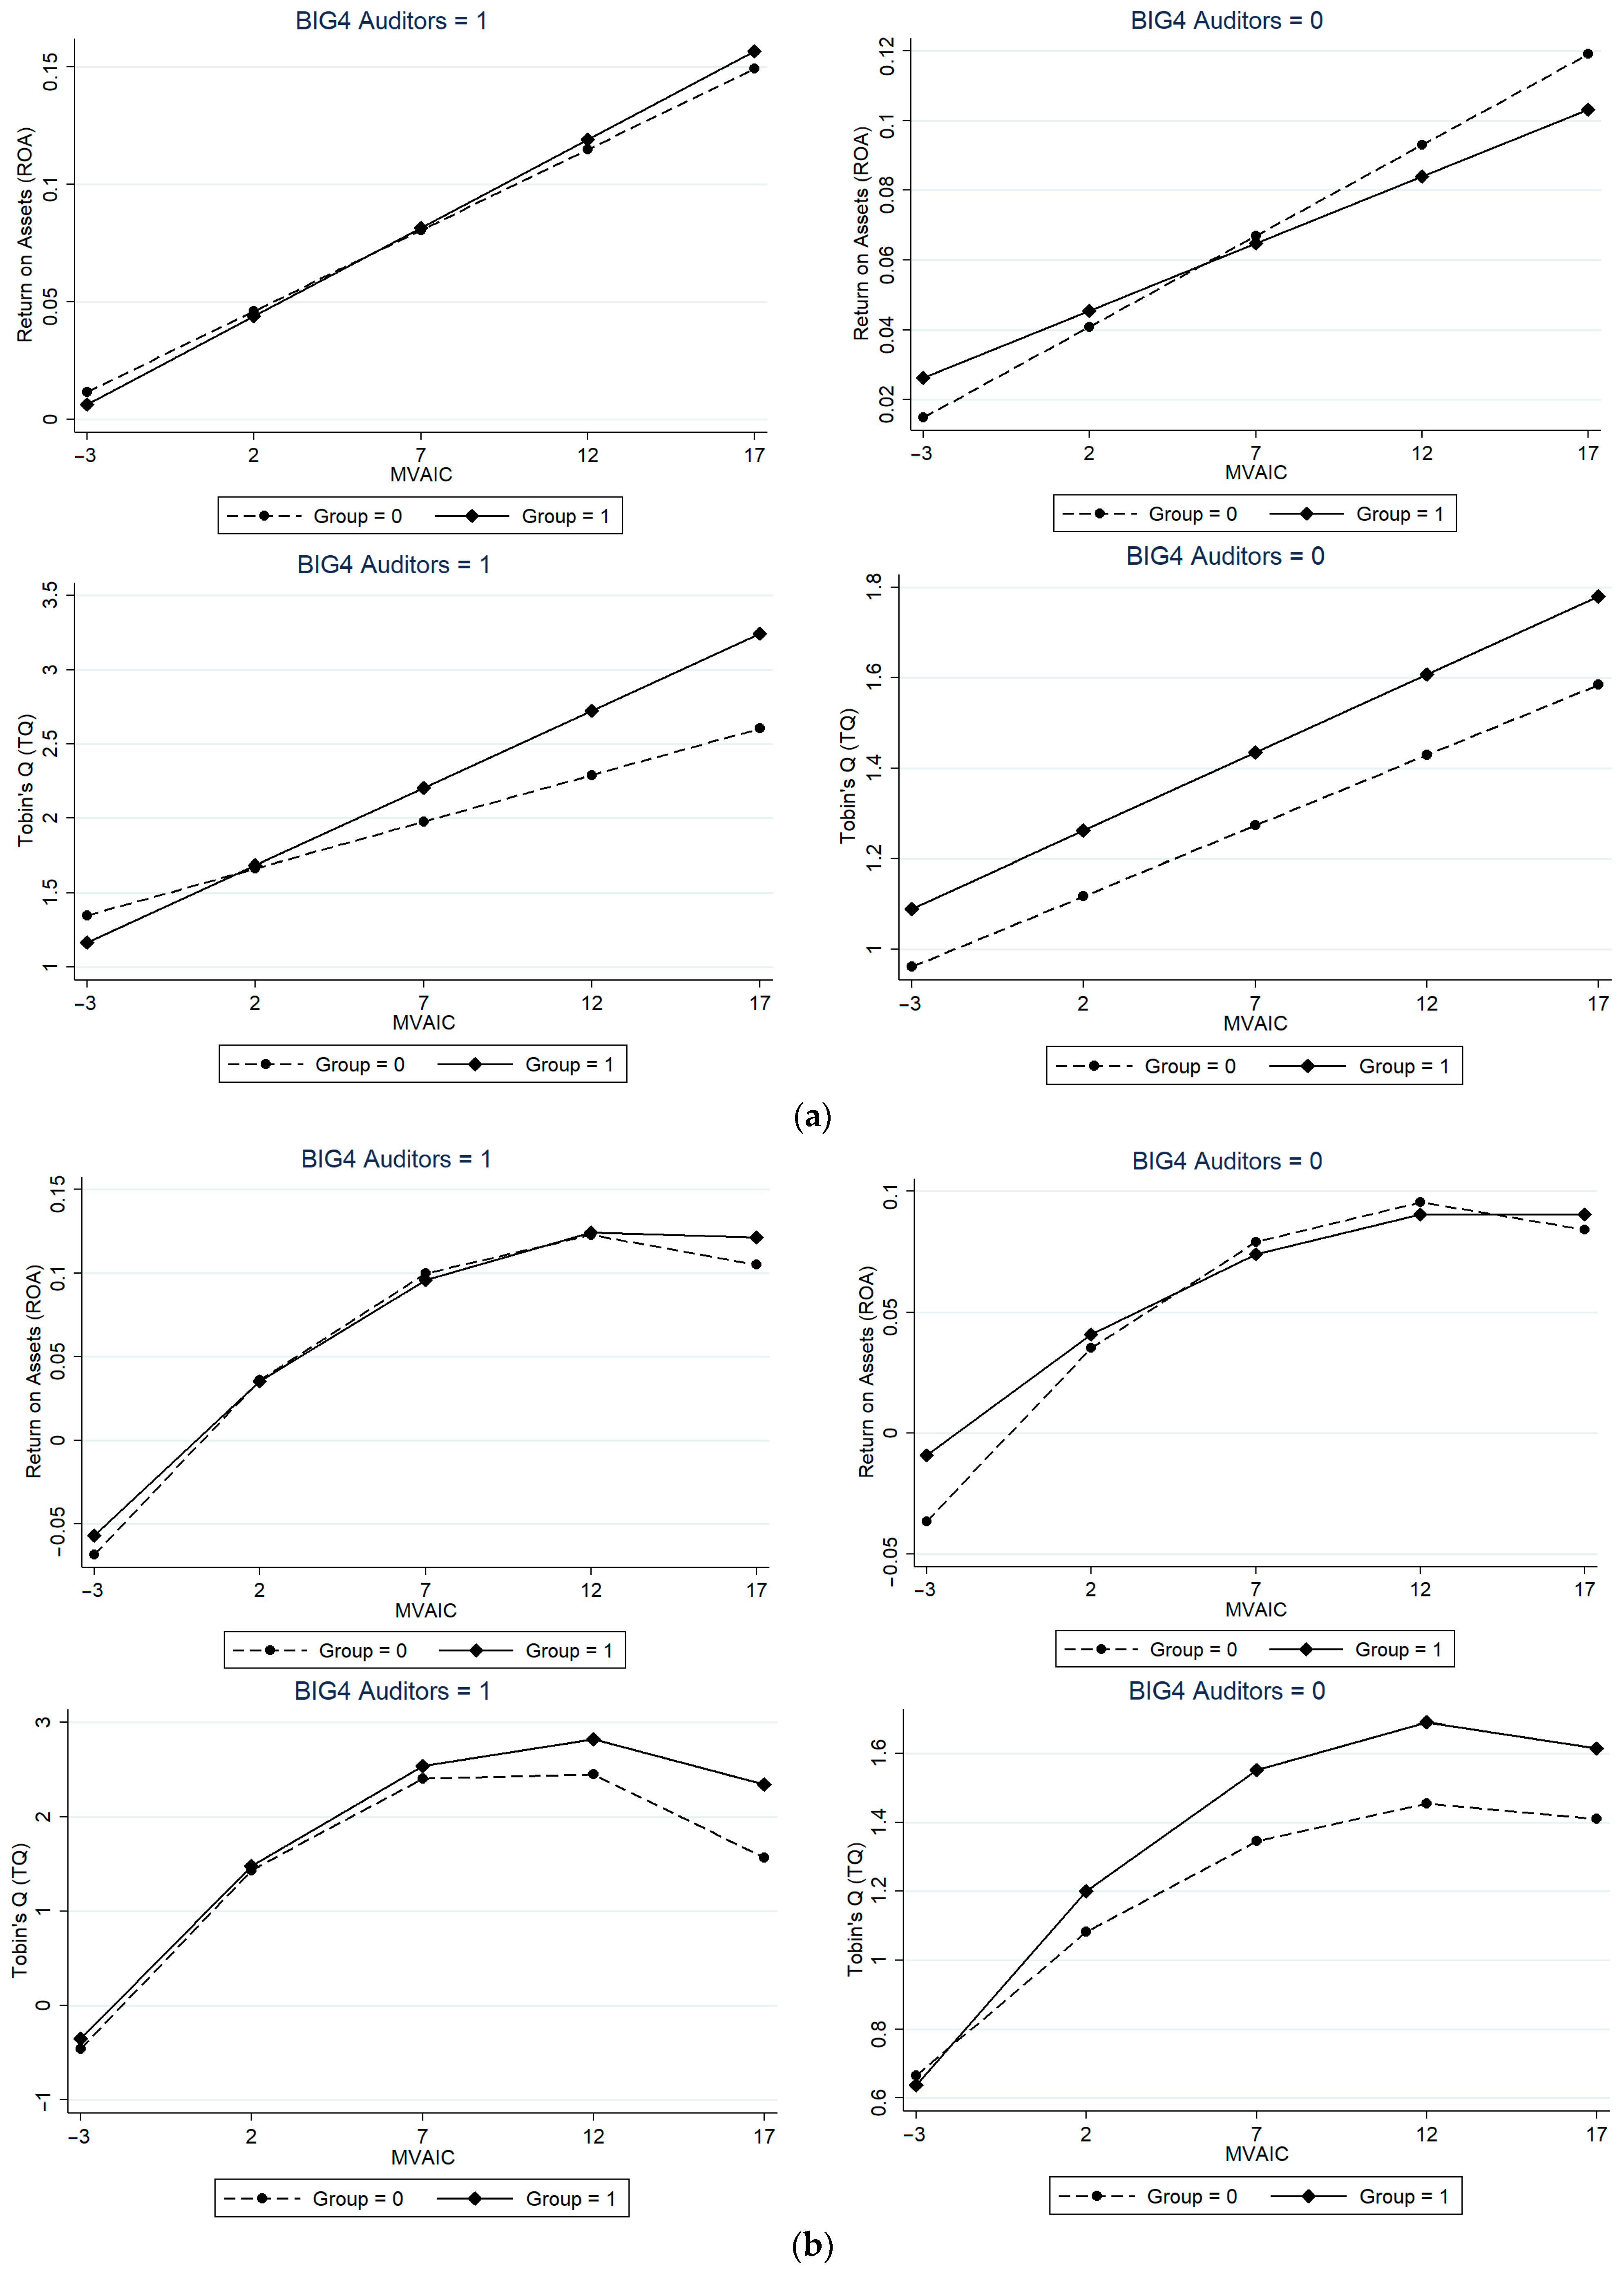
Our results claim that IC improves the performance of Indian firms and shows a strong moderation effect of BIG4 auditors in both financial and market performance. However, the moderating effect of group affiliation is negative and significant in financial performance, and it asserts that standalone firms enhance their financial performance by using IC compared to affiliated firms. On the contrary, IC improves the market performance of affiliated firms due to the benefits of competitive advantages. However, the particular scenario changes when affiliated firms appoint BIG4 auditors. Along with BIG4 auditors, IC improves the financial and market performance of group-affiliated firms in the Indian context.
Our curvilinear analysis reveals that IC has an inverted U-shaped relationship with FP, indicating that greater IC enhances FP up to a maximum threshold point, but after that, additional investment in IC reduces the FP. Our results validate the effect of “too much of a good thing” and support the earlier literature claiming that investment in IC enhances the FP, as the marginal return from IC investment is higher than the marginal cost in the initial scenario. However, after a certain point (i.e., inflection point), marginal returns gradually decline due to the inefficient management of IC resources, which causes an increment in marginal cost (Xu and Zhang 2021; Xu et al. 2022). Another explanation for this “too much of a good thing” effect aligns with the resource-based theory, which asserts that the IC and FP relationship depends on the efficient use of intangible resources. Based on this theoretical framework, the inverted U-shaped relationship between IC and FP indicates that IC’s efficiency initially positively impacts FP. However, beyond a certain threshold limit, the inefficiencies from IC investments undermine corporate performance due to the elevated associated costs (Yao et al. 2019). Moreover, the findings claim that exceeding the IC investment beyond the inflection point can produce undesired outcomes due to economic disadvantages (Poole and Van de Ven 1989; Pierce and Aguinis 2013; Poole and Van de Ven 1989; Pierce and Aguinis 2013). Therefore, organizations need to be very careful in managing their IC while aiming for better FP. The moderation analysis also reveals that BIG4-audited firms establish an inverted U-shaped relationship with FP. On the other hand, group affiliation only positively moderates the curvilinear relationship between IC and financial performance. Thus, our results suggest that management and regulatory bodies need to scrutinize the management of internal resources in affiliated firms that drive FP through IC.
In a nutshell, this study has made some unique positioning in the IC and FP literature. When the entire business world focuses on intellectual capital, somewhere it ignores incorporating the firm-specific factors that influence the core business decisions. Considering this, this study first examined the relationship between IC and FP and revealed that undoubtedly IC enhances the FP, but there is some extremum point after that additional IC only increases the cost burden of the firm and resultantly reduces the FP. Interestingly, the positive relationship between IC and financial performance is not applicable for group-affiliated firms, indicating that standalone firms perform better using their IC. On the other hand, the role of BIG4 auditors in the Indian context is outstanding, as they help the corporations increase their FP by using the IC. So, the importance of BIG4 auditors in the Indian context is not limited to audit quality only. In addition to these, the business group firms also obtained advantages by appointing the BIG4 firms as their auditor. Earlier, we found that group-affiliated firms are not so effective in managing the IC to attain better performance. However, when they appoint the BIG4 auditors, the IC yields positive outcomes and enhances the FP. Further, this relationship is only significant in linear models, not curvilinear ones. Thus, we suggest that group-affiliated firms should optimize their IC resources and appoint the BIG4 auditing firms to generate superior firm performance.
This study has made the following contributions to the existing literature. First, our research examines both linear and curvilinear relationships between IC and firm performance, while most of the prior work only considered the linear approach (Alipour 2012; Bayraktaroglu et al. 2019; Clarke et al. 2011; Hejazi et al. 2016; Mohapatra et al. 2019; Vishnu and Gupta 2014). Our research strongly argues that investment in IC may not endlessly improve the FP, as the curvilinear relationship shows an inverted U-shaped curve. So, management and regulatory bodies may focus on a balanced point where investing in IC may enhance corporate performance to maximize the FP from their IC investment. Second, this study claims that BIG4 auditors and group affiliation moderate the relationship between IC and firm performance. Apart from these, the moderated moderation effect of both BIG4 auditors and group affiliation positively impacts FP. Therefore, management and policymakers may use those factors to optimize the investment in IC. Third, our results can be used as a guiding mechanism to manage the IC efficiently to yield better firm performance. This study may guide future research by helping to theorize and hypothesize the curvilinear relationship between IC and financial performance.
This study also presented policy recommendations for successfully harnessing intellectual capital (IC) to boost corporate performance. First, this study suggests that policymakers may promote the implementation of IC in the workplace and facilitate the development of a culture that values and exchanges knowledge regarding the significance of IC. Policymakers may consider implementing some guidelines for IC investment, given that our findings demonstrate that its benefits extend beyond knowledge-based sectors and effectively improve the FP of non-financial companies. Second, due to the inverted U-shaped relationship between IC and FP, regulatory bodies should refrain from mandating a minimum level of IC investment. Instead, they may advise companies to assess the efficiency of their intangible resources in order to determine the appropriate level of IC investment, which would improve their FP and prevent unnecessary investments in IC beyond a certain point or inflection point. Third, managers establish corporate policies that enable them to assess the marginal cost and marginal benefits of IC investments in order to optimize the utilization of IC resources and prevent excessive expenditures on intangible assets. Fourth, both management and regulatory bodies may acknowledge the importance of group affiliation and BIG4 auditors while framing the policies, as their presence significantly impacts the IC and FP relationship. In addition to these, the findings may imply that policymakers should promote a corporate environment in which Indian firms support human capital, corporate stakeholder connections, and structural viability in order to improve FP. Furthermore, policymakers should establish a forum for collaboration between academia and industry practitioners to promote the IC, allowing its benefits and impact on FP to be addressed and managed efficiently.
In addition to this study’s contribution to the existing body of knowledge, it has some limitations that can serve as avenues for future research. The present study measures the performance using fundamental financial performance variables and does not consider the financial risk while accessing the FP variables. However, future studies can consider the FP variables along with market risk, including systematic and idiosyncratic risk, to obtain better clarity on the impact of IC on FP and financial risk. This study finds that group-affiliated firms improve their performance with the help of IC when they appoint BIG4 auditors. Thus, future studies can explore this in more detail to identify the factors that drive these positive outcomes in the Indian context. Similarly, there is a scope for similar studies in other emerging economies, as we have limited the scope to the Indian context only. Since we have considered non-financial firms as our sample, future studies can be undertaken to compare financial and non-financial companies, which can provide an additional contribution.

Supplementary Materials

The following supporting information can be downloaded at: https://www.mdpi.com/article/10.3390/ijfs12010029/s1, Table S1: U and inverted U test; Table S2: Simple slope test; Table S3: Slope difference test.

Author Contributions

Conceptualization, S.M. and J.K.P.; Methodology, S.M.; Formal analysis, S.M.; Data Curation, S.M.; Writing—Original Draft Preparation, S.M.; Writing—Review and Editing, J.K.P.; Supervision, J.K.P. All authors have read and agreed to the published version of the manuscript.

Funding

This research received no external funding.

Data Availability Statement

The data used in this research will be available upon request.

Conflicts of Interest

The authors declare no conflicts of interest.

Appendix A

Table A1. Description of Variables.
Name of VariableShort FormRoleMeasurement
Tobin’s QTQDependentMarket value of total assets divided by the book value of total assets
Return on AssetsROADependentROA as net income divided by average total assets
Modified Value-Added Intellectual CoefficientMVAICIndependentMVAIC is an extension of Pulic (1998) model—It has added an extra component, “Relational Capital Efficiency”, for measuring the intellectual capital
Presence of Big 4 AuditorBIG4ControlDummy variable “1” if auditor belongs to BIG4 auditing firms and “0” otherwise
Firm AgeFirm AgeControlContinuous variable begins from the firm’s date of incorporation
LeverageLeverageControlRatio of total debt to total assets
Negative EarningsNEControlDummy variable “1” if a firm has incurred loss in previous year and “0” otherwise.
Tax AvoidanceETRControlTotal income tax expenses divided by profit before tax
Sales GrowthSGROWControlDifference between sales in current period and previous period divided by previous year sales
Group AffiliationGroupControlDummy variable “1” if the firm belongs to any business group and “0” otherwise

Note

1
Ind AS 1 and Ind AS 110 issued by the Ministry of Corporate Affairs, Government of India. https://www.mca.gov.in/content/mca/global/en/acts-rules/ebooks/accounting-standards.html (accessed on 3 March 2024).

References

  1. Abeysekera, Indra, and James Guthrie. 2005. An Empirical Investigation of Annual Reporting Trends of Intellectual Capital in Sri Lanka. Critical Perspectives on Accounting 16: 151–63. [Google Scholar] [CrossRef]
  2. Al-ahdal, Waleed M., and Hafiza Aishah Hashim. 2022. Impact of Audit Committee Characteristics and External Audit Quality on Firm Performance: Evidence from India. Corporate Governance 22: 424–45. [Google Scholar] [CrossRef]
  3. Alipour, Mohammad. 2012. The Effect of Intellectual Capital on Firm Performance: An Investigation of Iran Insurance Companies. Measuring Business Excellence 16: 53–66. [Google Scholar] [CrossRef]
  4. Andersson, Tord, Colin Haslam, and Edward Lee. 2019. Financialized Accounts: Restructuring and Return on Capital Employed in the S&P 500. Accounting Forum 30: 21–41. [Google Scholar]
  5. Asif, Jawad, Irene Wei, Kiong Ting, and Qian Long Kweh. 2020. Intellectual Capital Investment and Firm Performance of the Malaysian Energy Sector: A New Perspective From a Nonlinearity Test. Energy Research Letters 1: 1–4. [Google Scholar] [CrossRef]
  6. Badriyah, Nurul, Ria Nelly Sari, and Yesi Mutia Basri. 2015. The Effect of Corporate Governance and Firm Characteristics on Firm Performance and Risk Management as an Intervening Variable. Procedia Economics and Finance 31: 868–75. [Google Scholar] [CrossRef]
  7. Bamiatzi, Vassiliki, Salih Tamer Cavusgil, Liza Jabbour, and Rudolf R. Sinkovics. 2014. Does Business Group Affiliation Help Firms Achieve Superior Performance during Industrial Downturns? An Empirical Examination. International Business Review 23: 195–211. [Google Scholar] [CrossRef]
  8. Barney, Jay. 1991. Firm resources and sustained competitive advantage. Journal of Management 17: 99–120. [Google Scholar] [CrossRef]
  9. Bayraktaroglu, Ayse Elvan, Fethi Calisir, and Murat Baskak. 2019. Intellectual Capital and Firm Performance: An Extended VAIC Model. Journal of Intellectual Capital 20: 406–25. [Google Scholar] [CrossRef]
  10. Beisland, Leif Atle, Roy Mersland, and Øystein Strøm. 2018. Use of Big Four Auditors and Fund Raising: Evidence from Developing and Emerging Markets. International Journal of Emerging Markets 13: 371–90. [Google Scholar] [CrossRef]
  11. Bennouri, Moez, Tawhid Chtioui, Haithem Nagati, and Mehdi Nekhili. 2018. Female Board Directorship and Firm Performance: What Really Matters? Journal of Banking & Finance 88: 267–91. [Google Scholar]
  12. Berzkalne, Irina, and Elvira Zelgalve. 2014. Intellectual Capital and Company Value. Procedia—Social and Behavioral Sciences 110: 887–96. [Google Scholar] [CrossRef]
  13. Bontis, Nick. 2001. Assessing Knowledge Assets: A Review of the Models Used to Measure Intellectual Capital. International Journal of Management Reviews 3: 41–60. [Google Scholar] [CrossRef]
  14. Bozbura, F. Tunc. 2004. Measurement and Application of Intellectual Capital in Turkey. The Learning Organization 11: 357–67. [Google Scholar] [CrossRef]
  15. Bozzolan, Saverio, Philip O’Regan, and Federica Ricceri. 2006. Intellectual Capital Disclosure (ICD): A Comparison of Italy and the UK. Journal of Human Resource Costing & Accounting 10: 92–113. [Google Scholar] [CrossRef]
  16. Cerbioni, Fabrizio, and Antonio Parbonetti. 2007. Exploring the Effects of Corporate Governance on Intellectual Capital Disclosure: An Analysis of European Biotechnology Companies. European Accounting Review 16: 791–826. [Google Scholar] [CrossRef]
  17. Chow, Chee W., and Adrian Wong-Boren. 1987. Voluntary Financial Disclosure by Mexican Corporations. The Accounting Review 62: 533–41. [Google Scholar]
  18. Claessens, Stijn, Joseph P. H. Fan, and Larry H. P. Lang. 2006. The Benefits and Costs of Group Affiliation: Evidence from East Asia. Emerging Markets Review 7: 1–26. [Google Scholar] [CrossRef]
  19. Clarke, Martin, Dyna Seng, and Rosalind H. Whiting. 2011. Intellectual Capital and Firm Performance in Australia. Journal of Intellectual Capital 12: 505–30. [Google Scholar] [CrossRef]
  20. Dawson, Jeremy F., and Andreas W. Richter. 2006. Probing Three-Way Interactions in Moderated Multiple Regression: Development and Application of a Slope Difference Test. Journal of Applied Psychology 91: 917–26. [Google Scholar] [CrossRef]
  21. DeAngelo, Linda Elizabeth. 1981. Auditor Size and Audit Quality. Journal of Accounting and Economics 3: 183–99. [Google Scholar] [CrossRef]
  22. Dezoort, F. Todd, Richard W. Houston, and Michael F. Peters. 2001. The Impact of Internal Auditor Compensation and Role on External Auditors’ Planning Judgments and Decisions. Contemporary Accounting Research 18: 257–81. [Google Scholar] [CrossRef]
  23. Drucker, Peter. F. 1993. The Rise of the Knowledge Society. The Wilson Quarterly 17: 52–72. [Google Scholar]
  24. Egbu, Charles O. 2004. Managing Knowledge and Intellectual Capital for Improved Organizational Innovations in the Construction Industry: An Examination of Critical Success Factors. Engineering, Construction and Architectural Management 11: 301–15. [Google Scholar] [CrossRef]
  25. Fan, Joseph P. H., and T. J. Wong. 2005. Do External Auditors Perform a Corporate Governance Role in Emerging Markets? Evidence from East Asia. Journal of Accounting Research 43: 35–72. [Google Scholar] [CrossRef]
  26. Farooq, Omar, and Youssef El Kacemi. 2011. Ownership Concentration, Choice of Auditors, and Firm Performance: Evidence from the MENA Region. Review of Middle East Economics and Finance 7: 1–17. [Google Scholar] [CrossRef]
  27. Freeman, R. Edward. 1984. Strategic Management: A Stakeholder Perspective. Hoboken: Prentice Hall. [Google Scholar]
  28. Freeman, R. Edward, and John Mcvea. 2005. A Stakeholder Approach to Strategic Management. In The Blackwell Handbook of Strategic Management. Edited by Michael A. Hitt, R. Edward Freeman and Jeffrey S. Harrison. Hoboken: Wiley, pp. 183–201. [Google Scholar]
  29. Fullana, Olga, Alba M. Priego, and David Toscano. 2022. The role of financial performance of Eurostoxx listed hotel companies in determining CEO compensation. International Journal of Hospitality Management 104: 103242. [Google Scholar] [CrossRef]
  30. Grassmann, Michael. 2021. The Relationship between Corporate Social Responsibility Expenditures and Firm Value: The Moderating Role of Integrated Reporting. Journal of Cleaner Production 285: 124840. [Google Scholar] [CrossRef]
  31. Guthrie, James, Richard Petty, Kittiya Yongvanich, and Federica Ricceri. 2004. Using content analysis as a research method to inquire into intellectual capital reporting. Journal of Intellectual Capital 5: 282–93. [Google Scholar] [CrossRef]
  32. Haans, Richard F. J., Constant Pieters, and Zi Lin He. 2016. Thinking about U: Theorizing and Testing U- and Inverted U-Shaped Relationships in Strategy Research. Strategic Management Journal 37: 1177–95. [Google Scholar] [CrossRef]
  33. Hassoun, Amira Ben, and Chaker Aloui. 2017. The complementary/substitution effects of post-privatization corporate governance mechanisms on firm performance in selected MENA countries. Journal of Accounting in Emerging Economies 7: 399–420. [Google Scholar] [CrossRef]
  34. Hatane, Saarce Elsye, Jefferson Clarenzo Diandra, Josua Tarigan, and Ferry Jie. 2021. Voluntary intellectual capital disclosure and earnings forecast in Indonesia–Malaysia–Thailand growth triangle’s pharmaceuticals sector. International Journal of Emerging Markets 18: 1–21. [Google Scholar] [CrossRef]
  35. Hayes, Andrew F. 2017. Introduction to Mediation, Moderation, and Conditional Process Analysis: A Regression-Based Approach. New York: Guilford Publications. [Google Scholar]
  36. Hejazi, Rezvan, Mehrdad Ghanbari, and Mohammad Alipour. 2016. Intellectual, Human and Structural Capital Effects on Firm Performance as Measured by Tobin’s Q. Knowledge and Process Management 23: 259–73. [Google Scholar] [CrossRef]
  37. Hossain, Mohammad, M. Hector B. Perera, and Asheq Razaur Rahman. 1995. Voluntary Disclosure in the Annual Reports of New Zealand Companies. Journal of International Financial Management & Accounting 6: 69–87. [Google Scholar]
  38. Hsieh, Tsun Jui, Ryh Song Yeh, and Yu Ju Chen. 2010. Business Group Characteristics and Affiliated Firm Innovation: The Case of Taiwan. Industrial Marketing Management 39: 560–70. [Google Scholar] [CrossRef]
  39. Jermias, Johnny, and Lindawati Gani. 2014. The Impact of Board Capital and Board Characteristics on Firm Performance. The British Accounting Review 46: 135–53. [Google Scholar] [CrossRef]
  40. Jo, Hoje, Hakkon Kim, and Kwangwoo Park. 2015. Corporate Environmental Responsibility and Firm Performance in the Financial Services Sector. Journal of Business Ethics 131: 257–84. [Google Scholar] [CrossRef]
  41. Johl, Shireenjit K., Arifur Khan, Nava Subramaniam, and Mohammad Muttakin. 2016. Business Group Affiliation, Board Quality and Audit Pricing Behavior: Evidence from Indian Companies. International Journal of Auditing 20: 133–48. [Google Scholar] [CrossRef]
  42. Juma, Norma, and G. Tyge Payne. 2004. Intellectual capital and performance of new venture high-tech firms. International Journal of Innovation Management 08: 297–318. [Google Scholar] [CrossRef]
  43. Kamath, Bharathi. 2008. Intellectual Capital Disclosure in India: Content Analysis of ‘TecK’ Firms. Journal of Human Resource Costing & Accounting 12: 213–24. [Google Scholar]
  44. Kim, Jeong Bon, and Cheong H. Yi. 2006. Ownership Structure, Business Group Affiliation, Listing Status, and Earnings Management: Evidence from Korea. Contemporary Accounting Research 23: 427–64. [Google Scholar] [CrossRef]
  45. Kuknor, Sunaina, and Shubhasheesh Bhattacharya. 2021. Exploring Organizational Inclusion and Inclusive Leadership in Indian Companies. European Business Review 33: 450–64. [Google Scholar] [CrossRef]
  46. Kumar, Nishant. 2013. The Importance of Human Capital in the Early Internationalisation of Indian Knowledge-Intensive Service Firms. International Journal of Technological Learning, Innovation and Development 6: 21–41. [Google Scholar] [CrossRef]
  47. Lee, Hsien Li, and Hua Lee. 2013. Do Big 4 Audit Firms Improve the Value Relevance of Earnings and Equity? Managerial Auditing Journal 28: 628–46. [Google Scholar] [CrossRef]
  48. Maji, Santi Gopal, and Mitra Goswami. 2016. Intellectual Capital and Firm Performance in Emerging Economies: The Case of India. Review of International Business and Strategy 26: 410–30. [Google Scholar] [CrossRef]
  49. Margolis, Joshua Daniel, and James P. Walsh. 2001. People and Profits?: The Search for a Link between a Company’s Social and Financial Performance, 1st ed. New York: Psychology Press. [Google Scholar]
  50. Marr, Bernard, Dina Gray, and Andy Neely. 2003. Why Do Firms Measure Their Intellectual Capital? Journal of Intellectual Capital 4: 441–64. [Google Scholar] [CrossRef]
  51. Mohapatra, Malaya Ranjan, and Chandra Sekhar Mishra. 2021. Impact of Multi-Industry Directorship on Firm Performance: A Study with Reference to India. Accounting Research Journal 34: 614–36. [Google Scholar] [CrossRef]
  52. Mohapatra, Suryanarayan, Sangram Keshari Jena, Amarnath Mitra, and Aviral Kumar Tiwari. 2019. Intellectual Capital and Firm Performance: Evidence from Indian Banking Sector. Applied Economics 51: 6054–67. [Google Scholar] [CrossRef]
  53. Nadeem, Muhammad, Christopher Gan, and Cuong Nguyen. 2017. Does Intellectual Capital Efficiency Improve Firm Performance in BRICS Economies? A Dynamic Panel Estimation. Measuring Business Excellence 21: 65–85. [Google Scholar] [CrossRef]
  54. Nazari, Jamal A., and Irene M. Herremans. 2007. Extended VAIC model: Measuring intellectual capital components. Journal of Intellectual Capital 8: 595–609. [Google Scholar] [CrossRef]
  55. Ocak, Murat, Ali Kablan, and Günay Deniz Dursun. 2021. Does Auditing Multiple Clients Affiliated with the Same Business Group Reduce Audit Quality? Evidence from an Emerging Market. Borsa Istanbul Review 21: 1–22. [Google Scholar] [CrossRef]
  56. Oppong, Godfred Kesse, and J. K. Pattanayak. 2019. Does Investing in Intellectual Capital Improve Productivity? Panel Evidence from Commercial Banks in India. Borsa Istanbul Review 19: 219–27. [Google Scholar] [CrossRef]
  57. Ordóñez de Pablos, Patricia. 2003. Intellectual capital reporting in Spain: A comparative view. Journal of Intellectual Capital 4: 61–81. [Google Scholar] [CrossRef]
  58. Pal, Karam, and Sushila Soriya. 2012. IC performance of Indian pharmaceutical and textile industry. Journal of Intellectual Capital 13: 120–37. [Google Scholar] [CrossRef]
  59. Pedrini, Matteo. 2007. Human capital convergences in intellectual capital and sustainability reports. Journal of Intellectual Capital 8: 346–66. [Google Scholar] [CrossRef]
  60. Pierce, Jason R., and Herman Aguinis. 2013. The too-much-of-a-good-thing effect in management. Journal of Management 39: 313–38. [Google Scholar] [CrossRef]
  61. Poole, Marshall Scott, and Andrew H. Van de Ven. 1989. Using paradox to build management and organization theories. Academy of Management Review 14: 562–78. [Google Scholar] [CrossRef]
  62. Popli, Manish, and Radha Mukesh Ladkani. 2020. Value Constraining or Value Enabling? The Impact of Business Group Affiliation on Post-Acquisition Performance by Emerging Market Firms. Management and Organization Review 16: 261–91. [Google Scholar] [CrossRef]
  63. Pulic, Ante. 1998. Measuring the Performance of Intellectual Potential in the Knowledge Economy. Paper presented at 19th Annual National Business Conference, Hamilton, ONT, Canada, January 21–23. [Google Scholar]
  64. Purkayastha, Anish, Chinmay Pattnaik, and Atul Arun Pathak. 2022. Agency Conflict in Diversified Business Groups and Performance of Affiliated Firms in India: Contingent Effect of External Constraint and Internal Governance. European Management Journal 40: 283–94. [Google Scholar] [CrossRef]
  65. Rahman, Md Musfiqur, Mohammad Rajon Meah, and Nasir Uddin Chaudhory. 2019. The Impact of Audit Characteristics on Firm Performance: An Empirical Study from an Emerging Economy. The Journal of Asian Finance, Economics and Business 6: 59–69. [Google Scholar] [CrossRef]
  66. Ramezan, Majid. 2011. Intellectual Capital and Organizational Organic Structure in Knowledge Society: How Are These Concepts Related? International Journal of Information Management 31: 88–95. [Google Scholar] [CrossRef]
  67. Ramírez, Yolanda, and Ángel Tejada Ponce. 2013. Cost–benefit analysis of intellectual capital disclosure: University stakeholders’ view: Análisis coste-beneficio de la divulgación de información sobre capital intelectual: Visión de los stakeholders universitarios. Revista de Contabilidad-Spanish Accounting Review 16: 106–17. [Google Scholar] [CrossRef]
  68. Scafarto, Vincenzo, Federica Ricci, and Francesco Scafarto. 2016. Intellectual Capital and Firm Performance in the Global Agribusiness Industry: The Moderating Role of Human Capital. Journal of Intellectual Capital 17: 530–52. [Google Scholar] [CrossRef]
  69. Singh, Manohar, Ali Nejadmalayeri, and Ike Mathur. 2007. Performance Impact of Business Group Affiliation: An Analysis of the Diversification-Performance Link in a Developing Economy. Journal of Business Research 60: 339–47. [Google Scholar] [CrossRef]
  70. Stewart, Thomas A. 1997. Intellectual Capital: The New Wealth of Organizations. New York: Doubleday. [Google Scholar]
  71. Sun, Wenbin, Shanji Yao, and Rahul Govind. 2019. Reexamining Corporate Social Responsibility and Shareholder Value: The Inverted-U-Shaped Relationship and the Moderation of Marketing Capability. Journal of Business Ethics 160: 1001–17. [Google Scholar] [CrossRef]
  72. Sveiby, Karl Erik. 1997. The New Organizational Wealth: Managing & Measuring Knowledge-Based Assets. New York: Berrett-Koehlen. [Google Scholar]
  73. Tan, Hong Pew, David Plowman, and Phil Hancock. 2008. The Evolving Research on Intellectual Capital. Journal of Intellectual Capital 9: 585–608. [Google Scholar] [CrossRef]
  74. Terlaak, Ann, Seonghoon Kim, and Taewoo Roh. 2018. Not Good, Not Bad: The Effect of Family Control on Environmental Performance Disclosure by Business Group Firms. Journal of Business Ethics 153: 977–96. [Google Scholar] [CrossRef]
  75. Tirumalsety, Revendranath, and Anjula Gurtoo. 2021. Financial Sources, Capital Structure and Performance of Social Enterprises: Empirical Evidence from India. Journal of Sustainable Finance & Investment 11: 27–46. [Google Scholar]
  76. Trumpp, Christoph, and Thomas Guenther. 2017. Too Little or Too Much? Exploring U-Shaped Relationships between Corporate Environmental Performance and Corporate Financial Performance. Business Strategy and the Environment 26: 49–68. [Google Scholar] [CrossRef]
  77. Ulum, Ihyaul, Imam Ghozali, and Agus Purwanto. 2014. Intellectual capital performance of Indonesian banking sector: A modified VAIC (M-VAIC) perspective. International Journal of Finance & Accounting 6: 103–23. [Google Scholar]
  78. Vishnu, Sriranga, and Vijay Kumar Gupta. 2014. Intellectual Capital and Performance of Pharmaceutical Firms in India. Journal of Intellectual Capital 15: 83–99. [Google Scholar] [CrossRef]
  79. Wang, Jui Chi. 2008. Investigating Market Value and Intellectual Capital for S&P 500. Journal of Intellectual Capital 9: 546–63. [Google Scholar]
  80. Wernerfelt, Birger. 1984. A Resource-Based View of the Firm. Strategic Management Journal 5: 171–80. [Google Scholar] [CrossRef]
  81. Whiting, Rosalind H., and James Woodcock. 2011. Firm Characteristics and Intellectual Capital Disclosure by Australian Companies. Journal of Human Resource Costing & Accounting 15: 102–26. [Google Scholar]
  82. Xu, Jian, and Jingsuo Li. 2022. The Interrelationship between Intellectual Capital and Firm Performance: Evidence from China’s Manufacturing Sector. Journal of Intellectual Capital 23: 313–41. [Google Scholar] [CrossRef]
  83. Xu, Jian, and Yi Zhang. 2021. Exploring the Nonlinear Effect of Intellectual Capital on Financial Performance: Evidence from Listed Shipping Companies in China. Complexity 2021: 9004907. [Google Scholar] [CrossRef]
  84. Xu, Jian, Feng Liu, and Jingci Xie. 2022. Is Too Much a Good Thing? The Non-Linear Relationship between Intellectual Capital and Financial Competitiveness in the Chinese Automotive Industry. Journal of Business Economics and Management 23: 773–96. [Google Scholar] [CrossRef]
  85. Yao, Hongxing, Muhammad Haris, Gulzara Tariq, Hafiz Mustansar Javaid, and Muhammad Aamir Shafique Khan. 2019. Intellectual capital, profitability, and productivity: Evidence from Pakistani financial institutions. Sustainability 11: 3842. [Google Scholar] [CrossRef]
  86. Young, Michael N., Mike W. Peng, David Ahlstrom, Garry D. Bruton, and Yi Jiang. 2008. Corporate Governance in Emerging Economies: A Review of the Principal–Principal Perspective. Journal of Management Studies 45: 196–220. [Google Scholar] [CrossRef]
  87. Yu, Hung Chao, Wen Ying Wang, and Chingfu Chang. 2015. The Stock Market Valuation of Intellectual Capital in the IT Industry. Review of Quantitative Finance and Accounting 45: 279–304. [Google Scholar] [CrossRef]
  88. Zack, Michael H. 1999. Developing a Knowledge Strategy. California Management Review 41: 125–45. [Google Scholar] [CrossRef]
  89. Zhang, Yuanyuan, Jiuchang Wei, Yunhao Zhu, and Glory George-Ufot. 2020. Untangling the Relationship between Corporate Environmental Performance and Corporate Financial Performance: The Double-Edged Moderating Effects of Environmental Uncertainty. Journal of Cleaner Production 263: 121584. [Google Scholar] [CrossRef]
Figure 1. Theoretical model.
Ijfs 12 00029 g001
Figure 2. Linear and curvilinear relationship between IC and FP (Hypothesis 1).
Ijfs 12 00029 g002
Figure 3. Moderating effect of group affiliation (Group) in IC and FP (Hypothesis 2).
Ijfs 12 00029 g003
Figure 4. Moderating effect of BIG4 auditors in IC and FP (Hypothesis 3).
Ijfs 12 00029 g004
Figure 5. (a) Moderated moderation of BIG4 auditors on Group affiliation in linear relationship (Hypothesis 4). (b) Moderated moderation of BIG4 auditors on Group affiliation in curvilinear relationship (Hypothesis 4).
Ijfs 12 00029 g005
Table 1. Sample selection and industry-wise classification.
Panel A: Sample sizeN
Number of National Stock Exchange (NSE) listed firms1935
           Less: Financial firms269
           Less: Firms having missing information871
Final sample size795
Panel B: Industry-wise classification (based on first two-digit NIC code) Percent
Accommodation111.38%
Civil engineering313.90%
Computer programming, consultancy, and related activities455.66%
Construction of buildings151.89%
Diversified394.91%
Electricity, gas, steam, and air conditioning supply121.51%
Information and communication273.40%
Manufacture of basic metals607.55%
Manufacture of beverages111.38%
Manufacture of chemicals and chemical products8410.57%
Manufacture of coke and refined petroleum products121.51%
Manufacture of computer, electronic, and optical products121.51%
Manufacture of electrical equipment293.65%
Manufacture of fabricated metal products, except machinery, and equipment111.38%
Manufacture of food products394.91%
Manufacture of machinery and equipment 394.91%
Manufacture of motor vehicles, trailers, and semi-trailers465.79%
Manufacture of other non-metallic mineral products374.65%
Manufacture of paper and paper products151.89%
Manufacture of pharmaceuticals, medicinal chemical, and botanical products546.79%
Manufacture of rubber and plastics products293.65%
Manufacture of textiles445.53%
Manufacture of wearing apparel111.38%
Mining and quarrying121.51%
Other manufacturing162.01%
Transportation and storage192.39%
Wholesale and retail trade354.40%
Total Sample firms795100%
Table 2. Descriptive statistics and correlation coefficients.
VariablesNMeanSD12345678910
1ROA13,5150.0560.0761.000
2TQ13,5151.4421.5210.461 ***1.000
3MVAIC13,5154.2303.1700.276 ***0.074 ***1.000
4Group13,5150.4820.5000.0090.052 ***0.0021.000
5BIG413,5150.3100.4630.137 ***0.232 ***−0.035 ***0.101 ***1.000
6ETR13,5130.7231.2820.030 ***−0.042 ***0.0080.003−0.0071.000
7Firm Age13,51537.73821.5110.0010.060 ***−0.108 ***0.104 ***0.149 ***0.029 ***1.000
8Leverage13,5150.2590.211−0.487 ***−0.261 ***−0.0030.015 *−0.225 ***−0.039 ***−0.103 ***1.000
9SGROW13,5150.1310.3000.239 ***0.060 ***0.190 ***−0.018 **−0.022 **0.041 ***−0.136 ***0.0071.000
10NE13,5150.1250.331−0.420 ***−0.125 ***−0.163 ***−0.011−0.038 ***−0.089 ***0.0120.313 ***−0.087 ***1.000
Note: The table reports the descriptive statistics and pairwise correlation coefficients of all variables used in this study. The symbols *, **, and *** indicate the statistical significance at 10%, 5%, and 1%, respectively.
Table 3. Empirical results of the linear relationship between IC and firm performance.
(1)(2)(3)(4)(5)(6)(7)(8)
VariablesROATQROATQROATQROATQ
MVAIC0.00517 ***0.04458 ***0.00558 ***0.03818 ***0.00456 ***0.03297 ***0.00521 ***0.03115 ***
(0.00023)(0.00403)(0.00032)(0.00533)(0.00024)(0.00405)(0.00035)(0.00566)
MVAIC × Group −0.00085 **0.01318 * −0.00137 ***0.00341
(0.00040)(0.00712) (0.00044)(0.00723)
MVAIC × BIG4 0.00263 ***0.05047 ***0.00167 **0.03168 **
(0.00050)(0.01090)(0.00072)(0.01484)
Group × BIG4 −0.01069 **−0.19789 **
(0.00444)(0.09402)
MVAIC × Group × BIG4 0.00199 **0.03771 *
(0.00098)(0.02146)
Group0.000670.13511 ***0.00424 **0.07975 **0.000770.13699 ***0.00737 ***0.13748 ***
(0.00105)(0.02518)(0.00196)(0.03673)(0.00105)(0.02515)(0.00224)(0.03892)
BIG40.00752 ***0.58997 ***0.00751 ***0.59014 ***−0.003350.38162 ***0.001920.48171 ***
(0.00114)(0.02977)(0.00114)(0.02976)(0.00226)(0.04842)(0.00334)(0.06818)
ETR−0.00205 ***−0.08281 ***−0.00205 ***−0.08280 ***−0.00204 ***−0.08249 ***−0.00206 ***−0.08287 ***
(0.00047)(0.01010)(0.00047)(0.01010)(0.00047)(0.01005)(0.00047)(0.01011)
Firm Age0.00006 **0.001070.00006 **0.001070.00006 **0.00113 *0.00006 **0.00107
(0.00002)(0.00065)(0.00002)(0.00065)(0.00002)(0.00065)(0.00002)(0.00065)
Leverage−0.14919 ***−1.16151 ***−0.14903 ***−1.16405 ***−0.14864 ***−1.15087 ***−0.14830 ***−1.15036 ***
(0.00348)(0.07388)(0.00348)(0.07393)(0.00349)(0.07377)(0.00349)(0.07380)
Sales growth0.04138 ***0.37810 ***0.04142 ***0.37750 ***0.04154 ***0.38121 ***0.04157 ***0.38023 ***
(0.00237)(0.03940)(0.00237)(0.03939)(0.00236)(0.03939)(0.00236)(0.03936)
Negative Earnings−0.05262 ***−0.29340 ***−0.05255 ***−0.29442 ***−0.05264 ***−0.29388 ***−0.05260 ***−0.29529 ***
(0.00209)(0.03145)(0.00209)(0.03151)(0.00209)(0.03141)(0.00209)(0.03152)
Constant0.06578 ***0.99205 ***0.06360 ***1.02586 ***0.06823 ***1.03904 ***0.06481 ***1.04951 ***
(0.00526)(0.09400)(0.00543)(0.09535)(0.00527)(0.09373)(0.00547)(0.09472)
Industry DummiesYesYesYesYesYesYesYesYes
Year DummiesYesYesYesYesYesYesYesYes
Observations13,51313,51313,51313,51313,51313,51313,51313,513
R-squared0.440560.197630.440870.197810.442690.199580.443380.20006
Adjusted R20.4380.1950.4390.1950.4410.1970.4410.197
Note: The table reports the robust standard errors in parentheses. The symbols ***, **, and * indicate the statistical significance at 1%, 5%, and 10%, respectively. The measurement and description of variables are presented in Appendix A. The table used Equation (7) for examining linear relationships.
Table 4. Empirical results of the curvilinear relationship between IC and firm performance.
(1)(2)(3)(4)(5)(6)(7)(8)
VariablesROATQROATQROATQROATQ
MVAIC0.01346 ***0.14705 ***0.01489 ***0.13237 ***0.01198 ***0.09194 ***0.01376 ***0.08036 ***
(0.00050)(0.00916)(0.00070)(0.01194)(0.00053)(0.00936)(0.00074)(0.01231)
MVAIC2−0.00051 ***−0.00629 ***−0.00060 ***−0.00603 ***−0.00045 ***−0.00354 ***−0.00055 ***−0.00308 ***
(0.00003)(0.00047)(0.00004)(0.00068)(0.00003)(0.00050)(0.00004)(0.00073)
MVAIC × Group −0.00314 ***0.03578 * −0.00410 ***0.02819
(0.00094)(0.01826) (0.00102)(0.01838)
MVAIC2 × Group 0.00019 ***−0.00085 0.00022 ***−0.00119
(0.00005)(0.00096) (0.00006)(0.00100)
MVAIC × BIG4 0.00690 ***0.26341 ***0.00632 ***0.28061 ***
(0.00119)(0.02574)(0.00186)(0.03678)
MVAIC2 × BIG4 −0.00027 ***−0.01341 ***−0.00026 **−0.01545 ***
(0.00007)(0.00131)(0.00010)(0.00192)
Group × BIG4 −0.00992−0.01757
(0.00722)(0.14698)
MVAIC × Group × BIG4 0.00180−0.03856
(0.00239)(0.05242)
MVAIC2 × Group × BIG4 −0.000040.00431
(0.00013)(0.00266)
Group0.000730.13593 ***0.00884 ***0.008970.000700.13122 ***0.01310 ***0.06759
(0.00103)(0.02504)(0.00297)(0.05405)(0.00103)(0.02493)(0.00327)(0.05557)
BIG40.00686 ***0.58182 ***0.00690 ***0.58171 ***−0.01472 ***−0.16141 **−0.01065 *−0.14406
(0.00112)(0.02950)(0.00112)(0.02949)(0.00363)(0.07367)(0.00569)(0.10389)
ETR−0.00225 ***−0.08528 ***−0.00223 ***−0.08542 ***−0.00223 ***−0.08453 ***−0.00222 ***−0.08506 ***
(0.00046)(0.01015)(0.00046)(0.01014)(0.00045)(0.01000)(0.00045)(0.01005)
Firm Age0.00007 ***0.00119 *0.00007 ***0.00117 *0.00007 ***0.00108 *0.00007 ***0.00105
(0.00002)(0.00065)(0.00002)(0.00065)(0.00002)(0.00064)(0.00002)(0.00064)
Leverage−0.14735 ***−1.13876 ***−0.14777 ***−1.14046 ***−0.14653 ***−1.11451 ***−0.14679 ***−1.11597 ***
(0.00345)(0.07366)(0.00346)(0.07373)(0.00346)(0.07336)(0.00347)(0.07350)
Sales growth0.03890 ***0.34738 ***0.03884 ***0.34600 ***0.03899 ***0.34687 ***0.03894 ***0.34747 ***
(0.00231)(0.03909)(0.00231)(0.03908)(0.00230)(0.03898)(0.00230)(0.03896)
Negative Earnings−0.04703 ***−0.22434 ***−0.04694 ***−0.22490 ***−0.04684 ***−0.21390 ***−0.04677 ***−0.21447 ***
(0.00207)(0.03207)(0.00206)(0.03214)(0.00206)(0.03210)(0.00206)(0.03218)
Constant0.04433 ***0.72683 ***0.04046 ***0.79350 ***0.04913 ***0.89107 ***0.04364 ***0.92731 ***
(0.00536)(0.09607)(0.00573)(0.09799)(0.00540)(0.09632)(0.00579)(0.09775)
Industry DummiesYesYesYesYesYesYesYesYes
Year DummiesYesYesYesYesYesYesYesYes
Observations13,51313,51313,51313,51313,51313,51313,51313,513
R-squared0.463360.206310.464190.206860.466630.215440.467940.21618
Adjusted R20.4610.2030.4620.2040.4650.2120.4660.213
Note: The table reports the robust standard errors in parentheses. The symbols ***, **, and * indicate the statistical significance at 1%, 5%, and 10%, respectively. The measurement and description of variables are presented in Appendix A. The table used Equation (8) for examining curvilinear relationships.
Table 5. Robustness check in the linear relationship.
(1)(2)(3)(4)(5)(6)(7)(8)
VariablesROCEMBROCEMBROCEMBROCEMB
MVAIC0.01154 ***0.06474 ***0.01245 ***0.06314 ***0.01017 ***0.04845 ***0.01094 ***0.05031 ***
(0.00046)(0.00845)(0.00065)(0.01104)(0.00048)(0.00855)(0.00069)(0.01159)
MVAIC × Group −0.00187 **0.00298 * −0.00160 *−0.00388
(0.00081)(0.00157) (0.00088)(0.01534)
MVAIC × BIG4 0.00599 ***0.06674 ***0.00673 ***0.05419 *
(0.00105)(0.02060)(0.00150)(0.02804)
Group × BIG4 −0.00889*−0.19603 *
(0.00530)(0.1050)
MVAIC × Group × BIG4 0.00144 *0.02380 *
(0.00081)(0.0141)
Group−0.00340 *0.12078 **0.004460.10843−0.003180.12257 **0.002560.17341**
(0.00197)(0.05530)(0.00362)(0.07985)(0.00197)(0.05524)(0.00401)(0.08635)
BIG40.01922 ***0.98798 ***0.01920 ***0.98798 ***−0.005510.71418 ***−0.01016 *0.81888 ***
(0.00217)(0.06190)(0.00217)(0.06190)(0.00438)(0.09920)(0.00608)(0.13262)
ETR−0.00132−0.10863 ***−0.00133−0.10862 ***−0.00128−0.10815 ***−0.00126−0.10877 ***
(0.00089)(0.02437)(0.00089)(0.02437)(0.00089)(0.02432)(0.00089)(0.02437)
Firm Age0.00010 **0.00586 ***0.00010 **0.00586 ***0.00011 **0.00590 ***0.00011 **0.00587 ***
(0.00005)(0.00155)(0.00005)(0.00155)(0.00005)(0.00155)(0.00005)(0.00156)
Leverage−0.16924 ***−1.79021 ***−0.16888 ***−1.79097 ***−0.16798 ***−1.78153 ***−0.16773 ***−1.77648 ***
(0.00570)(0.16784)(0.00570)(0.16842)(0.00571)(0.16771)(0.00570)(0.16794)
Sales growth0.08016 ***0.91381 ***0.08024 ***0.91346 ***0.08052 ***0.91521 ***0.08061 ***0.91653 ***
(0.00438)(0.09827)(0.00438)(0.09820)(0.00437)(0.09833)(0.00437)(0.09829)
Negative Earnings−0.06517 ***−0.47397 ***−0.06502 ***−0.47430 ***−0.06522 ***−0.47310 ***−0.06505 ***−0.47361 ***
(0.00296)(0.08626)(0.00296)(0.08627)(0.00296)(0.08628)(0.00296)(0.08631)
Constant0.16711 ***1.12377 ***0.16231 ***1.13216 ***0.17269 ***1.19118 ***0.16871 ***1.16872 ***
(0.00956)(0.22376)(0.00982)(0.22798)(0.00954)(0.22371)(0.00981)(0.22555)
Industry DummiesYesYesYesYesYesYesYesYes
Year DummiesYesYesYesYesYesYesYesYes
Observations13,51311,48013,51311,48013,51311,48013,51311,480
R-squared0.335980.169060.336470.169060.339650.169950.340260.17004
Adjusted R20.3340.1650.3340.1650.3370.1660.3380.166
Note: The table reports the robust standard errors in parentheses. The symbols ***, **, and * indicate the statistical significance at 1%, 5%, and 10%, respectively. The measurement and description of variables are presented in Appendix A.
Table 6. Robustness check in curvilinear relationship.
(1)(2)(3)(4)(5)(6)(7)(8)
VariablesROCEMBROCEMBROCEMBROCEMB
MVAIC0.03190 ***0.20229 ***0.03307 ***0.19702 ***0.02839 ***0.11721 ***0.03000 ***0.10221 ***
(0.00092)(0.01983)(0.00118)(0.02631)(0.00093)(0.02042)(0.00122)(0.02741)
MVAIC2−0.00125 ***−0.00859 ***−0.00132 ***−0.00893 ***−0.00111 ***−0.00415 ***−0.00123 ***−0.00332 **
(0.00005)(0.00097)(0.00007)(0.00138)(0.00005)(0.00102)(0.00007)(0.00144)
MVAIC × Group −0.00258 *0.01482 * −0.00352 **0.03133
(0.0015)(0.00863) (0.00179)(0.03981)
MVAIC2 × Group 0.00015 **0.00030 0.00024 **−0.00171
(0.00007)(0.00199) (0.00010)(0.00203)
MVAIC × BIG4 0.01642 ***0.36605 ***0.01710 ***0.44753 ***
(0.00240)(0.05216)(0.00316)(0.06846)
MVAIC2 × BIG4 −0.00066 ***−0.01978 ***−0.00059 ***−0.02655 ***
(0.00014)(0.00265)(0.00019)(0.00371)
Group × BIG4 0.008090.17094
(0.01333)(0.30253)
MVAIC × Group × BIG4 −0.00094−0.14436
(0.00477)(0.10554)
MVAIC2 × Group × BIG4 −0.000150.01185
(0.00028)(0.00940)
Group−0.00324 *0.12198 **0.003460.05266−0.00334 *0.11676 **0.004680.07784
(0.00190)(0.05517)(0.00512)(0.12082)(0.00189)(0.05507)(0.00534)(0.12493)
BIG40.01760 ***0.97777 ***0.01763 ***0.97762 ***−0.03331 ***−0.02863−0.03806 ***−0.12417
(0.00209)(0.06159)(0.00209)(0.06161)(0.00680)(0.15398)(0.00860)(0.18736)
ETR−0.00181 **−0.11196 ***−0.00179 **−0.11190 ***−0.00175 **−0.11058 ***−0.00171 **−0.11156 ***
(0.00084)(0.02447)(0.00084)(0.02447)(0.00083)(0.02429)(0.00083)(0.02432)
Firm Age0.00013 ***0.00600 ***0.00013 ***0.00600 ***0.00013 ***0.00577 ***0.00014 ***0.00580 ***
(0.00005)(0.00155)(0.00005)(0.00155)(0.00005)(0.00154)(0.00005)(0.00156)
Leverage−0.16472 ***−1.74688 ***−0.16506 ***−1.75133 ***−0.16280 ***−1.72249 ***−0.16329 ***−1.72640 ***
(0.00556)(0.16712)(0.00557)(0.16739)(0.00555)(0.16676)(0.00556)(0.16654)
Sales growth0.07405 ***0.87111 ***0.07401 ***0.86788 ***0.07424 ***0.87073 ***0.07422 ***0.87606 ***
(0.00419)(0.09733)(0.00419)(0.09725)(0.00418)(0.09730)(0.00417)(0.09723)
Negative Earnings−0.05145 ***−0.37963 ***−0.05137 ***−0.37954 ***−0.05097 ***−0.36711 ***−0.05081 ***−0.36382 ***
(0.00289)(0.08749)(0.00289)(0.08757)(0.00288)(0.08751)(0.00289)(0.08755)
Constant0.11443 ***0.77406 ***0.11122 ***0.81596 ***0.12575 ***1.02252 ***0.12162 ***1.04686 ***
(0.00938)(0.22763)(0.00970)(0.23562)(0.00930)(0.22844)(0.00963)(0.23419)
Industry DummiesYesYesYesYesYesYesYesYes
Year DummiesYesYesYesYesYesYesYesYes
Observations13,51311,48013,51311,48013,51311,48013,51311,480
R-squared0.381840.173020.382020.173120.387800.177820.388500.17840
Adjusted R20.3790.1690.3800.1690.3850.1740.3860.174
Note: The table reports the robust standard errors in parentheses. The symbols ***, **, and * indicate the statistical significance at 1%, 5%, and 10%, respectively. The measurement and description of variables are presented in Appendix A.
Table 7. Robustness check with Non-IC intensive firms.
(1)(2)(3)(4)(5)(6)(7)(8)
VariablesROATQROATQROATQROATQ
MVAIC0.00512 ***0.04395 ***0.00511 ***0.03247 ***0.00435 ***0.03262 ***0.00462 ***0.02683 ***
(0.00024)(0.00475)(0.00034)(0.00643)(0.00026)(0.00480)(0.00037)(0.00692)
MVAIC × Group 0.000030.02256 *** −0.000590.00965
(0.00043)(0.00824) (0.00048)(0.00852)
MVAIC × BIG4 0.00331 ***0.04885 ***0.00212 ***0.02459
(0.00051)(0.01216)(0.00077)(0.01691)
Group × BIG4 −0.01679 ***−0.40152 ***
(0.00498)(0.11940)
MVAIC × Group × BIG4 0.00242 **0.04937 **
(0.00100)(0.02375)
Group−0.00488 ***0.08198 **−0.00504 **−0.02212−0.00468 ***0.08495 **−0.000070.09695 *
(0.00130)(0.03435)(0.00230)(0.04970)(0.00129)(0.03431)(0.00264)(0.05337)
BIG40.000760.56295 ***0.000760.56356 ***−0.01423 ***0.34176 ***−0.005880.54233 ***
(0.00142)(0.04132)(0.00142)(0.04129)(0.00255)(0.06268)(0.00387)(0.08865)
ETR−0.00269 ***−0.08653 ***−0.00269 ***−0.08666 ***−0.00268 ***−0.08626 ***−0.00273 ***−0.08772 ***
(0.00056)(0.01282)(0.00056)(0.01283)(0.00056)(0.01277)(0.00056)(0.01290)
Firm Age0.00016 ***0.001350.00016 ***0.001320.00016 ***0.001410.00016 ***0.00131
(0.00003)(0.00089)(0.00003)(0.00089)(0.00003)(0.00089)(0.00003)(0.00089)
Leverage−0.15610 ***−1.39741 ***−0.15611 ***−1.40762 ***−0.15486 ***−1.37912 ***−0.15446 ***−1.37884 ***
(0.00422)(0.10125)(0.00424)(0.10137)(0.00423)(0.10096)(0.00424)(0.10096)
Sales growth0.03913 ***0.31829 ***0.03913 ***0.31757 ***0.03921 ***0.31950 ***0.03927 ***0.32094 ***
(0.00288)(0.04749)(0.00288)(0.04750)(0.00287)(0.04746)(0.00287)(0.04745)
Negative Earnings−0.04796 ***−0.21606 ***−0.04796 ***−0.21752 ***−0.04792 ***−0.21553 ***−0.04796 ***−0.21805 ***
(0.00268)(0.04418)(0.00268)(0.04432)(0.00267)(0.04413)(0.00267)(0.04441)
Constant0.05122 ***0.49600 ***0.05132 ***0.56061 ***0.05542 ***0.55801 ***0.05398 ***0.58512 ***
(0.00408)(0.07805)(0.00431)(0.08131)(0.00409)(0.07854)(0.00430)(0.08190)
Industry DummiesYesYesYesYesYesYesYesYes
Year DummiesYesYesYesYesYesYesYesYes
Observations84478447844784478447844784478447
R-squared0.458400.186990.458400.187560.462660.188990.463540.19069
Adjusted R20.4550.1820.4550.1830.4600.1840.4600.186
Note: The table reports the robust standard errors in parentheses. The symbols ***, **, and * indicate the statistical significance at 1%, 5%, and 10%, respectively. The measurement and description of variables are presented in Appendix A.
Disclaimer/Publisher’s Note: The statements, opinions and data contained in all publications are solely those of the individual author(s) and contributor(s) and not of MDPI and/or the editor(s). MDPI and/or the editor(s) disclaim responsibility for any injury to people or property resulting from any ideas, methods, instructions or products referred to in the content.

