Article

Decision Rules for Corporate Investment †

by
Reinier de Adelhart Toorop
1,
Dirk Schoenmaker
1,* and
Willem Schramade
2
1
Rotterdam School of Management, Erasmus University, 3062 PA Rotterdam, The Netherlands
2
Centre for Corporate Reporting, Finance & Tax, Nyenrode Business University, 3621 BG Breukelen, The Netherlands
*
Author to whom correspondence should be addressed.
The authors would like to thank Dion Bongaerts, Abe de Jong, Asli Togan Egrican, Carlos Vargas and seminar participants at the 2023 FMA European Conference at Aalborg University and the 2023 GRASFI conference at Yale University for useful comments and suggestions.
Int. J. Financial Stud. 2024, 12(1), 24; https://doi.org/10.3390/ijfs12010024
Submission received: 20 November 2023 / Revised: 9 February 2024 / Accepted: 18 February 2024 / Published: 4 March 2024

Abstract

:
We investigate the decision rules for corporate investment by designing a company value frontier. This company value frontier allows for balancing the financial value and social and environmental impacts. This article develops novel value concepts—ranging from shareholder value to shareholder welfare and integrated value—resulting in varying preferences for social and environmental impacts or values. Next, these preferences are incorporated in investment decision rules. The traditional net present value (NPV) rule optimises only the financial value. We propose a new integrated present value (IPV) decision rule that includes a preference for social and environmental values without neglecting the financial value. By applying the new IPV rule, responsible companies are able to achieve more sustainable outcomes.
JEL Classification:
G3; H23; I3; L21

1. Introduction

The current economic system has created great prosperity, but its negative social and environmental results are increasingly apparent. There is an urgent need for better outcomes, social fairness (Stiglitz et al. 2009), and to stay within planetary boundaries (Richardson et al. 2023). Companies are under pressure to move away from the classical shareholder model based on the Friedman Doctrine, which states that the government takes care of societal issues, while companies focus on financial profit maximisation (Friedman 1970).
Social and environmental challenges need to be addressed with major reforms and investments. Society expects companies to actively participate in finding and providing solutions (Deegan 2019). The major sustainability transitions result in changes in the markets for products and services. Frontrunner companies can strengthen their competitive position in the new market, while the laggards are in danger of disappearing (Kurznack et al. 2024).
The impacts in the form of social and environmental values are an important indicator for future value creation. Future-oriented companies focus on the financial value (are the activities profitable?) as well as social and environmental values (are the activities future-proof?). The new concept of integrated value combines financial, social, and environmental values (Schoenmaker and Schramade 2023). The research question of this article is: how can we incorporate integrated value in company investment decisions?
The aim of this article is to devise new investment decision rules that include social and environmental factors alongside financial factors. We first develop a company value frontier (in a setting of financial value and social and environmental impacts) to show how the different investment decision rules work. The curve of this value frontier moves over time, as social and environmental externalities are becoming internalised through regulations, technologic advances, and consumer preferences. Next, we devise the new investment decision rules both on a project basis and company basis. If companies experience a shortfall concerning a particular area (e.g., social or environmental impacts), the investment decision rule can be tilted to provide the company with the desired financial value–impact combination that is in line with the company’s preferences. Our model allows us to derive the required changes. Applying the new investment decision rules to company case studies indicates that companies can achieve better societal outcomes.
The contribution of this article is threefold. First, the article contributes to the corporate finance literature by expanding the net present value rule for investment decisions in order to respect social and planetary boundaries (Ding et al. 2020). Second, the article adds to the literature on corporate governance, in which long-term value creation has become a central concept, but with limited guidance on the execution (Mayer 2018). This article makes the concept of long-term value creation operational. Third, the article contributes to the recent advances in financial reporting to include sustainability information.1 The missing link is how to steer investments with this new information, linked to a company’s mission and value creation. This article aims to fill this gap.
An earlier attempt to consider environmental and social values is the balanced scorecard, which incorporates financial, social, and environmental indicators in a qualitative way into strategy setting and decision-making processes (Kaplan and Norton 1996). The balanced scorecard approach led to a search for key performance indicators derived from strategic goals. But, it is not clear how to weigh and aggregate the different indicators. The quantification of social and environmental values is a key feature of our new investment decision model allowing for weighing and aggregating different value components.
Another method to include social and environmental values is the real options approach to capital investment decisions (Dixit and Pindyck 1994). Real options provide a company the right, but not the obligation, to undertake certain business opportunities or investments. An extension of the real options approach is to analyse investments driven by social or environmental factors. The real options approach is useful in situations with a high uncertainty about future realisations, for example, of social and environmental transitions. Our integrated value approach is more generally applicable to both low- and high-uncertainty situations. Moreover, it can be combined with a real options approach as well.2
This article is organised as follows. Section 2 discusses how to set the objective of a company. Next, Section 3 develops the company value frontier, which allows us to derive investment decision rules in Section 4. Section 5 analyses the results of applying our new investment decision rules and discusses extensions of our investment decision model. Finally, Section 6 concludes the article.

2. The Objective of the Company

In this section, we start with a literature review and define the objective of the company leading to priorities concerning financial, social, and environmental values (Barby et al. 2021). We also discuss the governance process by which companies set these preferences.

2.1. Literature Review

The classical shareholder model argues that the government takes care of societal issues, including social equality, healthcare, education, and the environment, while companies focus on financial profit maximisation and are only required to adhere to the legal framework (Friedman 1970).
The shareholder model assumes the government can manage social and environmental externalities through policy and regulation practices. But, externalities are inextricably linked to industrial production and are difficult to overcome fully by external regulations because of asymmetric information (Hart and Zingales 2022). Companies know the precise consequences of their operations better than external parties and are therefore better placed to reduce or prevent negative effects by adapting their business models. Another assumption underlying the shareholder model is perfect competition, which leaves no scope for companies to address externalities. But, (large) companies have market power and political power (Hart and Zingales 2022).
Hart and Zingales (2017, 2022) propose maximising shareholder welfare instead of shareholder value to address externalities. Prosocial shareholders place emphasis on the welfare of others that are affected by corporate decisions. There is empirical evidence for social and environmental preferences of institutional investors (Azar et al. 2021; Dyck et al. 2019). Shareholder welfare is a step forward to address externalities but has its limitations. First, shareholders are not representative of the preferences of other stakeholders (and wider society). Second, shareholders are subject to the free-rider problem in that they face the full cost of prosocial decisions, but only part of the benefits. This leads to an underprovision of social and environmental values.
In the alternative stakeholder model, companies are viewed as part of wider society (Freeman 1984). Companies are expected to comply with community expectations to maintain their social license to operate (Wilburn and Wilburn 2011; Demuijnck and Fasterling 2016; Deegan 2019). A US citizen survey found that 63% of American citizens—including 71% of millennials—expected businesses to take the lead to drive social and environmental changes (Cone Communications 2017). The idea of a social license to operate has sparked a new type of literature on the responsibility of companies to balance profits and impacts (Mayer 2018; Edmans 2020; Schoenmaker and Schramade 2023). Also, in practice, the increased emphasis on stakeholder value has given rise to a new organisation form: the Certified B Corporation. Benefit corporations, abbreviated as B corps, aim to address profits and impacts. The number of B corps has grown exponentially in recent years (Kim 2021).
A major critique of the stakeholder model is that multiple objectives lead to deadlocks in decision-making processes and hinder accountability (Tirole 2001; Bebchuk and Tallarita 2021). The reason for the failure of the stakeholder model is the absence of a measure of the aggregate welfare of stakeholders (including investors). Tirole (2001) argues that it is harder to measure the firm’s contributions to the welfare of employees, suppliers, or customers than to measure its profitability. There is no accounting measure of this value; although, in some examples, one can find imperfect proxies (e.g., the number of layoffs). Moreover, there is no market value of the impacts of past and current managerial decisions on the future welfare of stakeholders (i.e., the counterpart of the stock market measurement of the firm’s assets).
However, recent advances in impact measurements and valuations enable companies to measure social and environmental values and express these in a monetised form using cost-based or welfare-based prices (Serafeim et al. 2019; De Adelhart Toorop et al. 2019; Schoenmaker and Schramade 2023). The monetisation of different value components enables aggregation. Building on these impact valuation methods, Schoenmaker and Schramade (2023) developed a measure of integrated value, which combines financial, social, and environmental values. This integrated value measure allows managers to balance several types of value (financial, social, and environmental) at the same time, which often involves trade-offs.
Based on this literature review, we developed the following research hypothesis:
Hypothesis 1 (H1).
The inclusion of social and environmental factors in investment decisions leads to better societal outcomes.

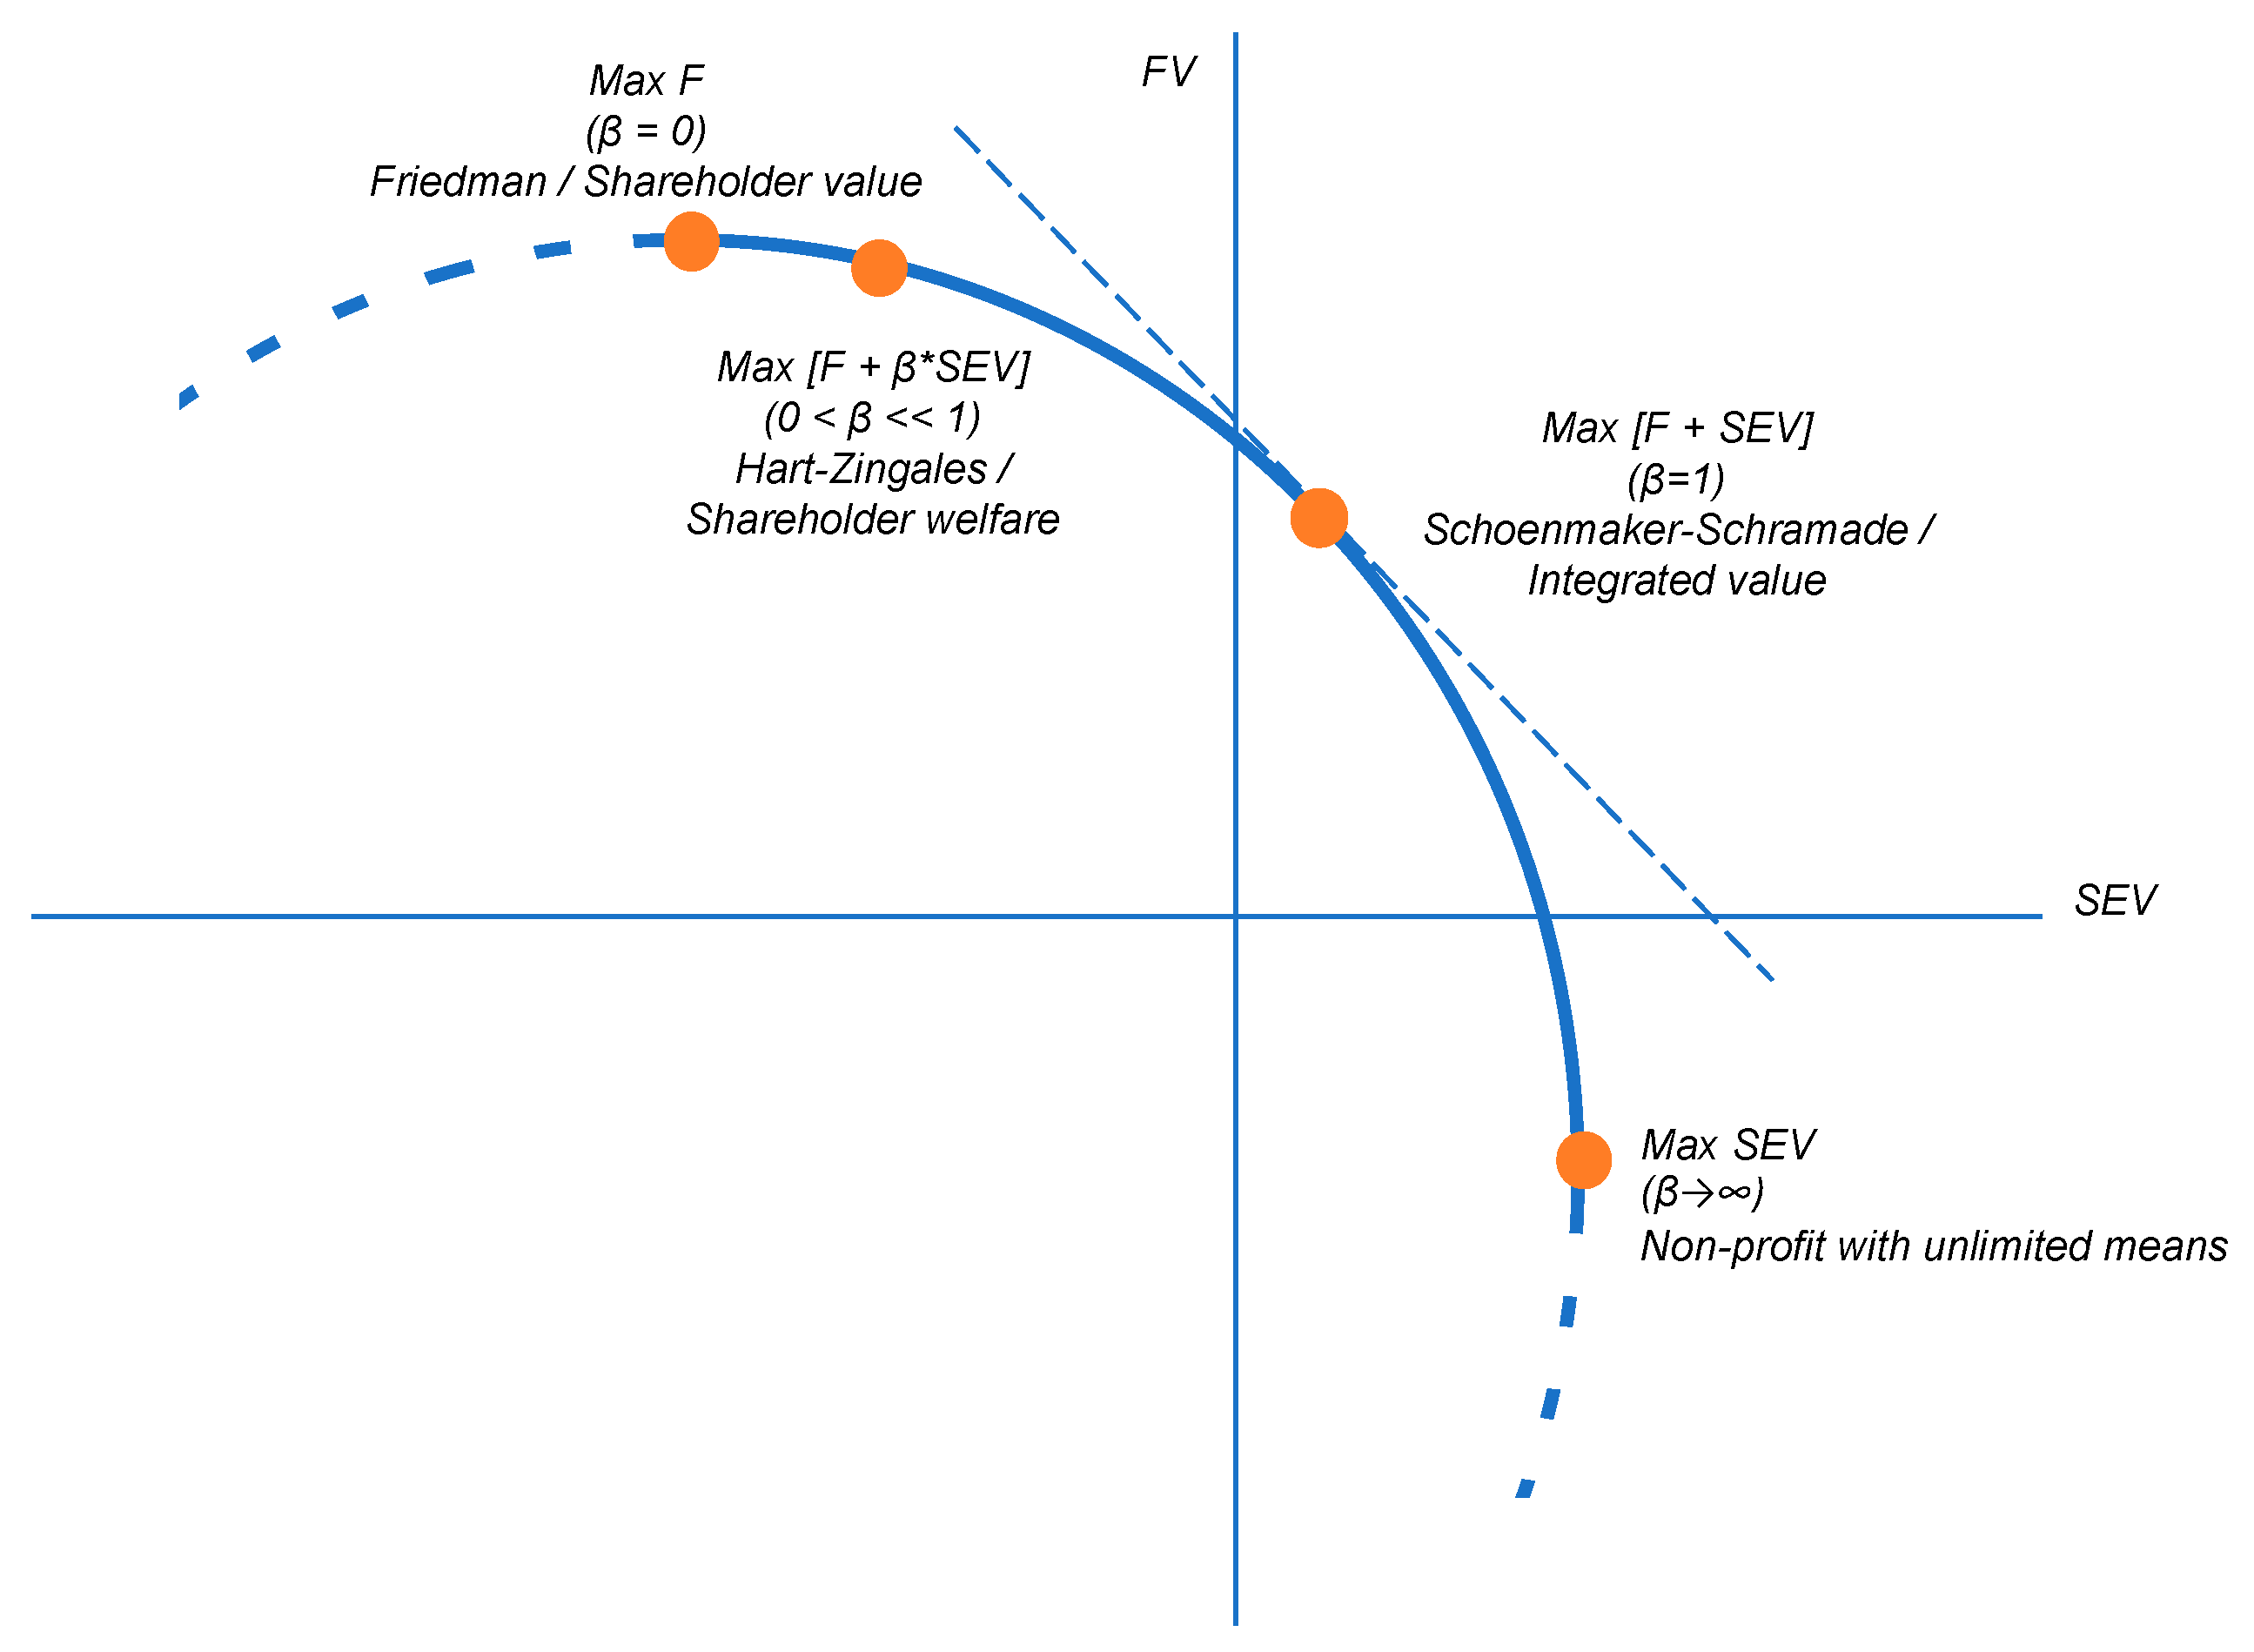
2.2. Setting the Objective of the Company

Mayer (2018) argues that companies should set their purpose and incorporate that into their decision making. The purpose reflects what companies are good at and aspire to achieve, which can be interpreted as a company’s comparative advantage (Edmans 2020). Companies can thus prioritise a specific type of value, without neglecting the other value dimensions, in their strategy. The board can set the company’s priority for social and environmental values,  S E V , relative to the financial value,  F V , with a non-negative parameter,  β . A company maximises its value,  V , which is defined as follows:
V = F V + β · S E V
There is a long-standing debate in the literature about who should set the priorities: shareholders or a broader group of stakeholders, which includes shareholders. Friedman (1970) strongly defended the shareholder model, arguing that companies should pursue profits and that the government was responsible for creating social and environmental values (by addressing externalities through regulation and taxation). The shareholder value model effectively places the beta value at zero:  β = 0 . Shareholder value maximisation fits into the tradition of classical utilitarianism that maximises the good (in this case financial value), that is, to bring about the greatest amount of good without regarding the distribution among stakeholders (Sidgwick 1907).
The support for the shareholder model was recently reiterated by Bebchuk and Tallarita (2021) and Cornell and Shapiro (2021). The main argument against the stakeholder model is that the board is accountable to no one in the case of multiple goals or masters (Tirole 2001; Bebchuk and Tallarita 2021), as it is implicitly assumed to lack an integrated measure. The board then has the freedom to set its own priorities. We discuss below how an integrated measure can tie the board’s hands ex ante and make it accountable ex post.
Remaining within the shareholder model, Hart and Zingales (2017, 2022) make a distinction between shareholder value, which aims for the maximisation of financial value only, and shareholder welfare, which incorporates social and environmental externalities. An important assumption of their model is that these externalities are not perfectly separable from production decisions. So, companies face a choice in the degree of sustainability ( S E V , in Equation (1)) in their business model. The mechanism in the Hart–Zingales model to guide that choice is voting by prosocial shareholders, who care about the welfare of others, on corporate policy. However, as argued in the introduction, shareholders are not representative of the wider group of stakeholders. Moreover, shareholders face the free-rider problem in deciding on the company’s social and environmental priorities. This is likely to result in a small beta value:  0 < β 1 .
The stakeholder model (Freeman 1984) states that the board should balance the interests of all stakeholders, which include financial agents (shareholders and debtholders) as well as other agents, such as consumers, workers, suppliers, and the local communities in which the company operates. A broad interpretation of stakeholders also includes future generations who care about environmental damage. The stakeholder model fits into the rights approach of Rawls (1971). Applying the rights approach to a company means that the rights of all stakeholders should be respected (financial, social, and environmental stakeholders). It is not allowed to increase the benefit of one group of stakeholders at the expense of other less advantaged groups of stakeholders (even if this would increase the overall number of benefits, as in the consequentialist approach of utilitarianism where only outcomes count).3

2.3. Corporate Governance

Schoenmaker and Schramade (2023) developed an integrated value measure to deal with all stakeholder interests. From an aggregate welfare point of view, an integrated value is achieved when the marginal contribution of the value components is equalised, which produces a beta value of one:  β = 1 . In corporate governance terms, the executive directors set the parameter,  β , as part of the company’s strategy, which is subsequently challenged by a strategy dialogue with the non-executive directors in a one-tier board or the supervisory board in a two-tier board (Schoenmaker et al. 2023). Stakeholder-driven companies often have a stakeholder council where the company’s priorities are discussed. Stakeholders can thus indirectly influence the parameter,  β .
In sum, parameter  β  reflects shareholder preferences in the shareholder model and the degree of stakeholder preferences in the stakeholder model.

3. Modelling the Value Frontier

3.1. Impact Measurement and Valuation

The outcomes of the business model of a company can be defined in terms of its financial returns, or profits F, and various social and environmental impacts,  S E . If these can be quantified and monetarily valued, they can be aggregated into a quantity social and environmental value,  S E V , which can be compared to the financial value,  F V .
To balance and aggregate the financial, social, and environmental value components, we need to express these components in a common ‘currency’. Recent advances in the impact measurement and valuation method have enabled companies to measure social and environmental effects and to express these in a monetised form via cost-based pricing techniques (Serafeim et al. 2019; De Adelhart Toorop et al. 2019; Schoenmaker and Schramade 2023). The monetisation of social and environmental factors is the basis for including these factors, alongside financial factors, into corporate investment decision making.
Measuring social and environmental values,  S E V ,  follows a three-step process:
  • Materiality assessment: determine important  S E V  factors;
  • Quantification: express these factors in their own units (Q);
  • Monetary valuation: express these factors in monetary terms with shadow prices (SP).
Materiality assessments aim to determine the social and environmental factors that are sufficiently important for consideration in  S E V . Material social and environmental factors are those that reflect a company’s most significant impacts (positive or negative) on the society and the planet. Materiality depends on a specific situation and can differ per industry and country. For example, work safety and health is an important topic for factories and mining operations. By contrast, attracting and training human talent are material (i.e., important) for knowledge institutions, like universities or management consultancies. In addition, materiality can differ within industries. Mining in the Democratic Republic of Congo has greater human rights challenges than mining in Australia. Yet, there is also a core set of social and environmental factors4 that one always needs to include (Kuh et al. 2020):
  • Greenhouse gas emissions, including carbon emissions;
  • Labour practices, including discrimination and inclusion;
  • Business ethics, including corruption and fraud.
The second step towards calculating social and environmental values is quantification. This involves expressing social and environmental factors in their own units. For example, GHG emissions can be expressed in tonnes of CO2 or tonnes of CO2 equivalent, which includes all greenhouse gases: carbon dioxide CO2 (80%), methane CH4 (10%), nitrous oxide N2O (7%), and fluorinated gases (3%). It should be noted, however, that this is just one component of the environmental factor. To fully address this factor, all nine planetary boundaries (Richardson et al. 2023) should be considered and quantified as far as they are material for the company at hand. Some, such as nitrogen, are as easily quantifiable as carbon, but others are not. For example, biodiversity cannot (yet) be expressed in a single metric, although some very general metrics, such as hectares of land, affected are used.
It is also possible to express components of the social factor in their own units, such as quality life years added by a medical technology company (Räsänen et al. 2006). But, some social components are quite challenging to compute, since they lack a clear unit. This applies, for example, to violations of human rights. However, organisations, like the Impact Institute (2020), show that such social factors can still be quantified, for example, in terms of health effects or underpayment.
The final step in calculating social and environmental values is to express the social and environmental components in monetary terms to make them comparable. Monetisation involves putting a price on the units identified in the previous step. As we are dealing with social and environmental externalities, market prices, if available at all, tend to underestimate the social and environmental values from a welfare perspective. In line with the rights approach of Rawls (1971), the principle of remediation can be used to derive the remediation costs of social and environmental impacts (Harclerode et al. 2016). While the market price of carbon emissions fluctuated around EUR 80 per tonne of CO2 in the EU Emissions Trading System in 2023, the shadow carbon price is EUR 204 per tonne of CO2 (Impact Economy Foundation 2022). This is the price to restore (i.e., remedy) the original situation, in this case, taking one tonne of CO2 out of the air. Social components can also be monetised. Human rights violations, for example, can be expressed as monetary damages by assessing how they hurt people’s ability to lead a decent life. The Impact Economy Foundation (2022) provides a list of impacts and shadow prices for monetisation, which is regularly updated.
Impact measurement and valuation is a growing field with slightly different approaches (Serafeim et al. 2019; De Adelhart Toorop et al. 2019; Schoenmaker and Schramade 2023). The new EU Corporate Sustainability Reporting Directive (2022/2464) requires companies to disclose the outcomes and specific results in a wide range of social and environmental matters. At the international level, the International Financial Reporting Standards (IFRS) introduces IFRS Sustainability Disclosure Standards. This article builds on the implementation of these new accounting standards to measure social and environmental values.

3.2. Value Frontier

In our investment decision model,  F V  represents financial value creation (if  F V > 0 ) or destruction (if  F V < 0 ) for the shareholders of a company, and SEV represents social and environmental value creation (if  S E V > 0 ) or destruction (if  S E V < 0 ) for other stakeholders, such as employees, customers, governments, local communities, and beneficiaries of nature.
Figure 1 shows the company value frontier for combinations of  F V  and  S E V  resulting from the company’s business model. For companies that optimise  V  for some value of  β > 0  according to Equation (1), the relevant part of the curve slopes down. On the part(s) of the curve sloping up (dashed in Figure 1), management has options (to change the company’s business model) that increase both the  F V  and  S E V , thereby always increasing  V .
Following Husted and de Jesus Salazar (2006), the company value frontier is concave (sloping inwards). The concave shape reflects the fact that costs of inputs, such as labour (Krueger et al. 2022) and capital (Chava 2014), tend to decrease for environmentally and socially responsible companies (i.e., those scoring relatively well on  S E V ), while revenues in the form of market shares and product margins (Schoenmaker and Schramade 2022) tend to increase for these companies. At first, the company is expected to receive financial benefits,  F V  (in the form of cheaper inputs and higher revenues) in addition to a pro-rata decline in  F V  from an increased  S E V . However, as the company’s  S E V  increases, these additional benefits,  F V ,  become smaller and can even turn negative. This explains the concave shape of the company value frontier.
Four points are shown in Figure 1, reflecting special values for  β . The leftmost point is the case  β = 0 . This means that the organisation simply optimises its financial value without regard to  S E V  (Friedman 1970). The second point is shareholder welfare as proposed by Hart and Zingales (2017, 2022), where  β  is non-zero, but much smaller than 1. The third point is  β = 1  and reflects integrated value in the stakeholder model as discussed by Schoenmaker and Schramade (2023). The dotted line in the figure is the 45° tangent line, showing the equal relevance of  F V  and  S E V . The last point is the maximation of the  S E V  without much regard to  F V . This technically reflects the limit  β . We characterised this point as non-profit (e.g., public hospitals or public education) with unlimited (financial) means (e.g., subsidies).5
Note that Figure 1 is for illustrative purposes only. The details, in particular, the position of the curve with respect to the axes, are different over economic sectors. Figure 1 shows the most common case where the shareholder value and shareholder welfare maximisation are associated with negative  S E V , and  S E V  maximalisation is associated with negative  F V , but neither is necessarily always the case.

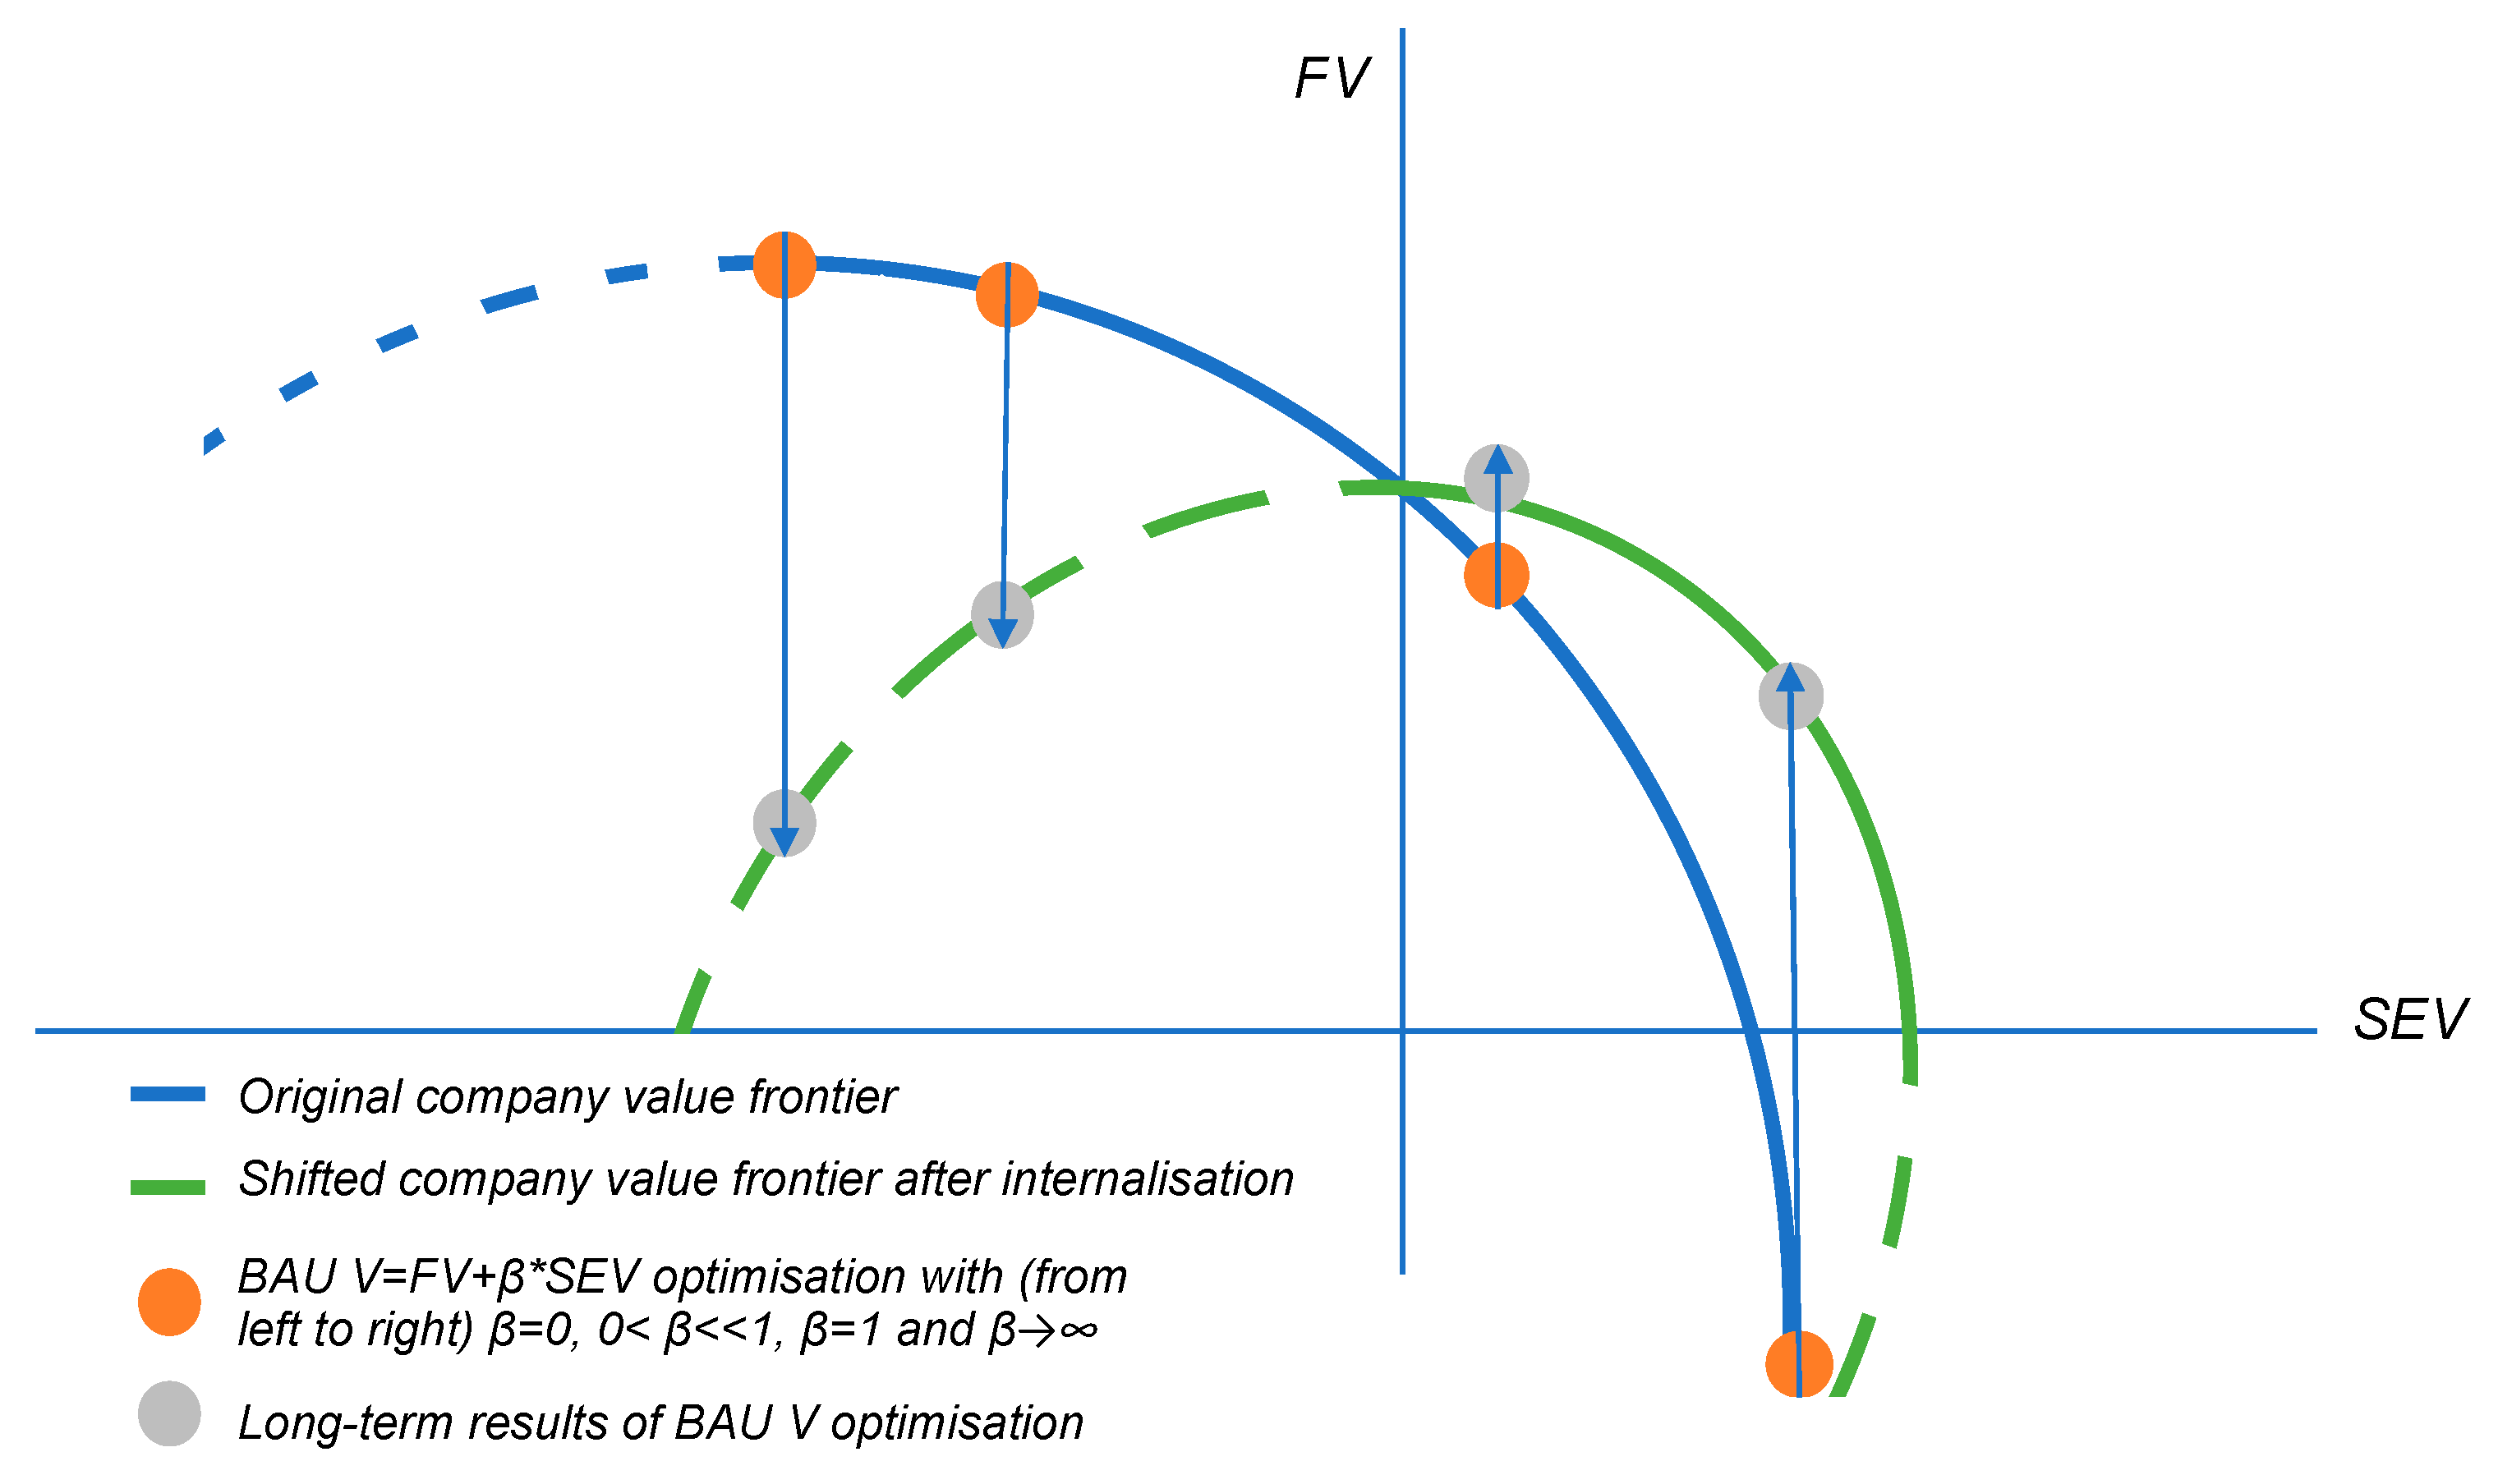
3.3. Dynamics of the Value Frontier

The value frontier, as discussed in Section 3.2, describes a business-as-usual (BAU) approach (Dyllick and Muff 2016). The transition of business models driven by the (expected) internalisation of social and environmental externalities tends to shift and tilt the value frontier to the right, as schematically shown in Figure 2. Internalisation trends include regulation and taxation (e.g., taxing externalities, such as carbon emissions), technological advances, and the shifting expectations of consumers, investors, and employees.
As discussed in Section 2, companies that strongly place the interests of the company’s shareholders above those of society risk losing their license to operate, and therefore lose customers, investors, and employees. Figure 2 shows that companies that initially optimise for  F V  only risk ending up in a situation where they operate below their capabilities when the company value frontier shifts in the internalisation scenario. At the same time, companies that score (relatively) well on  S E V  are rewarded with a higher profitability  F V  in the long run (Kurznack et al. 2024). The tilting occurs through the y-axis, as negative impacts become more ‘expensive’ because of internalisation leading to a lower  F V , while positive impacts gain in financial value. Interestingly, the original Friedman and Hart–Zingales optimisation points become less profitable, while the Schoenmaker–Schramade and non-profit points become more profitable due to internalisation.

4. Investment Decision Rules

This section devises investment decision rules based on the company value frontier.

4.1. Investments and Re-Evaluation of the Company’s Objective

Given their value,  V , maximisation in Equation (1), companies make investments on a regular basis. These investments lead to changes in company value  V  (in present value terms). This can include major investments, such as mergers and acquisitions (M&As), or more modest annual investments, such as those related to organic growth or investments to compensate for the depreciation of assets.
The basic investment decision rule is to make an investment when the net present value is larger than zero:
V = F V + β · S E V > 0
The best-known case is where  β = 0  and the investment rule is the NPV rule: undertake all projects with  N P V = F V > 0  and, in case of budget constraints, select those within your budget that have a maximal NPV.
Company management that is content with its initial values of  F V  (that can be denoted by  F V ~ ) and  S E V  (denoted by  S E V ~ ) based on the initial preference of  β  (denoted by  β ~ ) can simply continue to make investment decisions with the old  β ~ . The total (present) value of the initial investments (and hence of the company, which is a portfolio of investments) is:
V ~ = F V ~ + β ~ · S E V ~
On the other hand, company managements that believe a different value of  β  (denoted  β ) would suit their strategy better in the long run can use investment decisions to (gradually) move from  β ~  to  β . As an extreme example, one can envision a company that currently mostly operates on an  F V  (i.e.,  β ~  close to zero) basis, but that aims to create values for all stakeholders (e.g., a B corp) with a more equal importance of  F V  and  S E V , i.e.,  β  closer to 1.
The target value of the company,  V ,  after the investment is given by:
V = ( V ~ ) + ( V )
where  ( V ~ ) = F V ~ + β · S E V ~  represents a revaluation of the current company with the new preference,  β , and  ( V ) = F V + β · S E V  represents the value creation from the investment assessed with respect to  β . The target value,  V , can be written as:
V = F V ~ + F V + β · ( S E V ~ + S E V )
From here on, management can follow two paths. It can either consider the misalignment of  F V ~  and  S E V ~  in the past as a ‘sunk cost’ and simply maximise all its investments from the present, based on the new preference,  β , optimising Equation (5) based on what they still have control over. This has the disadvantage, however, of the misalignment reducing over time but never being fully erased.
Alternatively, management can use the investments to actively re-align their total company portfolio of investments with their new preference. The relative weights of  F V  and  S E V  are as if they have always had their new preference. In the case described above, ( β > β ~ ), they should do so using investments with a  β  value even larger than the goal  β  value. In order to correct for the historical lack of attention to  S E V  compared to  F V , companies should apparently overinvest in  S E V .
Section 4.2 derives a decision rule for companies that aim to change their company profile from  β ~  to  β  in a single major investment (e.g., through M&A). Section 4.3 presents this for companies that adapt in a more gradual way through their annual investments.

4.2. Decision Rule for Major Investments

Consider a company that, in all its historic investment decisions (that span a total investment volume  I ~ ), optimise for  β ~ . The company has access to a major investment (of volume ΔI) for which it can optimise  Δ F V  and  Δ S E V  using parameter  β I . This can be chosen such that investment decisions in the total company portfolio (of volume  I ~  +  Δ I ) have on average been made based on  β —the value that management presently considers to be optimal (assuming constant discount rates for past and current investments). We find that:
β I = β + β β ~ · I ~ I
The first term considers the preference parameter for new investments,  β , while the second term reflects a tilting factor to catch up, denoted by  β β ~ , for historic investments. Using Equations (2) and (6), the investment decision rule is presently  V = F V + β I · S E V > 0 . Equation (6) shows the need to overinvest in  S E V  relative to  F V  for companies where  β > β ~ . The beta of the investment,  β I ,  is even larger than  β  to compensate for a historic underattention to  S E V .
In the case of a major investments, such as an M&A deal with an equal-sized company (so that  I ~ = I ), the overinvestment,  β I ,  in  S E V  relative to  F V  has an upper bound of twice the target ratio,  β , as Equation (6) provides  β I = β + β β ~ · 1 = 2 · β β ~ . With smaller investments ( I I ~ ),  β I  can become unrealistically large, which is due to the catch-up being performed in one go (see Section 4.3).

4.3. Decision Rule for Annual Investments

If no major investment with a high value creation in the social–environmental dimension is available, or if this is not the strategy of the company to engage in such investments in the first place, smaller regular investments (e.g., annual investments) can also pull  β  towards  β . As discussed earlier in Section 4.1, simply investing with  β  in mind will slowly move the effective  β  from its original value,  β ~ ,  to the desired value,  β , although the end state is only reached asymptotically.
Alternatively, the company can apparently overinvest in SEV. Unlike Section 4.2, however, it is not possible to achieve the desired value,  β ,  in one go. If, instead, the company aims to achieve this by  N I  investments, the formula for  β I , the inferred beta of each of the investments (that is characterised by  Δ F V  and  Δ S E V ) becomes:
β I = β + 1 N I · β β ~ · I ~ I
The choice of  N I  (which is a positive integer) depends positively on the size of the catching-up effect  β β ~  (i.e., the larger the catching-up needed, the more time you need) and negatively on the annual investment budget denoted as X% of the invested capital (i.e., the larger the investment budget, the less time you need). In the case of a large catching-up effect (close to  β ) and an upper bound for  β I  of twice the target ratio,  β , a company needs 1/X years to catch up. With large annual investments, this occurs swiftly: e.g., an X of 20% needs only 5 (=1/0.20) years. In contrast, with a small, annual, investment budget, the catching-up progresses slowly: e.g., an X of 5% needs up to 20 (=1/0.05) years. An M&A transaction (see Section 4.2) can then help to speed up the move to the new preference point. Alternatively, the company can divest its current business and start from scratch.

5. Results and Extension

In this section, we applied the investment decision rules to numerical examples. Next, we discuss the extensions of our basic decision model of Section 4.

5.1. Numerical Examples

The newly proposed investment decision rules include social and environmental values (with a preference  β ) in a relatively straightforward way. Yet, they represent a major advance for corporate finance, where the NPV rule (with  β = 0 ) for investments is one of the foundational methods. The new decision rules (with  β > 0 ) would have a great impact on industries with large social and environmental externalities. A special case is the integrated present value (IPV) rule where the financial value  F V  and social and environmental value  S E V  are equally weighted (with  β = 1 ). Examples of environmental externalities are the fossil fuel industry and the carbon-intensive manufacturing industry, such as steel and cement. Responsible oil and gas companies (with a  β 0 ) that want to navigate the energy transition face steep investments in renewable energy. Examples of social (and environmental) externalities are the fast-fashion and fast-moving consumer goods industry. Both empirical and anecdotal evidence are emerging from companies applying new decision rules, although there are also many examples where companies still strictly apply the NPV rule.
Following Section 4.2, we provide a numerical example of a major investment in the fast-moving consumer goods industry, the attempted takeover of Unilever by Kraft Heinz in 2017 (Schoenmaker and Schramade 2023). Kraft Heinz’s strategy was to maximise the shareholder value by applying cost-cutting measures. At the time, Kraft Heinz estimated the financial value of the synergies to be EUR 46 billion (see Table 1). Unilever adopted the Unilever Sustainable Living Plan to improve the social (e.g., paying a living wage in the supply chain) and the environmental (e.g., reducing carbon emissions) parts of its operations. Kraft Heinz would have stopped the Unilever Sustainable Living Plan in its planned cost-cutting measures if the takeover had succeeded. The losses in social and environmental values were estimated to be EUR 38 billion and EUR 13 billion, respectively (see Table 1).
The NPV rule indicates that the takeover should proceed, as the estimated improvement in the financial value is positive at EUR 46 billion. In contrast, the IPV rule suggests that the takeover should not proceed, as the estimated improvement in the integrated value is negative at −EUR 5 billion. Unilever, who applied the IPV rule, was successful in blocking the merger.
Beyond this numerical example of the Unilever–Kraft Heinz case, empirical evidence is emerging that companies are valuing social and environmental values in M&A. Gomes and Marsat (2018) investigated whether corporate social responsibility (CSR) was valued by strategic acquirers in M&A. CSR is a proxy for  S E V  in our model. In an empirical sample of 588 international deal offers over the 2003 to 2014 period, Gomes and Marsat (2018) found that CSR was positively linked to bid premiums. This suggests that companies are prepared to pay more to acquire a sustainable company, which is in line with the prediction of our model.
Following Section 4.3, we provide a numerical example of a steel company that considered a multi-year investment programme to green its production facilities (moving from coal to hydrogen as its energy source). The steelmaker has the opportunity to make an annual investment of EUR 3 billion for four years, which reduces carbon emissions by 10 million tons on an annual basis over the new facility’s lifetime of 20 years. The relevant price for financial decision making (FV) is the market price of carbon (in the European Emissions Trading System—ETS) of EUR 80 per ton CO2. The relevant price for calculating the environmental value (EV) is the shadow carbon price of EUR 204 per ton of CO2 (see Section 3.1 on carbon prices).
Table 2 shows the results. The NPV of the investment programme is −EUR 4.2 billion, which is a combination of the present value of the annual investments of −EUR 9.9 billion and the present value of avoided carbon taxes on saved emissions of EUR 5.8 billion. A financially minded steelmaker applying the NPV rule would not green its production facilities. By contrast, the IPV rule yields a value of EUR 10.6 billion, based on a financial value of −EUR 4.2 billion and an environmental value of EUR 14.7 billion (which is the present value of the saved carbon emissions at the shadow carbon price).6 A responsible steelmaker applying the IPV rule would green its steel factory. The different investment decision rules thus lead to different outcomes.
We also provide some anecdotal evidence. Shell, one of the major oil companies, has a negative environmental value because of the carbon emissions of its main products, oil and gas. This negative environmental value outweighs its positive financial value (profits). Acquisitions of green energy companies, with a simultaneous divestment of the exploration of new oil and gas, can reduce this negative value. An example of this potential was the possible acquisition in 2019 of Eneco, an energy utility company with a green strategy. With a reasonably high beta ( β 0 ) in our investment decision rule, Shell would have achieved a relatively high valuation of Eneco, because Eneco would have reduced Shell’s negative environmental value score. However, Shell applied its traditional financial analysis model based on using the NPV rule (with  β = 0 ) and applying the relatively high discount factor of the oil industry, resulting in a relatively low valuation of Eneco. As a result, Japan’s Mitsubishi was able to acquire Eneco with a higher bid, and Shell continued to focus its investments on oil and gas explorations (Grol 2020).
There is also evidence that some oil companies are changing their investment portfolios through annual investments. TotalEnergies, a French oil company, is building up a portfolio of renewable energy projects, while maintaining its fossil fuel investments.7 TotalEnergies thus implicitly applies  β I 0  in its annual investment programme, but is not yet tilting its investments,  β I β ,  towards renewables to correct for past fossil fuel investments.
Volkswagen serves as an example of a company that is tilting its investments towards electric driving. Facing strong competition from Tesla, Volkswagen has set up an ambitious investment programme for the production of electric vehicles to catch up and not lose out on the transition to electric driving (Kurznack et al. 2024).
Earlier studies on incorporating social and environmental factors in corporate finance focused on the cost of capital (the denominator of the present value equation) instead of the value flows (the nominator) as we do. In a seminal article, Chava (2014) found that banks charge companies with environmental concerns around 25 bps more than companies without environmental concerns. Taking Chava’s average loan size of USD 568 million, this would amount to cost savings of around USD 1.4 million on an annual basis for a responsible company. The inclusion of social and environmental values in our previous examples led to far greater changes in company valuations than these minor changes in the cost of capital.

5.2. Extensions of the Decision Model

Our basic decision model lumps social and environmental values together in the variable  S E V . The model can be made multidimensional by separating the social value and environmental value. This would also allow companies to set different preferences for social and environmental values. In line with Rawl’s rights approach, companies can apply the difference principle. The difference principle permits inequalities in the distribution of goods, only if those inequalities benefit the worst-off members of society (Rawls 1971). In our investment decision model, this means that  S E V  would be overweighted (that is  β > 1 ) if a company’s social and environmental stakeholders were worse off than its financial stakeholders.
Another method is to work with differing discount rates. In our basic model, we applied constant discount rates across past and current investments and also across financial value and social and environmental values. Several authors (e.g., Gollier 2012; Dasgupta 2021) argue that a social discount rate should be used for societal projects, which include investments that address social and environmental externalities. Estimates for the social discount rate range from 1% to 3%, which is substantially lower than the financial discount rate. A lower social discount rate would lead to a higher  S E V , which in turn would lead to more investments in  S E V  (provided that  β > 0 ).

6. Conclusions

The traditional NPV rule fits with the prevailing shareholder value model that ignores social and environmental externalities. But, these externalities cannot be separated from companies’ activities. This raises the following question: to what extent can companies address these externalities? The new shareholder welfare model of Hart and Zingales (2017, 2022) and the integrated value model of Schoenmaker and Schramade (2023) aim to address these externalities, but they have not yet been transferred to new investment decision rules. This article derived an integrated present value (IPV) rule and introduced a preference,  β , for social and environmental values. The recent advances in impact measurement and valuation methods allowed us to calculate a company’s social and environmental values. The company’s board set  β  in discussion with its shareholders or stakeholders.
The basic IPV decision rule is relatively straightforward for new investments. A tilting factor can be added to correct for past underattention to social and environmental values. Another extension is to apply differing discount rates for financial value and social and environmental values. Given that the social discount rate for the latter is lower than the financial discount rate for the former, investments in social and environmental values are further increased. This article shows that including social and environmental factors in standard corporate finance methods results in more sustainable outcomes. These better outcomes can be achieved by adjusting a company’s investment decision rules for annual investments and M&A transactions.
There are also limitations. The measurement and valuation of social and environmental impacts are works in progress. Not all impacts can be measured (yet) and presented in monetary terms in a reliable way. However, the methods and data will improve over time. Further research should be performed on the foundations of corporate finance. The shareholder value paradigm (with its single focus on financial value) is enshrined in corporate finance theory and practice. Changing this leading paradigm is the ultimate challenge for adopting our newly proposed investment decision model and other new corporate finance practices.

Author Contributions

Conceptualization, D.S. and W.S.; methodology, R.d.A.T. and D.S.; formal analysis, R.d.A.T., D.S. and W.S.; investigation, W.S.; writing—original draft preparation, D.S.; writing—review and editing, W.S.; visualization, R.d.A.T. All authors have read and agreed to the published version of the manuscript.

Funding

This research received no external funding.

Informed Consent Statement

Not applicable.

Data Availability Statement

No new data were created or analyzed in this study. Data sharing is not applicable to this article.

Conflicts of Interest

The authors declare no conflicts of interest.

Notes

1
The IFRS created an International Sustainability Standards Board, which has issued two IFRS Sustainability Disclosure Standards.
2
See Chapter 19 of Schoenmaker and Schramade (2023).
3
Applying the so-called ‘veil of ignorance’, Rawls (1971) argues further that any deviation of a fair distribution should benefit the least advantaged.
4
See Schoenmaker and Schramade (2023) for an expanded set of social factors (covering labour practices, combatting poverty and interaction with local communities) and environmental factors (covering pollution and use of scarce resources).
5
The non-profit with limited means would maximise SEV under the constraint FV ≥ 0. This is at the point where the company value frontier crosses the SEV-axis on the right, which means that F = 0.
6
Carbon prices enter the valuation twice—for calculating FV and EV. The ETS carbon tax incentivises the company to change behaviour and switch to low-carbon technologies reducing the negative EV. In the case of the company reducing carbon emissions, FV improves (by avoiding costly carbon taxes) and EV improves (by reducing carbon emissions). This should not be seen as double counting.
7

References

  1. Azar, José, Miguel Duro, Igor Kadach, and Gaizka Ormazabal. 2021. The big three and corporate carbon emissions around the world. Journal of Financial Economics 142: 674–96. [Google Scholar] [CrossRef]
  2. Barby, Clara, Richard Barker, Ronald Cohen, Robert Eccles, Christian Heller, Colin Mayer, Bruno Roche, George Serafeim, Judith Stroehle, Rupert Younger, and et al. 2021. Measuring Purpose: An Integrated Framework. Working Paper. Available online: https://ssrn.com/abstract=3771892 (accessed on 17 February 2024).
  3. Bebchuk, Lucian, and Roberto Tallarita. 2021. The Illusory Promise of Stakeholder Governance. Cornell Law Review 106: 91–178. [Google Scholar] [CrossRef]
  4. Chava, Sudheer. 2014. Environmental externalities and cost of capital. Management Science 60: 2223–47. [Google Scholar] [CrossRef]
  5. Cone Communications. 2017. 2017 Cone Communications—CSR Study. Boston: Cone Communications. [Google Scholar]
  6. Cornell, Bradford, and Alan C. Shapiro. 2021. Corporate stakeholders, corporate valuation and ESG. European Financial Management 27: 196–207. [Google Scholar] [CrossRef]
  7. Dasgupta, Partha. 2021. The Economics of Biodiversity: The Dasgupta Review. London: HM Treasury. [Google Scholar]
  8. De Adelhart Toorop, Reinier, Jennifer Kuiper, Valeriu Hartanto, and Adrian de Groot Ruiz. 2019. Framework for Impact Statements, Beta Version. Amsterdam: Impact Institute. [Google Scholar]
  9. Deegan, Craig. 2019. Legitimacy theory. Despite its enduring popularity and contribution, time is right for a necessary makeover. Accounting, Auditing and Accountability Journal 32: 2307–29. [Google Scholar]
  10. Demuijnck, Geert, and Björn Fasterling. 2016. The Social License to Operate. Journal of Business Ethics 136: 675–85. [Google Scholar] [CrossRef]
  11. Ding, Ashley, Dan Daugaard, and Martina K. Linnenluecke. 2020. The future trajectory for environmental finance: Planetary boundaries and environmental, social and governance analysis. Accounting & Finance 60: 3–14. [Google Scholar]
  12. Dixit, Avinash, and Robert Pindyck. 1994. Investment under Uncertainty. Princeton: Princeton University Press. [Google Scholar]
  13. Dyck, Alexander, Karl Lins, Lukas Roth, and Hannes Wagner. 2019. Do institutional investors drive corporate social responsibility? International evidence. Journal of Financial Economics 131: 693–714. [Google Scholar] [CrossRef]
  14. Dyllick, Thomas, and Katrin Muff. 2016. Clarifying the meaning of sustainable business: Introducing a typology from business-as-usual to true business sustainability. Organization & Environment 29: 156–74. [Google Scholar]
  15. Edmans, Alex. 2020. Grow the Pie: How Great Companies Deliver Both Purpose and Profit. Cambridge: Cambridge University Press. [Google Scholar]
  16. Freeman, R. Edward. 1984. Strategic Management. A Stakeholder Approach. Boston: Pitman. [Google Scholar]
  17. Friedman, Milton. 1970. The social responsibility of business is to increase its profits. New York Times Magazine, September 13. [Google Scholar]
  18. Gollier, Christian. 2012. Pricing the Planet’s Future. Princeton: Princeton University Press. [Google Scholar]
  19. Gomes, Mathieu, and Sylvain Marsat. 2018. Does CSR impact premiums in M&A transactions? Finance Research Letters 26: 71–80. [Google Scholar]
  20. Grol, Carol. 2020. Waarom greep Shell mis bij de verkoop van Eneco? (Why did Shell go wrong with the sale of Eneco?). Het Financieele Dagblad, January 7. [Google Scholar]
  21. Harclerode, Melissa A., Pankaj Lal, and Michael E. Miller. 2016. Quantifying global impacts to society from the consumption of natural resources during environmental remediation activities. Journal of Industrial Ecology 20: 410–22. [Google Scholar] [CrossRef]
  22. Hart, Oliver, and Luigi Zingales. 2017. Companies Should Maximize Shareholder Welfare Not Market Value. Journal of Law, Finance, and Accounting 2: 247–75. [Google Scholar] [CrossRef]
  23. Hart, Oliver, and Luigi Zingales. 2022. The New Corporate Governance. University of Chicago Business Law Review 1: 195–216. [Google Scholar]
  24. Husted, Bryan W., and José de Jesus Salazar. 2006. ‘Friedman seriously: Maximizing profits and social performance. Journal of Management Studies 43: 75–91. [Google Scholar] [CrossRef]
  25. Impact Economy Foundation (IEF). 2022. Impact-Weighted Accounts Framework. Amsterdam: Impact Economy Foundation. [Google Scholar]
  26. Impact Institute. 2020. Integrated Profit & Loss Assessment Methodology (IAM): Core. Version 1.0. Amsterdam: Impact Institute. [Google Scholar]
  27. Kaplan, Robert, and David Norton. 1996. The Balanced Scorecard: Translating Strategy into Action. Boston: Harvard Business School Press. [Google Scholar]
  28. Kim, Yeuseung. 2021. Certified corporate social responsibility? The current state of certified and decertified B Corps. Corporate Social Responsibility & Environmental Management 28: 1760–68. [Google Scholar]
  29. Krueger, Philipp, Daniel Metzger, and Jiaxin Wu. 2022. The Sustainability Wage Gap. Working Paper. Available online: https://ssrn.com/abstract=3672492 (accessed on 17 February 2024).
  30. Kuh, Thomas, Andre Shepley, Greg Bala, and Michael Flowers. 2020. Dynamic Materiality: Measuring What Matters. San Francisco: Truvalue Labs. [Google Scholar]
  31. Kurznack, Lars, Dirk Schoenmaker, and Willem Schramade. 2024. A Model of Long-Term Value Creation. Journal of Sustainable Finance & Investment, 1–19. [Google Scholar] [CrossRef]
  32. Mayer, Colin. 2018. Prosperity: Better Business Makes the Greater Good. Oxford: Oxford University Press. [Google Scholar]
  33. Räsänen, Pirjo, Eija Roine, Harri Sintonen, Virpi Semberg-Konttinen, Olli-Pekka Ryynänen, and Risto Roine. 2006. Use of quality-adjusted life years for the estimation of effectiveness of health care: A systematic literature review. International Journal of Technology Assessment in Health Care 22: 235–41. [Google Scholar] [CrossRef]
  34. Rawls, John. 1971. Theory of Justice. Cambridge: Harvard University Press. [Google Scholar]
  35. Richardson, Katherine, Will Steffen, Wolfgang Lucht, Jørgen Bendtsen, Sarah E. Cornell, Jonathan F. Donges, Markus Drüke, Ingo Fetzer, Govindasamy Bala, Werner von Bloh, and et al. 2023. Earth beyond six of nine planetary boundaries. Science Advances 9: 2458. [Google Scholar] [CrossRef]
  36. Schoenmaker, Dirk, and Willem Schramade. 2022. Valuing Companies in Transition. Sustainability Letters 1: 1–12. [Google Scholar] [CrossRef]
  37. Schoenmaker, Dirk, and Willem Schramade. 2023. Corporate Finance for Long-Term Value. Berlin and Heidelberg: Springer. [Google Scholar]
  38. Schoenmaker, Dirk, Willem Schramade, and Jaap Winter. 2023. Corporate Governance Beyond the Shareholder and Stakeholder Model. Erasmus Law Review 16: 27–35. [Google Scholar] [CrossRef]
  39. Serafeim, George, T. Robert Zochowski, and Jennifer Downing. 2019. Impact-Weighted Financial Accounts: The Missing Piece for an Impact Economy. White Paper. Boston: Harvard Business School. [Google Scholar]
  40. Sidgwick, Henry. 1907. The Methods of Ethics, 7th ed. London: Macmillan and Company. [Google Scholar]
  41. Stiglitz, Joseph E., Amartya Sen, and Jean-Paul Fitoussi. 2009. Report by the Commission on the Measurement of Economic Performance and Social Progress. Stiglitz Report. Paris. [Google Scholar]
  42. Tirole, Jean. 2001. Corporate Governance. Econometrica 69: 1–35. [Google Scholar] [CrossRef]
  43. Wilburn, Kathleen M., and Ralph Wilburn. 2011. Achieving social license to operate using stakeholder theory. Journal of International Business Ethics 4: 3–16. [Google Scholar]
Figure 1. Company value frontier.
Ijfs 12 00024 g001
Figure 2. Dynamic company value frontiers. Note: BAU = business as usual.
Ijfs 12 00024 g002
Table 1. Estimated synergies for Kraft Heinz–Unilever takeover (in EUR billions).
Value DimensionSynergies
Financial value (FV)46
Social value (SV)−38
Environmental value (EV)−13
Integrated present value (IPV)−5
Source: Chapter 18 in Schoenmaker and Schramade (2023).
Table 2. Present value of the steelmaker’s annual investments (in EUR billions).
Value DimensionPresent Value
Financial value (FV)−4.2
 •
Annual investment
−9.9
 •
Saved emissions
5.8
Environmental value (EV)14.7
Integrated present value (IPV)10.6
Investment details
 •
Investment of EUR 3 billion in years 1 to 4.
 •
Emissions savings of 10 million tons of CO2 in years 5 to 24.
 •
Market price of carbon is EUR 80 per ton CO2.
 •
Shadow price of carbon is EUR 204 per ton CO2.
 •
Discount rate is 8%.
Disclaimer/Publisher’s Note: The statements, opinions and data contained in all publications are solely those of the individual author(s) and contributor(s) and not of MDPI and/or the editor(s). MDPI and/or the editor(s) disclaim responsibility for any injury to people or property resulting from any ideas, methods, instructions or products referred to in the content.

