Article

Enhancing Financial Fraud Detection through Addressing Class Imbalance Using Hybrid SMOTE-GAN Techniques

School of Computer Science, University of Nottingham Ningbo China, Ningbo 315100, China
*
Author to whom correspondence should be addressed.
Int. J. Financial Stud. 2023, 11(3), 110; https://doi.org/10.3390/ijfs11030110
Submission received: 27 July 2023 / Revised: 29 August 2023 / Accepted: 1 September 2023 / Published: 5 September 2023

Abstract

:
The class imbalance problem in finance fraud datasets often leads to biased prediction towards the nonfraud class, resulting in poor performance in the fraud class. This study explores the effects of utilizing the Synthetic Minority Oversampling TEchnique (SMOTE), a Generative Adversarial Network (GAN), and their combinations to address the class imbalance issue. Their effectiveness was evaluated using a Feed-forward Neural Network (FNN), Convolutional Neural Network (CNN), and their hybrid (FNN+CNN). This study found that regardless of the data generation techniques applied, the classifier’s hyperparameters can affect classification performance. The comparisons of various data generation techniques demonstrated the effectiveness of the hybrid SMOTE and GAN, including SMOTified-GAN, SMOTE+GAN, and GANified-SMOTE, compared with SMOTE and GAN. The SMOTified-GAN and the proposed GANified-SMOTE were able to perform equally well across different amounts of generated fraud samples.

1. Introduction

The financial sector faces a significant challenge in the form of financial fraud, encompassing various forms of criminal deception aimed at securing financial gains, including activities like telecommunication fraud and credit card skimming. The proliferation of electronic payment technology has propelled online transactions into the mainstream, thereby amplifying the occurrence of fraudulent schemes. The prevalence of these fraudulent transactions has led to substantial losses for financial institutions. However, the large daily transactions pose a challenge for humans in manually identifying fraud. Recently, deep learning techniques have been explored and have shown promising results in detecting financial fraud Alarfaj et al. (2022); Fang et al. (2021); Kim et al. (2019). Unfortunately, most real-world financial fraud datasets suffer from a severe class imbalance issue, where the fraud data’s proportion is significantly lower than that of nonfraud. In binary classification, class imbalance often leads to biased predictions favoring the majority class Johnson and Khoshgoftaar (2019). Consequently, the classifier’s performance on the minority class is compromised, especially when encountering dissimilar frauds. Overcoming this problem poses a significant challenge, as classifiers are expected to achieve high precision and recall in fraudulent class.
To address this problem, several oversampling methods have been employed to generate minority samples. Synthetic Minority Oversampling TEchnique (SMOTE) interpolates between the existing minority data to synthesize minority samples Chawla et al. (2002). Generative Adversarial Networks (GANs) comprise a discriminator that aims to differentiate between real and generated samples and a generator that strives to deceive the discriminator by synthesizing realistic samples Goodfellow et al. (2014). GANs have shown superior results compared with SMOTE Fiore et al. (
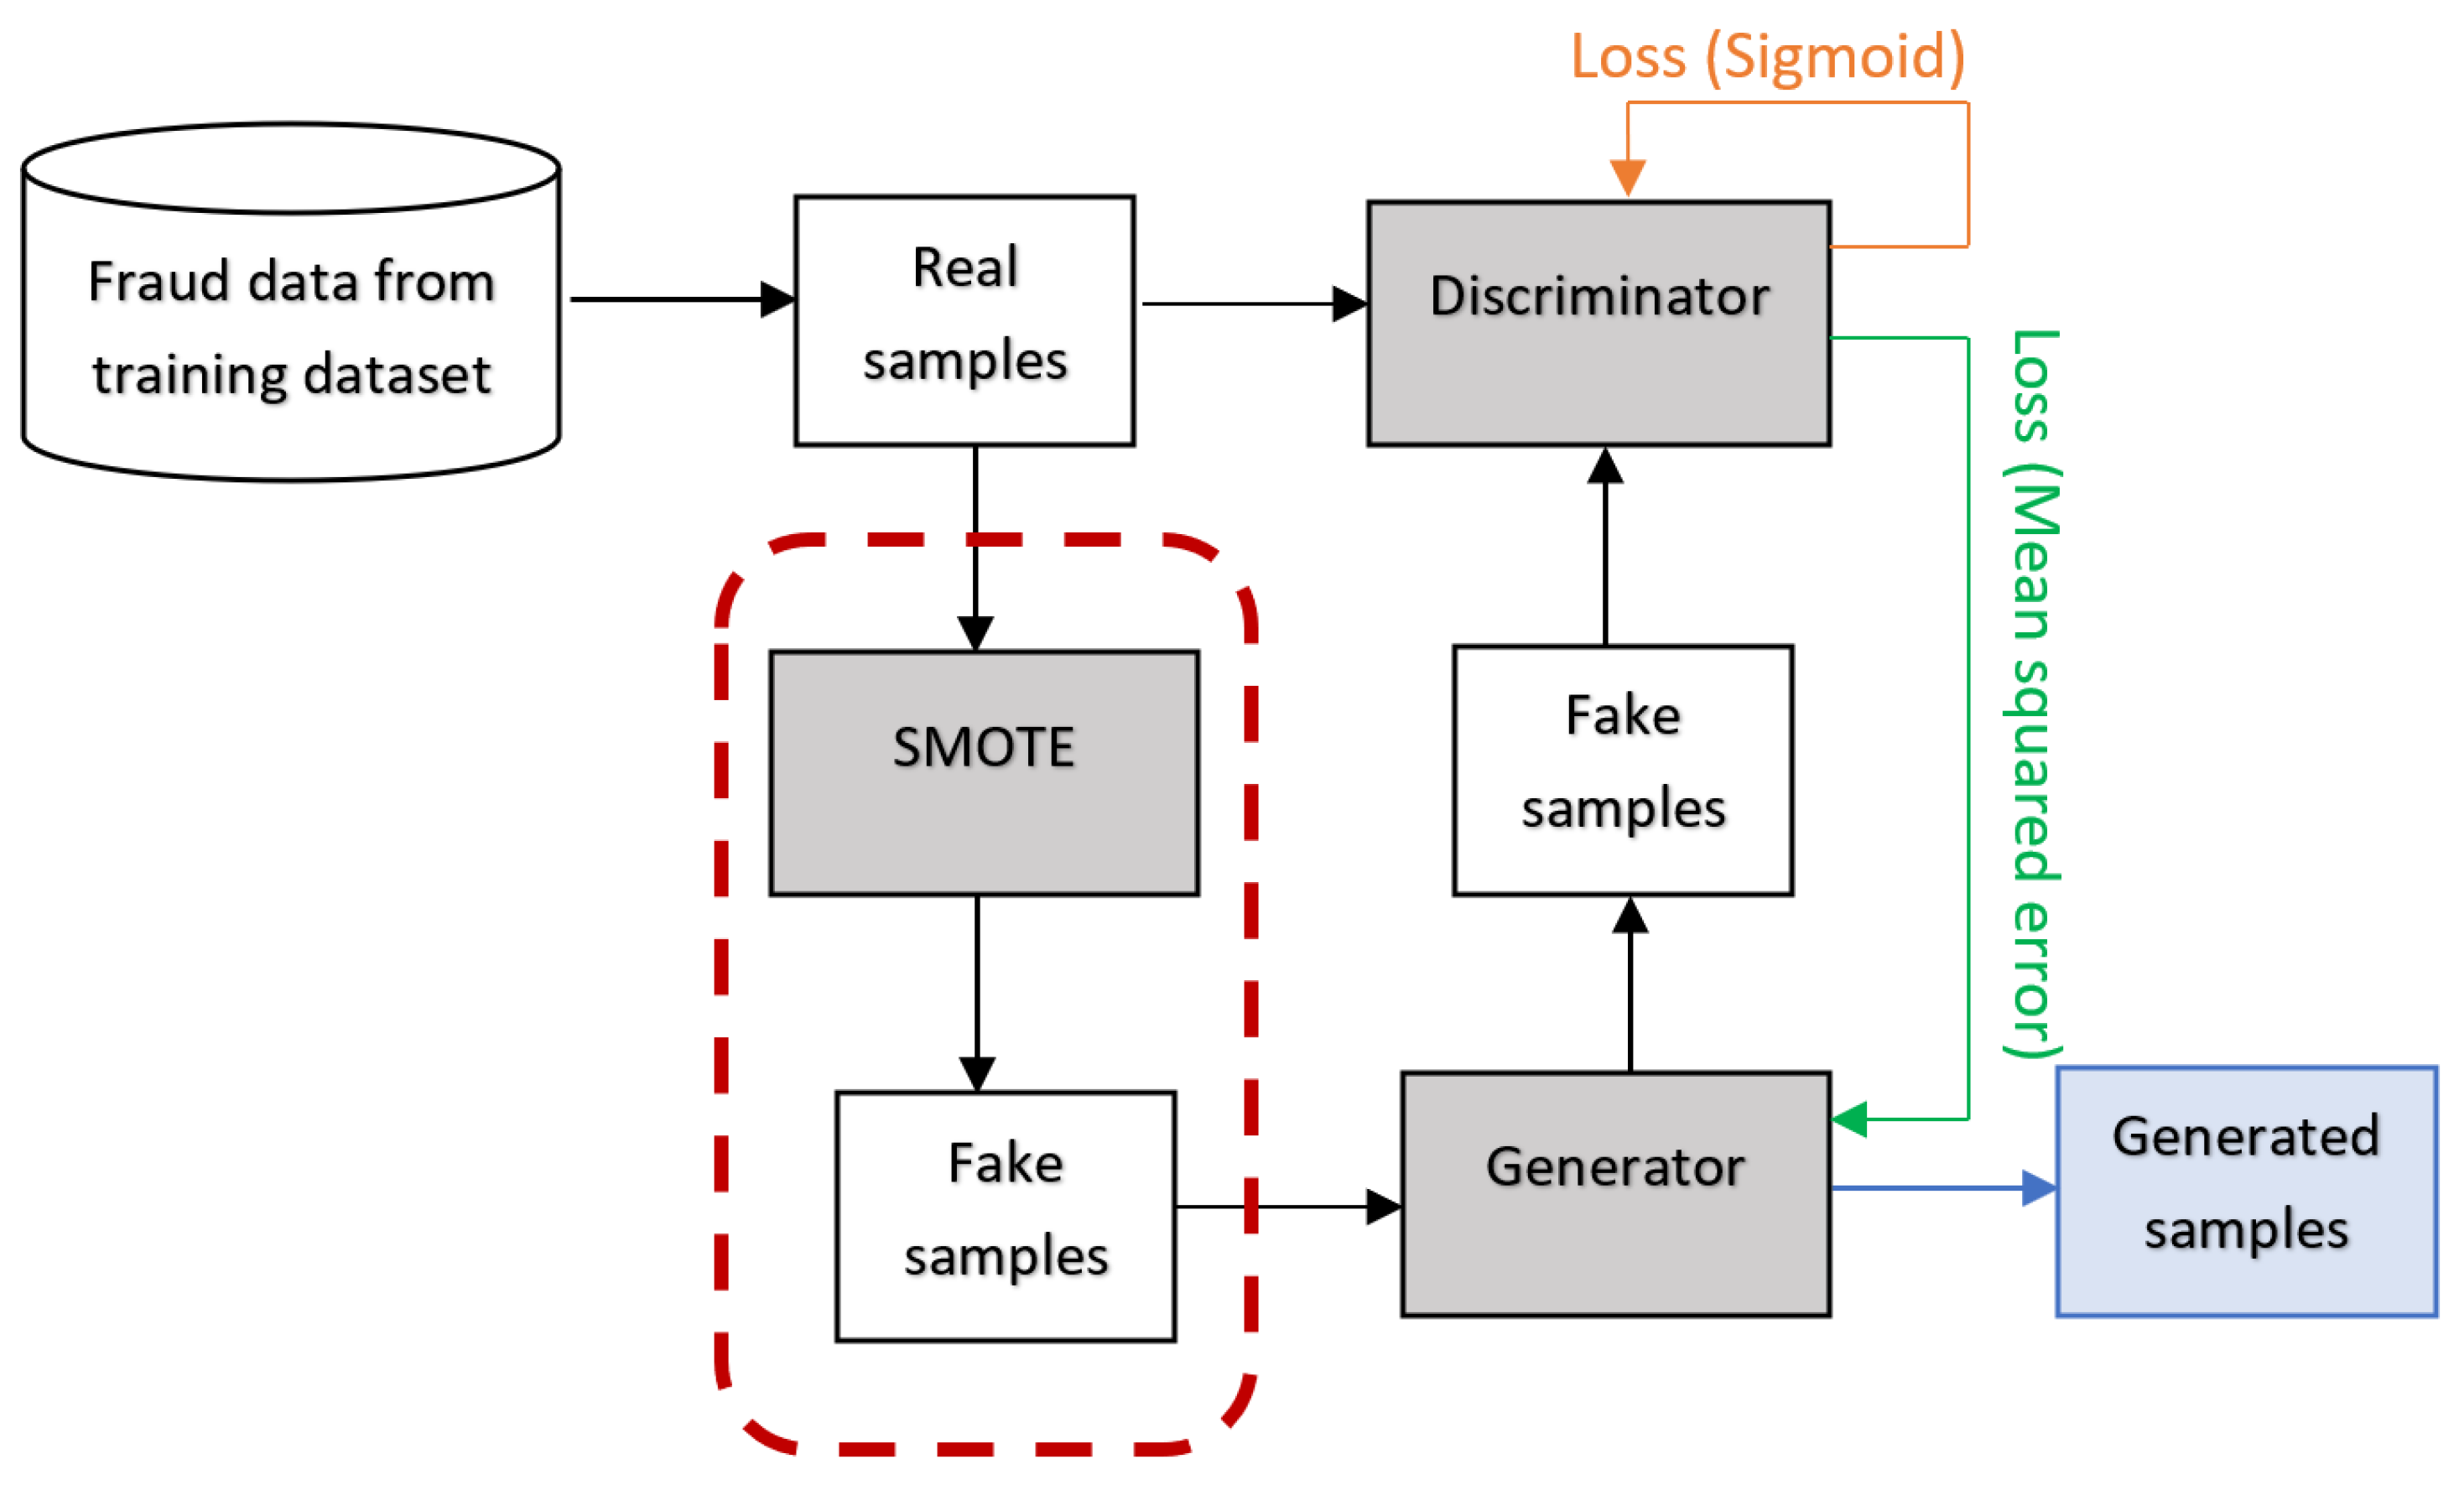
2019). However, SMOTE may cause overgeneralization issues. GAN, primarily designed for image generation, is not ideal for handling the class imbalance problem. To overcome these limitations, SMOTified-GAN employs SMOTE-generated samples instead of random noises as input to the GAN Sharma et al. (2022).
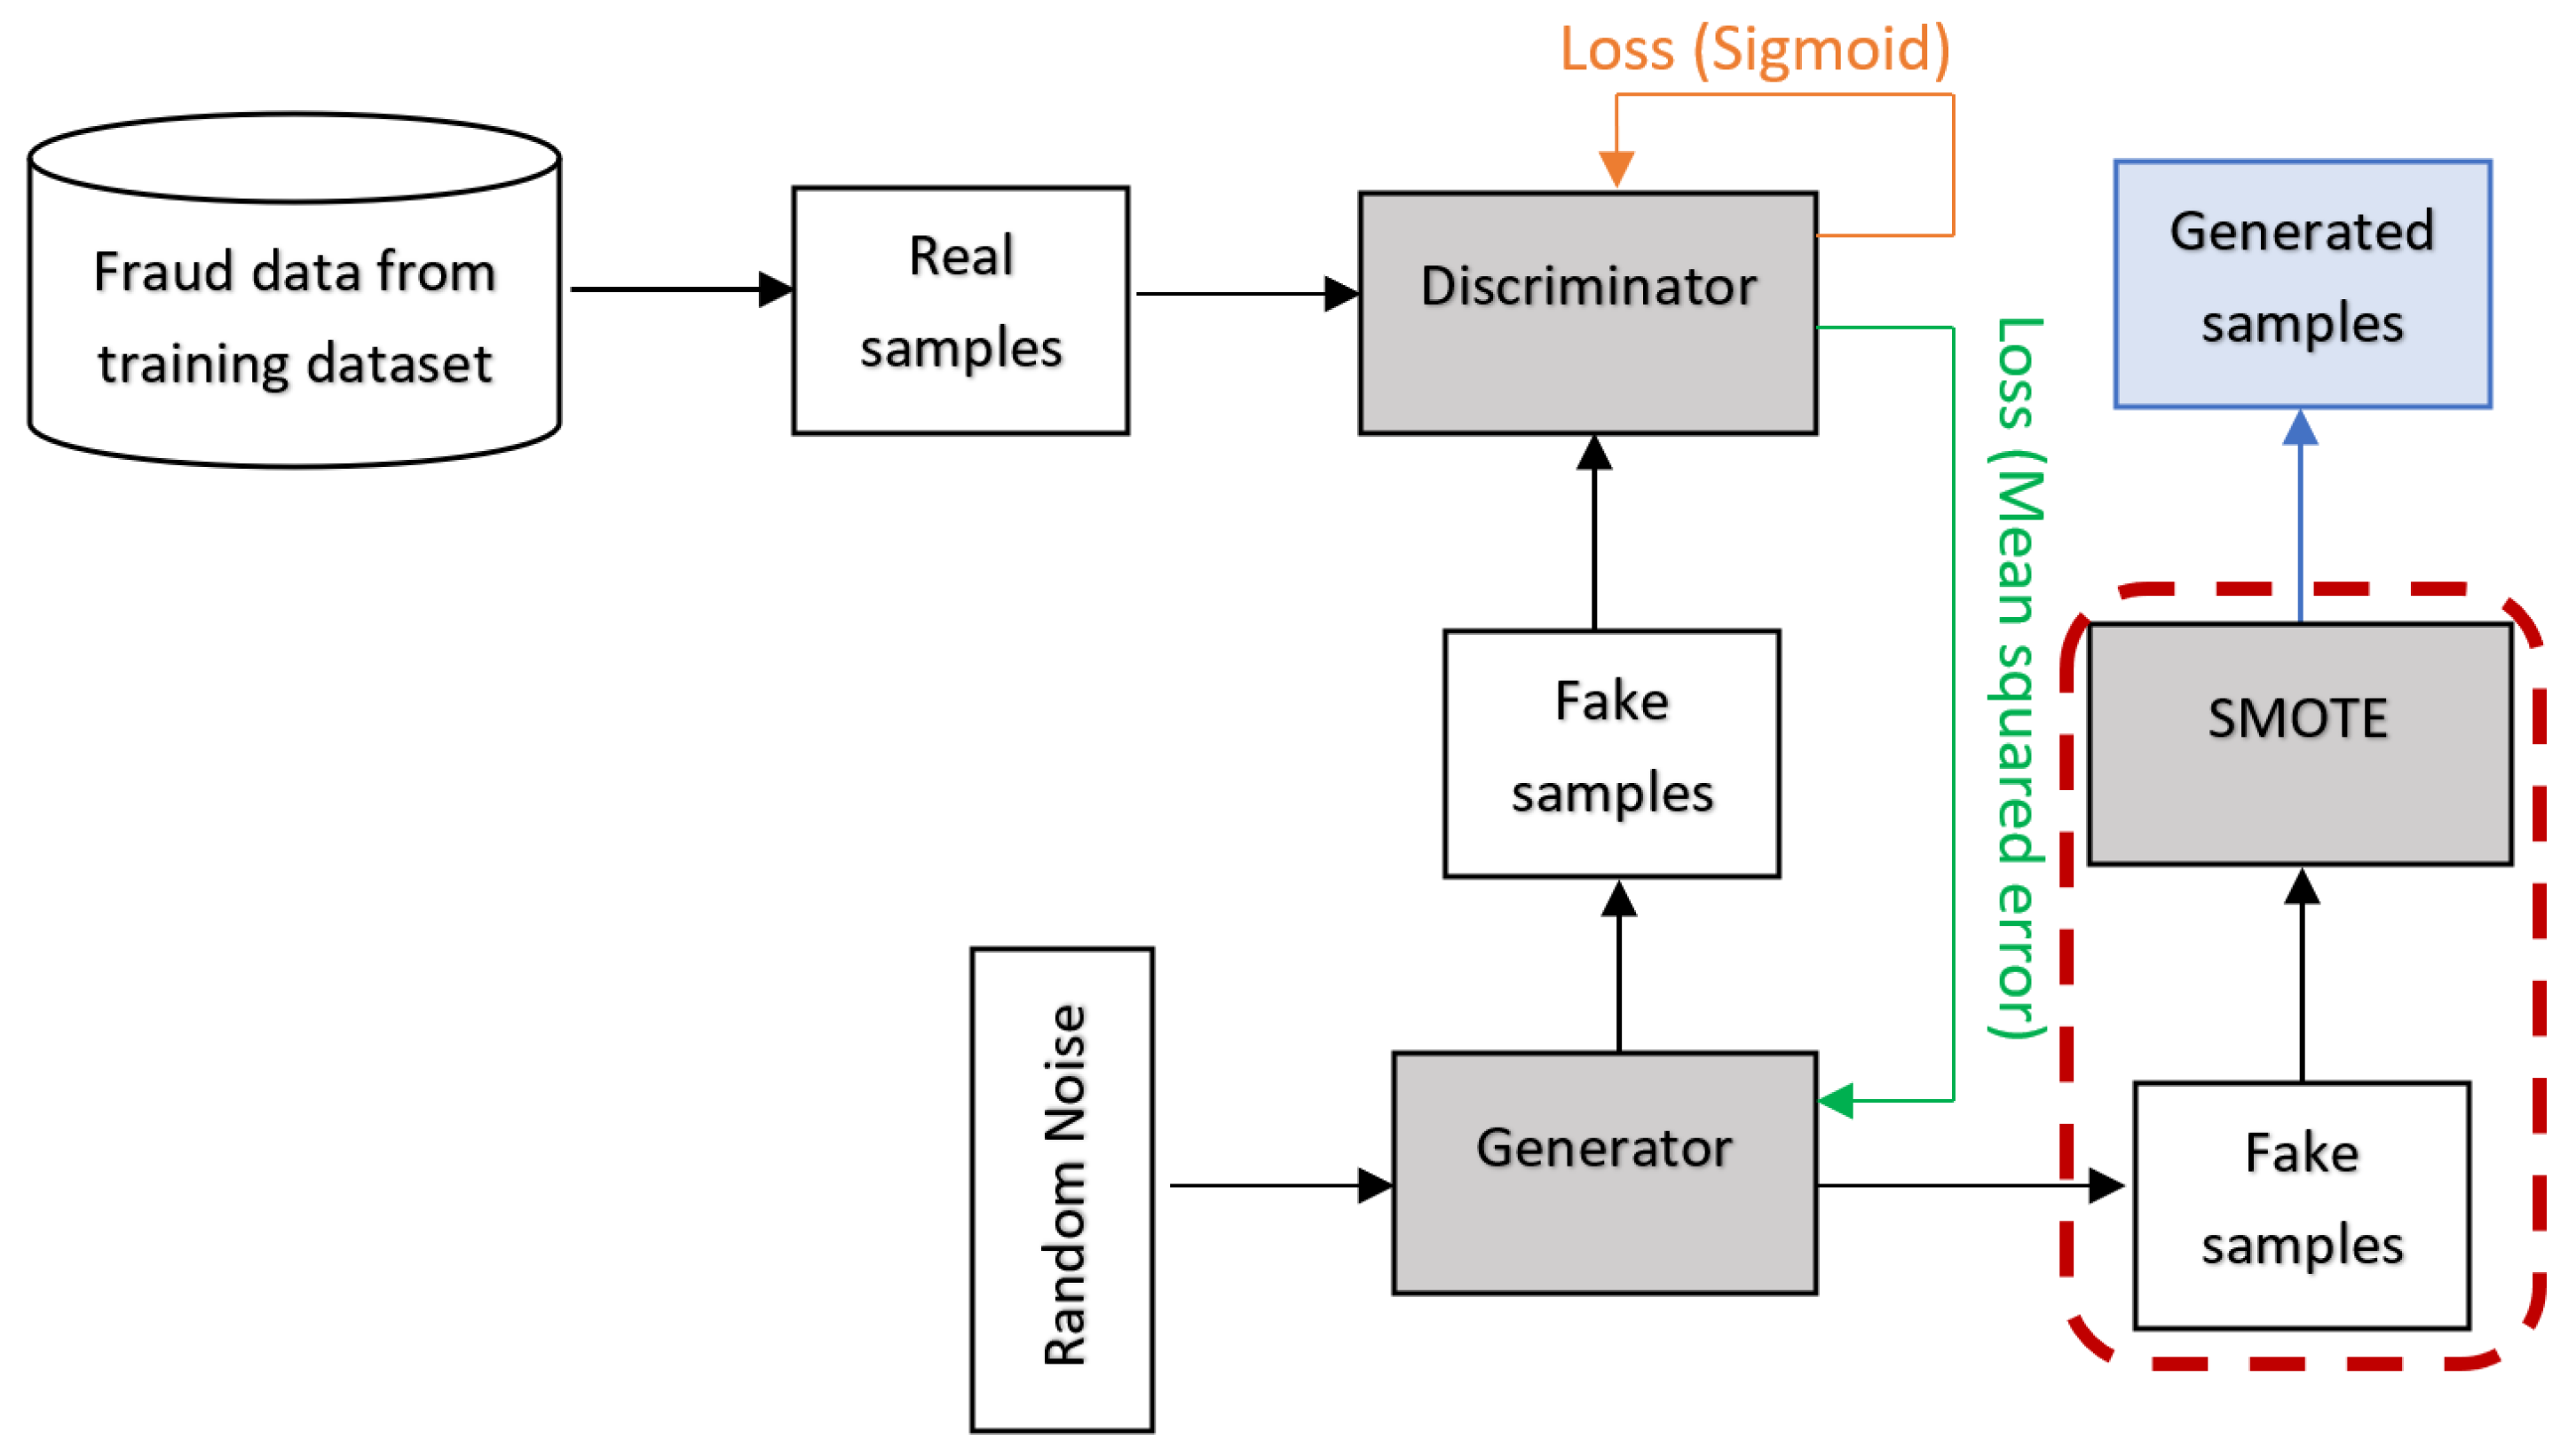
In addition to the aforementioned data generation techniques, other hybrids of SMOTE and GAN are worth exploring. This study presents the following contributions:
  • Introducing two data generation techniques, SMOTE+GAN and GANified-SMOTE, designed to effectively address the class imbalance issue in finance fraud detection.
  • Conducting a comprehensive comparison between the proposed oversampling methods and existing data generation techniques, utilizing precision, recall, and F1-score as key performance metrics.
  • Evaluating the performance of the data generation techniques across various neural network architectures, including a Feed-forward Neural Network (FNN), Convolutional Neural Network (CNN), and the proposed hybrid FNN+CNN.
  • Analyzing the impact of training classifiers on different proportions of the generated minority samples.

2. Related Work

The task of detecting financial fraud can be approached as a binary classification challenge, where classifiers examine the patterns within fraudulent and legitimate transactions to classify new transactions accurately. Consequently, it is crucial to possess an ample and diverse dataset to enable classifiers to grasp the inherent patterns of both transaction categories. Addressing the issue of inadequate fraudulent samples in the training dataset, various methodologies have been introduced to create artificial fraud instances and supplement the original data. These techniques include SMOTE, GAN, and SMOTified-GAN.
SMOTE Chawla et al. (2002) has been widely applied to imbalanced training datasets. More than 85 SMOTE variations were proposed by 2018, including SMOTE+TomekLinks, SMOTE+ENN, Borderline-SMOTE, and Adaptive Synthetic Fernández et al. (2018). Recent studies proposed Radius-SMOTE Pradipta et al. (2021), which prevents overlap among generated samples, and Reduced-Noise SMOTE Arafa et al. (2022), which removes noise after oversampling. In financial fraud detection, SMOTE and its variations have been widely utilized to resample highly imbalanced datasets before training models such as AdaBoost Ileberi et al. (2021) and FNN Fang et al. (2021). Besides the finance domain, SMOTE and its variations have found extensive application in other fields dealing with highly imbalanced datasets. In bio-informatics, SMOTE has been used to discriminate Golgi proteins Tahir et al. (2020) and predict binding hot spots in protein–RNA interactions Zhou et al. (2022). In medical diagnosis, SMOTE and its variations have been employed for diagnosing cervical cancer Abdoh et al. (2018) and prostate cancer Abraham and Nair (2018). SMOTE has also been used to predict diabetes Mirza et al. (2018) and heart failure patients’ survival Ishaq et al. (2021).
GANs Goodfellow et al. (2014) and their variations have more recently been employed for generating minority samples to tackle the class imbalance problem. Douzas and Bacao (2018) utilized a conditional GAN (cGAN) which can recover the distribution of training data to generate minority samples. To address the mode collapse issue, Balancing GAN was proposed to generate more diverse and higher-quality minority images Mariani et al. (2018). However, in this technique, the generator and discriminator cannot simultaneously reach their optimal states, leading to the development of IDA-GAN Yang and Zhou (2021). In financial fraud detection, GAN has been employed to generate fraud samples for imbalanced datasets before training classifiers, such as AdaBoost-Decision Tree Mo et al. (2019) and FNN Fiore et al. (2019). These studies have reported that the GAN achieves higher AUC, accuracy, and precision compared with SMOTE. Interestingly, Fiore et al. (2019) found that the best performance was achieved when twice as many GAN-generated fraud samples as the original fraud data were added to the training dataset. In other finance-related domains, GANs have been utilized to address class imbalance in money laundering detection in gambling Charitou et al. (2021). GANs and their variations have also been used extensively for high-dimensional imbalanced datasets, such as images Mariani et al. (2018); Scott and Plested (2019) and biomedical data Zhang et al. (2018). Recent studies have successfully applied GANs and their variations to generate minority samples in bio-informatics Lan et al. (2020).
Despite the notable accomplishments of SMOTE and GAN, these methods have certain limitations. SMOTE may introduce noise that leads to overgeneralization Bunkhumpornpat et al. (2009). While GANs can generate more “realistic” data, they may not be ideal for handling imbalanced data, as it was originally designed for generating images using random noise. Additionally, there may be insufficient real minority data available for training the GAN Mariani et al. (2018). To address these limitations, Sharma et al. (2022) proposed SMOTifed-GAN, which employs SMOTE-generated samples as input for GAN instead of random numbers, resulting in improved performance compared with SMOTE and GAN.
In early studies, financial fraud detection systems predominantly depended on rule-based methodologies, wherein human expertise in fraud was translated into rules to anticipate fraudulent activities Zhu et al. (2021). However, the evolving behaviors of fraudsters and the increasing size of transaction datasets have posed challenges in identifying fraud-related rules manually. As a result, research has shifted towards machine learning methods, such as naive Bayes, logistic regression, support vector machine, random forest, and decision tree (Ileberi et al. 2021; Ye et al. 2019; Zhu et al. 2021), which can “learn” fraud and nonfraud patterns from given datasets. Nonetheless, machine learning techniques require extensive data preprocessing before training the classifier Alarfaj et al. (2022); Kim et al. (2019); Zhu et al. (2021).
In recent years, deep learning has gained popularity in financial fraud detection due to its superior performance compared with traditional machine learning approaches Alarfaj et al. (2022); Fang et al. (2021); Jurgovsky et al. (2018); Kim et al. (2019). Some studies have approached financial fraud detection as a sequence classification problem, considering the temporal sequence of transactions as a crucial factor. Sequential models, such as Gated Recurrent Units Branco et al. (2020), Long Short-Term Memory (LSTM) Jurgovsky et al. (2018), and Time-aware Attention-based Interactive LSTM Xie et al. (2022), have been proposed. However, since most available financial fraud datasets lack time-sequence information, sequential models may not be suitable in such cases. Due to the vector format of finance fraud datasets without time-sequence information, FNNs are considered a suitable choice Fang et al. (2021); Fiore et al. (2019); Kim et al. (2019). Initially designed for image processing and classification, CNNs have also been found effective in financial fraud detection Alarfaj et al. (2022); Chen and Lai (2021); Zhang et al. (2018). Their 1D convolution layers can extract patterns within smaller segments of a transaction vector.
Building on Fiore et al. (2019)’s findings, this study aimed to assess the performance of a model using varying amounts of minority samples in the training dataset. To achieve this, the study explores the use of SMOTE, GAN, SMOTified-GAN, and other variants of hybrid SMOTE and GAN. Consequently, a combination of SMOTE- and GAN-generated minority samples, along with GANified-SMOTE, was proposed to fulfill the research aims. Finally, FNN, CNN, and FNN+CNN models were employed to ensure a fair evaluation of the performances of different data generation techniques.

3. Methodology

3.1. Data Preprocessing

The experiment utilized the Kaggle (2018) credit card fraud dataset, consisting of 284,807 transactions conducted by European credit card holders over two days in September 2013. This dataset comprises 31 numerical features, including Time, Amount, Class, and 28 other unnamed features. The ‘Time’ feature represents the elapsed time in seconds since the first transaction, while the ‘Amount’ feature denotes the transaction amount. The ‘Class’ label indicates fraudulence, utilizing binary values, where 1 and 0 represent fraud and nonfraud, respectively. Notably, only 492 transactions (0.172%) are classified as fraudulent, resulting in a highly imbalanced distribution.
To facilitate gradient descent convergence and mitigate bias towards features with larger magnitudes, all features except the ‘Class’ label were rescaled to the range [ 0 , 1 ] while maintaining the original feature distribution. This rescaling process for a value X in a given feature was transformed into a new value X (see Equation (1), where X m i n and X m a x represent the minimum and maximum values of the feature, respectively) to maintain the original feature distribution.
X = X X m i n X m a x X m i n
Subsequently, the dataset was divided into a training set comprising 80% of the data (227,451 nonfraud and 394 fraud) and a testing set comprising the remaining 20% (56,864 nonfraud and 98 fraud).

3.2. Data Generation Methods

To address the issue of class imbalance, this study explored five data generation techniques: SMOTE, GAN, and their respective combinations.

3.2.1. SMOTE

SMOTE creates synthetic minority samples rather than duplicating existing ones to avoid overfitting. For a specific minority data point x represented as a vector, a vector x k is randomly chosen from its k-nearest neighbors to generate a new sample x using Equation (2). In this study, 394 instances of fraudulent data from the training dataset were utilized with the SMOTE technique, employing five nearest neighbors, to generate additional fraud samples, as depicted in Figure 1.
x = x + r a n d ( 0 , 1 ) × ( x x k )

3.2.2. GAN

A GAN comprises a generator G and a discriminator D that engage in a competitive training process to improve their respective objectives. The discriminator aims to correctly classify real samples x and fake samples generated by the G ( z ) , where z represents random noise or the latent space input to the G. The D’s predictions for real and generated samples are denoted as D ( x ) and D ( G ( z ) ) , respectively. By considering real samples with a label of 1 and generated samples with a label of 0, the D’s loss function is defined in Equation (3), where E calculates the error or distance between the D’s prediction and the true label. The G’s objective is to generate realistic fake samples from random noise that can deceive the D into misclassifying them. The G’s general loss function, defined in Equation (4), allows it to improve the quality of the generated samples based on the feedback received from the D’s classification. As the G and D continue enhancing their performance, the quality of the generated minority samples improves.
L D = E ( D ( x ) , 1 ) + E ( D ( G ( z ) ) , 0 )
L G = E ( D ( G ( z ) ) , 1 )
The proposed GAN architecture, as shown in Figure 2, consists of a 5-layer FNN G with respective neuron counts of 100, 256, 128, 64, and 30. The G takes 100 random noises sampled from a normal distribution. LeakyReLU activation function (Equation (5)) is used in all hidden layers, and dropout layers with a dropout rate of 0.2 are added after each hidden layer to mitigate overfitting. The output layer employs the sigmoid activation function (Equation (6)) to produce values between 0 and 1. Similarly, the D is a 5-layer FNN with identical activation functions and dropout layers. However, the neuron counts are 30, 128, 64, 32, and 1 for each layer. The D employs a stochastic gradient descent (SGD) optimizer with a learning rate of 0.05. The loss function depicted in Figure 2 is binary cross-entropy (Equation (7)), as the D’s task involves binary classification. The GAN network also employs an optimizer with the same learning rate as the D, but the loss function utilizes the mean squared error metric (Equation (8), where y i is the true label and y ^ i is the predicted class) as feedback for the G.
f ( x ) = m a x ( 0.1 x , x )
S ( x ) = 1 1 + e x
B i n a r y C r o s s E n t r o p y = 1 n i = 1 n [ y i · l o g ( y ^ i ) + ( 1 y i ) · l o g ( 1 y ^ i ) ]
M S E = 1 n i = 1 n ( y i y ^ i ) 2
The fraud data from the training dataset were utilized to train D, enabling it to recognize patterns in real fraud data and generate fraud samples. Since there were only 394 fraudulent data points available for training, the batch size was reduced to 32. The number of training epochs was set to 1000 to allow sufficient time for the G and D to improve their performance. Following training, the G is employed to generate fraud samples based on the required number of minority samples.

3.2.3. SMOTified-GAN

GAN can learn patterns from minority data, resulting in more authentic minority samples. However, using random noise as input for the GAN G can be seen as generating samples from scratch, making it more challenging to train the G to produce high-quality samples. By utilizing SMOTE-generated samples as input, the generation process becomes simpler as the G begins with pre-existing fraud samples (Sharma et al. 2022). In the proposed approach, SMOTE was applied with the five nearest neighbors to generate double the number of fraud samples. Figure 3 illustrates that 788 SMOTE-generated samples were used as input for the GAN G. The hyperparameters of the GAN in the SMOTified-GAN model remained the same as the regular GAN, except for the number of neurons in the input layer of the G, which was adjusted to 30 to match the 30 features present in the SMOTE-generated fraud samples.

3.2.4. SMOTE+GAN

To address the limitations of SMOTE and GAN, a hybrid approach was proposed and employed to enhance the ratio of fraudulent data in the training dataset. The SMOTE-generated and GAN-generated fraud samples were directly combined with the original training dataset without any alterations, as depicted in Figure 4. The combined dataset comprised an equal contribution from both the SMOTE- and GAN-generated samples, amounting to half of the total required generated data.

3.2.5. GANified-SMOTE

Another hybrid method, GANified-SMOTE, was implemented. The random interpolation makes SMOTE-generated samples susceptible to the noise present in the dataset. Consequently, the generated minority samples are located near the boundary of the majority class, leading to higher misclassification rates. Conversely, GAN can learn the underlying patterns of the minority class, reducing the impact of such noise. By utilizing GAN-generated data for SMOTE interpolations, the limitations of SMOTE can be overcome. Additionally, applying SMOTE on the GAN-generated data can decrease reliance on the prominent patterns of the minority class, thereby mitigating overfitting. Figure 5 illustrates the utilization of fraud samples generated by the GAN, which are then processed with SMOTE to generate the necessary number of fraud samples. The resulting output from SMOTE is combined with the original training dataset, which originally contained 394 authentic fraud data points.

3.3. Summary of Data Generation Methods

Table 1 presents an overview of the types and quantities of fraud data utilized in each data generation method. Two experiments were conducted for each method to assess the impact of varying amounts of generated data in the training dataset. In the first experiment (Test A), the training dataset was adjusted to achieve a balanced distribution of 50% fraud and 50% nonfraud samples. In the second experiment (Test B), only 788 fraud samples were generated, twice the number of the original fraud data in the training dataset. This choice was based on the finding (Fiore et al. 2019) that injecting twice as many GAN-generated fraud samples as the original fraud data produced the optimal outcome.
For both experiments, fraud samples were generated using five data generation techniques after splitting the complete dataset into training and testing sets. The testing dataset was not utilized for data generation to ensure that the validation conducted using these unseen data reflects the model’s performance when applied to real-world financial fraud detection systems, as these systems encounter unseen data.

3.4. Deep Learning Models

3.4.1. FNN

A preliminary investigation was conducted to assess several hyperparameter configurations of the FNN (Feed-forward Neural Network) along with SMOTE-generated samples to tackle the problem of class imbalance. The two most effective models were selected as classifiers to evaluate all the data generation techniques. Table 2 contains the hyperparameters used for these models. Both models employed the Rectified Linear Unit (ReLU) activation function for their hidden layers. To counter overfitting, dropout layers with a dropout rate of 0.1 were inserted after each hidden layer. The output layer utilized the sigmoid activation function to ensure that the output probabilities fall within the range of 0 to 1, representing the likelihood of a transaction being fraudulent. For the loss function, binary cross-entropy was employed. Due to the substantial size of the training dataset, a batch size of 128 was chosen, and the training process was executed over 100 epochs, allowing for multiple iterations to refine the model.

3.4.2. CNN

Similarly to the FNN, various hyperparameter configurations of the CNN were tested, and the two best-performing models were selected for further investigation. The hyperparameters for these models are presented in Table 2. Both models began with an input layer of dimensions (30, 1). Subsequently, a 1D convolutional layer and a max-pooling layer were incorporated, followed by a flattening layer and a dense layer consisting of 50 neurons, utilizing the ReLU activation function, along with a dropout layer featuring a dropout rate of 0.1. The output layer consisted of a single neuron activated by the sigmoid function. The kernel size and pool size for both models were set to 3 and 2, respectively. The initial findings indicated that the CNN models reached a stable loss and accuracy after the 50th epoch. Consequently, the number of training epochs was set to 50, providing sufficient time to refine the models and observe their performance.

3.4.3. FNN+CNN

FNN and CNN models tend to misclassify nonfraudulent transactions, while demonstrating an intuitive ability to identify the same fraudulent transactions. Consequently, this study integrated the two models to enhance the final prediction, aiming to reduce the false-positive rate within the fraud class. By leveraging the strengths of both models and combining their insights, it was anticipated that the integrated approach would yield improved accuracy and more reliable identification of fraudulent transactions.
  • Method I: The final prediction is classified as fraudulent only if both FNN and CNN predict the transaction as fraudulent. The detailed processes and decision steps of this method are depicted in Figure 6a. Both the FNN and CNN output a probability of a transaction being fraudulent, where a value greater than 0.5 is considered fraudulent. Hence, the integrated model predicted a transaction as fraudulent only if both models’ output surpassed 0.5. Intuitively, it is improbable for a nonfraudulent transaction to be classified as fraudulent by both models, given their tendency to learn distinct patterns associated with fraud and nonfraud. This integration reinforces the reliability of the fraud prediction, since it must satisfy both conditions.
  • Method II: The initial study demonstrated that the first method successfully enhanced the precision of fraud detection but resulted in a decrease in the recall. Therefore, another method was proposed to increase recall while maintaining a high precision. In certain instances, one of the models produces a value close to 1, indicating a high probability of the transaction being fraudulent. Conversely, the other model generates a value below but close to 0.5. According to the first method, these transactions would be predicted as nonfraudulent. However, intuitively, such transactions are more likely to be fraud, since one of the models strongly indicates fraud. To address this scenario, the sum of the output values from both models is utilized to make the final prediction. If the sum exceeds a selected threshold, the prediction will be fraudulent. The detailed processes and decision steps of this method are depicted in Figure 6b.

4. Results and Discussion

4.1. Deep Learning Models with SMOTE-Generated Data

In this study, two FNN and two CNN models were developed to determine the optimal configuration, and their specific hyperparameters are outlined in Table 2. The training process took place on a machine equipped with an 11th Gen Intel Core i7-11375H CPU, 16GB RAM, Intel Iris Xe Graphics, and NVIDIA GeForce RTX 3060 Laptop GPU. The training dataset consisted of an equal distribution of fraud and nonfraud data, with the fraud samples generated using the SMOTE technique (refer to Section 3.2.1). To evaluate their performance, these variations were tested on the testing dataset, and various metrics were employed, including training accuracy, loss, and time, as well as testing precision (PR), recall (RC), F1-score (F1), and root mean squared error (RMSE).
In Table 3, all the top-performing models achieved impeccable precision, recall, and F1-score ( P R = R C = F 1 = 1.00 ) for the nonfraud class, and their recalls in the fraud class were satisfactory ( R C 0.85 ) . However, their precision and F1-score in the fraud class did not meet the desired criteria. FNN1, which utilized a lower learning rate, demonstrated higher precision and F1-score compared with FNN2. Similarly, CNN2, with fewer filters, exhibited higher precision and F1-score compared with CNN1, albeit with a slightly lower precision. Consequently, FNN2 and CNN2, boasting the highest F1-score within their respective FNN and CNN models, were selected as the top-performing models for integration (FNN+CNN). It is worth noting that FNN models using the SGD optimizer yielded superior results compared with those employing Adam, while the opposite was observed for CNN. Additionally, CNN’s training time was longer than that of FNN due to the fewer epochs utilized.

4.2. Deep Learning Models with Data Generation Methods

4.2.1. FNN and CNN

This research employed four selected FNNs and CNNs to evaluate the impact and performance of the generated data. The results can be found in Table 4. When employing the identical data generation method and incorporating an equal quantity of fraudulent data, both versions of FNN and CNN yielded comparable outcomes. This demonstrates that the outcomes derived from a data generation method are not significantly influenced by the classifier’s parameters.
The FNN generally yielded a higher recall compared with the CNN, albeit with lower precision. In test A, both SMOTE and SMOTE+GAN exhibited significantly lower precision and F1-score across all models, despite demonstrating a high recall. However, there was substantial improvement observed in test B for these two methods, where synthetic fraud samples were injected at a ratio of twice the original records. Additionally, SMOTE+GAN achieved the highest F1-score in three out of four models during test B. The proposed GANified-SMOTE generally yielded slightly higher precision and F1-score than GAN, despite having a lower recall. This can be attributed to GAN’s ability to capture the original fraud data’s characteristics, resulting in the GAN-generated fraud samples being clustered in regions with a high concentration of the original fraud data. The SMOTE’s application on the GAN-generated samples generates additional fraud samples in between them, potentially causing a ‘blurring’ effect on the fraud data’s features. This could explain the generally lower recall of GANified-SMOTE in comparison with GAN. As a trade-off, GANified-SMOTE achieves a lower false positive rate, leading to higher precision compared with GAN. When compared with SMOTified-GAN, the proposed GANified-SMOTE generally demonstrated slightly lower precision and F1-score, while maintaining a similar recall. SMOTified-GAN generates fraud samples using SMOTE-generated samples as input, which can result in the production of more realistic and diverse samples. The SMOTified-GAN-generated samples tended to be more centrally distributed within fraud areas and less centrally distributed within nonfraud areas, which could explain the higher precision and F1-score observed.

4.2.2. FNN+CNN

The top-performing models from the FNN and CNN were combined to create two distinct hybrid FNN+CNN methods, as illustrated in Figure 6. The results of the FNN+CNN approach for Method I and II are depicted in Table 5. Method I exhibited improved precision for detecting fraudulent cases compared with using FNN or CNN models alone. In Test A, the SMOTE and SMOTE+GAN showed significant improvements in precision, despite a slight decrease in recall, particularly when compared with the FNN model. This decline can be attributed to the fact that fraud predictions must meet two distinct conditions, resulting in a reduced number of predicted fraud cases. Consequently, the fraud class’s precision increases, since precision is determined by the ratio of true fraud cases to predicted fraud cases. However, this trade-off leads to a decrease in the fraud class’s recall. Nevertheless, the overall F1-score exhibited a slight increase compared with the individual FNN and CNN models. In Method II, different thresholds ranging from 1.1 to 1.9 were tested to determine the optimal threshold value. Since Method II’s goal was to enhance recall, the best threshold value was determined based on recall.
Overall, Method II yielded better results than Method I. The findings demonstrated that the proposed hybrid FNN+CNN approach in Method II outperformed the FNN and CNN models individually. Similar to the observations on the FNN and CNN, injecting twice the number of fraud samples as the original fraud data using SMOTE and SMOTE+GAN yielded better performance than a 50:50 distribution of fraud and nonfraud samples. The performance of GAN, SMOTified-GAN, and GANified-SMOTE was not significantly affected by the number of injected fraud samples. The proposed GANified-SMOTE technique achieved the highest precision for both integration methods and also exhibited high F1-score and recall. This may be attributed to the pure variations in the FNN and CNN used in the hybrid model performing well with GANified-SMOTE. However, the GANified-SMOTE’s performance on the FNN and CNN variations was similar. Therefore, it can be concluded that the proposed GANified-SMOTE can achieve high performance regardless of the number of injected fraud samples.

4.3. Comparison with Existing Studies

To evaluate the proposed methodologies, a comparison was made with previous studies that utilized the same dataset, as presented in Table 6. Given the trade-off between precision and recall, attaining flawless outcomes for models, whether existing or proposed, remains elusive. The outcomes observed by (Fiore et al. 2019) and (Sharma et al. 2022) upon applying SMOTE, GAN, and SMOTified-GAN exhibited relatively modest recalls (below 0.80), indicating limited detection of fraudulent transactions. Consequently, their F1-scores generally trailed behind those of the proposed methods. This serves to illustrate the proficiency of the proposed models in effectively identifying fraudulent transactions while upholding a minimal misclassification rate for nonfraudulent data.
All the implemented techniques exhibited higher recall rates compared with the existing studies. However, this improvement came at the expense of lower precision when compared with previous research. One potential explanation for this discrepancy could be the differences in the classifiers utilized. Previous studies Fiore et al. (2019); Sharma et al. (2022) employed classifiers with less than four layers, whereas the proposed classifier consisted of at least four. Consequently, the enhanced classifier was able to better learn the distinguishing characteristics of fraudulent data, improving the identification of such instances. However, this also led to an increased misclassification of nonfraudulent data.
Another factor that could have influenced the outcomes is the stochastic nature of the SMOTE (and the GAN) and deep learning models (the FNN). Despite the lower precision, the F1-score of the proposed methodologies surpassed that of the previous studies, except for SMOTE on Test A. This observation highlights the significant impact of classifier parameters on its performance, irrespective of the data generation methods employed. This observation aligns with the previous findings, indicating an overall enhancement in the F1-score when utilizing a hybrid of FNN and CNN, regardless of the specific data generation methods employed.
Nonetheless, data generation methods can still affect the performance of the same classifier in different variations. The results from Fiore et al. (2019) and Sharma et al. (2022) demonstrated an increase in recall and F1-score when employing GAN as opposed to SMOTE. However, in this study, the implemented GAN did not improve recall but only enhanced the F1-score on Test A. The challenges in training the GAN may have resulted in the lower quality of generated fraudulent samples. Conversely, SMOTE’s random interpolation may not effectively capture the distinguishing characteristics of fraud instances. Therefore, combining SMOTE and GAN in a hybrid approach could result in the two complementing each other and better a representation of the fraudulent data. The proposed SMOTE+GAN demonstrated a slight improvement in recall on Test A compared with SMOTE. Additionally, the implemented SMOTified-GAN and the proposed GANified-SMOTE successfully improved the F1-score.

5. Conclusions

The present study introduces SMOTE+GAN and GANified-SMOTE techniques as innovative solutions to counteract class imbalance, thereby offering financial institutions an effective tool for reducing losses due to fraudulent activities. Additionally, the integration of FNN and CNN in predicting transaction categories is proposed. The effectiveness of the newly proposed data generation methods was assessed against existing techniques using an FNN, CNN, and FNN+CNN as classifiers. The outcomes highlight the potency of GANified-SMOTE, particularly when coupled with the proposed FNN+CNN classifier, in augmenting the F1-score for fraudulent data. This high F1-score indicates the method’s capacity to identify a substantial portion of fraudulent transactions with reduced misclassification of legitimate transactions. Notably, GANified-SMOTE and SMOTified-GAN consistently exhibit commendable performance across varying quantities of generated minority samples. Furthermore, the research underscores the significant impact of the classifier’s hyperparameter settings on classification performance, irrespective of the employed data generation methods.
In light of this experiment utilizing an online-acquired dataset, it is crucial to recognize that the study’s findings may not perfectly simulate real-world scenarios marked by ever-evolving fraudulent behaviors. Future endeavors should validate the efficacy of the proposed methods within actual financial institutions. Moreover, while the experiment employs a labeled dataset with presumed accurate class labels, real-world datasets often pose the challenge of being unlabeled and necessitating comprehensive preprocessing. To tackle class labeling issues, future investigations could explore the potential of unsupervised learning in data generation. Furthermore, to firmly establish the effectiveness of the proposed methods, this study acknowledges that comparisons with existing research were limited. Factors like classifier selection may have influenced observed improvements. Therefore, to enhance generalizability, future research should involve additional classifiers and ablation studies. These efforts would serve to validate the performance of the data generation methods in diverse scenarios.

Author Contributions

Conceptualization, P.C.Y.C. and B.G.L.; methodology, P.C.Y.C.; software, P.C.Y.C.; validation, P.C.Y.C. and Y.Y.; formal analysis, P.C.Y.C.; investigation, P.C.Y.C.; resources, P.C.Y.C. and B.G.L.; data curation, P.C.Y.C.; writing—original draft preparation, P.C.Y.C.; writing—review and editing, B.G.L.; visualization, P.C.Y.C.; supervision, B.G.L.; project administration, B.G.L.; funding acquisition, B.G.L. All authors have read and agreed to the published version of the manuscript.

Funding

This research was funded by Ningbo Science and Technology Bureau grant number 2021B-008-C.

Informed Consent Statement

Not applicable.

Data Availability Statement

The data presented in this study are openly available in Kaggle-Credit Card Fraud Detection, reference number Kaggle (2018).

Conflicts of Interest

The authors declare no conflict of interest.

Abbreviations

The following abbreviations are used in this manuscript:
CNNConvolutional Neural Network
FNNFeed-forward Neural Network
SMOTESynthetic Minority Oversampling TEchnique
GANGenerative Adversarial Network

References

  1. Abdoh, Sherif F., Mohamed Abo Rizka, and Fahima A. Maghraby. 2018. Cervical cancer diagnosis using random forest classifier with SMOTE and feature reduction techniques. IEEE Access 6: 59475–85. [Google Scholar] [CrossRef]
  2. Abraham, Bejoy, and Madhu S. Nair. 2018. Computer-aided diagnosis of clinically significant prostate cancer from MRI images using sparse autoencoder and random forest classifier. Biocybernetics and Biomedical Engineering 38: 733–44. [Google Scholar] [CrossRef]
  3. Alarfaj, Fawaz Khaled, Iqra Malik, Hikmat Ullah Khan, Naif Almusallam, Muhammad Ramzan, and Muzamil Ahmed. 2022. Credit card fraud detection using state-of-the-art machine learning and deep learning algorithms. IEEE Access 10: 39700–15. [Google Scholar] [CrossRef]
  4. Arafa, Ahmed, Nawal El-Fishawy, Mohammed Badawy, and Marwa Radad. 2022. RN-SMOTE: Reduced noise SMOTE based on DBSCAN for enhancing imbalanced data classification. Journal of King Saud University—Computer and Information Sciences 34: 5059–74. [Google Scholar] [CrossRef]
  5. Branco, Bernardo, Pedro Abreu, Ana Sofia Gomes, Mariana S. C. Almeida, João Tiago Ascensão, and Pedro Bizarro. 2020. Interleaved sequence RNNs for fraud detection. Paper presented at the 26th ACM SIGKDD International Conference on Knowledge Discovery & Data Mining, KDD ’20, New York, NY, USA, August 24–27; Melbourne: Association for Computing Machinery, pp. 3101–9. [Google Scholar] [CrossRef]
  6. Bunkhumpornpat, Chumphol, Krung Sinapiromsaran, and Chidchanok Lursinsap. 2009. Safe-Level-SMOTE: Safe-level-synthetic minority over-sampling technique for handling the class imbalanced problem. In Advances in Knowledge Discovery and Data Mining. Edited by Thanaruk Theeramunkong, Boonserm Kijsirikul, Nick Cercone and Tu-Bao Ho. Berlin and Heidelberg: Springer, pp. 475–82. [Google Scholar]
  7. Charitou, Charitos, Simo Dragicevic, and Artur d’Avila Garcez. 2021. Synthetic data generation for fraud detection using GANs. arXiv arXiv:2109.12546. [Google Scholar]
  8. Chawla, Nitesh V., Kevin W. Bowyer, Lawrence O. Hall, and W. Philip Kegelmeyer. 2002. SMOTE: Synthetic minority over-sampling technique. Journal of Artificial Intelligence Research 16: 321–57. [Google Scholar] [CrossRef]
  9. Chen, Joy, and Kong-Long Lai. 2021. Deep convolution neural network model for credit-card fraud detection and alert. Journal of Artificial Intelligence and Capsule Networks 3: 101–12. [Google Scholar] [CrossRef]
  10. Douzas, Georgios, and Fernando Bacao. 2018. Effective data generation for imbalanced learning using conditional generative adversarial networks. Expert Systems with Applications 91: 464–71. [Google Scholar] [CrossRef]
  11. Fang, Weiwei, Xin Li, Ping Zhou, Jingwen Yan, Dazhi Jiang, and Teng Zhou. 2021. Deep learning anti-fraud model for internet loan: Where we are going. IEEE Access 9: 9777–84. [Google Scholar] [CrossRef]
  12. Fernández, Alberto, Salvador Garcia, Francisco Herrera, and Nitesh V. Chawla. 2018. SMOTE for learning from imbalanced data: Progress and challenges, marking the 15-year anniversary. Journal of Artificial Intelligence Research 61: 863–905. [Google Scholar] [CrossRef]
  13. Fiore, Ugo, Alfredo De Santis, Francesca Perla, Paolo Zanetti, and Francesco Palmieri. 2019. Using generative adversarial networks for improving classification effectiveness in credit card fraud detection. Information Sciences 479: 448–55. [Google Scholar] [CrossRef]
  14. Goodfellow, Ian, Jean Pouget-Abadie, Mehdi Mirza, Bing Xu, David Warde-Farley, Sherjil Ozair, Aaron Courville, and Yoshua Bengio. 2014. Generative adversarial nets. Advances in Neural Information Processing Systems 27: 2672–80. [Google Scholar]
  15. Ileberi, Emmanuel, Yanxia Sun, and Zenghui Wang. 2021. Performance evaluation of machine learning methods for credit card fraud detection using SMOTE and AdaBoost. IEEE Access 9: 165286–94. [Google Scholar] [CrossRef]
  16. Ishaq, Abid, Saima Sadiq, Muhammad Umer, Saleem Ullah, Seyedali Mirjalili, Vaibhav Rupapara, and Michele Nappi. 2021. Improving the prediction of heart failure patients’ survival using SMOTE and effective data mining techniques. IEEE Access 9: 39707–16. [Google Scholar] [CrossRef]
  17. Johnson, Justin M., and Taghi M. Khoshgoftaar. 2019. Survey on deep learning with class imbalance. Journal of Big Data 6: 27. [Google Scholar] [CrossRef]
  18. Jurgovsky, Johannes, Michael Granitzer, Konstantin Ziegler, Sylvie Calabretto, Pierre-Edouard Portier, Liyun He-Guelton, and Olivier Caelen. 2018. Sequence classification for credit-card fraud detection. Expert Systems with Applications 100: 234–45. [Google Scholar] [CrossRef]
  19. Kaggle. 2018. Credit Card Fraud Detection. Available online: https://www.kaggle.com/datasets/mlg-ulb/creditcardfraud (accessed on 27 July 2023).
  20. Kim, Eunji, Jehyuk Lee, Hunsik Shin, Hoseong Yang, Sungzoon Cho, Seung kwan Nam, Youngmi Song, Jeong a Yoon, and Jong il Kim. 2019. Champion-challenger analysis for credit card fraud detection: Hybrid ensemble and deep learning. Expert Systems with Applications 128: 214–24. [Google Scholar] [CrossRef]
  21. Lan, Lan, Lei You, Zeyang Zhang, Zhiwei Fan, Weiling Zhao, Nianyin Zeng, Yidong Chen, and Xiaobo Zhou. 2020. Generative adversarial networks and its applications in biomedical informatics. Frontiers in Public Health 8: 164. [Google Scholar] [CrossRef]
  22. Mariani, Giovanni, Florian Scheidegger, Roxana Istrate, Costas Bekas, and Cristiano Malossi. 2018. BAGAN: Data augmentation with balancing GAN. arXiv arXiv:1803.09655. [Google Scholar] [CrossRef]
  23. Mirza, Shuja, Sonu Mittal, and Majid Zaman. 2018. Decision support predictive model for prognosis of diabetes using SMOTE and decision tree. International Journal of Applied Engineering Research 13: 9277–82. [Google Scholar]
  24. Mo, Zan, Yanrong Gai, and Guanlong Fan. 2019. Credit card fraud classification based on GAN-AdaBoost-DT imbalanced classification algorithm. Journal of Computer Applications 39: 618–22. [Google Scholar]
  25. Pradipta, Gede Angga, Retantyo Wardoyo, Aina Musdholifah, and I. Nyoman Hariyasa Sanjaya. 2021. Radius-SMOTE: A new oversampling technique of minority samples based on radius distance for learning from imbalanced data. IEEE Access 9: 74763–77. [Google Scholar] [CrossRef]
  26. Scott, Mitchell, and Jo Plested. 2019. GAN-SMOTE: A generative adversarial network approach to synthetic minority oversampling. Australian Journal of Intelligent Information Processing Systems 15: 29–35. [Google Scholar]
  27. Sharma, Anuraganand, Prabhat Kumar Singh, and Rohitash Chandra. 2022. SMOTified-GAN for class imbalanced pattern classification problems. IEEE Access 10: 30655–65. [Google Scholar] [CrossRef]
  28. Tahir, Muhammad, Fazlullah Khan, Mohammad Khalid Imam Rahmani, and Vinh Truong Hoang. 2020. Discrimination of golgi proteins through efficient exploitation of hybrid feature spaces coupled with SMOTE and ensemble of support vector machine. IEEE Access 8: 206028–38. [Google Scholar] [CrossRef]
  29. Xie, Yu, Guanjun Liu, Chungang Yan, Changjun Jiang, and MengChu Zhou. 2022. Time-aware attention-based gated network for credit card fraud detection by extracting transactional behaviors. IEEE Transactions on Computational Social Systems 10: 1004–16. [Google Scholar] [CrossRef]
  30. Yang, Hao, and Yun Zhou. 2021. IDA-GAN: A novel imbalanced data augmentation GAN. Paper presented at the 2020 25th International Conference on Pattern Recognition (ICPR), Milan, Italy, January 10–15; pp. 8299–305. [Google Scholar] [CrossRef]
  31. Ye, Huanzhuo, Lin Xiang, and Yanping Gan. 2019. Detecting financial statement fraud using random forest with SMOTE. IOP Conference Series: Materials Science and Engineering 612: 052051. [Google Scholar] [CrossRef]
  32. Zhang, Liyuan, Huamin Yang, and Zhengang Jiang. 2018. Imbalanced biomedical data classification using self-adaptive multilayer ELM combined with dynamic GAN. Biomedical Engineering Online 17: 181. [Google Scholar] [CrossRef] [PubMed]
  33. Zhang, Zhaohui, Xinxin Zhou, Xiaobo Zhang, Lizhi Wang, and Pengwei Wang. 2018. A model based on convolutional neural network for online transaction fraud detection. Security and Communication Networks 2018: 5680264. [Google Scholar] [CrossRef]
  34. Zhou, Tong, Jie Rong, Yang Liu, Weikang Gong, and Chunhua Li. 2022. An ensemble approach to predict binding hotspots in protein–RNA interactions based on SMOTE data balancing and random grouping feature selection strategies. Bioinformatics 38: 2452–58. [Google Scholar] [CrossRef] [PubMed]
  35. Zhu, Xiaoqian, Xiang Ao, Zidi Qin, Yanpeng Chang, Yang Liu, Qing He, and Jianping Li. 2021. Intelligent financial fraud detection practices in post-pandemic era. The Innovation 2: 100176. [Google Scholar] [CrossRef] [PubMed]
Figure 1. SMOTE employed in this study utilizing five nearest neighbors for random interpolations and generating minority samples.
Ijfs 11 00110 g001
Figure 2. GAN architecture employed in this study consisting of a 5-layer FNN generator and discriminator, leading to the generation of the final minority samples depicted by the blue square.
Ijfs 11 00110 g002
Figure 3. SMOTified-GAN architecture that employed SMOTE-generated samples as the input for the G, deviating from the traditional GAN approach that uses random noise. The final minority samples were produced and depicted in the blue square.
Ijfs 11 00110 g003
Figure 4. SMOTE+GAN architecture was employed to generate minority samples by directly incorporating SMOTE and GAN techniques. These generated samples were then merged with the original training dataset.
Ijfs 11 00110 g004
Figure 5. Proposed GANified-SMOTE architecture that involved the application of SMOTE to the GAN-generated samples, as indicated by the red dashed square.
Ijfs 11 00110 g005
Figure 6. Flowchart illustrating the two methods employed for FNN+CNN.
Ijfs 11 00110 g006
Table 1. Variations in the types and quantities of fraud data utilized for each data generation method.
Generation MethodTypes of Fraud DataTotal Fraud DataTotal Generated Fraud Data
Test ATest B
SMOTEReal394227,057788
GANReal394227,057788
SMOTified-GANReal394227,057788
SMOTE788
SMOTE+GANReal394SMOTE: 113,529SMOTE: 344
GAN: 113,529GAN: 344
GANified-SMOTEReal394227,057788
SMOTE394
Table 2. The hyperparameters of the two top performing models within FNN and CNN variations.
ModelLayersNeurons in Each LayerFiltersOptimizerLearning Rate
FNN16 DENSE30-200-100-50-10-1-SGD0.01
FNN26 DENSE30-200-100-50-10-1-SGD0.05
CNN11 CONV+1 POOL-64Adam0.01
CNN21 CONV+1 POOL-32Adam0.01
Table 3. The results of the two top-performing models within FNN and CNN variations are presented. The selection of the best model was based on comparing their recalls first, followed by their precision.
ModelTA 1TL 2TT 3PR 4RC 5F1 6RMSE 7
NF 8F 9NF 8F 9NF 8F 9
FNN10.99520.016927 m 00 s1.000.251.000.911.000.390.0692
FNN20.99610.013727 m 22 s1.000.291.000.901.000.440.0624
CNN10.99600.019613 m 00 s1.000.291.000.891.000.430.0634
CNN20.99810.012312 m 54 s1.000.471.000.851.000.600.0437
1 Training Accuracy, 2 Training Loss, 3 Training Time, 4 Precision, 5 Recall, 6 F1-score, 7 Root Mean Square Error, 8 Nonfraud, 9 Fraud.
Table 4. The outcomes of employing five methods to generate data on four models were evaluated on two distinct minority samples.
ModelGeneration MethodTest SamplesTA 1TL 2PR 3RC 4F1 5
FNN1SMOTEA0.99520.01690.250.910.39
B0.99940.00280.810.880.84
GANA0.99950.00360.840.880.86
B0.99940.00250.810.880.84
SMOTified-GANA0.99950.00240.850.870.86
B0.99950.00240.830.860.84
SMOTE+GANA0.99660.01190.320.900.48
B0.99950.00250.830.880.85
GANified-SMOTEA0.99940.00380.810.870.84
B0.99950.00250.820.880.85
FNN2SMOTEA0.99610.01370.290.900.44
B0.99950.00260.850.880.86
GANA0.99950.00340.830.880.85
B0.99940.00270.810.880.84
SMOTified-GANA0.99960.00230.870.880.87
B0.99950.00240.870.870.87
SMOTE+GANA0.99560.01410.270.910.41
B0.99950.00250.850.880.86
GANified-SMOTEA0.99960.00290.880.860.87
B0.99950.00220.870.870.87
CNN1SMOTEA0.99600.01960.290.890.43
B0.99950.00290.850.870.86
GANA0.99950.00420.850.870.86
B0.99950.00310.860.860.86
SMOTified-GANA0.99950.00280.900.830.86
B0.99940.00320.800.840.82
SMOTE+GANA0.99620.01400.290.860.44
B0.99960.00250.870.880.87
GANified-SMOTEA0.99950.00450.850.840.85
B0.99940.00340.790.860.82
CNN2SMOTEA0.99810.01230.470.850.60
B0.99950.00340.830.860.84
GANA0.99940.00400.820.870.84
B0.99950.00290.860.840.85
SMOTified-GANA0.99950.00260.890.830.86
B0.99940.00360.810.880.84
SMOTE+GANA0.99650.01810.320.900.47
B0.99960.00390.880.860.87
GANified-SMOTEA0.99950.00350.890.830.86
B0.99960.00230.910.830.87
1 Training Accuracy, 2 Training Loss, 3 Precision, 4 Recall, 5 F1-score. The top-performing PR, RC, and F1-score for both Test A and Test B are highlighted in bold, except for the RC in Test B, as identifying the best result posed a challenge due to high similarities.
Table 5. The integration of FNN2+CNN2 with Method I and II was evaluated using different data generation techniques on two minority samples, and the top-performing results for each measurement in tests A and B are highlighted in bold.
MethodGeneration MethodTest SamplesThresholdPR 1RC 2F1 3
ISMOTEA-0.690.840.76
B-0.880.860.87
GANA-0.880.870.87
B-0.860.840.85
SMOTified-GANA-0.900.830.86
B-0.880.870.87
SMOTE+GANA-0.560.900.69
B-0.890.860.88
GANified-SMOTEA-0.930.830.88
B-0.910.830.87
IISMOTEA1.10.510.860.64
B1.30.890.870.88
GANA1.50.880.870.87
B1.10.860.860.86
SMOTified-GANA1.10.880.860.87
B1.30.890.870.88
SMOTE+GANA1.40.570.900.70
B1.30.890.870.88
GANified-SMOTEA1.40.940.850.89
B1.30.910.860.88
1 Precision, 2 Recall, 3 F1-score.
Table 6. Comparison of results obtained by existing studies and the proposed methods. Test A is the result for including twice-generated fraud samples as much as the original fraud samples, whereas Test B is the result for 50:50 fraud and nonfraud distributions. The highest Precision, Recall, and F1-score are highlighted in bold.
Generation MethodTest SamplesClassifierPR aRC bF1 c
SMOTE (Sharma et al. 2022)AFNN0.800.690.71
SMOTEAFNN0.290.900.44
SMOTE (Fiore et al. 2019)BFNN0.970.690.81
SMOTEBFNN0.850.880.86
GAN (Sharma et al. 2022)AFNN0.840.800.81
GANAFNN0.830.880.85
GAN (Fiore et al. 2019)BFNN0.930.730.82
GANBFNN0.810.880.84
SMOTified-GAN (Sharma et al. 2022)AFNN0.850.800.81
SMOTified-GANAFNN0.870.880.87
SMOTified-GANBFNN0.870.870.87
SMOTE+GANAFNN0.270.910.41
SMOTE+GANBFNN0.850.880.86
SMOTE+GANAFNN+CNN (Method II)0.570.900.70
SMOTE+GANBFNN+CNN (Method II)0.890.870.88
GANified-SMOTEAFNN0.880.860.87
GANified-SMOTEBFNN0.870.870.87
GANified-SMOTEAFNN+CNN (Method II)0.940.850.89
GANified-SMOTEBFNN+CNN (Method II)0.910.860.88
a Precision, b Recall, c F1-score.
Disclaimer/Publisher’s Note: The statements, opinions and data contained in all publications are solely those of the individual author(s) and contributor(s) and not of MDPI and/or the editor(s). MDPI and/or the editor(s) disclaim responsibility for any injury to people or property resulting from any ideas, methods, instructions or products referred to in the content.

