1. Introduction
Real estate and housing problems are always significant issues for all people. Among the Vietnamese people, the desire to own real estate is high. A survey was conducted on more than 1000 Vietnamese people, who participate in online mass media and social networking platforms. The survey was conducted at the end of November 2021 and was published in February 2022, by PropertyGuru, a Vietnamese joint stock company. The results showed that up to 92% of the respondents plan to buy at least one property in the country in the future. In similar surveys that have been conducted in other Southeast Asian countries, such as Singapore, Thailand, Indonesia, and Malaysia, the results were 53%, 87%, 67%, and 80%, respectively. However, contrary to this desire, owning a house is not currently easy for Vietnamese people.
According to World Bank data, Vietnam’s per capita income in 2020 was USD 2650 a year, which places it in the low-/middle-income country grouping. Meanwhile, the house price index/income per capita in Vietnam is always among the highest, both regionally and worldwide. The
Table 1 below clearly reflects this by comparing the house price indexes of Vietnam to several countries in the same income group, as well as some other neighbouring countries.
This index is especially high in big cities, such as Ho Chi Minh and Hanoi. Specifically, statistics in
Figure 1 have shown us that Hanoi and Ho Chi Minh’s house price indexes in 2017 were 37.15 and 21.65, respectively, and in 2020, they were 19.24 and 24.63, respectively.
Regarding Hanoi, another source of data from Knight Frank in 2021, with reference to the prices of 10 high-class apartment projects, showed us that with USD one million, Vietnamese people could buy 137 square meters in Hanoi, which is like buying an apartment in the city of Dubai. Hanoi, Vietnam’s capital, is a political, economic, cultural, and social centre, with a large population density that ranks second in the country. Along with its development and urbanisation, the demand for housing is always high; therefore, it is important to pay close attention to the situation of the real estate market and to stabilise the price of this market. This, in turn, would stabilise people’s lives and promote healthy growth in the economy.
Moreover, the fact that real estate prices in Vietnam, in general, but particularly in Hanoi, are very high, makes the profitability of this market attractive to large corporations, companies, and businesses, but also to individuals and households. This was especially true in the context of the decrease in bank interest rates during the COVID-19 pandemic, when investors wanted to find another channel to invest in to increase their profits. Foreign investment enterprises, such as Dragon Capital and Vina Capital Foundation, were among the enterprises that invested in the Vietnamese real estate market during the period from 2019 to 2021. Thus, in the context of real estate supply, sources of investment capital and participants are abundant. According to the theory of supply and demand, when the supply increases, the price should decrease. In addition, in the context of a pandemic, when economic growth prospects generally slow down and people find it harder to find stable jobs, housing prices would generally be expected to fall steeply.
However, in contrast to this expectation, according to the Ministry of Construction’s report about the real estate market in the fourth quarter of 2021, the prices of residential housing and land plots continued to increase in 2021. For example, at the end of the first quarter and the beginning of the second quarter of 2021, there were times when the phenomenon of land fever was observed in some areas around Hanoi. As a result of this, prices increased. For example, prices increased in Quoc Oai by 20%; in Ba Vi by 45%; in Bac Ninh by 20%; and in Hung Yen by 26%. This has raised the question of whether there is a bubble in the Hanoi real estate market. Furthermore, based on the actual data, the report of the Vietnam Real Estate Brokers Association—the Real Estate Market Report—for the first quarter of 2022 also suggested the existence of local bubbles, which are created when house prices increase but liquidity does not increase commensurately.
The risk is that when real estate prices increase to abnormally high levels, this will lead to a large amount of people’s money flowing into this market in an uncontrollable manner. Moreover, the lack of knowledge, lack of factual basis, lack of research, profit-seeking, and crowd psychology show inefficiency and potential risks. According to the Vietnam Real Estate Association, real estate is an important part of the economy, which is closely linked to 40 other industries and accounts for 13.6% of the country’s GDP. Therefore, the above analysis raises the serious concern that, without early forecasting and without close and tight management of the real estate market by the regulatory authorities, it would only take a sign of negative volatility in this market to drag down the whole economy. For the above reasons, we realised the importance of studying the factors that have been affecting the formation of real estate prices in Hanoi. In Vietnam, there are several types of real estate, including residential real estate (e.g., apartments, townhouses, and single-family homes); commercial real estate (e.g., office buildings, shopping centres, and hotels); industrial real estate (e.g., factories and warehouses); agricultural real estate (e.g., farm land and orchards); mixed-use real estate (e.g., buildings that have a combination of residential, commercial, and industrial uses); and special-purpose real estate (e.g., schools, hospitals, and government buildings). Due to data collection limitations, our study team could not collect data on all the components that make up the whole real estate market of Hanoi; therefore, we focused on apartments, which represent an important and typical part of the Hanoi real estate market. The apartment segment represents the most important component of the Hanoi real estate market due to the high demand for them, their affordability, urbanisation, demographic shifts, lack of land, among other factors. The demand for apartments in Hanoi is high largely due to the city’s growing population and increasing urbanisation. Furthermore, compared to other major cities in Asia, apartments in Hanoi are relatively affordable, making them a popular option for those looking to buy their first home or to invest in real estate. As Hanoi continues to urbanise, the demand for apartments in the city is likely to increase, particularly with the increase in the number of young, urban professionals moving to Hanoi, who are seeking modern and convenient housing options. Moreover, due to the limited availability of land in Hanoi, the construction of high-rise buildings has become the norm, making the apartment segment the most important component of the real estate market.
Apartments in Hanoi have some typical characteristics. For example, most of them are built with modern amenities, such as elevators, parking lots, and high-speed internet, making them attractive to young, urban professionals. This market is also of great interest to investors because of the limited space available in the city, which means that many apartments are designed to be compact and efficient, making them suitable for smaller households or single individuals. Furthermore, many apartments in Hanoi are located in the city centre, meaning that they are close to shopping, dining, and entertainment options. Lastly, there are a wide variety of apartment options available in Hanoi, from budget-friendly studios to luxury penthouses, making it easy to find a property that fits investors’ needs and budgets.
The purpose of this study was to determine the factors that affected the prices of apartments in Hanoi in 2010–2021 and to analyse the influence of these factors. In addition, based on the research results, we hoped to establish whether there was an apartment price bubble in Hanoi in 2010–2021. Finally, in this paper, we also discuss our results and their implications, which can be the basis for regulators to build a developed, healthy, and transparent real estate market and for businesses, organisations, and individuals to participate in the real estate market. This will help them to make accurate investment decisions and to reduce the risks posed by this market.
In this study, because we collected secondary data on a quarterly basis, between 2010 and 2021, we applied the VAR vector autoregressive model to test the relationship among the gross domestic product (GRDP); the consumer price index (CPI); the real estate loan outstanding (DUNO); the foreign direct investment (FDI); the urbanisation rate (DOTHIHOA); the per capita income (BQDN); and the price index (PR), which is calculated by the apartment price/rent. After collection, the data were processed using the data processing software, Eviews 12. Thereby, the study examined the two-way relationships among the aforementioned variables in the formation of the apartment price bubble in Hanoi.
2. Literature Review
2.1. Real Estate Bubble Defining Approaches
Previous studies have shown that there are two popular common methods that are used to determine whether there is a real estate bubble in the market: the fundamental value approach and the fundamental factor approach.
The fundamental value approach derives from the definition of the difference between actual and theoretical house prices, which provides evidence of the existence of a real estate bubble in the market. Here, the theoretical house price (some studies have used the phrase “base house price”) is equal to the discounted sum of cash flows, resulting from the exploitation and use of the property. Specifically, according to
Caspi (
2016), the larger the difference between these two values, the clearer the presence of a real estate bubble in the market.
The assumptions of this method are as follows: (1) that the economic benefits derived from owning, exploiting, and using real estate are either from the rent or some value converted to rent; (2) that the rent is fixed over time; and (3) that the real estate is a long-term ownership property, meaning it has no resale value at any point in time. In the case of real estate being resold, the resale value is calculated at the underlying value of the property at that time. Because real estate is an investment asset, the discounted cash flow formula is used to determine the relationship between the price of the property and the income stream (
Muellbauer and Murphy 2008), specifically, the total cash flow. The discount is calculated as follows:
In the formula, the rent, R, is the known value. To calculate the r, we can rely on the analysis of the risk premium of the real estate rent or the estimate of the return rate of the property rent. Given the results of R and r, we can calculate the maximum value of Pt, which is . This is called the property’s basic value limit. Thus, combined with the actual observations in the market, we have the actual price, Preal. If Preal exceeds , it can be concluded that there is a bubble in the market and vice versa.
The basic factor approach was proposed by
Case and Shiller (
2003). According to
Mikhed and Zemčík (
2007), there is a strong relationship between real estate prices and economic factors, such as average income and real estate rental. This relationship is shown through the stationarity test on the real estate price-to-rent or the real estate price-to-household income indexes. According to their study, four cases exist:
Real estate prices and rents (or incomes) are both stationary series—in this case, property prices and rents (or incomes) are constant over time, which suggests that there is a real estate bubble.
Real estate prices are stationary series, but rents (or incomes) are non-stationary series—in this case, property prices do not change over time, while rents (or incomes) increase over time, indicating that the real prices of real estate are lower than their intrinsic value; therefore, no bubbles exist.
Real estate prices are a non-stationary series, while rents (or incomes) are a stationary series—in this case, the real estate value is greater than its fundamental value, indicating that a real estate bubble exists.
Real estate prices and rents (or incomes) are both non-stationary series—in this case, we need to further test the stationarity of the house price/rent (or house price/income) index. If the index is stationary, the market does not have a bubble, but if it is not, then there will be a bubble in the real estate market.
2.2. Literature Review on Real Estate Bubble Existence
Many empirical studies have been conducted to determine the existence of real estate bubbles, using methods, such as regression analysis, econometric models, and hedonic pricing models. These studies have attempted to identify the relationship between various economic and financial variables and real estate prices and to determine whether prices are being driven by fundamentals, or whether they are being artificially inflated by speculative behaviour.
Many studies have been conducted to confirm the existence of real estate bubbles in different countries.
Kim and Suh (
1993) showed the existence of real estate bubbles in South Korea and Japan by analysing the influence of speculation on the house price/rent index. However, studies in China have demonstrated different findings about the time and location of real estate bubbles and the extent of their existence and explosion (
Chen 2012;
Coleman iV et al. 2008; and
Liu et al. 2016). In these studies, many regions in the USA were proved to have bubble formations, such as the Northeast, Midwest, South, and West during 2005–2006 (
Zhou and Sornette 2006), and the whole USA (
Nneji et al. 2020).
Itamar Caspi (
2016) conducted research based on concerns about the bursting of the real estate bubble in Israel. These concerns were based on specific data from 2008 to 2013, which found the emergence of a housing bubble in this period.
Coskun and Jadevicius (
2017) conducted the first study to find a housing bubble in Turkey between January 2010 and December 2014 and between June 2007 and December 2014. However, they concluded that the Turkish housing market had only experienced some cases of overvalued properties and there was not a bubble formation.
However, in Vietnam, Le Thanh Ngoc (2014) used data series from 2004 to 2013, in Ho Chi Minh City and found a housing bubble during the study period. Research by Bui Ngoc Toan et al. (2018) and Phan Hoàng Long (2020), which was also based on the VAR model, confirmed the existence of a real estate bubble in the apartment segment of Ho Chi Minh City’s real estate market during their research period (2009–2017). Using the same method, the studies by Trần Lê (2020) on the Ho Chi Minh real estate market produced similar conclusions.
Meanwhile, Đào Hữu Hòa (2013) clarified the mechanism used for setting real estate prices. Through this, they confirmed the existence of a bubble in the real estate market in Vietnam. Trương Quang Hiển et al. (2018) quantified factors, such as location, shape of land, direction, and purpose of use, in the housing market of Bong Son, Hoai Nhon, and Binh Dinh to establish a house pricing model for each region in the area. The authors then compared the actual housing price data for the market as a basis for confirming the existence of a housing bubble. Using the same method, the study by Phạm Hữu Tỵ et al. (2015) on urban land prices in Ha Tinh and the study by Đào Ngọc Mai (2018) on the Thai Binh real estate market in the period 2015–2018 also confirmed the existence of real estate bubbles.
2.3. Literature Review on Factors Affecting Real Estate Bubbles
Academic studies on real estate bubbles generally focus on identifying the factors that contribute to the formation of bubbles and the conditions that lead to their eventual collapse. Some common factors that have been identified include low interest rates, easy access to credit, speculation, and presence of irrational exuberance or overconfidence in the market.
According to
Case and Shiller (
2003), for such a price increase to occur, there must be economic signals that increase people’s expectations about future real estate prices. In other words, for a real estate bubble to form and expand, there should be “bait” factors. Based on reality and related research studies on domestic and international real estate bubbles, Case and Shiller summarised the factors affecting real estate bubble formation, which we present in the
Table 2 below. In this table we also summarise the explanations given in the previous studies.
2.4. Research Gap
Though many studies have been conducted on the factors that affect real estate bubbles, there has been no research that has focused on Hanoi—a large and important real estate market within Vietnam—in a specific, up-to-date period. In addition, there are no studies that have analysed the influence of variables, such as the per capita income and urbanisation rate, on the formation of real estate bubbles.
Therefore, this article aimed to address the above research gap and to provide a reference for other studies related to real estate bubbles or the factors that affect these bubbles in the real estate market.
3. Methods
3.1. Analysis Framework
Based on the reality of real estate bubbles, both in Vietnam and internationally, and on the results of the aforementioned domestic and international studies, we used the vector autoregressive VAR model in this study. We also referred to the work of
Kivedal (
2012) to estimate and calculate the impact of independent variables on the formation and development of the apartment price bubble in Hanoi between the first quarter of 2010 and the fourth quarter of 2021.
The independent economic variables that we used, based on previous studies, included the following:
Gross domestic product (GRDP);
Consumer price index (CPI);
Real estate loan outstanding (DUNO);
Foreign direct investment in the real estate market (FDI);
Urbanisation rate (DOTHIHOA);
Per capita income (BQDN).
Among these variables, the two final ones (DOTHIHOA and BQDN) were not found in previous studies.
The dependent variable representing the apartment price bubble in the Hanoi real estate market is the PR variable.
Figure 2 shows the summary of variables.
3.2. Theoretical Model
Because of the limitations in the basic value approach, which is used when there has been a clear signal of real estate bubbles, but which may be misleading when bubble formation is unclear or low, in this study, we used the fundamental factor approach, namely the PR index (house price/rent). This was used to confirm the existence of a bubble and to consider the relationship between basic economic variables and the change in real estate prices in the apartment segment of Hanoi’s real estate market during the research period.
There are several characteristics of the apartments in Hanoi that can make the prices and rents vary in different locations. First, the apartment market in Hanoi is developing rapidly: new projects are being built and launched, and there is a significant variation in the quality of the properties, which range from old and outdated buildings to modern, high-rise apartment buildings. Second, the government in Hanoi has imposed strict regulations on the construction of high-rise buildings, including apartments, in order to preserve the city’s heritage and cultural identity. This is affecting the supply of apartments in certain areas and, thus, impacting on the prices. Third, in some areas of Hanoi, parking can be a challenge, particularly for those who own cars. This is a significant factor in people’s overall satisfaction with their homes. Finally, maintenance costs can add to the overall cost of living, making people think more carefully when paying to buy or rent an apartment.
The method of calculating the PR index in this study was as follows:
where the Apartment price is the average apartment price on a quarterly basis, and the Apartment rent is the average quarterly rent for an apartment.
The apartment segment of the real estate sector is currently divided into three classes, with different price levels. Circular 31/2016/TT-BXD has listed these three classes as Class A, B, and C, with the specific criteria for each specified in Clause 2, Article 3 and Article 6. To be consistent with the legal regulations and with the situation in the market, we calculated the weighted average price, based on the transaction proportion of each of the aforementioned apartment classes. In summary, the specific calculation method for the Apartment price and the Apartment rent in the PR formula is as follows:
where xm,t is the proportion of m-class apartments traded in the quarter; t is compared to the total number of apartments on the market;
Pm,t is the average price of the m-class apartments in the quarter;
ym,t is the proportion of m-class apartments that are rented in the quarter, compared to the total number of apartments on the market;
Rm,t is the average rent price for the m-class apartments in quarter t.
- −
Examining the relationship between the series property price (apartment price) and apartment rent (rent):
According to the assumption of the VAR model and the approach used in this study, apartment rent is the factor that provides the basic value for the apartment. In the case of a high PR index, based on the above formula, it proves that the apartment price exceeds its basic value. Furthermore, in the long run, apartment rents reflect an apartment’s value. According to
Kindleberger (
2015), if the PR is abnormally high, compared to its average value in the long run, this is evidence of a bubble in the market. Conversely, if there were no bubbles in the market, there would be a strong relationship between the prices and rents. To identify this relationship, we used the ADF test, which was developed by
Phillips et al. (
2013), to test the stationarity of the PR series, or we tested the co-integration between the two data series.
3.3. Econometric Model
Using the fundamental factor approach, we applied VAR regression to the time series data for the period between the first quarter of 2010 and the fourth quarter of 2021. This was in reference to the research of Le Thanh Ngoc (2014) and Phan Hoang Long (2020). The specific steps included the following:
- −
We used the ADF test through the unit test to test the stationarity of the variables included in the research model.
- −
We found the optimal lag (Lag) for the model, based on the AIC (Akaike information criterion); the LR (likelihood ratio); the FPE (final prediction error); the HQ (Hanan–Quinn information criterion); and the Schwarz (SC).
- −
We used the Granger causality test to determine the correlation between the economic variables in the model and the PR index.
- −
We presented the results of the research model through the push–response function and the variance decomposition to consider and evaluate the impact of the shock that resulted from the change in the PR index on itself and the other variables. This was according to the recursive Cholesky method of
Christopher Sims (
1980).
The application of the push–response function is to clarify the present and future effects of a shock to one variable on another variable. The magnitude of the shock is represented by the one-unit change in the variable’s standard deviation. To provide further detail on this, when a shock occurs that affects exogenous variables, the influence will be spread to endogenous variables through the structure of the autoregressive vector model, and unstructured residual estimates are simultaneously interrelated.
For this reason, it is necessary to avoid the spurious effects caused by the residuals’ correlation. This can be achieved by adding constraints to the research model so that the effects of the common random factors are shown for one of the model’s variables. As a result, the conduction effects will be suppressed, and the response functions in the model will be reasonably determined.
Meanwhile, the application of variance decomposition aims to cover the asymmetries of the autoregressive vector model and to determine the causal order between the variables, which needs to be established into the model.
In the scope of this study, the push–response function and the variance decomposition were applied in order to evaluate the impact of the change in the PR variable (caused by the shock) to both itself and to the other variables, including the GRDP, CPI, DUNO, FDI, DOTHIHOA, and BQDN.
Furthermore, according to the research results of
Christopher Sims (
1980), the relationship between the variables in the autoregressive vector model can also be a two-way causal effect. This means that, in some cases, variables happen to interact with each other. Thus, to evaluate the full interactions among the variables, it is not possible to have only one econometric equation; instead, there must be many equations. The variables in this study were the PR, CPI, GRDP, DUNO, FDI, DOTHIHOA, and BQDN. In summary, we applied the VAR to analyse the mutual influence of the variables listed above. Next, the econometric models were developed specifically as follows:
where
α,
β,
ρ,
δ,
γ,
ε, and
μ are the estimated coefficients, and
U is the random error.
3.4. Research Data
All the data series below were taken for the time period between the first quarter of 2010 and the fourth quarter of 2021.
In
Table 3 below, we describe how the variables were collected and calculated.
Two new variables were put into the model: urbanisation rate (DOTHIHOA) and per capita income (BQDN). Urbanisation refers to the process by which people move from rural to urban areas, typically in search of better economic opportunities, access to services, and improved quality of life. As cities grow, the demand for housing can increase, which leads to higher prices for properties. The relationship between urbanisation and house prices can vary across countries and regions, depending on the level of economic development, cultural factors, etc., which influence the demand for urban housing. The relationship between per capita income and house prices is generally positive, meaning that as per capita income increases, house prices also tend to rise. This is because when people have more disposable income, they are more likely to buy homes and bid up prices. A higher per capita income also tends to be associated with stronger economic growth, which can increase the demand for housing and put upward pressure on prices. The impact of these two factors on Hanoi’s apartment price bubble needs to be tested, because they are among the most important factors that cause changes in Hanoi’s real estate market. Though previous studies in this field have often taken interest rates as a factor that influences housing prices, we did not use them in our model because the CPI partially reflected the effect of interest rates on the prices of commodities in the basket, which, in turn, has an impact on the apartment price bubble. Furthermore, the relationship between interest rates and housing prices is not always straightforward. Other factors, such as economic growth, employment, local market conditions, government policies, and consumer confidence, can also have an impact on the demand for housing and, thus, influence housing prices. However, interest rates do have an indirect impact on the apartment price bubble, which can be considered and measured in future studies.
4. Results
4.1. Stationarity Test of the Data Series, Which Confirmed the Existence of a Real Estate Bubble
The test results in
Table 4 show that the seven series in the original sequence were not stationary at the 5% significance level, and their first-difference sequences were all stationary at the 5% significance level. Therefore, in the remainder of this analysis, the first difference series of the original variables will be used, and the corresponding variable symbols will be D(PR,1); D(DOTHIHOA,1); D(CPI,1); D(DUNO,1); D(FDI,1); D(BQDN,1); and D(GRDP,1). On this basis, we built the VAR model and the push–response function and performed the variance decomposition analysis.
The results presented in the above table also confirm that the apartment price and rent and the variable PR were both non-stationary series. On this basis, as analysed in
Section 2, we concluded that there was a bubble in the Hanoi apartment market in our research period.
4.2. Lag Selection for Model
In quantitative research using the VAR model, many studies have, in fact, applied different methods to identify the optimal lag for the model. In the scope of this study, we used the VAR Lag order selection criteria to identify the optimal lag. On this basis, the optimal lag for our research model to perform the VAR model estimation and the Granger causality test was identified as four.
4.3. Results of Econometric Models and Granger Causality Test
Because four was found to be the optimal lag for our model, we performed the Granger causality test using the assumptions of H0 for the results. This is presented in
Table 5 below.
From the table of results above, we concluded that that the variables D(CPI,1) and D(GRDP,1) had one-way effects on the PR, which is a typical variable for apartment price bubbles. Specifically, we found that the variable D(CPI,1) had a negative effect on the apartment price bubble, while, in the long run, the variable D(GRDP) had a positive influence on the bubble. The PR had a negative effect at a one-quarter lag but then later reversed and had a positive effect on the bubble. The other variables did not show statistical significance.
4.4. Result of Push–Response Function
4.4.1. DOTHIHOA’s Reaction to PR Shock
The urbanisation rate reacted strongly to the PR shock in our study, with a lag of approximately two periods. As we can see in
Figure 3, the cumulative response level gradually decreased and approached zero from the eighth period onwards.
4.4.2. DUNO’s Reaction to PR Shock
The real estate loan outstanding (DUNO) reacted strongly to the considerable impact of the PR shock as we can see in
Figure 4. The accumulation peaked in the sixth period and then started to decrease. This result was consistent with the fact that most of the outstanding loans for real estate in Vietnam existed when the real estate bubble was forming and expanding.
4.4.3. CPI and GRDP’s Reaction to PR Shock
The consumer price index and the gross regional domestic product (CPI and GRDP) had different responses to the PR shock at the early stage as we can see in
Figure 5. With the CPI, the lag was approximately two periods and lasted until the eighth period, and then it gradually moved to zero. This was consistent with the study of
Chen (
2012), in which they concluded that people have a choice to invest in any real estate to avoid currency devaluation. With the GRDP, the lag was approximately three periods. It lasted until the ninth period and then gradually decreased towards zero. In fact, the real estate bubble had the effect of stimulating economic growth in an unsustainable way by causing a large amount of capital to pour into the market, which encouraged the creation and building of new projects, which, in turn, pulled the other industries into this development.
Figure 6 shows that the per capita income and foreign direct investment reaction to the PR shock were as follows: Both factors had a delay of approximately three periods; however, their responses were completely different. The per capita income accumulated until the sixth period, and then it gradually decreased towards zero. However, the PR shock had relatively little impact on the FDI; its accumulation peaked in the eighth period and then gradually decreased towards zero.
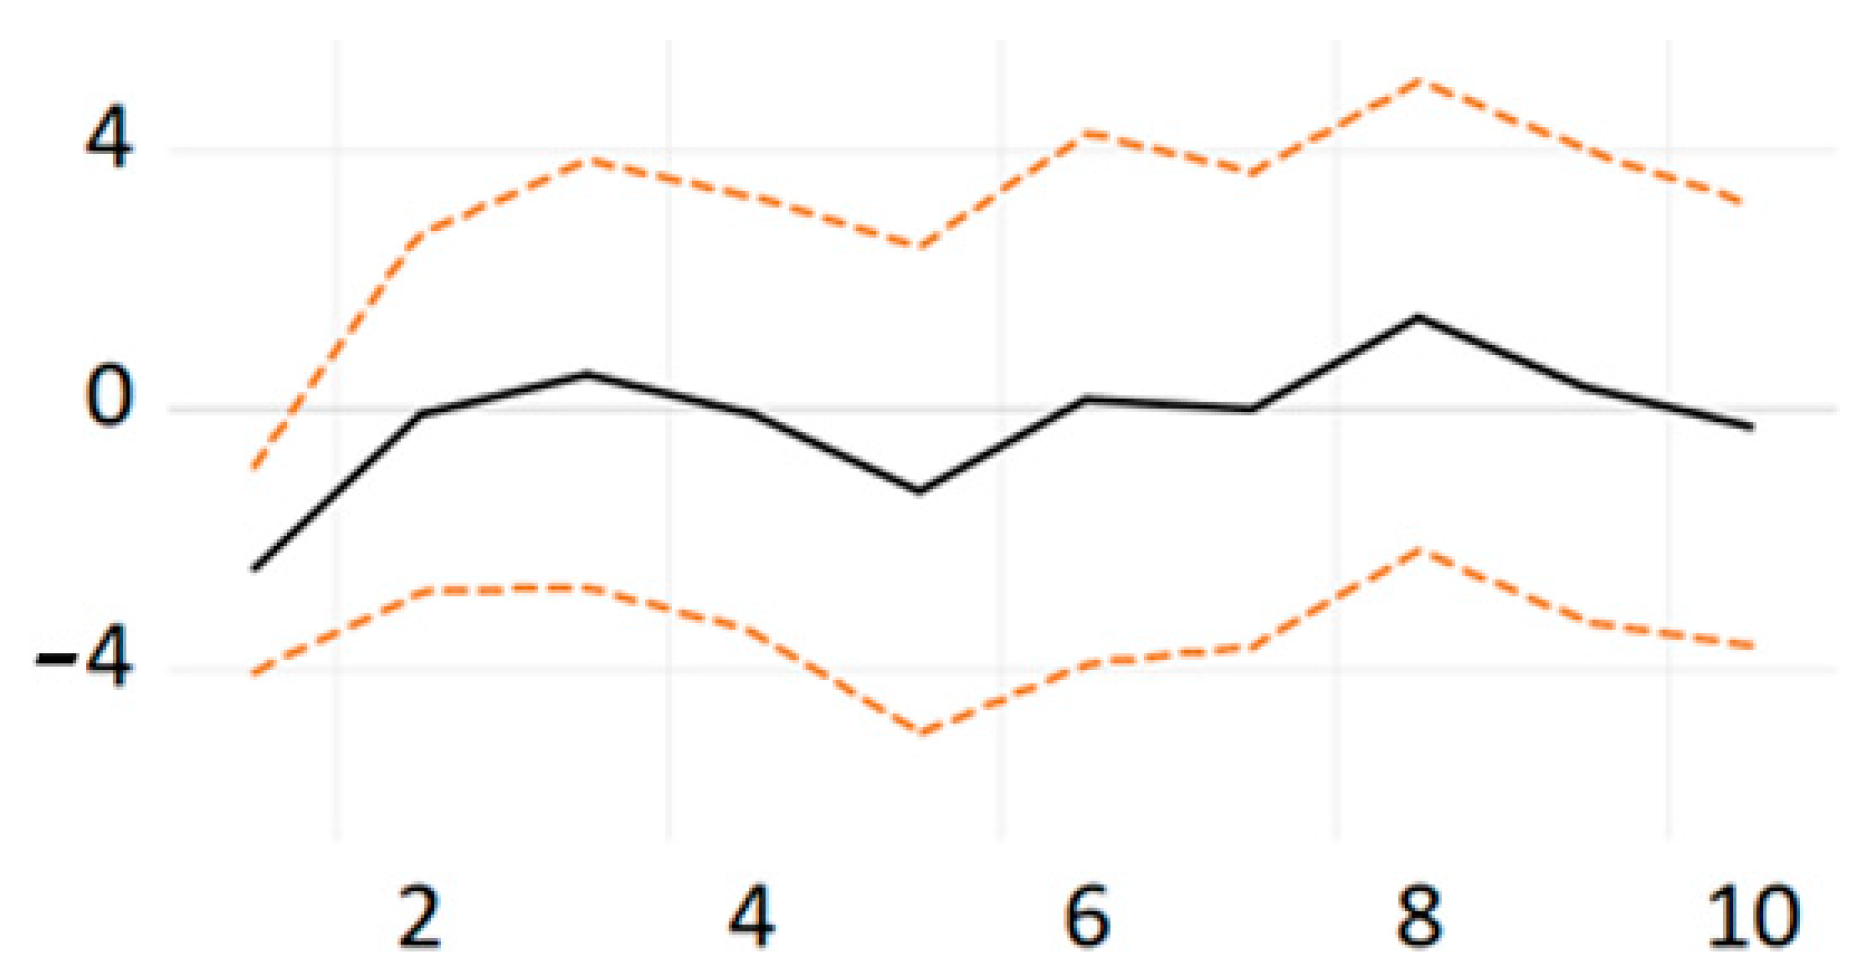
4.4.4. PR’s Reaction to PR Shock Itself
The real estate bubble was strongly affected by its own shock, with a lag of approximately two periods, as in
Figure 7. According to
Shiller (
2000), economic signs, such as high growth rate, low inflation, high employment rate, and loose monetary policy, in the previous period drives overoptimism in the real estate market’s price increases, which causes real estate prices to go up. However, this price increase also causes speculators to actively pump money into the real estate market, which creates a loop that causes the market to bubble (
Case and Shiller 2003).
4.5. Variance Decomposition Results
In essence, the analysis of variance showed us the significance of the different structural shocks through the effects of the endogenous variable changes. It derived from the effects of each structure at different levels of contribution, and it visually showed us the degree of mutual influence of the endogenous variables. An analysis of variance can describe the relative importance of shocks to the PR through the dependent variables. The method applied in this study to decompose the variance was
Sims’s (
1980) recursive Choleski method. The analysis results are shown in the
Table 6 below.
The results of the variance decomposition show that in the first period, 100% of Hanoi’s PR increase came from itself, which showed us that the PR changes were not related to the other variables in the model. In the long run, the improvement of the dependent variable, PRICE, depends on the effects of the other variables, such as the urbanisation rate (DOTHIHOA); the consumer price index (CPI); the foreign direct investment (FDI); the real estate loan outstanding (DUNO); the per capita income (BQDN); and the gross regional domestic product (GRDP). For example, in the fifth period, Hanoi’s PR itself contributed 63.60%; DOTHIHOA contributed 9.66%; CPI contributed 5.57%; DUNO contributed 1.95%; FDI contributed 7.72%; BQDN contributed 7.74%, and GRDP contributed 3.72%. In the 10th period, the contribution of each variable to the PR growth tended to be stable. The change in PR was 48.82% due to the PR, itself; 11.72% from DOTHIHOA; 13.66% from CPI; 2.35% from DUNO; 6.78% from FDI; 10.20% from BQDN; and 5.45% from GRDP. From the variance decomposition results above, we also concluded that these effects were long-term and not immediate.
The
Figure 8 below presents a better representation of the contribution of the variables.
5. Discussion
The PR index initially had a negative effect on the apartment price bubble, with a one-quarter lag; however, this impact was later reversed. This was consistent with the psychology of Hanoi’s people, in particular, and with the psychology of apartment investors, in general. When apartment prices increase, they tend to be sold to make profits. However, if the expectation that apartment prices will continue to increase in the coming periods is maintained, more and more investors will pour money into this market, hoping to profit from this investment in the future. Excessive expectations and uncontrolled investment form the premise for the formation of an apartment price bubble, as discussed in the previous sections.
When the GRDP increases, representing an expansion of the economy, a positive belief in a better future and better economic prospects is formed. On the other hand, this also leads to a capital surplus in the economy. Depending on different risk appetites, some individuals and households will plan to invest in real estate, thus, driving real estate prices to increase accordingly. Moreover, the supply of real estate has a low elasticity because the process of building or renovating an apartment or a house takes a long time. Therefore, in the short term, a rapid increase in demand can lead to a spike in real estate prices.
The statistical data showed that Hanoi’s GRDP growth during the study period was always positive, even in the difficult years, when it was heavily impacted by the COVID-19 pandemic (2020 and 2021). It is this sustainable growth that has increased personal income, as well as people’s expectation of economic development, in general, and of the real estate industry, in particular. This maintained a positive level, which contributed to the increase in apartment prices in Hanoi during the study period.
The consumer price index (CPI) had a negative effect on the apartment price bubble. This result was like the results obtained by
Amonhaemanon and Annaert (
2013) and
Wadud et al. (
2012). When inflation is too high, it first shows in an increase in the prices of essential consumer goods in the market, which is especially bad when personal income levels do not increase accordingly. This will lead to a decrease in financial accumulation among the population. Economic difficulties and rising prices force people to tighten spending. This limits the flow of money into the real estate market because people need to carefully consider their financial resources for anything that does not fulfil an essential need. Thus, high inflation not only affects people’s lives, but also influences the real estate market. Thus, high inflation acts against the formation and development of apartment price bubbles.
The outstanding loans for real estate (DUNO) reacted strongly to the shock from the PR. It peaked at period six and decreased gradually, according to the results of the push–response function. This result was consistent with the fact that most of the outstanding real estate loans in Vietnam were from the period in which the apartment price bubble was forming and expanding. According to the results of the analysis of variance decomposition, the variable DUNO contributed up to 3.12% to the increase in real estate prices. In fact, the government and the state bank are becoming increasingly concerned about the credit capital that is being poured into the real estate market; thus, they are strictly controlling this capital flow. Of course, they always have policies to adjust interest rates appropriately to avoid the risks that may arise and to not let interest rates fluctuate and affect the market. Such policies include raising the risk factor for real estate loans (from 150% to 200% for enterprises and from 50% to 150% for house-buying borrowers) and limiting loans for high-standard real estate. These policies help them to control interest rates and bank credit for real estate purchases, which helps them to prevent bubbles from forming.
Foreign direct investment (FDI) explains approximately 6.7–9.4% of the increase in apartment prices, according to the decomposition of variance. The data from the Hanoi Statistics Department indicate that FDIs in real estate are mainly medium- and long-term capital sources. During the COVID-19 pandemic in 2020, capital inflows into real estate still accounted for 31% of the overall FDI investments in Hanoi, which led to an increase in the supply of real estate in Hanoi. This, in turn, contributed to the stabilisation of the demand–supply of the real estate market in Hanoi. In addition, recently, the Vietnamese government implemented solutions to control and optimise FDI inflows, especially FDIs in the real estate sector. Such solutions include the following: enhancing construction supervision, commitment to construction progress, inspection and quality control of works, and control of capital mobilisation and taxes. This can explain the difference between this study’s findings and those of Le Thanh Ngoc (2014) and Phan Hoang Long (2020), who highlighted the impact of FDI on the real estate bubble in Ho Chi Minh City in the previous period, especially in the years 2006–2008. These were the early years of Vietnam’s WTO membership, when FDI inflows poured into the market and managers did not have much experience in facing such a sharp increase in FDI inflows.
The urbanisation rate explained approximately 0.54–11.7% of the increase in apartment prices, according to the results of the decomposition of variance. Hanoi is one of the two cities with the highest urbanisation rates in Vietnam. The statistical data of the Hanoi Statistics Department show that Hanoi’s urbanisation rate was approximately 40% in 2010. This is expected to reach 68% by 2030 and approximately 70–80% by 2050. Through the results of our model, we can confirm that the increase in the urbanisation rate of Hanoi has led to an increase in the demand for houses and apartments. This demand was driven by people who were in the process of onboarding at their new workplaces. This demand, in turn, led to an increase in apartment prices during our study period. However, this followed the normal law of supply and demand in the market; therefore, during our research period, the urbanisation rate did not have an impact on the formation and development of the apartment price bubble.
The per capita income explained approximately 7.4–12.3% of the increase in apartment prices, according to the results of the decomposition of variance. According to data from the Hanoi Statistics Department, the per capita income in 2010 was VND 37 million (equivalent to USD 1950). In 2021, this increased by 1.8 times, to nearly VND 70 million. This increased per capita income created a new amount of idle capital, part of which was spent on real estate. This contributed partly to the increase in the price of apartments in Hanoi during the study period. However, when the apartment price bubble was formed, the rate of the increase in apartment prices may have decoupled from the fundamentals that make up its underlying price. In the specific case of this study, the growth rate in the apartment prices exceeded the growth rate of personal income in Hanoi. This reinforces our assertion that an apartment price bubble appeared in Hanoi’s real estate market during our research period.
Based on our research results and on the discussion above, we will provide some recommendations for the government.
The PR variable that characterises real estate bubbles is strongly influenced by its own value in the past. Therefore, to prevent real estate bubbles, it is first necessary to build a healthy and stable business market in the present. In order to increase the transparency of the real estate market, it is necessary to publicise the information on transactions, situation, and status and movements of the market. To build this publicity, it is necessary to promote the digitisation of market information, project licensing, and listing of real estate sale prices by area. This way, people will understand the necessity of learning about products and projects before deciding to trade, thus decreasing the likelihood of being scammed. In addition, management agencies need to publicise information on the planning and implementation progress of their infrastructure development projects and real estate projects—especially large projects and regional projects in the locality—to make information transparent and to prevent spreading rumours and speculation from pushing prices up for illegal profiteering.
Second, it is necessary to pay attention to the issue of controlling inflation. The CPI is a way of thinking about price stability and is the basis for determining whether the economy is stable or not. If inflation keeps increasing and decreasing price stability, it will negatively affect both the real estate market and the economy. The authorities need to closely monitor market price movements and regional and international inflation in order to promptly and fully warn the public about the risks affecting prices and inflation in Vietnam, in general, and in Hanoi, in particular. Next, it is necessary to conduct research to assess the supply and demand of commodities and materials in the short and long term to adopt appropriate policies. In the context of the ‘new normal’ and, most recently, of the instability of international politics affecting the fuel market, it is necessary to study and promote the use of domestic raw materials to gradually replace imported sources. Moreover, it is necessary to choose the right time, the right industry, and the right commodity to adjust the price, especially in the current climate, when inflation pressure is high. Monetary policy tools also need to be coordinated flexibly and systematically in order to minimise the amount of money going to the market, to manage and tighten lending for real estate investment, and to adhere to the goals and inflation plan that have been set forth.
Third, it is necessary to pay attention to the issue of controlling the development of the economy. Like inflation, an overheated economy also has many potential risks. When the economy overheats, there is a risk of falling into a recession when it starts to cool. This risk is particularly prevalent if there are external shocks and the government, and the state bank have not taken proper preventive measures to reduce the cool-down of the economy before returning it to a state of equilibrium and steady development. An overheated market is also a favourable environment for real estate bubbles, as asset bubbles can form and develop.
6. Conclusions
In this study, we aimed to determine the factors that affected the prices of apartments in Hanoi between 2010 and 2021. We also analysed the influence of these factors and determined whether there was an apartment price bubble in Hanoi during this period. Furthermore, in this paper, we discuss our results and their implications, which can be used as the basis for regulators to build a developed, healthy, and transparent real estate market.
This study confirmed the existence of a bubble in Hanoi’s apartment market between 2010 and 2021. We also examined the factors that affected the formation of the bubble and established the influencing level of each factor.
This study was conducted as a mixed-methods study. For the qualitative method, we used data from domestic and international reports, statistics, articles, and studies to analyse the factors that affected the bubbles that occurred in the past, such as gross domestic product, CPI, real estate loans, FDI, urbanisation rate, and per capita income. For the quantitative method, we used a quarterly series of data from between the first quarter of 2010 and the fourth quarter of 2021 to conduct our data processing and multivariable regression analysis.
The research results show the existence of an apartment price bubble during our research period in Hanoi. From the model results, the variables DUNO, FDI, and GRDP only partially explained the increase in the apartment prices (maximum 9% for FDI). The variables DOTHIHOA, CPI, and BQDN explained up to 12%, 14%, and 12%, respectively, of the increase in the apartment prices during the peak period. In addition, from the results of the VAR model, we found that during our research period, the CPI and GRDP variables had a one-way causal effect on the PR variable. Specifically, the CPI had the opposite effect, and the GRDP had a positive effect in the long term. The past apartment price index had a considerable positive impact on itself in the long run. The remaining variables (FDI, DOTHIHOA, and BQDN) were not statistically significant.
7. Limitations of the Study and Direction for Further Research
In the scope of this study, the independent variables were not comprehensive enough, and, therefore, we were unable to account for their impact in the real estate bubble.
Moreover, the PR variable that characterises the existence of a bubble is significantly dependent on its own past variability. With the series of data that we collected and compiled, we could not completely explain the above phenomenon.
The study also only focused on the data related to apartments because it was not possible to collect data for all the components that make up Hanoi’s real estate; therefore, we were unable to fully explain the causes of Hanoi’s real estate bubble.
In addition, the study only focused on the real estate market in Hanoi, yet there are many areas where the PR index is high; therefore, there is a need for research in these areas to allow us to detect the signs of bubbles, which is necessary to enable managers to take early, synchronous, and effective preventative measures.
For the above reason, more in-depth studies need to be conducted, which utilise more variable data series and more variables that can survey the behaviour of the individuals, organisations, and businesses involved in the real estate market. Through such research, the representativeness and generalisability of the model will be improved.


